third quarter 2015 conference call
TRANSCRIPT

TSX, NYSE MKT: LSG
Lake Shore Gold TSX: LSG
NYSE MKT: LSG
1
L A K E S H O R E G O L D C O R P.
Nine Month and Third Quarter 2015
Conference Call & Webcast
October 29, 2015

2
Information included in this presentation relating to the Company's expected production levels, production growth, costs, cash flows, economic returns, exploration
activities, potential for increasing resources, project expenditures and business plans are "forward-looking statements" or "forward-looking information" within the meaning
of certain securities laws, including under the provisions of Canadian provincial securities laws and under the United States Private Securities Litigation Reform Act of
1995 and are referred to herein as "forward-looking statements." The Company does not intend, and does not assume any obligation, to update these forward-looking
statements. These forward-looking statements represent management's best judgment based on current facts and assumptions that management considers reasonable,
including that operating and capital plans will not be disrupted by issues such as mechanical failure, unavailability of parts, labour disturbances, interruption in
transportation or utilities, or adverse weather conditions, that there are no material unanticipated variations in budgeted costs, that contractors will complete projects
according to schedule, and that actual mineralization on properties will be consistent with models and will not be less than identified mineral reserves. The Company
makes no representation that reasonable business people in possession of the same information would reach the same conclusions. Forward-looking statements involve
known and unknown risks, uncertainties and other factors which may cause the actual results, performance or achievements of the Company to be materially different
from any future results, performance or achievements expressed or implied by the forward-looking statements. In particular, delays in development or mining and
fluctuations in the price of gold or in currency markets could prevent the Company from achieving its targets. Readers should not place undue reliance on forward-looking
statements. More information about risks and uncertainties affecting the Company and its business is available in the Company's most recent Annual Information Form
and other regulatory filings with the Canadian Securities Administrators, which are posted on sedar at www.sedar.com, or the Company’s most recent Annual Report on
Form 40-F and other regulatory filings with the Securities and Exchange Commission.
QUALITY CONTROL
Lake Shore Gold has a quality control program to ensure best practices in the sampling and analysis of drill core. A total of three Quality Control samples consisting of 1
blank, 1 certified standard and 1 reject duplicate are inserted into groups of 20 drill core samples. The blanks and the certified standards are checked to be within
acceptable limits prior to being accepted into the GEMS SQL database. Routine assays have been completed using a standard fire assay with a 30-gram aliquot. For
samples that return a value greater than three grams per tonne gold on exploration projects and greater than 10 gpt at the Timmins mine and Thunder Creek underground
project, the remaining pulp is taken and fire assayed with a gravimetric finish. Select zones with visible gold are typically tested by pulp metallic analysis on some projects.
NQ size drill core is saw cut and half the drill core is sampled in standard intervals. The remaining half of the core is stored in a secure location. The drill core is
transported in security-sealed bags for preparation at ALS Chemex Prep Lab located in Timmins, Ontario, and the pulps shipped to ALS Chemex Assay Laboratory in
Vancouver, B.C. ALS Chemex is an ISO 9001-2000 registered laboratory preparing for ISO 17025 certification.
QUALIFIED PERSON
Scientific and technical information related to mine production and reserves contained in this presentation has been reviewed and approved by Natasha Vaz, P.Eng., Vice-
President, Technical Services, who is an employee of Lake Shore Gold Corp., and a “qualified person” as defined by National Instrument 43-101 – Standards of
Disclosure for Mineral Projects (“NI 43-101”).
Scientific and technical information related to resources, drilling and all matters involving mine production geology, as well as exploration drilling, contained in this
presentation, or source material for this presentation, was reviewed and approved by Eric Kallio, P.Geo., Senior Vice-President, Exploration. Mr. Kallio is an employee of
Lake Shore Gold Corp., and is a “qualified person” as defined by NI 43-101.
Forward-Looking Statements

3
Gold production 136,200 oz
Gold sales 141,300 oz
Cash operating costs(1) US$567/oz
Total production costs of $101.2M
AISC(1) US$845/oz
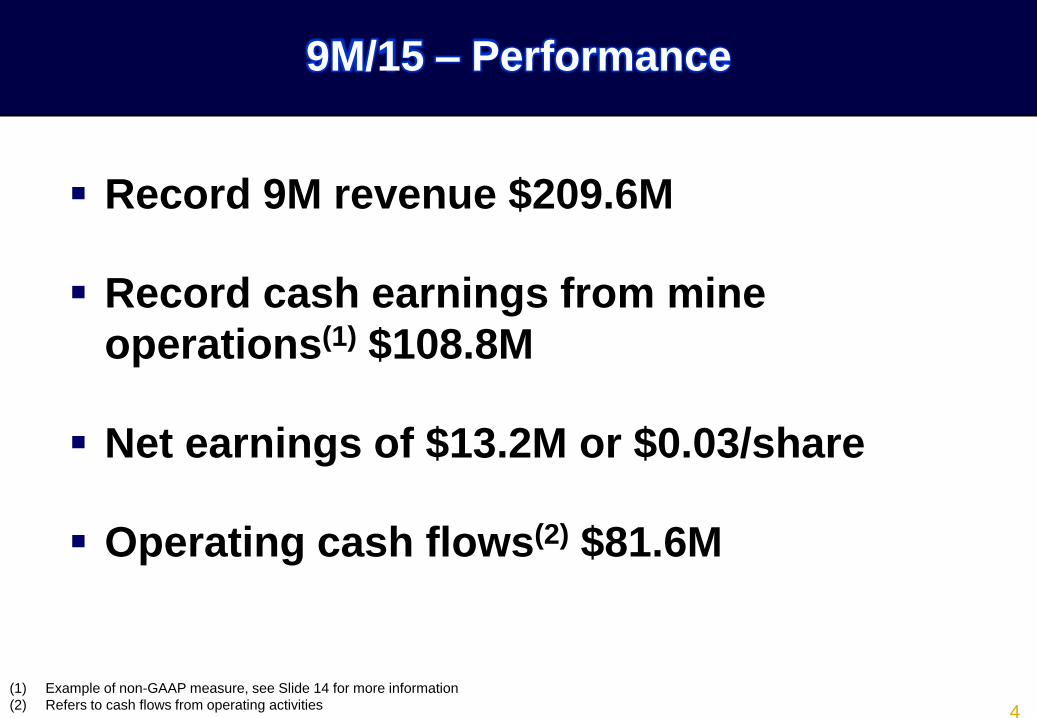
9M/15 – Performance
(1) Example of non-GAAP measure, see Slide 14 for more information
4
(1) Example of non-GAAP measure, see Slide 14 for more information
(2) Refers to cash flows from operating activities
Record 9M revenue $209.6M
Record cash earnings from mine
operations(1) $108.8M
Net earnings of $13.2M or $0.03/share
Operating cash flows(2) $81.6M
9M/15 – Performance

5
Gold production 40,600 oz
Gold sales 42,800 oz
Cash operating costs US$604/oz
Total production costs of $33.9M
AISC US$924/oz
Q3/15 – Performance

6
Revenue $63.0M
Cash earnings from mine operations
$29.2M
Net loss of $0.6M or $0.00/share
Operating cash flows $19.3M
Q3/15 – Performance
7
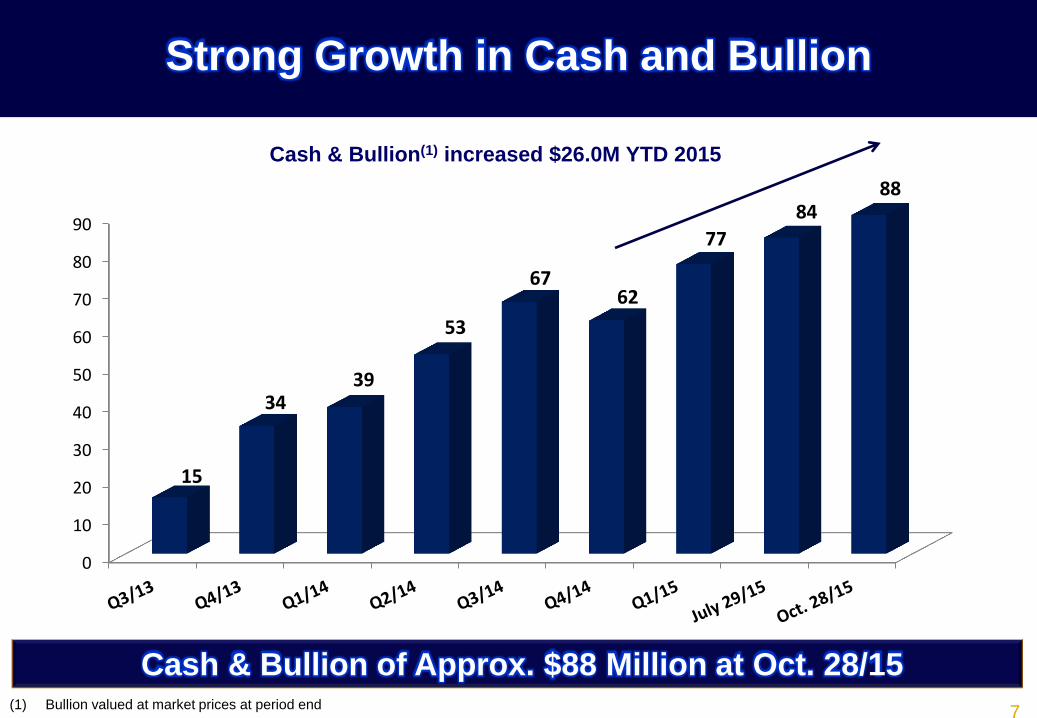
Strong Growth in Cash and Bullion
Cash & Bullion of Approx. $88 Million at Oct. 28/15
Cash & Bullion(1) increased $26.0M YTD 2015
(1) Bullion valued at market prices at period end
0
10
20
30
40
50
60
70
80
90
15
34 39
53
67 62
77
84 88

8
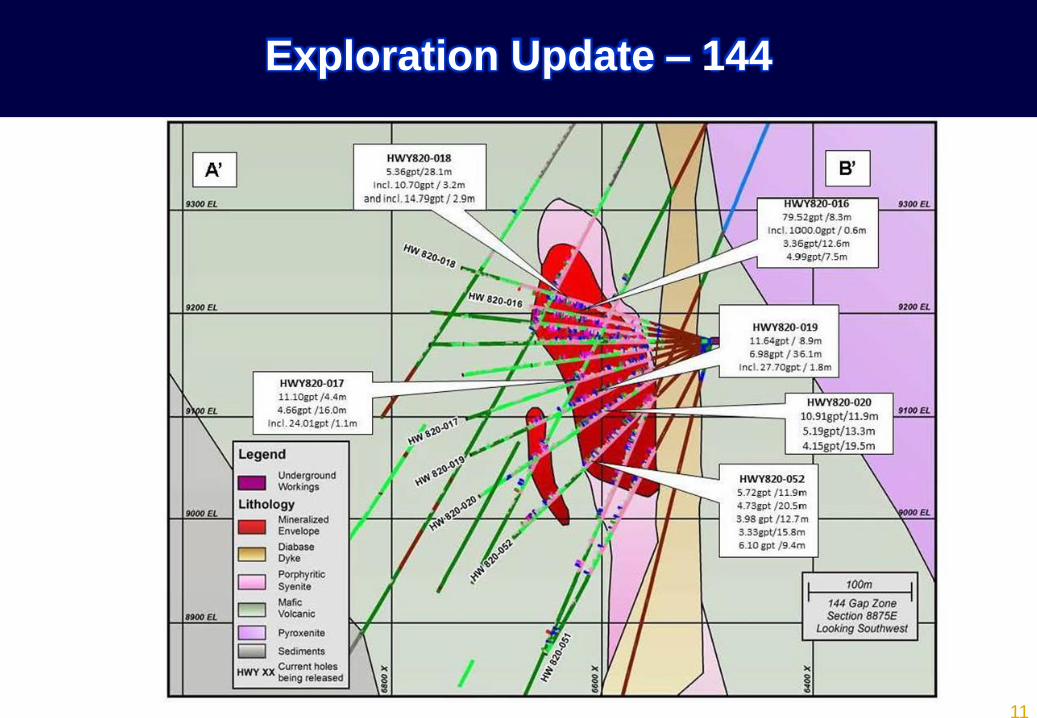
Exploration Update – 144

9
Exploration Update – 144

10
Exploration Update – 144
11
Exploration Update – 144

12
Exploration Update – 144

13
On Track to Achieve 2015 Production & Unit Cost
Guidance
2015 Targets 2015 9M/15 Q3/15
Targets Actual Actual
Ounces produced (in thousands) 180.0 136.2 40.6
Cash operating costs (US$/oz) <650 567 604
All-in sustaining costs (US$/oz) <950 845 924
Total production costs ($ millions) 130.0 – 135.0 101.2 33.9
First resource at 144 Gap Zone in Q1/16
Update market on Whitney (Temex acquisition)

14
Cash Operating Costs and Cash Operating Costs Per Ounce
Cash operating costs are disclosed on a per ounce sold basis. Cash operating costs and cash operating cost per ounce sold are Non-GAAP measures. In the gold mining
industry, cash operating costs and cash operating costs per ounce are common performance measures but do not have any standardized meaning. Cash operating costs
are derived from amounts included in the Consolidated Statements of Comprehensive Income (Loss) and include mine site operating costs such as mining, processing
and administration as well as royalty expenses, but exclude depreciation, depletion and share-based payment expenses and reclamation costs. Cash operating costs per
ounce are based on ounces sold and are calculated by dividing cash operating costs by commercial gold ounces sold; US$ cash operating costs per ounce sold are
derived from the cash operating costs per ounce sold translated using the average Bank of Canada C$/US$ exchange rate for the period. The Company discloses cash
operating costs and cash operating costs per ounce as it believes the measures provide valuable assistance to investors and analysts in evaluating the Company’s
operational performance and ability to generate cash flow. The most directly comparable measure prepared in accordance with GAAP is total production costs. A
reconciliation of cash operating costs and cash operating cost per ounce to total production costs for the three and nine months ended September 30, 2015 and 2014 is
set out on page 20 of the Company’s MD&A filed on SEDAR at www.sedar.com and at www.lsgold.com.
All-in Sustaining Costs and All-In Sustaining Costs Per Ounce
All-in sustaining costs are disclosed on a per ounce sold basis. All-in sustaining costs and all-in sustaining cost per ounce sold are Non-GAAP measures. These
measures are intended to assist readers in evaluating the total costs of producing gold from current operations. While there are no standardized meanings across the
industry for these measures, the Company’s definitions conform to the all-in sustaining costs definition as set out by the World Gold Council in its guidance note dated
June 27, 2013. The Company defines all-in sustaining costs as the sum of production costs, sustaining capital (capital required to maintain current operations at existing
levels), corporate general and administrative expenses, in-mine exploration expenses and reclamation cost accretion related to current operations. All-in sustaining costs
exclude growth capital, growth exploration expenditures, reclamation cost accretion not related to current operations, interest expense, debt repayment and taxes. The
costs included in the calculation of all-in sustaining costs are divided by commercial gold ounces sold to obtain the all-in sustaining cost per ounce; US$ all-in sustaining
cost per ounce sold is translated using the average Bank of Canada C$/US$ exchange rate for the period. The most directly comparable measure prepared in
accordance with GAAP is total production costs. A reconciliation of all-in sustaining cost to amounts included in the Consolidated Statements of Comprehensive Loss
(Income) for the three and nine months ended September 30, 2015 and 2014 is set out on page 21 of the Company’s MD&A filed on SEDAR at www.sedar.com and at
www.lsgold.com.
Cash Earnings from Mine Operations
Cash earnings from mine operations is a Non-GAAP measure and does not have any standardized meaning. The Company discloses cash earnings from mine
operations as it believes this measure provides valuable assistance to investors and analysts in evaluating the Company’s ability to finance its ongoing business and
capital activities. The most directly comparable measure prepared in accordance with GAAP is earnings from mine operations. Cash earnings from mine operations
represent the earnings from mine operations prior to deducting non-cash expenses, and is calculated by adding depletion, depreciation and share based payments in
production costs to earnings from mine operations. A reconciliation of cash earnings from mine operations to earnings from mine operations for the three and nine months
ended September 30, 2015 and 2014 is set out beginning on page 20 of the Company’s MD&A filed on SEDAR at www.sedar.com and at www.lsgold.com.
(1) The Company’s MDA”s for the first nine months and third quarter of 2015 and 2014 are posted at www.sedar.com and on the Company’s website at www.lsgold.com.
Non-GAAP Measures(1)