third quarter 2018 - biogen
TRANSCRIPT

1
Third Quarter 2018Financial Results and Business Update
October 23, 2018
2
Forward-Looking StatementsThis presentation contains forward-looking statements, including statements relating to: our strategy and plans; potential of our commercial business and pipeline programs;capital allocation and investment strategy; clinical trials and data readouts and presentations; regulatory filings and the timing thereof; risks and uncertainties associated with drugdevelopment and commercialization; anticipated benefits and potential of investments, collaborations, and business development activities; the anticipated timing to completecertain transactions; and our future financial and operating results. These forward-looking statements may be accompanied by such words as “aim,” “anticipate,” “believe,”“could,” “estimate,” “expect,” “forecast,” “goal,” “intend,” “may,” “plan,” “potential,” “possible,” “will,” and other words and terms of similar meaning. Drug development andcommercialization involve a high degree of risk, and only a small number of research and development programs result in commercialization of a product. Results in early stageclinical trials may not be indicative of full results or results from later stage or larger scale clinical trials and do not ensure regulatory approval. You should not place unduereliance on these statements or the scientific data presented.
These statements involve risks and uncertainties that could cause actual results to differ materially from those reflected in such statements, including: our dependence onrevenues from our principal products; failure to compete effectively due to significant product competition in the markets for our products; difficulties in obtaining and maintainingadequate coverage, pricing and reimbursement for our products; the occurrence of adverse safety events, restrictions on use with our products, or product liability claims; failureto protect and enforce our data, intellectual property and other proprietary rights, and the risks and uncertainties relating to intellectual property claims and challenges; uncertaintyof long-term success in developing, licensing, or acquiring other product candidates or additional indications for existing products; the risk that positive results in a clinical trial maynot be replicated in subsequent or confirmatory trials or success in early stage clinical trials may not be predictive of results in later stage or large scale clinical trials or trials inother potential indications; risks associated with clinical trials, including our ability to adequately manage clinical activities, unexpected concerns that may arise from additionaldata or analysis obtained during clinical trials, regulatory authorities may require additional information or further studies, or may fail to approve or may delay approval of our drugcandidates; risks associated with current and potential future healthcare reforms; problems with our manufacturing processes; risks relating to technology failures or breaches;our dependence on collaborators and other third parties for the development, regulatory approval, and commercialization of products and other aspects of our business, whichare outside of our full control; failure to successfully execute on our growth initiatives; risks relating to management and key personnel changes, including attracting and retainingkey personnel; risks relating to investment in and expansion of manufacturing capacity for future clinical and commercial requirements; failure to comply with legal and regulatoryrequirements; fluctuations in our effective tax rate; the risks of doing business internationally, including currency exchange rate fluctuations; risks related to commercialization ofbiosimilars; risks related to investment in properties; the market, interest, and credit risks associated with our portfolio of marketable securities; risks relating to stock repurchases;risks relating to access to capital and credit markets; risks related to indebtedness; environmental risks; risks relating to the sale and distribution by third parties of counterfeitversions of our products; risks relating to the use of social media for our business; change in control provisions in certain of our collaboration agreements; risks relating to thespin-off of our hemophilia business, including risks of operational difficulties and exposure to claims and liabilities; and the other risks and uncertainties that are described in theRisk Factors section of our most recent annual or quarterly report and in other reports we have filed with the Securities and Exchange Commission.
These statements are based on our current beliefs and expectations and speak only as of the date of this presentation. We do not undertake any obligation to publicly update anyforward-looking statements.
Note regarding trademarks: AVONEX®, PLEGRIDY®, RITUXAN®, SPINRAZA®, TECFIDERA®, TYSABRI®, and ZINBRYTA® are registered trademarks of Biogen. BENEPALITM,FLIXABITM, FUMADERMTM, and IMRALDITM are trademarks of Biogen. The following are trademarks of the respective companies listed: FAMPYRATM – Acorda Therapeutics,Inc.; GAZYVA® and OCREVUS® – Genentech, Inc. Other trademarks referenced in this presentation are the property of their respective owners.
3
Q3 2018 Earnings Call Agenda
Introduction Matt CalistriVP, Investor Relations
Overview Michel VounatsosChief Executive Officer
R&D Update Michael Ehlers, M.D., Ph.D.EVP, Research & Development
Financial Update Jeffrey CapelloEVP, Chief Financial Officer
Closing Remarks Michel VounatsosChief Executive Officer
Available for Q&A Al Sandrock, M.D., Ph.D.EVP, Chief Medical Officer

4
OverviewMichel VounatsosChief Executive Officer

5
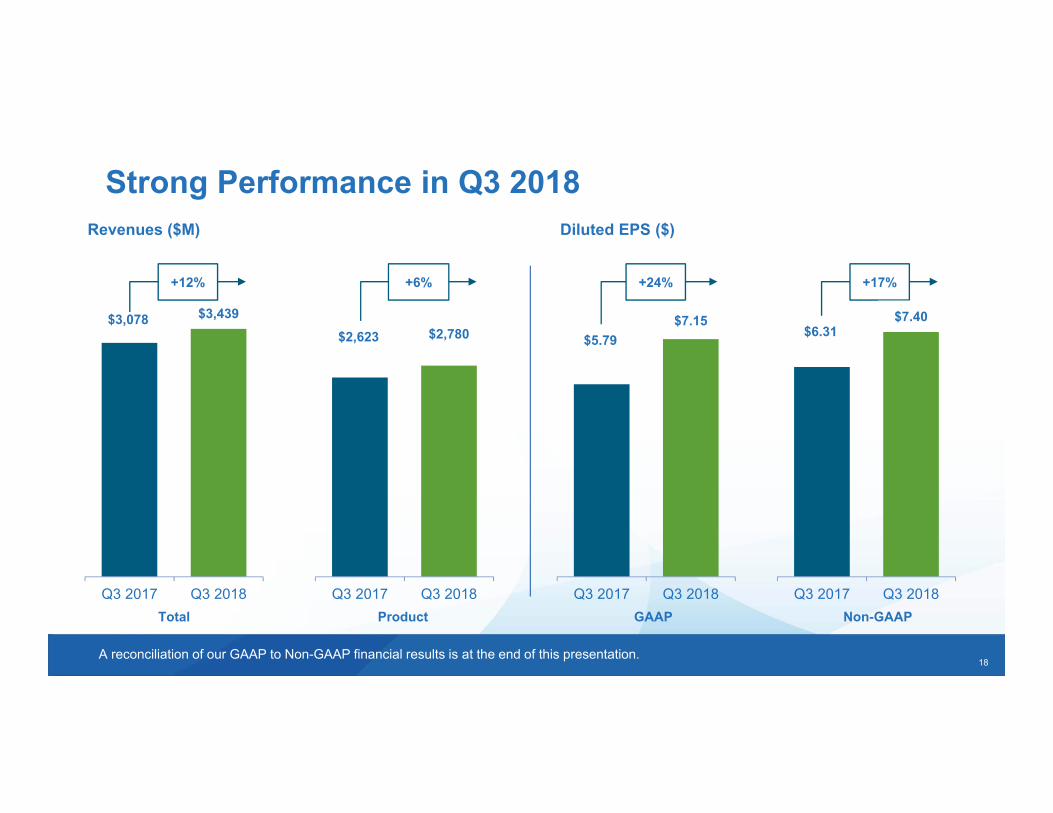
Strong Performance in Q3 2018
Total
$3,078 $3,439
Q3 2017 Q3 2018
+12% +6%
Revenues ($M)
Product
Diluted EPS ($)
Non-GAAPGAAP
+17%+24%
A reconciliation of our GAAP to Non-GAAP financial results is at the end of this presentation.
$2,623 $2,780
Q3 2017 Q3 2018
$5.79$7.15
Q3 2017 Q3 2018
$6.31$7.40
Q3 2017 Q3 2018
6
Strong Progress Implementing StrategyMaximizing the resilience of our MS core businessMaximizing the resilience of our MS core business
Accelerating progress in spinal muscular atrophy Accelerating progress in spinal muscular atrophy
Developing and expanding our neuroscience portfolioDeveloping and expanding our neuroscience portfolio
Re-prioritizing our capital allocation effortsRe-prioritizing our capital allocation efforts
Creating a leaner and simpler operating modelCreating a leaner and simpler operating model
Stable revenues, including OCREVUS royalties, in Q3 versus prior year Stable global MS patients in Q3 versus prior year Improved year-over-year trends for TECFIDERA and TYSABRI in U.S.
Q3 revenue performance driven by growth in both U.S. and ex-U.S. Close to 6,000 patients on therapy globally as of Q3 2018 NURTURE data showed many presymptomatic infants treated with
SPINRAZA achieved milestones consistent with normal development
Completed enrollment for opicinumab Phase 2b study in MS and BIIB092 Phase 2 study in progressive supranuclear palsy
Initiated Phase 1 study of BIIB078 in ALS and Phase 2b study of BG00011 (STX-100) in idiopathic pulmonary fibrosis
Year-to-date, completed five business development transactions Repurchased 10.5 million shares year-to-date Board authorized new $3.5 billion share repurchase program in Q3
Actively implementing an innovative operating model designed for the future
7
R&D UpdateMichael Ehlers, M.D., Ph.D.EVP, Research & Development

8
Industry-Leading Alzheimer’s Disease Portfolio
Presentations at Clinical Trials on Alzheimer’s Disease (CTAD)Presentations at Clinical Trials on Alzheimer’s Disease (CTAD)
Aducanumab (anti-Aβ mAb)Aducanumab (anti-Aβ mAb)
Programs Targeting TauPrograms Targeting Tau
Biogen will present updated safety and efficacy analyses of aducanumab from the Phase 1b PRIME study
Eisai will present updates from the Phase 2 study of BAN2401 and safety and efficacy data from the Phase 2 study of elenbecestat
Planning to initiate EVOLVE, a Phase 2 study designed to assess the clinical relevance of asymptomatic ARIA
Advancing BIIB076 and BIIB092, both anti-tau antibodies, as well as BIIB080, an antisense oligonucleotide targeting tau production
BIIB076 Phase 1 data expected early 2020
Aducanumab, BAN2401, and elenbecestat are being developed in collaboration with Eisai.
9
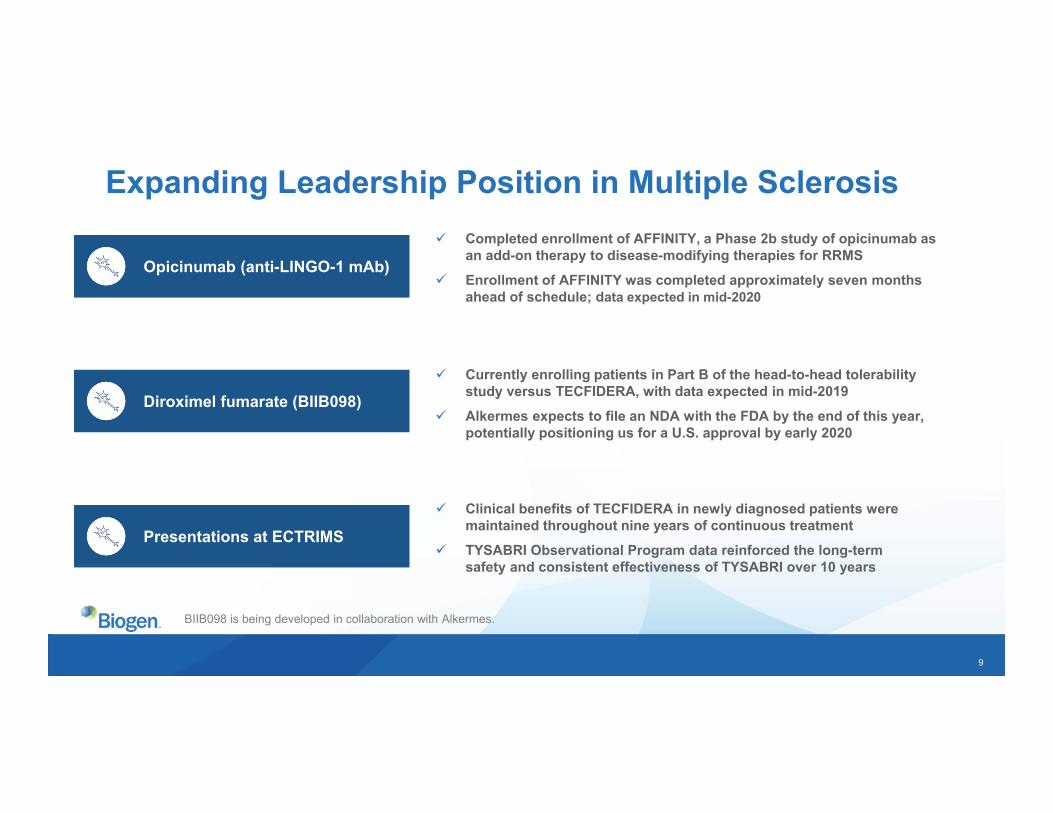
Expanding Leadership Position in Multiple Sclerosis Completed enrollment of AFFINITY, a Phase 2b study of opicinumab as
an add-on therapy to disease-modifying therapies for RRMS Enrollment of AFFINITY was completed approximately seven months
ahead of schedule; data expected in mid-2020
Currently enrolling patients in Part B of the head-to-head tolerability study versus TECFIDERA, with data expected in mid-2019
Alkermes expects to file an NDA with the FDA by the end of this year, potentially positioning us for a U.S. approval by early 2020
Clinical benefits of TECFIDERA in newly diagnosed patients were maintained throughout nine years of continuous treatment
TYSABRI Observational Program data reinforced the long-term safety and consistent effectiveness of TYSABRI over 10 years
Opicinumab (anti-LINGO-1 mAb)Opicinumab (anti-LINGO-1 mAb)
Presentations at ECTRIMSPresentations at ECTRIMS
Diroximel fumarate (BIIB098)Diroximel fumarate (BIIB098)
BIIB098 is being developed in collaboration with Alkermes.
10
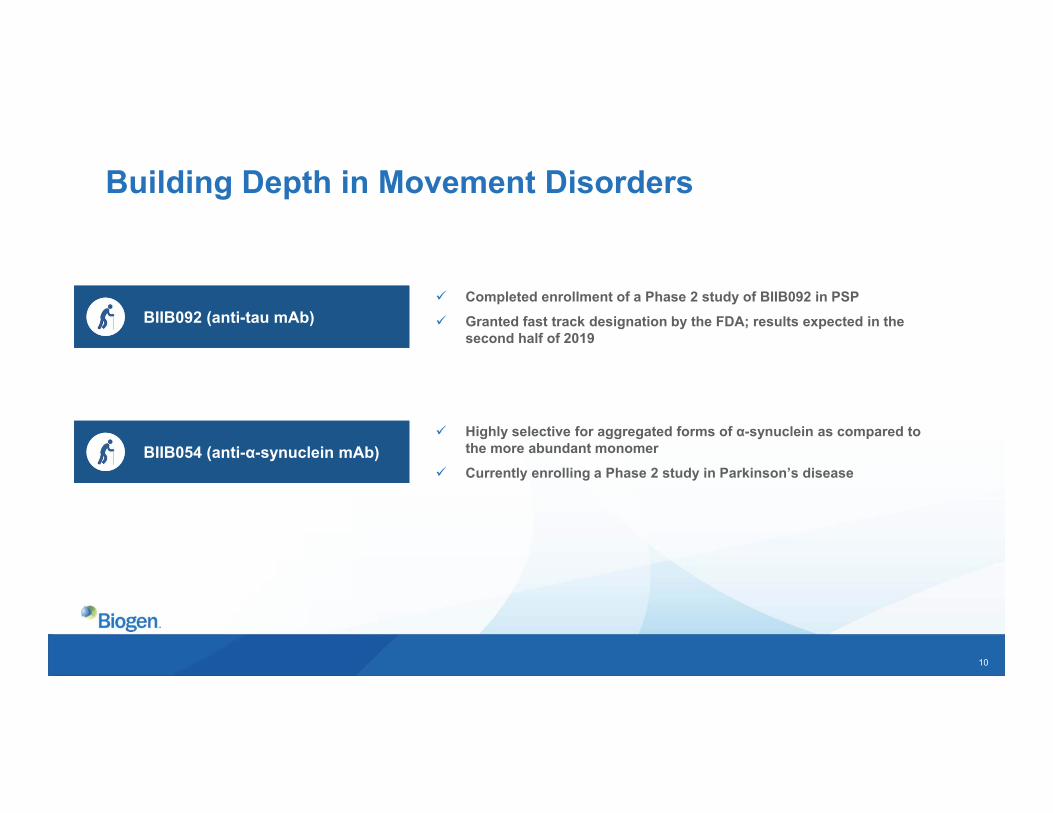
Building Depth in Movement Disorders
Completed enrollment of a Phase 2 study of BIIB092 in PSP Granted fast track designation by the FDA; results expected in the
second half of 2019
Highly selective for aggregated forms of α-synuclein as compared to the more abundant monomer
Currently enrolling a Phase 2 study in Parkinson’s disease
BIIB092 (anti-tau mAb)BIIB092 (anti-tau mAb)
BIIB054 (anti-α-synuclein mAb)BIIB054 (anti-α-synuclein mAb)
11
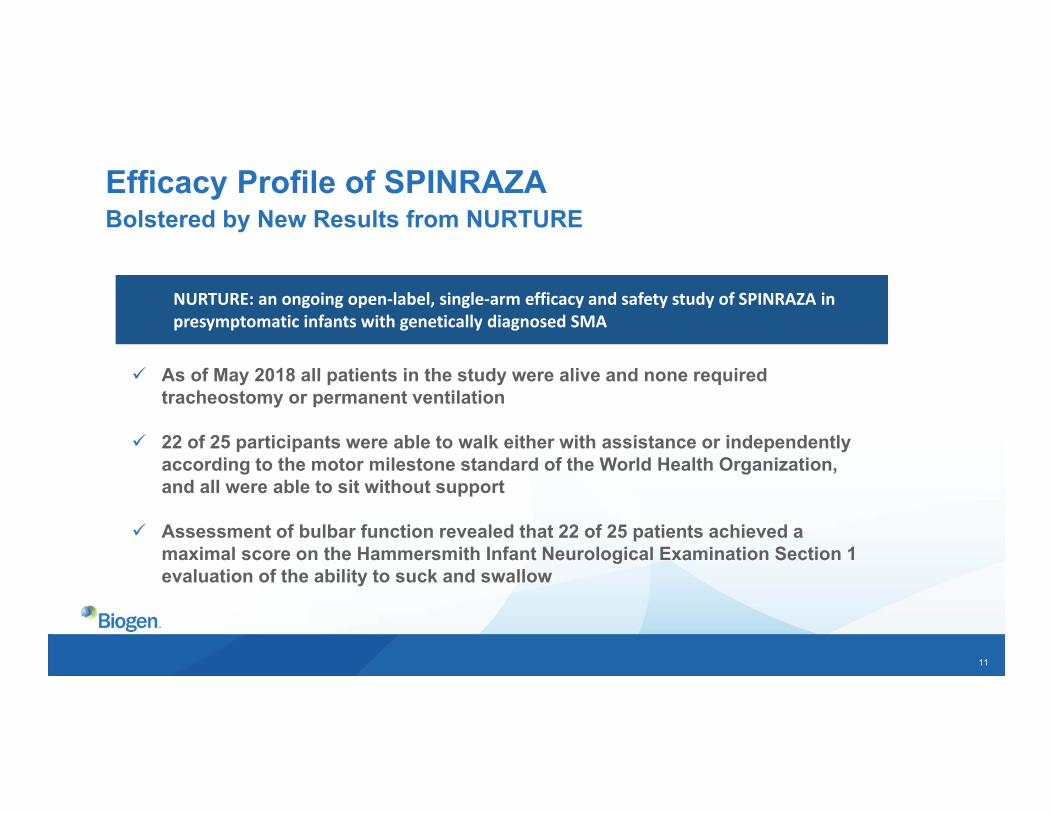
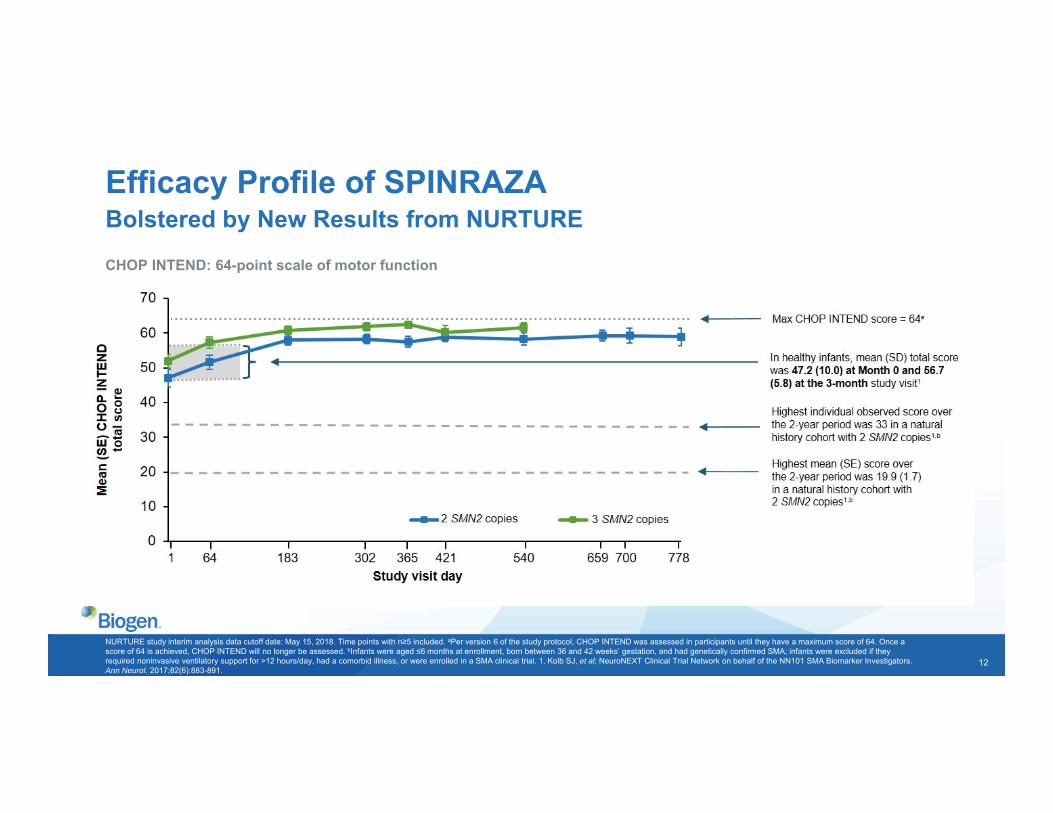
Efficacy Profile of SPINRAZA Bolstered by New Results from NURTURE
As of May 2018 all patients in the study were alive and none required tracheostomy or permanent ventilation
22 of 25 participants were able to walk either with assistance or independently according to the motor milestone standard of the World Health Organization, and all were able to sit without support
Assessment of bulbar function revealed that 22 of 25 patients achieved a maximal score on the Hammersmith Infant Neurological Examination Section 1 evaluation of the ability to suck and swallow
NURTURE: an ongoing open‐label, single‐arm efficacy and safety study of SPINRAZA in presymptomatic infants with genetically diagnosed SMANURTURE: an ongoing open‐label, single‐arm efficacy and safety study of SPINRAZA in presymptomatic infants with genetically diagnosed SMA
12
NURTURE study interim analysis data cutoff date: May 15, 2018. Time points with n≥5 included. aPer version 6 of the study protocol, CHOP INTEND was assessed in participants until they have a maximum score of 64. Once a score of 64 is achieved, CHOP INTEND will no longer be assessed. bInfants were aged ≤6 months at enrollment, born between 36 and 42 weeks’ gestation, and had genetically confirmed SMA; infants were excluded if they required noninvasive ventilatory support for >12 hours/day, had a comorbid illness, or were enrolled in a SMA clinical trial. 1. Kolb SJ, et al; NeuroNEXT Clinical Trial Network on behalf of the NN101 SMA Biomarker Investigators.Ann Neurol. 2017;82(6):883-891.
CHOP INTEND: 64-point scale of motor function
Efficacy Profile of SPINRAZA Bolstered by New Results from NURTURE

13
Targeting Genetic Causes of ALS
Continue to progress our Phase 1 study of BIIB067 in ALS patients who harbor mutations in superoxide dismutase 1, or SOD1
Dosed the first patient in the Phase 1 trial of BIIB078 in ALS patients harboring hexanucleotide repeat expansion in C9orf72
Selectively targets C9orf72 transcripts that contain hexanucleotide repeat expansions for degradation
BIIB078 (C9orf72 ASO)BIIB078 (C9orf72 ASO)
BIIB067 (SOD1 ASO)BIIB067 (SOD1 ASO)
Biogen has an option to license BIIB067 and BIIB078 from Ionis Pharmaceuticals.
14
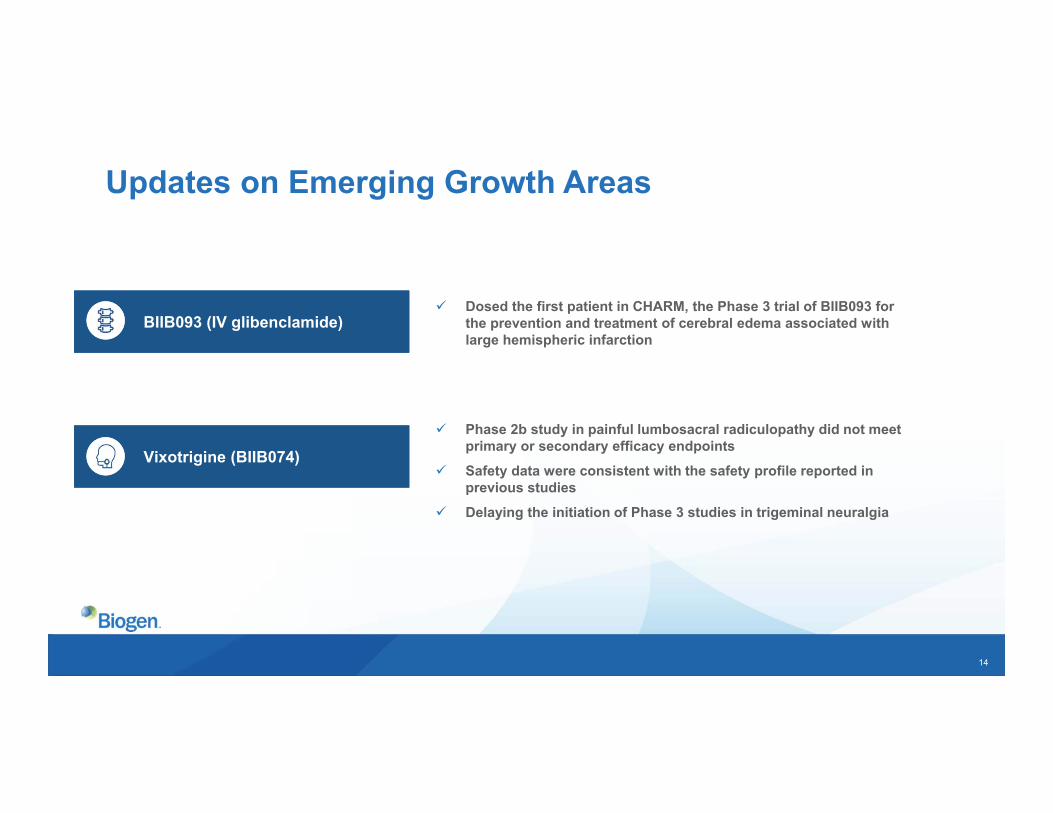
Updates on Emerging Growth Areas
Dosed the first patient in CHARM, the Phase 3 trial of BIIB093 for the prevention and treatment of cerebral edema associated with large hemispheric infarction
Phase 2b study in painful lumbosacral radiculopathy did not meet primary or secondary efficacy endpoints
Safety data were consistent with the safety profile reported in previous studies
Delaying the initiation of Phase 3 studies in trigeminal neuralgia
BIIB093 (IV glibenclamide)BIIB093 (IV glibenclamide)
Vixotrigine (BIIB074)Vixotrigine (BIIB074)
15
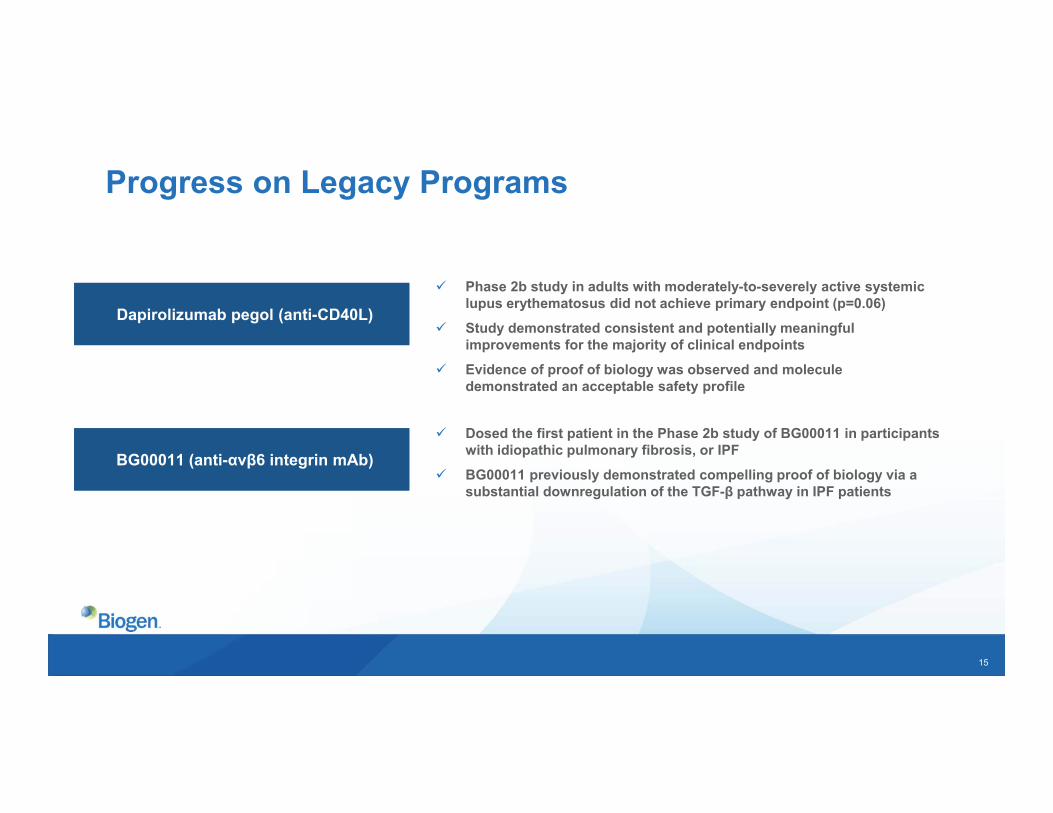
Dapirolizumab pegol (anti-CD40L)Dapirolizumab pegol (anti-CD40L)
Progress on Legacy Programs
Dosed the first patient in the Phase 2b study of BG00011 in participants with idiopathic pulmonary fibrosis, or IPF
BG00011 previously demonstrated compelling proof of biology via a substantial downregulation of the TGF-β pathway in IPF patients
BG00011 (anti-αvβ6 integrin mAb)BG00011 (anti-αvβ6 integrin mAb)
Phase 2b study in adults with moderately-to-severely active systemic lupus erythematosus did not achieve primary endpoint (p=0.06)
Study demonstrated consistent and potentially meaningfulimprovements for the majority of clinical endpoints
Evidence of proof of biology was observed and molecule demonstrated an acceptable safety profile
16
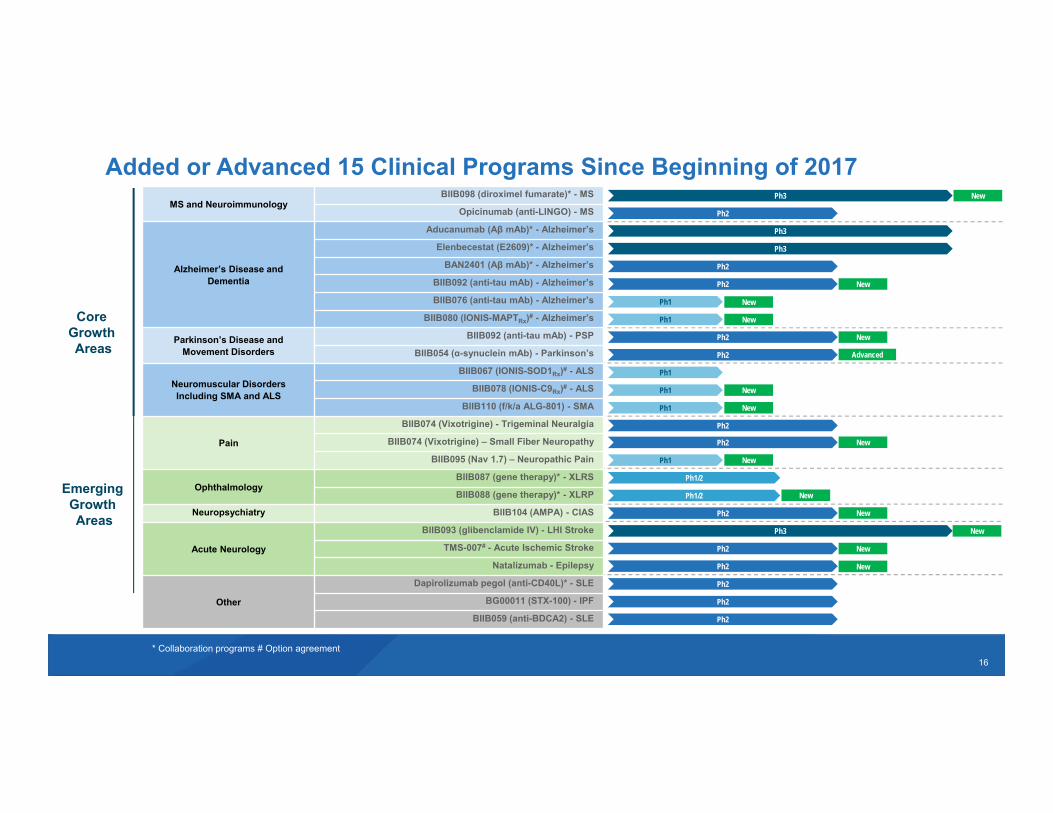
Core Growth Areas
Emerging Growth Areas
Ph1/2
Ph3
Ph3
Ph2
Ph2
Ph2
Ph2
Ph2
Ph2
Ph3
Ph2
Ph1
Ph2
Ph1
Ph2
Ph1
Ph2
Ph3 New
New
New
New
New
Advanced
New
New
Added or Advanced 15 Clinical Programs Since Beginning of 2017
Ph1
Ph2
Ph1
Ph1/2
Ph2
Ph2
New
* Collaboration programs # Option agreement
Ph1 New
New
MS and NeuroimmunologyBIIB098 (diroximel fumarate)* - MS
Opicinumab (anti-LINGO) - MS
Alzheimer’s Disease and Dementia
Aducanumab (Aβ mAb)* - Alzheimer’s
Elenbecestat (E2609)* - Alzheimer’s
BAN2401 (Aβ mAb)* - Alzheimer’s
BIIB092 (anti-tau mAb) - Alzheimer’s
BIIB076 (anti-tau mAb) - Alzheimer’s
BIIB080 (IONIS-MAPTRx)# - Alzheimer’s
Parkinson’s Disease and Movement Disorders
BIIB092 (anti-tau mAb) - PSP
BIIB054 (α-synuclein mAb) - Parkinson’s
Neuromuscular Disorders Including SMA and ALS
BIIB067 (IONIS-SOD1Rx)# - ALS
BIIB078 (IONIS-C9Rx)# - ALS
BIIB110 (f/k/a ALG-801) - SMA
Pain
BIIB074 (Vixotrigine) - Trigeminal Neuralgia
BIIB074 (Vixotrigine) – Small Fiber Neuropathy
BIIB095 (Nav 1.7) – Neuropathic Pain
OphthalmologyBIIB087 (gene therapy)* - XLRS
BIIB088 (gene therapy)* - XLRP
Neuropsychiatry BIIB104 (AMPA) - CIAS
Acute Neurology
BIIB093 (glibenclamide IV) - LHI Stroke
TMS-007# - Acute Ischemic Stroke
Natalizumab - Epilepsy
Other
Dapirolizumab pegol (anti-CD40L)* - SLE
BG00011 (STX-100) - IPF
BIIB059 (anti-BDCA2) - SLE
New
New
New
New
17
Financial UpdateJeffrey CapelloEVP, Chief Financial Officer
18
Strong Performance in Q3 2018
Total
$3,078 $3,439
Q3 2017 Q3 2018
+12% +6%
Revenues ($M)
Product
Diluted EPS ($)
Non-GAAPGAAP
+17%+24%
$2,623 $2,780
Q3 2017 Q3 2018
$5.79$7.15
Q3 2017 Q3 2018
$6.31$7.40
Q3 2017 Q3 2018
A reconciliation of our GAAP to Non-GAAP financial results is at the end of this presentation.
19
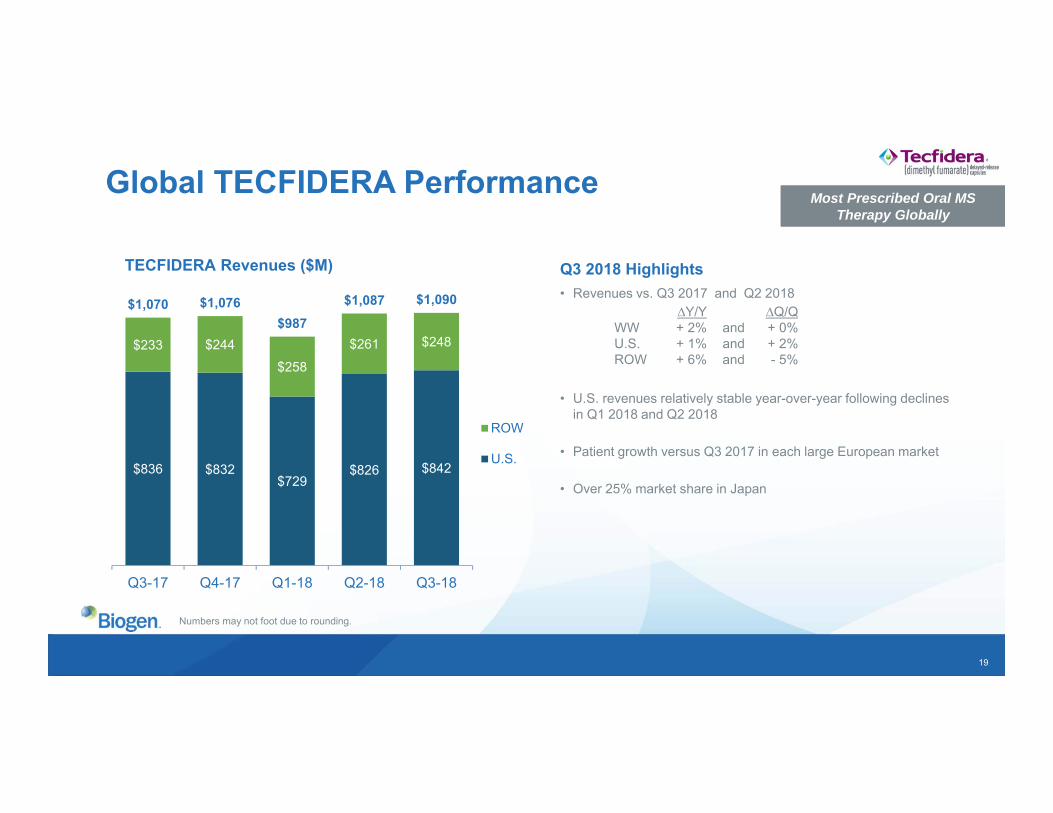
Q3 2018 Highlights• Revenues vs. Q3 2017 and Q2 2018
• U.S. revenues relatively stable year-over-year following declines in Q1 2018 and Q2 2018
• Patient growth versus Q3 2017 in each large European market
• Over 25% market share in Japan
Global TECFIDERA Performance
TECFIDERA Revenues ($M)
∆Y/Y ∆Q/QWW + 2% and + 0%U.S. + 1% and + 2%ROW + 6% and - 5%
$836 $832$729
$826 $842
$233 $244$258
$261 $248
$1,070 $1,076$987
$1,087 $1,090
Q3-17 Q4-17 Q1-18 Q2-18 Q3-18
ROW
U.S.
Most Prescribed Oral MS Therapy Globally
Most Prescribed Oral MS Therapy Globally
Numbers may not foot due to rounding.
20
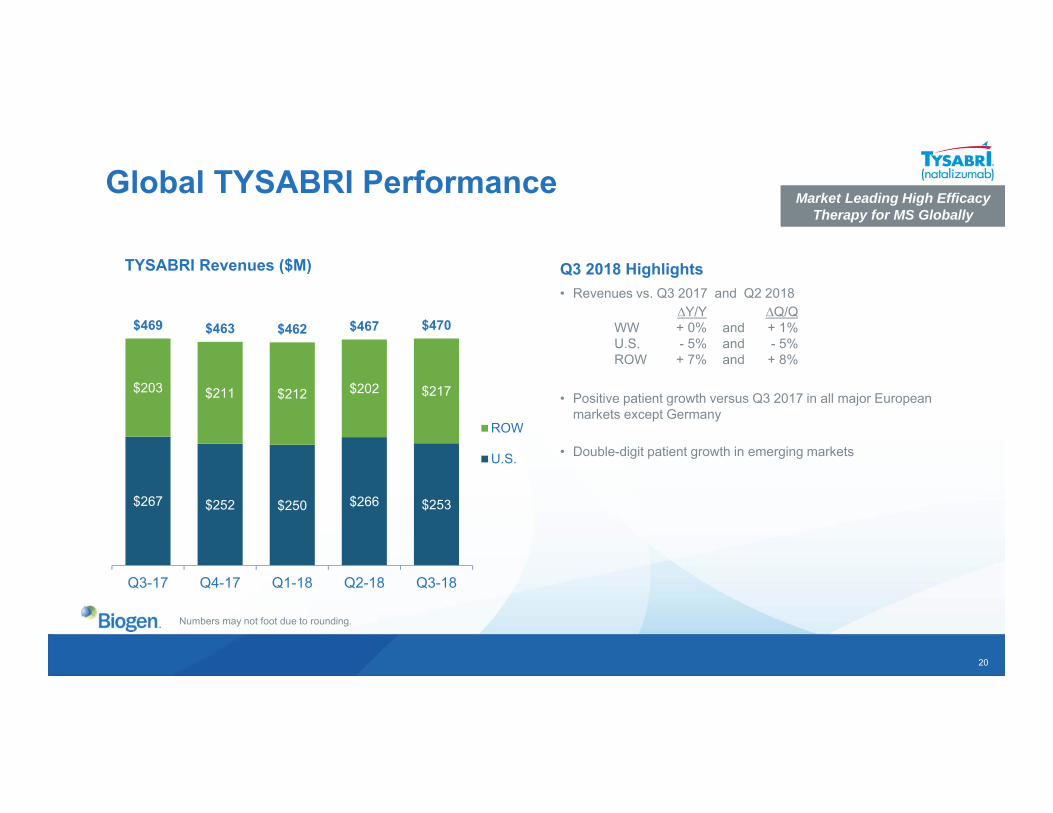
Q3 2018 Highlights• Revenues vs. Q3 2017 and Q2 2018
• Positive patient growth versus Q3 2017 in all major European markets except Germany
• Double-digit patient growth in emerging markets
Global TYSABRI Performance
TYSABRI Revenues ($M)
∆Y/Y ∆Q/QWW + 0% and + 1%U.S. - 5% and - 5%ROW + 7% and + 8%
$267 $252 $250 $266 $253
$203 $211 $212 $202 $217
$469 $463 $462 $467 $470
Q3-17 Q4-17 Q1-18 Q2-18 Q3-18
ROW
U.S.
Market Leading High Efficacy Therapy for MS Globally
Market Leading High Efficacy Therapy for MS Globally
Numbers may not foot due to rounding.
21
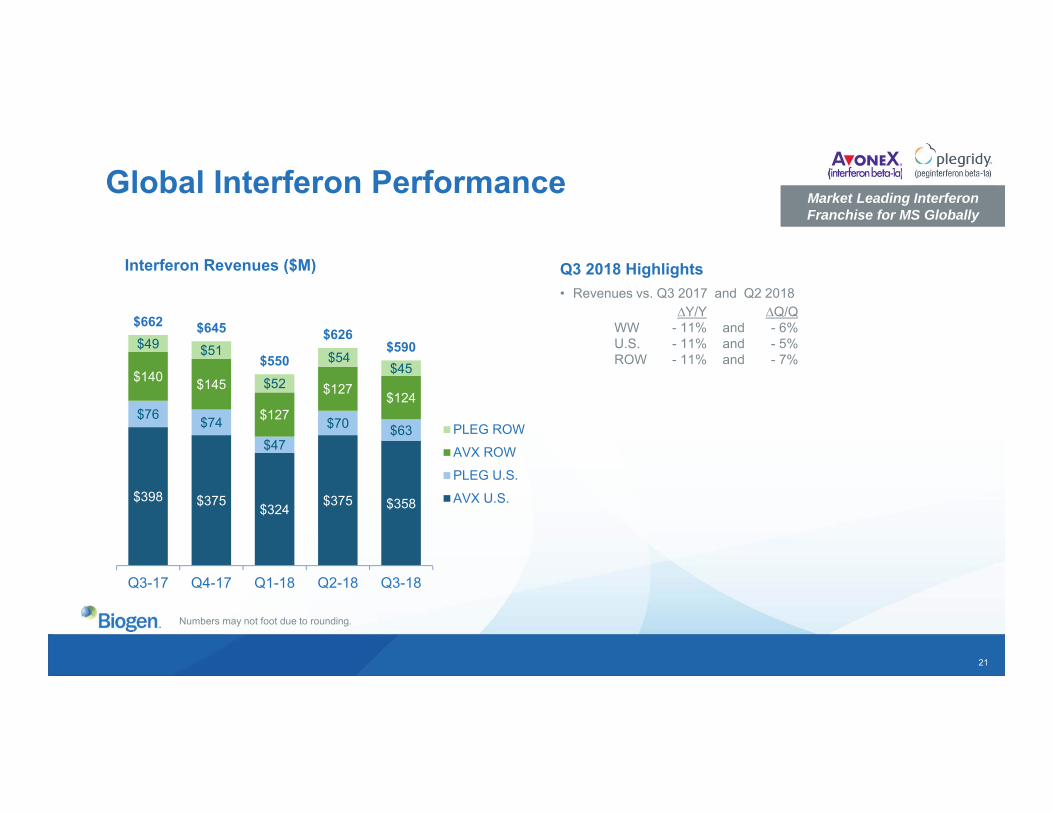
Q3 2018 Highlights• Revenues vs. Q3 2017 and Q2 2018
Global Interferon Performance
Interferon Revenues ($M)
∆Y/Y ∆Q/QWW - 11% and - 6%U.S. - 11% and - 5%ROW - 11% and - 7%
Market Leading Interferon Franchise for MS GloballyMarket Leading Interferon Franchise for MS Globally
Numbers may not foot due to rounding.
$398 $375 $324 $375 $358
$76 $74$47
$70 $63
$140 $145
$127
$127 $124
$49 $51
$52
$54$45
$662 $645
$550
$626$590
Q3-17 Q4-17 Q1-18 Q2-18 Q3-18
PLEG ROW
AVX ROW
PLEG U.S.
AVX U.S.
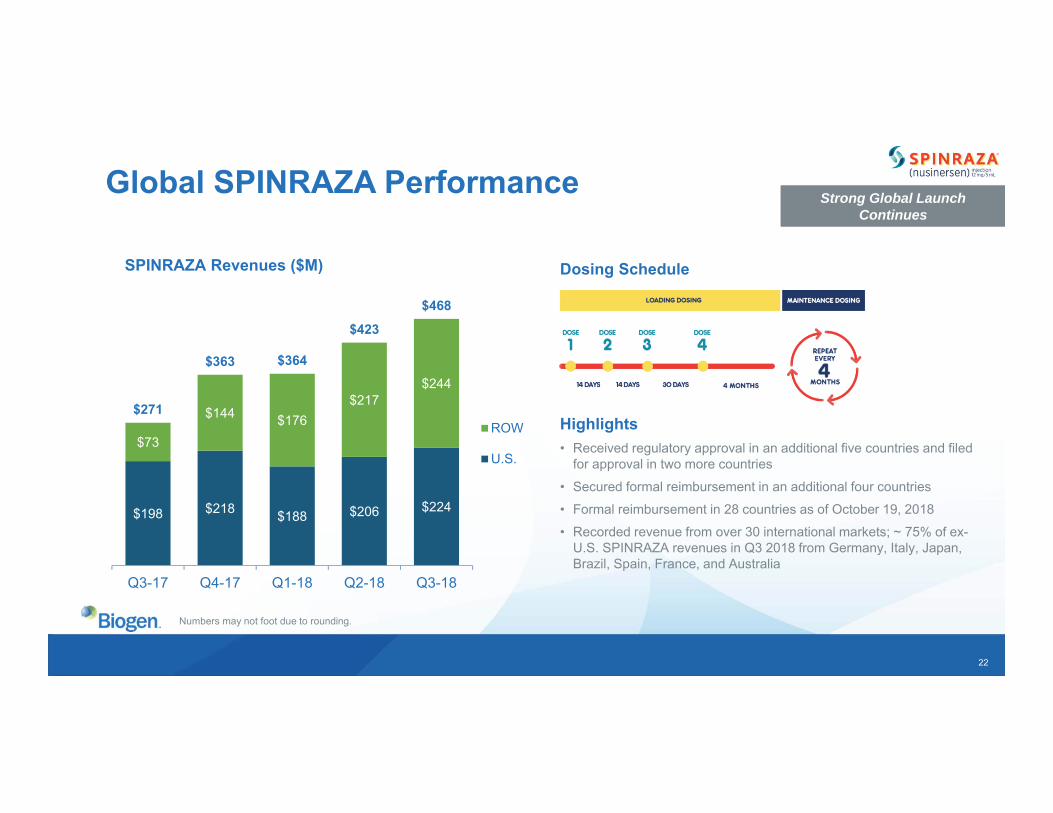
22
Dosing Schedule
Highlights• Received regulatory approval in an additional five countries and filed
for approval in two more countries• Secured formal reimbursement in an additional four countries• Formal reimbursement in 28 countries as of October 19, 2018• Recorded revenue from over 30 international markets; ~ 75% of ex-
U.S. SPINRAZA revenues in Q3 2018 from Germany, Italy, Japan, Brazil, Spain, France, and Australia
Global SPINRAZA Performance
SPINRAZA Revenues ($M)
$198 $218 $188 $206 $224
$73
$144 $176$217
$244
$271
$363 $364
$423$468
Q3-17 Q4-17 Q1-18 Q2-18 Q3-18
ROW
U.S.
Strong Global Launch Continues
Strong Global Launch Continues
Numbers may not foot due to rounding.
23
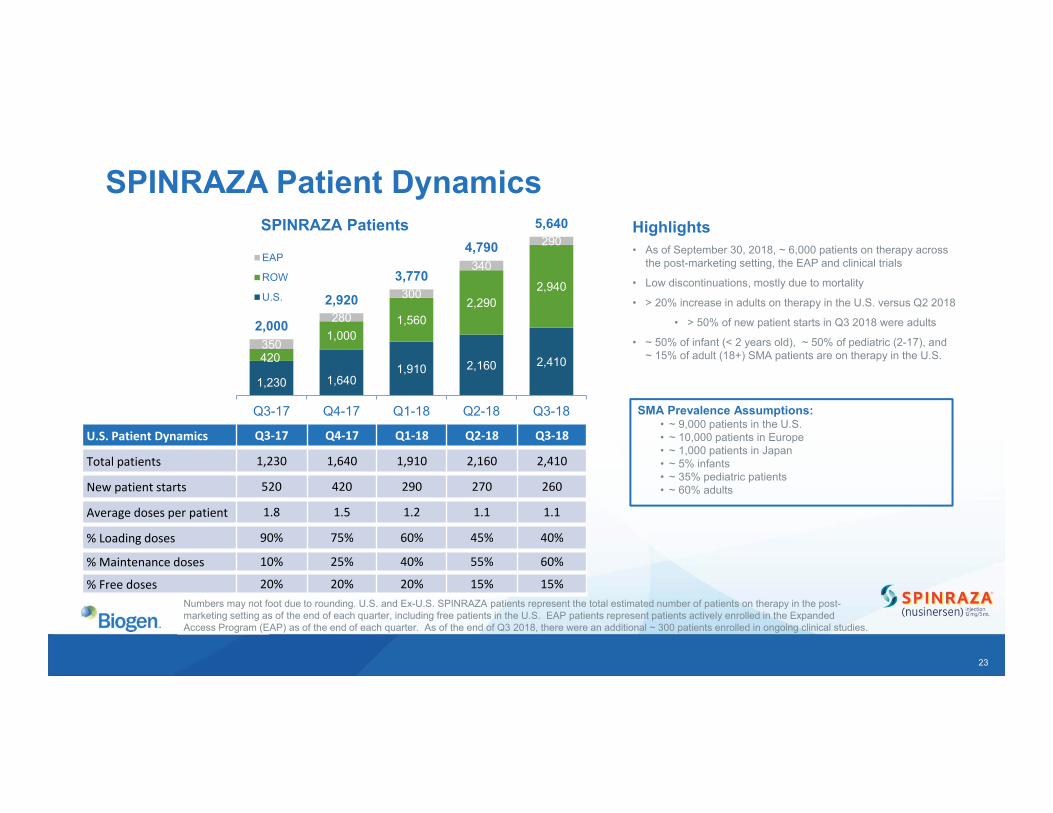
SPINRAZA Patient DynamicsSPINRAZA Patients
Numbers may not foot due to rounding. U.S. and Ex-U.S. SPINRAZA patients represent the total estimated number of patients on therapy in the post-marketing setting as of the end of each quarter, including free patients in the U.S. EAP patients represent patients actively enrolled in the Expanded Access Program (EAP) as of the end of each quarter. As of the end of Q3 2018, there were an additional ~ 300 patients enrolled in ongoing clinical studies.
1,230 1,6401,910 2,160 2,410420
1,0001,560
2,2902,940
350
280
300
340
290
2,000
2,920
3,770
4,790
5,640
Q3-17 Q4-17 Q1-18 Q2-18 Q3-18
EAP
ROW
U.S.
U.S. Patient Dynamics Q3‐17 Q4‐17 Q1‐18 Q2‐18 Q3‐18
Total patients 1,230 1,640 1,910 2,160 2,410
New patient starts 520 420 290 270 260
Average doses per patient 1.8 1.5 1.2 1.1 1.1
% Loading doses 90% 75% 60% 45% 40%
% Maintenance doses 10% 25% 40% 55% 60%
% Free doses 20% 20% 20% 15% 15%
Highlights• As of September 30, 2018, ~ 6,000 patients on therapy across
the post-marketing setting, the EAP and clinical trials
• Low discontinuations, mostly due to mortality
• > 20% increase in adults on therapy in the U.S. versus Q2 2018
• > 50% of new patient starts in Q3 2018 were adults
• ~ 50% of infant (< 2 years old), ~ 50% of pediatric (2-17), and ~ 15% of adult (18+) SMA patients are on therapy in the U.S.
SMA Prevalence Assumptions:• ~ 9,000 patients in the U.S.• ~ 10,000 patients in Europe • ~ 1,000 patients in Japan• ~ 5% infants• ~ 35% pediatric patients• ~ 60% adults
24
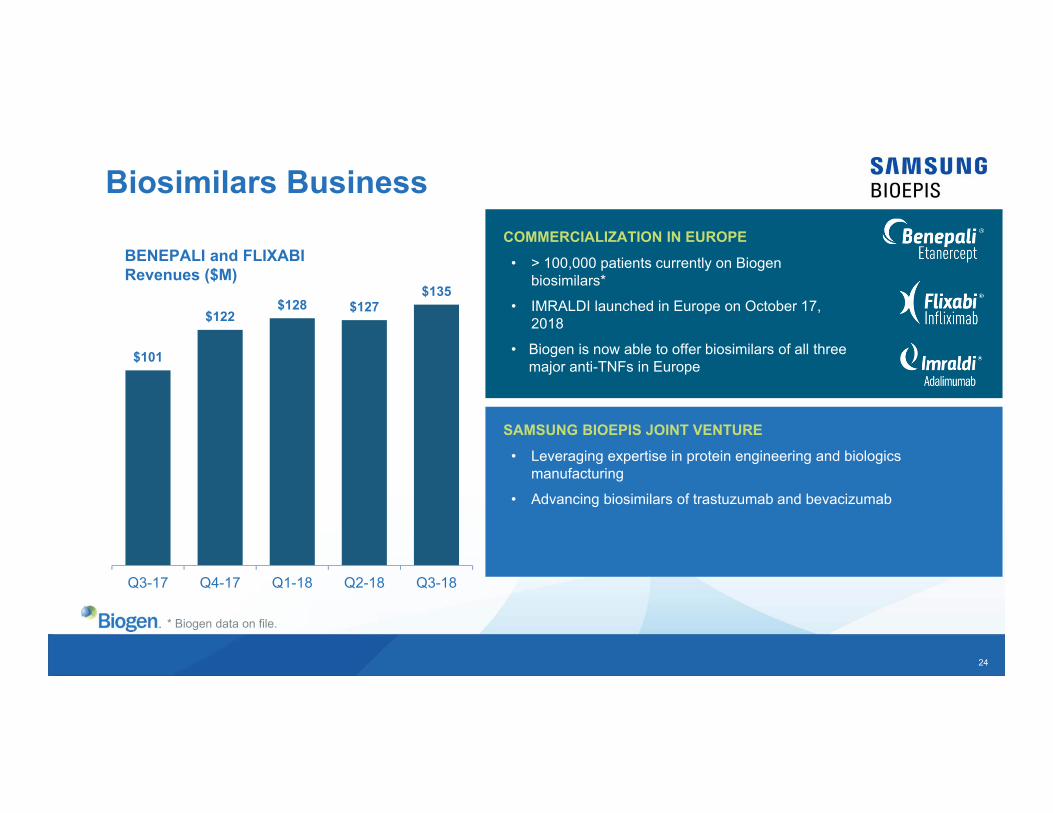
Biosimilars Business
BENEPALI and FLIXABI Revenues ($M)
$101
$122$128 $127
$135
Q3-17 Q4-17 Q1-18 Q2-18 Q3-18
SAMSUNG BIOEPIS JOINT VENTURE• Leveraging expertise in protein engineering and biologics
manufacturing
• Advancing biosimilars of trastuzumab and bevacizumab
COMMERCIALIZATION IN EUROPE• > 100,000 patients currently on Biogen
biosimilars*
• IMRALDI launched in Europe on October 17, 2018
• Biogen is now able to offer biosimilars of all three major anti-TNFs in Europe
* Biogen data on file.
25
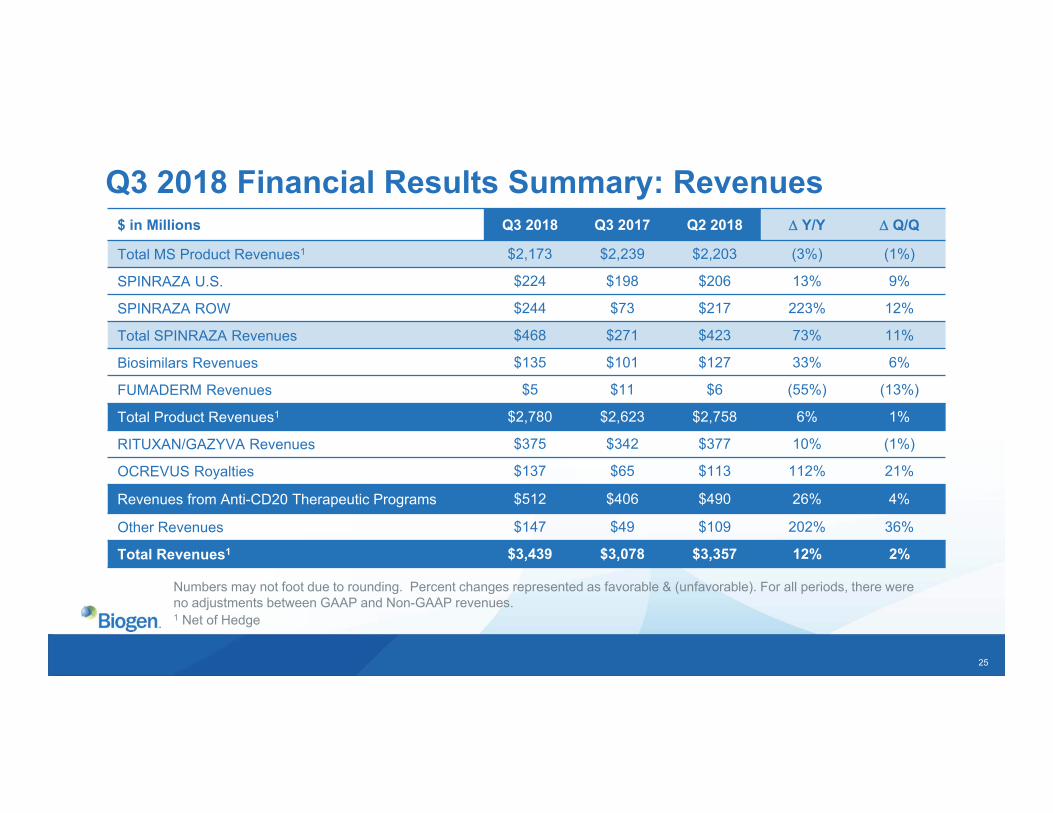
Q3 2018 Financial Results Summary: Revenues$ in Millions Q3 2018 Q3 2017 Q2 2018 Y/Y Q/Q
Total MS Product Revenues1 $2,173 $2,239 $2,203 (3%) (1%)
SPINRAZA U.S. $224 $198 $206 13% 9%
SPINRAZA ROW $244 $73 $217 223% 12%
Total SPINRAZA Revenues $468 $271 $423 73% 11%
Biosimilars Revenues $135 $101 $127 33% 6%
FUMADERM Revenues $5 $11 $6 (55%) (13%)
Total Product Revenues1 $2,780 $2,623 $2,758 6% 1%
RITUXAN/GAZYVA Revenues $375 $342 $377 10% (1%)
OCREVUS Royalties $137 $65 $113 112% 21%
Revenues from Anti-CD20 Therapeutic Programs $512 $406 $490 26% 4%
Other Revenues $147 $49 $109 202% 36%
Total Revenues1 $3,439 $3,078 $3,357 12% 2%
Numbers may not foot due to rounding. Percent changes represented as favorable & (unfavorable). For all periods, there were no adjustments between GAAP and Non-GAAP revenues. 1 Net of Hedge

26
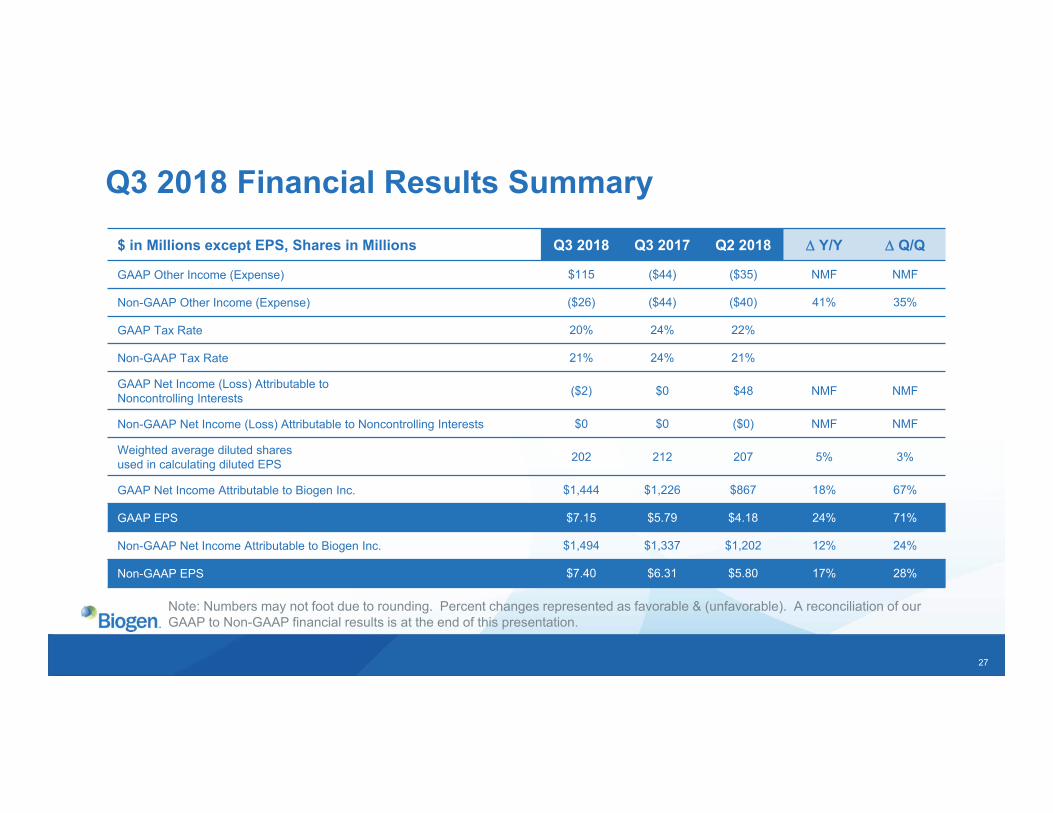
Q3 2018 Financial Results Summary$ in Millions Q3 2018 Q3 2017 Q2 2018 Y/Y Q/Q
GAAP Cost of Sales $461 $370 $421 (25%) (9%)
% of Total Revenues 13% 12% 13%
Non-GAAP Cost of Sales $461 $370 $421 (25%) (9%)
% of Total Revenues 13% 12% 13%
GAAP R&D Expenses $508 $446 $981 (14%) 48%
% of Total Revenues 15% 15% 29%
Non-GAAP R&D Expenses $508 $446 $819 (14%) 38%
% of Total Revenues 15% 15% 24%
GAAP SG&A Expenses $498 $433 $516 (15%) 4%
% of Total Revenues 14% 14% 15%
Non-GAAP SG&A Expenses $495 $433 $512 (14%) 3%
% of Total Revenues 14% 14% 15%
GAAP Amortization of Acquired Intangibles $282 $109 $107 (159%) (162%)
Collaboration Profit Sharing $47 $35 $39 (35%) (21%)
Numbers may not foot due to rounding. Percent changes represented as favorable & (unfavorable). A reconciliation of our GAAP to Non-GAAP financial results is at the end of this presentation.
27
Q3 2018 Financial Results Summary$ in Millions except EPS, Shares in Millions Q3 2018 Q3 2017 Q2 2018 Y/Y Q/Q
GAAP Other Income (Expense) $115 ($44) ($35) NMF NMF
Non-GAAP Other Income (Expense) ($26) ($44) ($40) 41% 35%
GAAP Tax Rate 20% 24% 22%
Non-GAAP Tax Rate 21% 24% 21%
GAAP Net Income (Loss) Attributable to Noncontrolling Interests ($2) $0 $48 NMF NMF
Non-GAAP Net Income (Loss) Attributable to Noncontrolling Interests $0 $0 ($0) NMF NMF
Weighted average diluted shares used in calculating diluted EPS 202 212 207 5% 3%
GAAP Net Income Attributable to Biogen Inc. $1,444 $1,226 $867 18% 67%
GAAP EPS $7.15 $5.79 $4.18 24% 71%
Non-GAAP Net Income Attributable to Biogen Inc. $1,494 $1,337 $1,202 12% 24%
Non-GAAP EPS $7.40 $6.31 $5.80 17% 28%
Note: Numbers may not foot due to rounding. Percent changes represented as favorable & (unfavorable). A reconciliation of our GAAP to Non-GAAP financial results is at the end of this presentation.
28
Closing RemarksMichel VounatsosChief Executive Officer
29
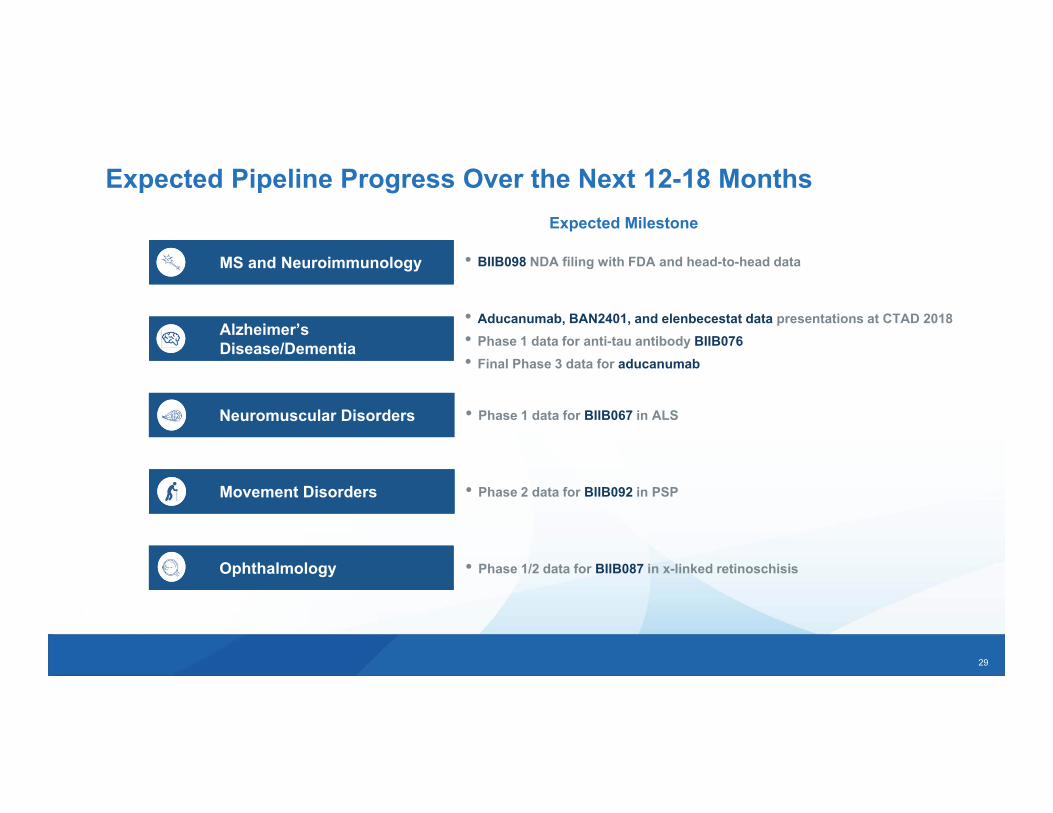
MS and NeuroimmunologyMS and Neuroimmunology • BIIB098 NDA filing with FDA and head-to-head data
Alzheimer’s Disease/DementiaAlzheimer’s Disease/Dementia
• Aducanumab, BAN2401, and elenbecestat data presentations at CTAD 2018• Phase 1 data for anti-tau antibody BIIB076• Final Phase 3 data for aducanumab
Neuromuscular DisordersNeuromuscular Disorders • Phase 1 data for BIIB067 in ALS
OphthalmologyOphthalmology • Phase 1/2 data for BIIB087 in x-linked retinoschisis
Expected Milestone
Expected Pipeline Progress Over the Next 12-18 Months
• Phase 2 data for BIIB092 in PSPMovement DisordersMovement Disorders
30
Questions & Answers
31
BiogenAppendix
32
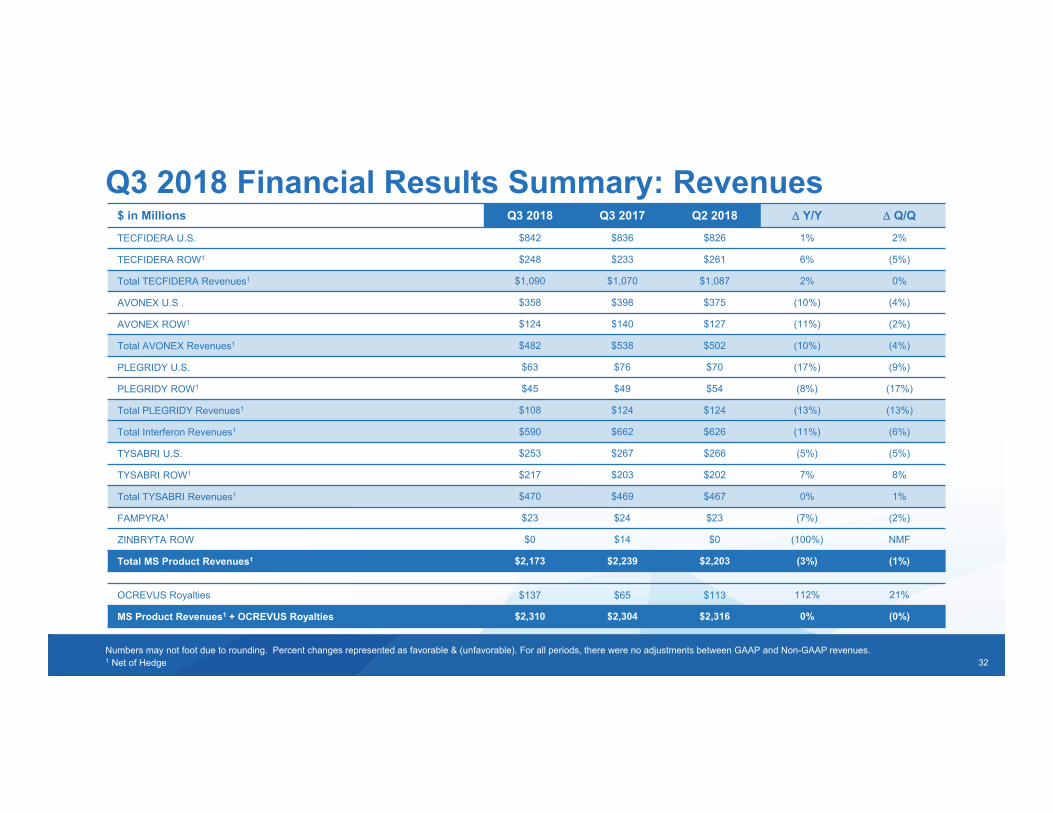
Q3 2018 Financial Results Summary: Revenues
Numbers may not foot due to rounding. Percent changes represented as favorable & (unfavorable). For all periods, there were no adjustments between GAAP and Non-GAAP revenues. 1 Net of Hedge
$ in Millions Q3 2018 Q3 2017 Q2 2018 Y/Y Q/Q
TECFIDERA U.S. $842 $836 $826 1% 2%
TECFIDERA ROW1 $248 $233 $261 6% (5%)
Total TECFIDERA Revenues1 $1,090 $1,070 $1,087 2% 0%
AVONEX U.S . $358 $398 $375 (10%) (4%)
AVONEX ROW1 $124 $140 $127 (11%) (2%)
Total AVONEX Revenues1 $482 $538 $502 (10%) (4%)
PLEGRIDY U.S. $63 $76 $70 (17%) (9%)
PLEGRIDY ROW1 $45 $49 $54 (8%) (17%)
Total PLEGRIDY Revenues1 $108 $124 $124 (13%) (13%)
Total Interferon Revenues1 $590 $662 $626 (11%) (6%)
TYSABRI U.S. $253 $267 $266 (5%) (5%)
TYSABRI ROW1 $217 $203 $202 7% 8%
Total TYSABRI Revenues1 $470 $469 $467 0% 1%
FAMPYRA1 $23 $24 $23 (7%) (2%)
ZINBRYTA ROW $0 $14 $0 (100%) NMF
Total MS Product Revenues1 $2,173 $2,239 $2,203 (3%) (1%)
OCREVUS Royalties $137 $65 $113 112% 21%
MS Product Revenues1 + OCREVUS Royalties $2,310 $2,304 $2,316 0% (0%)
33
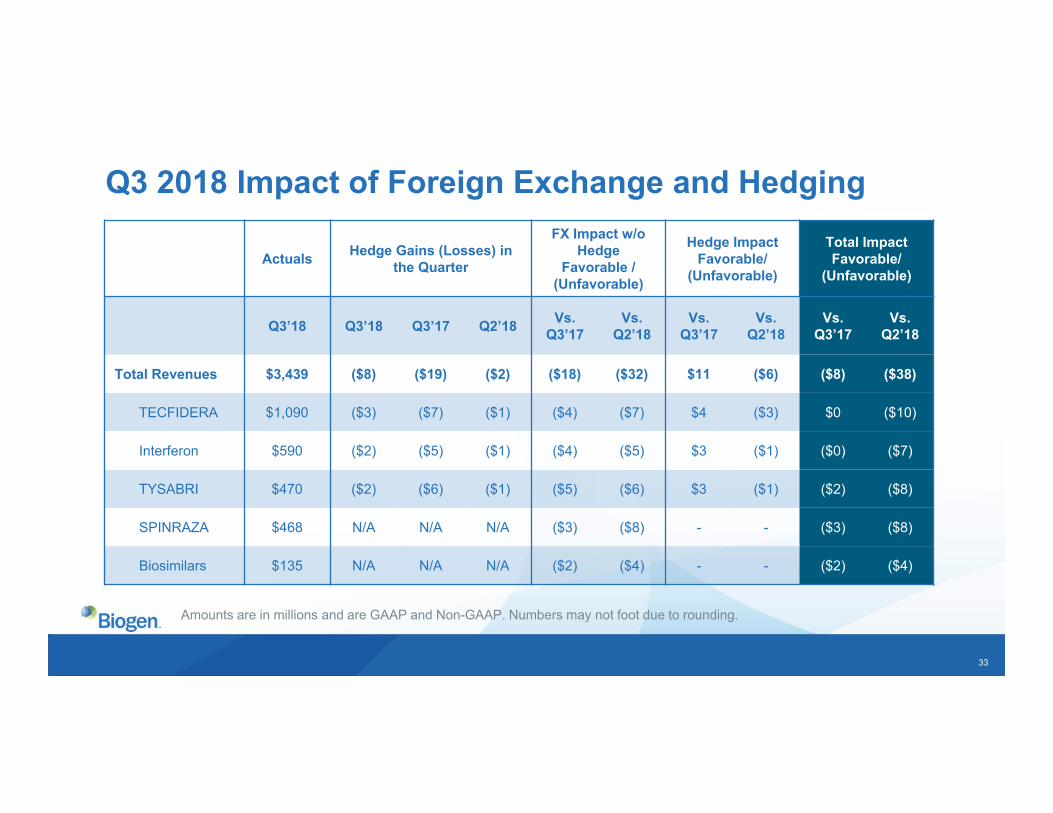
Q3 2018 Impact of Foreign Exchange and Hedging
Actuals Hedge Gains (Losses) in the Quarter
FX Impact w/o Hedge
Favorable / (Unfavorable)
Hedge Impact Favorable/
(Unfavorable)
Total ImpactFavorable/
(Unfavorable)
Q3’18 Q3’18 Q3’17 Q2’18 Vs. Q3’17
Vs. Q2’18
Vs. Q3’17
Vs. Q2’18
Vs. Q3’17
Vs. Q2’18
Total Revenues $3,439 ($8) ($19) ($2) ($18) ($32) $11 ($6) ($8) ($38)
TECFIDERA $1,090 ($3) ($7) ($1) ($4) ($7) $4 ($3) $0 ($10)
Interferon $590 ($2) ($5) ($1) ($4) ($5) $3 ($1) ($0) ($7)
TYSABRI $470 ($2) ($6) ($1) ($5) ($6) $3 ($1) ($2) ($8)
SPINRAZA $468 N/A N/A N/A ($3) ($8) - - ($3) ($8)
Biosimilars $135 N/A N/A N/A ($2) ($4) - - ($2) ($4)
Amounts are in millions and are GAAP and Non-GAAP. Numbers may not foot due to rounding.

34
$82 $95 $94 $131 $154$325 $320 $350 $359 $358$406 $415 $443 $490 $512
$1,040 $1,042 $1,096 $1,142 $1,112
Q3-17 Q4-17 Q1-18 Q2-18 Q3-18
Other Anti-CD20 Revenues BIIB U.S. Profit Share BIIB Total Anti-CD20 Revenues RITUXAN/GAZYVA U.S. Net Sales
Anti-CD20 PerformanceRevenues from Anti-CD20 Therapeutic Programs ($M)
Note: In collaboration with Roche and Genentech. Numbers may not foot due to rounding. 1 BIIB U.S. profit share = U.S. profit share + expense reimbursement
1
Q3 2018 HighlightsRevenues vs. Q3 2017 and Q2 2018
∆Y/Y ∆Q/QU.S. Net Sales + 7% and - 3%U.S. Profit Share1 + 10% and - 0%Other Anti-CD20 + 88% and + 18%BIIB Total Anti-CD20 Revenues
+ 26% and + 4%
• Other revenues from anti-CD20 therapeutic programs consist of royalty revenues on sales of OCREVUS and our share of pre-tax copromotion profits on RITUXAN in Canada.
35
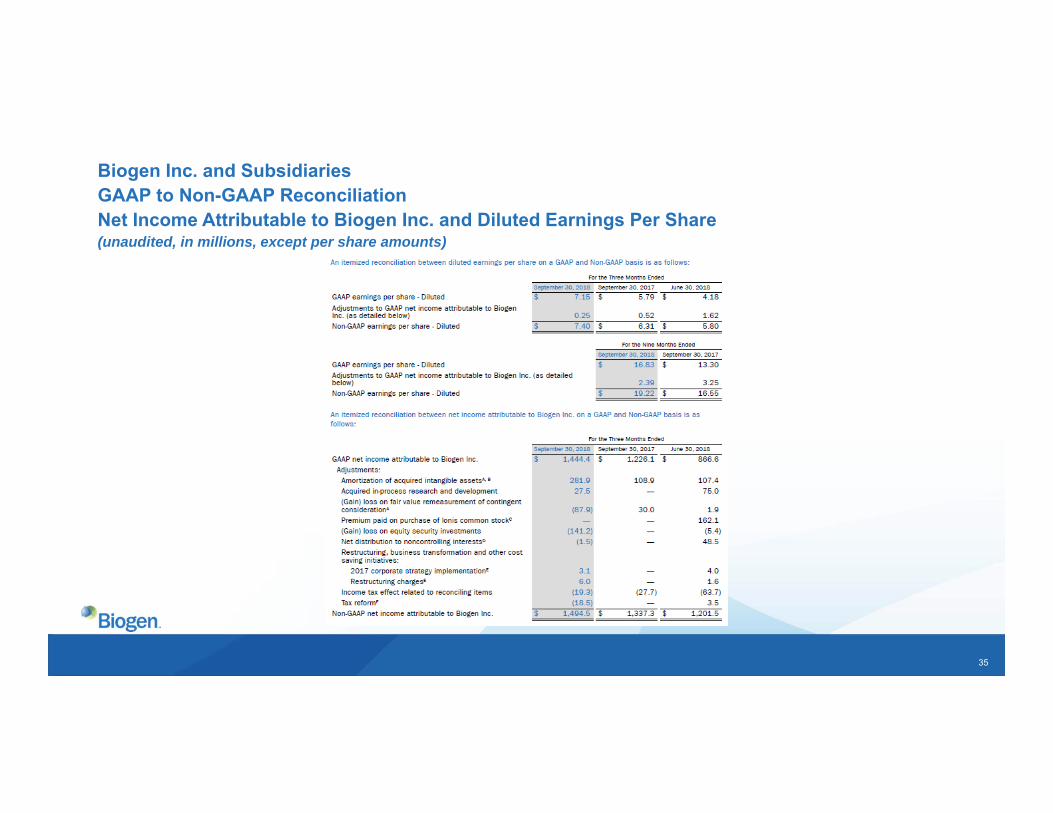
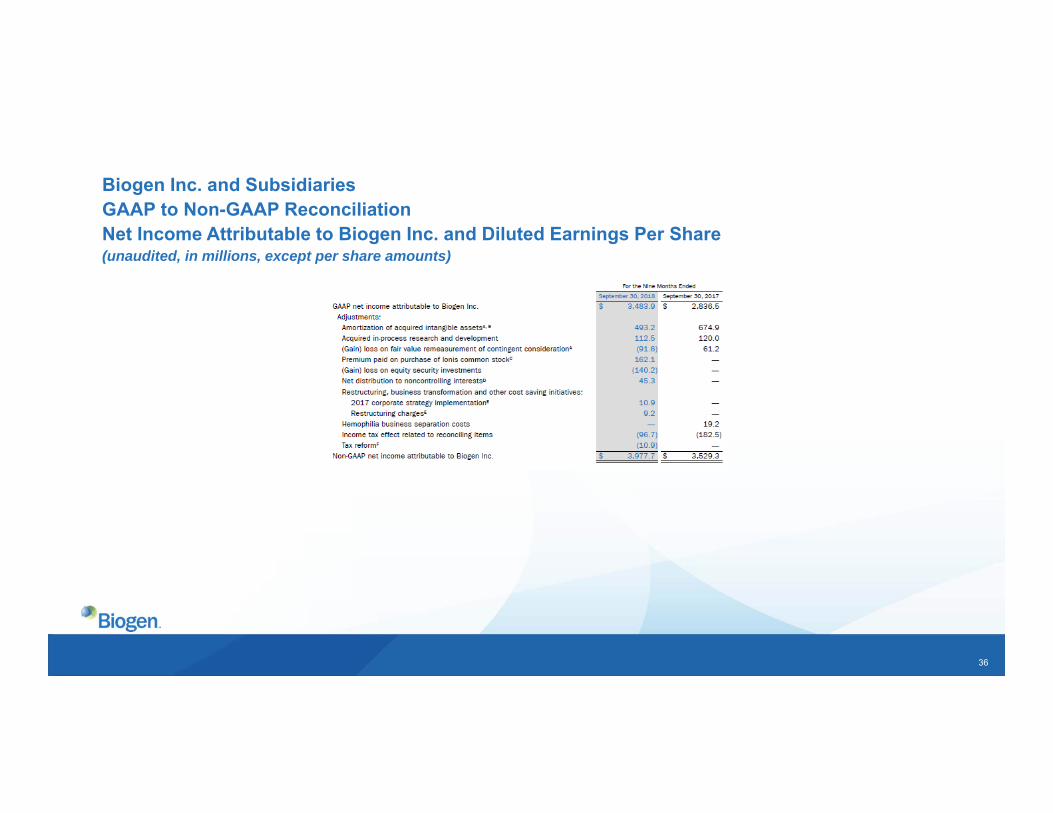
Biogen Inc. and SubsidiariesGAAP to Non-GAAP ReconciliationNet Income Attributable to Biogen Inc. and Diluted Earnings Per Share(unaudited, in millions, except per share amounts)
36
Biogen Inc. and SubsidiariesGAAP to Non-GAAP ReconciliationNet Income Attributable to Biogen Inc. and Diluted Earnings Per Share(unaudited, in millions, except per share amounts)
37
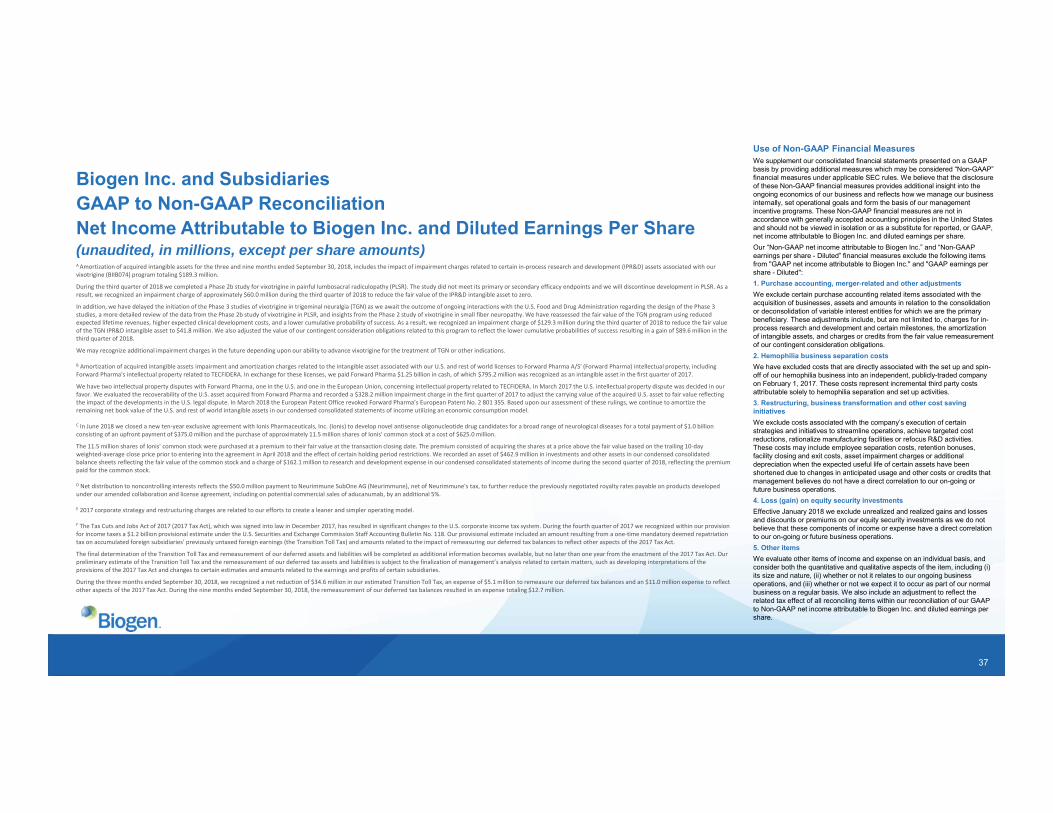
Biogen Inc. and SubsidiariesGAAP to Non-GAAP ReconciliationNet Income Attributable to Biogen Inc. and Diluted Earnings Per Share(unaudited, in millions, except per share amounts)
Use of Non-GAAP Financial MeasuresWe supplement our consolidated financial statements presented on a GAAP basis by providing additional measures which may be considered “Non-GAAP” financial measures under applicable SEC rules. We believe that the disclosure of these Non-GAAP financial measures provides additional insight into the ongoing economics of our business and reflects how we manage our business internally, set operational goals and form the basis of our management incentive programs. These Non-GAAP financial measures are not in accordance with generally accepted accounting principles in the United States and should not be viewed in isolation or as a substitute for reported, or GAAP, net income attributable to Biogen Inc. and diluted earnings per share.Our “Non-GAAP net income attributable to Biogen Inc.” and “Non-GAAP earnings per share - Diluted” financial measures exclude the following items from "GAAP net income attributable to Biogen Inc." and "GAAP earnings per share - Diluted":1. Purchase accounting, merger-related and other adjustmentsWe exclude certain purchase accounting related items associated with the acquisition of businesses, assets and amounts in relation to the consolidation or deconsolidation of variable interest entities for which we are the primary beneficiary. These adjustments include, but are not limited to, charges for in-process research and development and certain milestones, the amortization of intangible assets, and charges or credits from the fair value remeasurement of our contingent consideration obligations. 2. Hemophilia business separation costsWe have excluded costs that are directly associated with the set up and spin-off of our hemophilia business into an independent, publicly-traded company on February 1, 2017. These costs represent incremental third party costs attributable solely to hemophilia separation and set up activities.3. Restructuring, business transformation and other cost saving initiativesWe exclude costs associated with the company’s execution of certain strategies and initiatives to streamline operations, achieve targeted cost reductions, rationalize manufacturing facilities or refocus R&D activities. These costs may include employee separation costs, retention bonuses, facility closing and exit costs, asset impairment charges or additional depreciation when the expected useful life of certain assets have been shortened due to changes in anticipated usage and other costs or credits that management believes do not have a direct correlation to our on-going or future business operations.4. Loss (gain) on equity security investmentsEffective January 2018 we exclude unrealized and realized gains and losses and discounts or premiums on our equity security investments as we do not believe that these components of income or expense have a direct correlation to our on-going or future business operations.5. Other itemsWe evaluate other items of income and expense on an individual basis, and consider both the quantitative and qualitative aspects of the item, including (i) its size and nature, (ii) whether or not it relates to our ongoing business operations, and (iii) whether or not we expect it to occur as part of our normal business on a regular basis. We also include an adjustment to reflect the related tax effect of all reconciling items within our reconciliation of our GAAP to Non-GAAP net income attributable to Biogen Inc. and diluted earnings per share.
A Amortization of acquired intangible assets for the three and nine months ended September 30, 2018, includes the impact of impairment charges related to certain in‐process research and development (IPR&D) assets associated with our vixotrigine (BIIB074) program totaling $189.3 million.
During the third quarter of 2018 we completed a Phase 2b study for vixotrigine in painful lumbosacral radiculopathy (PLSR). The study did not meet its primary or secondary efficacy endpoints and we will discontinue development in PLSR. As a result, we recognized an impairment charge of approximately $60.0 million during the third quarter of 2018 to reduce the fair value of the IPR&D intangible asset to zero.
In addition, we have delayed the initiation of the Phase 3 studies of vixotrigine in trigeminal neuralgia (TGN) as we await the outcome of ongoing interactions with the U.S. Food and Drug Administration regarding the design of the Phase 3 studies, a more detailed review of the data from the Phase 2b study of vixotrigine in PLSR, and insights from the Phase 2 study of vixotrigine in small fiber neuropathy. We have reassessed the fair value of the TGN program using reduced expected lifetime revenues, higher expected clinical development costs, and a lower cumulative probability of success. As a result, we recognized an impairment charge of $129.3 million during the third quarter of 2018 to reduce the fair value of the TGN IPR&D intangible asset to $41.8 million. We also adjusted the value of our contingent consideration obligations related to this program to reflect the lower cumulative probabilities of success resulting in a gain of $89.6 million in the third quarter of 2018.
We may recognize additional impairment charges in the future depending upon our ability to advance vixotrigine for the treatment of TGN or other indications.
B Amortization of acquired intangible assets impairment and amortization charges related to the intangible asset associated with our U.S. and rest of world licenses to Forward Pharma A/S' (Forward Pharma) intellectual property, including Forward Pharma's intellectual property related to TECFIDERA. In exchange for these licenses, we paid Forward Pharma $1.25 billion in cash, of which $795.2 million was recognized as an intangible asset in the first quarter of 2017.
We have two intellectual property disputes with Forward Pharma, one in the U.S. and one in the European Union, concerning intellectual property related to TECFIDERA. In March 2017 the U.S. intellectual property dispute was decided in our favor. We evaluated the recoverability of the U.S. asset acquired from Forward Pharma and recorded a $328.2 million impairment charge in the first quarter of 2017 to adjust the carrying value of the acquired U.S. asset to fair value reflecting the impact of the developments in the U.S. legal dispute. In March 2018 the European Patent Office revoked Forward Pharma’s European Patent No. 2 801 355. Based upon our assessment of these rulings, we continue to amortize the remaining net book value of the U.S. and rest of world intangible assets in our condensed consolidated statements of income utilizing an economic consumption model.
C In June 2018 we closed a new ten‐year exclusive agreement with Ionis Pharmaceuticals, Inc. (Ionis) to develop novel antisense oligonucleotide drug candidates for a broad range of neurological diseases for a total payment of $1.0 billion consisting of an upfront payment of $375.0 million and the purchase of approximately 11.5 million shares of Ionis' common stock at a cost of $625.0 million.
The 11.5 million shares of Ionis' common stock were purchased at a premium to their fair value at the transaction closing date. The premium consisted of acquiring the shares at a price above the fair value based on the trailing 10‐day weighted‐average close price prior to entering into the agreement in April 2018 and the effect of certain holding period restrictions. We recorded an asset of $462.9 million in investments and other assets in our condensed consolidated balance sheets reflecting the fair value of the common stock and a charge of $162.1 million to research and development expense in our condensed consolidated statements of income during the second quarter of 2018, reflecting the premium paid for the common stock.
D Net distribution to noncontrolling interests reflects the $50.0 million payment to Neurimmune SubOne AG (Neurimmune), net of Neurimmune's tax, to further reduce the previously negotiated royalty rates payable on products developed under our amended collaboration and license agreement, including on potential commercial sales of aducanumab, by an additional 5%.
E 2017 corporate strategy and restructuring charges are related to our efforts to create a leaner and simpler operating model.
F The Tax Cuts and Jobs Act of 2017 (2017 Tax Act), which was signed into law in December 2017, has resulted in significant changes to the U.S. corporate income tax system. During the fourth quarter of 2017 we recognized within our provision for income taxes a $1.2 billion provisional estimate under the U.S. Securities and Exchange Commission Staff Accounting Bulletin No. 118. Our provisional estimate included an amount resulting from a one‐time mandatory deemed repatriation tax on accumulated foreign subsidiaries' previously untaxed foreign earnings (the Transition Toll Tax) and amounts related to the impact of remeasuring our deferred tax balances to reflect other aspects of the 2017 Tax Act.
The final determination of the Transition Toll Tax and remeasurement of our deferred assets and liabilities will be completed as additional information becomes available, but no later than one year from the enactment of the 2017 Tax Act. Our preliminary estimate of the Transition Toll Tax and the remeasurement of our deferred tax assets and liabilities is subject to the finalization of management’s analysis related to certain matters, such as developing interpretations of the provisions of the 2017 Tax Act and changes to certain estimates and amounts related to the earnings and profits of certain subsidiaries.
During the three months ended September 30, 2018, we recognized a net reduction of $34.6 million in our estimated Transition Toll Tax, an expense of $5.1 million to remeasure our deferred tax balances and an $11.0 million expense to reflect other aspects of the 2017 Tax Act. During the nine months ended September 30, 2018, the remeasurement of our deferred tax balances resulted in an expense totaling $12.7 million.