third quarter 2021 newmark group, inc. earnings presentation
TRANSCRIPT

Newmark Group, Inc.Earnings Presentation
THIRD QUARTER 2021
NEWMARK
Disclaimer Forward-Looking StatementsStatements in this document regarding Newmark that are not historical facts are "forward-looking statements" that involve risks and uncertainties, which could cause actual results to differ from those contained in the forward-looking statements. These include statements about the effects of the COVID-19 pandemic on the Company's business, results, financial position, liquidity and outlook, which may constitute forward-looking statements and are subject to the risk that the actual impact may differ, possibly materially, from what is currently expected. Except as required by law, Newmark undertakes no obligation to update any forward-looking statements. For a discussion of additional risks and uncertainties, which could cause actual results to differ from those contained in the forward-looking statements, see Newmark's Securities and Exchange Commission filings, including, but not limited to, the risk factors and Special Note on Forward-Looking Information set forth in these filings and any updates to such risk factors and Special Note on Forward-Looking Information contained in subsequent reports on Form 10-K, Form 10-Q or Form 8-K.Notes Regarding Financial Tables and Metrics Excel files with the Company’s most recent quarterly financial results and metrics from the current period are accessible in the financial results press release at the “Investor Relations” section of http://ir.nmrk.com.
Other ItemsNewmark Group, Inc. (NASDAQ: NMRK) (“Newmark” or “the Company”) generally operates as “Newmark”, or derivations of this name. The discussion of financial results reflects only those businesses owned by the Company and does not include the results for the independently-owned offices that use some variation of the Newmark name in their branding or marketing. Throughout this document, certain percentage changes are described as “NMF” or “not meaningful figure”. Year-over-year decreases in losses are shown as positive changes in the financial tables herein.
Unless otherwise stated, all results discussed in this document compare third quarter 2021 with the relevant year-earlier period. Certain reclassifications may have been made to previously reported amounts to conform to the current presentation and to show results on a consistent basis across periods. Any such changes would have had no impact on consolidated revenues or earnings under GAAP or for Adjusted Earnings, all else being equal unless otherwise noted. Certain numbers in the tables throughout this document may not sum due to rounding. Rounding may have also impacted the presentation of certain year-on-year percentage changes.
Newmark, Grubb & Ellis, ARA, Computerized Facility Integration, Excess Space Retail Services, Inc., Knotel, Deskeo, and Berkeley Point are trademarks/service marks, and/or registered trademarks/service marks and/or service marks of Newmark Group, Inc. and/or its affiliates.
The receipt of shares from Nasdaq, Inc. (“Nasdaq”) is also referred to as the “Earn-out”. Unless otherwise stated, any discussion with respect to the number of shares or dollar amount related to the Earn-out contained herein is based on the price as of the market close on September 30, 2021. For additional information about Newmark’s receipt of Nasdaq shares and related monetization transactions (the “Nasdaq Forwards”), which are a component of other income, see the sections of the Company’s most recent SEC filings on Form 10-Q or Form 10-K titled “Nasdaq Monetization Transactions” and “Exchangeable Preferred Partnership Units and Forward Contract”, as well as any updates regarding these topics in subsequent SEC filings.
Adjusted Earnings and Adjusted EBITDAThis presentation should be read in conjunction with Newmark’s most recent financial results press releases. Unless otherwise stated, throughout this document Newmark refers to its income statement results only on an Adjusted Earnings basis. Newmark may also refer to “Adjusted EBITDA”. U.S. Generally Accepted Accounting Principles is referred to as “GAAP”. The impact of Nasdaq and the 2021 Equity Event are defined and discussed in Newmark’s 3Q21 Financial Results Press Release. Terms such as “GAAP income before income taxes and noncontrolling interests” and "GAAP net income for fully diluted shares“ may be used interchangeably with terms such as “GAAP pre-tax earnings” and “GAAP post-tax earnings”. See the sections of this document including “Non-GAAP Financial Measures”, “Adjusted Earnings Defined”, “Reconciliation of GAAP Net Income Available to Common Stockholders to Adjusted Earnings Before Noncontrolling Interests and Taxes and GAAP Fully Diluted EPS to Post-Tax Adjusted EPS”, “Fully diluted weighted-average share count for GAAP and Adjusted Earnings”, “Adjusted EBITDA Defined”, and “Reconciliation of GAAP Net Income to Adjusted EBITDA”, including any footnotes to these sections, for the complete and updated definitions of these non-GAAP terms and how, when and why management uses them, as well as for the differences between results under GAAP and non-GAAP for the periods discussed herein.
2

NEWMARK
Global Reach | Newmark By The NumbersNEWMARK OVERVIEW
160+ 52$2.5B+ $112.0B
*Newmark’s company-owned offices only, includes trailing twelve months ending September 30, 2021.
Newmark’s company-owned offices and business partners as of September 30, 2021 (except as noted)
6,200CLIENT SERVICE
LOCATIONSCOMPANIES ACQUIRED,
LAST 10 YEARS*
ANNUAL REVENUES* CAPITAL MARKETS AND ORIGINATION VOLUME*
PROFESSIONALS

NEWMARK
Highlights of Consolidated Results
A discussion of GAAP results, Adjusted Earnings, Adjusted EBITDA, and reconciliations of these items, as well as liquidity, to GAAP results are found later in this document, incorporated by reference, and also in our most recent financial results press release and/or are available at http://ir.nmrk.com/.
4
HIGHLIGHTS OF CONSOLIDATED RESULTS ($ IN MILLIONS) 3Q21 3Q20 Change YTD21 YTD20 Change
Revenues $788.1 $435.9 80.8% $1,922.0 $1,303.6 47.4%
GAAP income before income taxes and noncontrolling interests 217.1 132.8 63.5% 999.6 152.6 555.2%
GAAP net income (loss) for fully diluted shares 128.5 103.6 24.1% 595.2 110.4 439.0%
Adjusted Earnings before noncontroling interests and taxes ("Pre-tax AE") 160.6 37.6 327.6% 327.8 98.9 231.4%
Post-tax Adjusted Earnings to fully diluted shareholders ("Post-tax AE") 129.2 31.9 304.5% 266.5 83.5 219.1%
Adjusted EBITDA (AEBITDA) 174.5 53.0 229.3% 372.1 145.1 156.5%
GAAP Net Income per fully diluted share $0.63 $0.39 61.5% $3.06 $0.41 646.3%
Post-tax Adjusted Earnings per share ("AEPS") $0.50 $0.12 316.7% $1.00 $0.32 212.5%

NEWMARK
3Q 2021 Highlights
$788.1MREVENUES
22.1%ADJUSTED
EBITDAMARGIN
$174.5MADJUSTED
EBITDA
$0.50POST-TAX ADJUSTED
EPS
- Record quarterly total revenues of $788.1 million, an increase of 80.8%
- Increased Adjusted EBITDA by 229.3% to $174.5 million, an all-time quarterly high
- Total revenues, Adjusted EBITDA, and Adjusted EPS were 34.3%, 48.6%, and 56.3%
above 3Q 2019 levels, respectively
- Increased 2021 outlook to reflect improving operating performance and continued
market share gains

NEWMARK
Revenue Category Near-Term Trends
Capital Markets
‒ Approximately $385 billion of global dry powder, low interest rates and desire to monetize profits will continue to serve as a catalyst for increased capital markets activity
‒ Multifamily, industrial, and alternative property types (life science, medical office, academics, seniors housing, self storage, etc.) benefitting from high investor demand
‒ Loan sale advisory and “special situations” increasing‒ Debt market originations are diverse and robust, propelled by private debt funds
Leasing & Other Commissions
‒ Life science, logistics and technology industries continue to represent significant portion of demand; retail showing signs of recovery as landlords report higher leasing demand
‒ Short-term renewals giving way to longer-term commitments, driving office leasing activity; leasing pipelines have regenerated and, in some cases, exceed 2019 activity
‒ Major markets are still down from 2019 levels, which represents an opportunity for future growth
Gains from Mortgage Banking Activities/ Origination, net
‒ The Company expects GSE originations will remain robust over the long term, although more stringent FHFA caps dampened industry volumes in 2021
‒ Newmark continues to expand its multifamily debt offerings through greater access to insurance companies, debt funds, banks and other sources of capital
Management Services, Servicing Fees and other
‒ Return to office and structural review of office design and utilization creates significant opportunities for Knotel, which was acquired in March and for Global Corporate Services
‒ Mortgage servicing income expected to continue to grow over time and credit quality remains strong; multifamily servicing revenue is stable in part because it has greater call protection compared to single-family
Sources: Newmark Research, Preqin Real Estate Online
Management Commentary on Business Trends
6

NEWMARK
Leasing and other
commissions29%Gains from mortgage banking
activities / origination, net8%
Capital markets32%
Management services,
servicing fees, and other
31%
114.9
231.5
3Q 2020 3Q 2021
Leasing and other commissions
91.2
60.0
3Q 2020 3Q 2021
Gains from mortgage banking
83.0
252.1
3Q 2020 3Q 2021
Capital markets
146.8
244.5
3Q 2020 3Q 2021
Management services, servicing fees, and other
3Q 2021 Revenue Performance3Q 2021 Revenue 3Q 2021 Revenue Composition1
+101.4%
+203.9%
+66.5%
-34.2%
7
- Total revenues benefited from much stronger demand across all
major property types. In particular, multifamily investment sales and
debt, office led by life science, and industrial
- Management services, servicing fees, and other increased 66.5% to
a new quarterly record as the company continued to focus on
growing these recurring and predictable businesses
- Leasing and other commissions grew 101.4%, led by strong
increases from both tenant and agency clients
- Capital markets grew 203.9% to an all time quarterly high, with
quarterly records in both investment sales and mortgage brokerage
volumes1 The Company’s total revenues include OMSR revenue and pass-through management services revenues. Newmark may refer to these two items together as “non-fee revenue”, and the remainder of its top line as "fee revenues”. In the third quarters of 2021 and 2020, total fee revenues were $633.3 million and $314.8 million, respectively, while non-fee revenues were $154.9 million and $121.1 million. Details on current and historical amounts for fee and non-fee revenues are available in the Company's supplemental Excel tables. Additionally, investment sales, mortgage brokerage, and GSE/FHA multifamily lending revenues are contained in two separate line items: (1) Capital markets (which consists of investment sales and non-originated mortgage brokerage); and (2) Gains from mortgage banking activities/ origination, net (which the Company may also refer to as "GSE/FHA origination" or “agency lending”). The Company’s mix of originations, and therefore revenues, can vary depending on the size of loans, as well by the categories of loans with respect to the FHA, Freddie Mac, and different Fannie Mae structures.

NEWMARK
Newmark Quarterly Volumes
8
1. Newmark’s investment sales figures include investment sales and equity advisory transactions, while mortgage brokerage figures include the Company’s non-originated debt placement transactions, all measured in notional terms. The Company calculates its notional origination volumes based on when loans are rate locked, which is consistent with how revenues are recorded for “Gains from mortgage banking activities/origination, net”. The notional volumes reported by the GSEs are based on when loans are sold and/or securitized, and typically lag those reported by Newmark or estimates from the Mortgage Bankers’ Association ("MBA") by 30 to 45 days. Newmark calculates its GSE market share based on delivery for enhanced comparability. Overall industry investment sales market share and volume data are preliminary and from Real Capital Analytics (“RCA”) and Newmark Research, while any GSE data is from Fannie Mae, Freddie Mac, and Newmark Research. U.S. industry debt volumes are based on the MBA commercial/multifamily origination index.
‒ Newmark again outperformed the industry in U.S. investment sales, as overall U.S. investment sales volumes increased by 151% and total U.S. commercial and multifamily debt originations increased by 119% in 3Q21
‒ On the strength of Newmark's multifamily platform, the Company generated record quarterly debt placement and originations of $11.9 billion, up 125.8%. as the Company continued to help its clients navigate lower GSE loan caps
(IN MILLIONS)
3Q21 3Q20 % Change YTD21 YTD20 % ChangeInvestment Sales 22,949 7,456 207.8% 51,060 25,309 101.7%Mortgage Brokerage 9,391 2,045 359.2% 23,356 7,656 205.1%Total Capital Markets 32,340 9,501 240.4% 74,416 32,965 125.7%
Fannie Mae 1,034 1,621 (36.2)% 2,599 3,530 (26.4)%Freddie Mac 1,386 1,515 (8.5)% 3,396 3,668 (7.4)%FHA / Other 68 79 (13.8)% 109 85 29.1%Total Origination Volume 2,488 3,215 (22.6)% 6,104 7,282 (16.2)%
Total Debt & Capital Markets Volume1 34,828 12,716 173.9% 80,520 40,246 100.1%

NEWMARK
Mortgage Servicing Provides Recurring, High-Margin Revenues
9
1. Newmark earned $135.7mm in servicing fees during the twelve months ended 9/30/2021. In addition to servicing fees, the Company generated $34.6mm of other revenues, for a total of $170.4mm of non-origination revenues related to its GSE/FHA originations business. Other revenues include interest income on loans held for sale. Multifamily mortgage servicing revenue is stable and recurring in part because of greater call protection versus single family mortgages. Approximately 99% of the Company’s GSE loans include prepayment penalties.
Note: Newmark’s agency risk sharing portfolio was $25.5B at 9/30/2021. As of 9/30/2021, the OLTV of the portfolio was 63% and the DSCR was 2.09x. By property type, 97% of the portfolio is multifamily and the remainder is seniors and student housing. 90% of the portfolio was located in suburban markets as of 9/30/2021.
Servicing Portfolio Composition As of 9/30/2021 GSE Portfolio Maturities by Year
‒ Newmark’s ~$70B (+4.9%Y/Y) mortgage servicing portfolio generated $170.4mm1 of high-margin, recurring, and predictable income during the trailing twelve months ended 9/30/2021
‒ As of 9/30/2021, the weighted average maturity of Newmark’s primary servicing portfolio was 7.6 years
‒ Of the GSE loans in Newmark’s servicing portfolio, only ~6% will mature before 2024 and ~77% will mature in 2027 or later
5.7%
17.3%
39.0% 38.0%
2021-23 2024-26 2027-29 2030+
Freddie Mac33%
Fannie Mae36%
FHA/Other7%
Limited Servicing21%
Special Servicing3%
NEWMARK
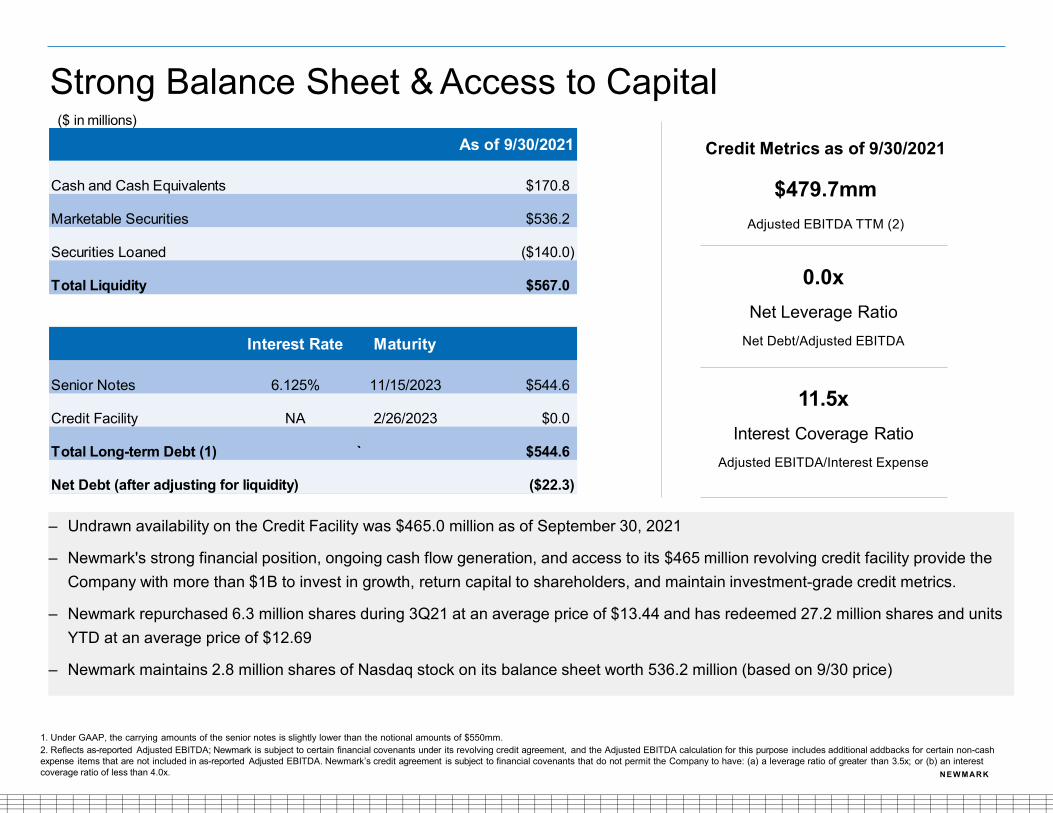
Adjusted EBITDA TTM (2)
0.0xNet Leverage Ratio
Net Debt/Adjusted EBITDA
11.5xInterest Coverage Ratio
Adjusted EBITDA/Interest Expense
1. Under GAAP, the carrying amounts of the senior notes is slightly lower than the notional amounts of $550mm.2. Reflects as-reported Adjusted EBITDA; Newmark is subject to certain financial covenants under its revolving credit agreement, and the Adjusted EBITDA calculation for this purpose includes additional addbacks for certain non-cash expense items that are not included in as-reported Adjusted EBITDA. Newmark’s credit agreement is subject to financial covenants that do not permit the Company to have: (a) a leverage ratio of greater than 3.5x; or (b) an interest coverage ratio of less than 4.0x.
‒ Undrawn availability on the Credit Facility was $465.0 million as of September 30, 2021
‒ Newmark's strong financial position, ongoing cash flow generation, and access to its $465 million revolving credit facility provide the Company with more than $1B to invest in growth, return capital to shareholders, and maintain investment-grade credit metrics.
‒ Newmark repurchased 6.3 million shares during 3Q21 at an average price of $13.44 and has redeemed 27.2 million shares and units YTD at an average price of $12.69
‒ Newmark maintains 2.8 million shares of Nasdaq stock on its balance sheet worth 536.2 million (based on 9/30 price)
Strong Balance Sheet & Access to Capital($ in millions)
Credit Metrics as of 9/30/2021
$479.7mmCash and Cash Equivalents $170.8
Marketable Securities $536.2
Securities Loaned ($140.0)
Total Liquidity $567.0
Interest Rate Maturity
Senior Notes 6.125% 11/15/2023 $544.6
Credit Facility NA 2/26/2023 $0.0
Total Long-term Debt (1) ` $544.6
Net Debt (after adjusting for liquidity) ($22.3)
As of 9/30/2021

NEWMARK
Liquidity Movements Between 2Q 2021 and 3Q 2021
11
1. June 30, 2021 Liquidity2. Adjusted EBITDA3. 2021 Equity Event4. RBC Forward Settlement5. Revolver Repayment
6. Share/unit repurchases/redemptions7. Cash for acquisitions8. Nasdaq Gains9. Working Capital Changes and Other10. September 30, 2021 Liquidity
(USD millions)
Note: Numbers in the table may not sum due to rounding

NEWMARK
‒ Newmark raised its outlook for the full year 2021 and issued guidance for the fourth quarter. All non-GAAP figures are as previously recast.
‒ The Company's guidance still assumes that the Knotel acquisition will be $0.03 to $0.05 dilutive to 2021 AEPS and that it will be breakeven in 2022.
‒ Newmark's guidance excludes the potential impact of any material acquisitions or a significant number of new hires.
‒ This outlook is also subject to change based on various macroeconomic, social, political, and other factors, including the COVID-19 pandemic.
Outlook for 2021
12
Metric (USD in millions, except tax rate) Updated Gudance
Year Earlier Actual
% Change YoY
Previous Guidance
4Q21 Revenues $778 - $828 $601.4 29% - 38% -
4Q21 Adjusted EBITDA $165 - $185 $107.9 53% - 72% -
FY21 Revenues $2,700 - $2,750 $1,905.0 42% - 44% 26% - 31%
FY21 Adjusted EBITDA $537 - $557 $252.9 113% - 120% 64% - 84%

GAAP Financial Results

NEWMARK
Newmark Group, Inc. Condensed Consolidated Statements of Operations (IN THOUSANDS, EXCEPT PER SHARE DATA) (UNAUDITED) (UNDER GAAP)
14
See the following page for per share data.
Revenues: 2021 2020 2021 2020Leasing and other commissions 231,532$ 114,947$ 563,311$ 375,465$ Capital Markets 252,095 82,956 558,254 263,838
Commissions 483,627 197,903 1,121,565 639,303 Gains from mortgage banking activities/origination, net 60,030 91,192 148,683 210,686 Management services, servicing fees and other 244,469 146,829 651,729 453,583
Total revenues 788,126 435,924 1,921,977 1,303,572
Expenses:Compensation and employee benefits 444,408 253,908 1,274,879 784,684 Equity-based compensation and allocations of net income to limited partnership units and FPUs 33,963 50,769 315,743 74,544 Total compensation and employee benefits 478,371 304,677 1,590,622 859,228
Operating, administrative and other 152,363 61,790 394,546 215,083 Fees to related parties 5,664 6,109 17,696 17,126 Depreciation and amortization 28,883 29,627 80,804 104,613
Total non-compensation expenses 186,910 97,526 493,046 336,822 Total operating expenses 665,281 402,203 2,083,668 1,196,050
Other income, net: Other income (loss), net 102,720 108,608 1,187,322 73,657
Total other income (loss), net 102,720 108,608 1,187,322 73,657
Income from operations 225,565 142,328 1,025,631 181,179 Interest expense, net (8,498) (9,531) (26,034) (28,617) Income before income taxes and noncontrolling interests 217,067 132,797 999,597 152,562
Provision for income taxes 53,811 33,272 206,572 38,158 Consolidated net income 163,256 99,525 793,025 114,404
Less: Net income attributable to noncontrolling interests 34,707 24,176 191,627 30,563
Net income available to common stockholders 128,549$ 75,349$ 601,398$ 83,841$
Three Months Ended September 30, Nine Months Ended September 30,

NEWMARK
Newmark Group, Inc. Condensed Consolidated Statements of Operations (continued)(IN THOUSANDS, EXCEPT PER SHARE DATA) (UNAUDITED) (UNDER GAAP)
15
Per share data: Basic earnings per share Net income available to common stockholders (1) 128,549$ 72,101$ 595,198$ 75,703$ Basic earnings per share 0.64$ 0.40$ 3.14$ 0.42$ Basic weighted-average shares of common stock outstanding 199,413 179,501 189,317 178,527
Fully diluted earnings per share Net income for fully diluted shares (1) 128,549$ 103,623$ 595,198$ 110,422$ Fully diluted earnings per share 0.63$ 0.39$ 3.06$ 0.41$
Fully diluted weighted-average shares of common stock outstanding 205,281 266,973 194,320 265,104
Dividends declared per share of common stock 0.01$ 0.01$ 0.03$ 0.12$ Dividends paid per share of common stock 0.01$ 0.01$ 0.03$ 0.12$
(1) Includes a reduction for dividends on preferred stock or exchangeable preferred partnership units of $0.0 million and $6.2 million for the three months and nine months ended September 30, 2021, respectively, and $3.2 million and $8.1 million for the three and nine months ended September 30, 2020, respectively. (see Note 1 - and Basis of Presentation" in the Company's most recently filed Form 10-Q or Form 10-K.)
2021 2020 2021 2020Three Months Ended September 30, Nine Months Ended September 30,

NEWMARK
Newmark Group, Inc. Condensed Consolidated Balance Sheets (IN THOUSANDS) (UNAUDITED) (UNDER GAAP)
16
AssetsCurrent Assets:
Cash and cash equivalents 170,752$ 191,448$ Restricted cash 74,453 66,951 Marketable securities 536,154 33,283 Loans held for sale, at fair value 1,200,192 1,086,805 Receivables, net 514,392 376,795 Other current assets 115,228 63,790
Total current assets 2,611,171 1,819,072 Goodwill 651,695 560,332 Mortgage servicing rights, net 533,923 494,729 Loans, forgivable loans and other receivables from employees and partners, net 449,746 454,270 Right-of-use assets 642,825 190,469 Fixed assets, net 133,569 96,367 Other intangible assets, net 71,825 44,289 Other assets 238,411 322,922
Total assets 5,333,165$ 3,982,450$
Liabilities, Redeemable Partnership Interest, and Equity:Current Liabilities:
Warehouse facilities collateralized by U.S. Government Sponsored Enterprises 1,184,329 1,061,202$ Accrued compensation 393,631 279,872 Accounts payable, accrued expenses and other liabilities 579,966 326,548 Securities loaned 140,000 33,278 Payables to related parties 7,347 4,392
Total current liabilities 2,305,273 1,705,292 Long-term debt 544,615 680,385 Right-of-use liabilities 618,149 218,629 Other long-term liabilities 218,516 436,952
Total liabilities 3,686,553 3,041,258
Total equity (1) 1,646,612 941,192 Total liabilities, redeemable partnership interest, and equity 5,333,165$ 3,982,450$
(1) Includes "redeemable partnership interests," "noncontrolling interests" and "total stockholders' equity."
December 31, 2020
September 30, 2021

NEWMARK
Newmark Group, Inc. Summarized Condensed Consolidated Statements of Cash Flows (IN THOUSANDS) (UNAUDITED) (UNDER GAAP)
17
2021 2020 2021 2020
Net cash provided by (used in) operating activities (1,111,699)$ (385,955)$ (326,557)$ (1,341,049)$ Net cash (used in) provided by investing activities 438,208 (4,058) 423,988 12,506 Net cash (used in) provided by financing activities 681,049 359,537 (110,625) 1,443,334 Net increase (decrease) in cash and cash equivalents and restricted cash 7,558 (30,476) (13,194) 114,791 Cash and cash equivalents and restricted cash at beginning of period 237,647 367,138 258,399 221,872 Cash and cash equivalents and restricted cash at end of period 245,205$ 336,662$ 245,205$ 336,663$
Net cash (used in) provided by operating activity excluding loan originations and sales (1) (327,498)$ 62,351$ (213,170)$ (18,604)$
For the Three Months Ended September 30,
For the Nine Months Ended September 30,
The Condensed Consolidated Statements of Cash Flows are presented in summarized form. For complete Unaudited Condensed Consolidated Statements of Cash Flows, please refer to Newmark's Quarterly Report on Form 10-K for the twelve months ended December 30, 2020, to be filed with the Securities and Exchange Commission in the near future.
Includes payments for new hires and producers in the amount of $0.9 million and $11.9 million for the three and nine months ended September 30, 2021, respectively and $6.5 million and $69.0 million for the three and nine months ended September 30, 2020, respectively.
(1) Reflects $484.4 million of cash used with respect to the 2021 Equity Event. Of this amount, $203.4 million related to the 16.3 million reduction in fully diluted shares, and $280.9 million related to amounts paid on behalf of, or to partners for withholding taxes related to unit exchanges and/or redemptions, cash paid for redemption of HDUs, and other items. But for these uses of cash, net cash provided by operating activities excluding loan originations and sales would have been $156.9 million and $271.2 million, respectively, in the three and nine months ended September 30, 2021.

Appendix

NEWMARK
Newmark Operating Model
1. Includes Leasing and other commissions, Capital markets, Origination fees, and Valuation and Advisory.2. Includes fees from mortgage servicing, property management, project management, facility management, underwriting, consulting, and interest income on loans held for sale.3. Non-fee revenues include all pass-through revenues related to Newmark’s management services businesses and OMSR revenue. Costs related to non-fee revenues include pass-through costs
related to Newmark’s management services business.4. Represents a percentage of Commission-based Revenue and excludes equity-based compensation, which is consistent with the Company’s Adjusted Earnings methodology.5. Includes non-commission compensation, non-compensation expenses (but excludes equity-based compensation), employee loan amortization, and interest expense on loans held for sale.6. Adjusted Earnings calculations exclude non-cash GAAP gains attributable to OMSRs. Under GAAP, Newmark recognizes OMSRs equal to the fair value of servicing rights retained on mortgage loans
originated and sold. 7. Primarily Nasdaq dividend income related to 28 million shares held as of 9/30/2021 and Real Estate Joint Venture-related earnings.
(IN MILLIONS)
19
3Q21 3Q20 Change
Commission-Based Revenues1 552.0 253.4 117.8%Management Fees & Other Revenue2 81.3 61.4 32.3%Non-Fee Revenues3 154.9 121.1 27.9%Total Revenue 788.1 435.9 80.8%
Commission-Based Compensation4 283.0 126.2 124.1%Support and Operational Expenses5 182.7 134.0 36.4%Costs Related to Non-Fee Revenues3 121.2 60.2 101.5%Total Expenses for Adjusted Earnings 586.8 320.4 83.2%
Other Items:Non-cash adjustment for OMSR revenue6 (33.6) (60.9) (44.8)%Other Income7 1.5 (7.5) (119.8)%Interest Expense, Net (8.5) (9.5) (10.7)%
Pre-Tax Adjusted Earnings 160.6 37.6 327.6%
Adjustments:Interest Expense 10.3 11.8 (12.6)%Depreciation & Amortization 3.7 3.7 (0.7)%
Adjusted EBITDA 174.5 53.0 229.3%

NEWMARK
Newmark Group, Inc. Fully Diluted Period-End Share Count Summary
1. In conjunction with the spin-off of Newmark, the limited partnership units are owned by employees of both Newmark and BGC. Over time, virtually all of the partners of Newmark are expected to only own units and/or shares of Newmark and virtually all of the partners of BGC are expected to only own units and/or shares of BGC. From 1Q 2018 onwards, partners of Newmark are compensated with Newmark partnership units and partners of BGC are compensated with BGC partnership units.
2. These primarily represent contingent shares and/or units for which all necessary conditions have been satisfied except for the passage of time.
AS OF SEPTEMBER 30, 2021
20
Fully-Diluted Shares (millions) Ownership (%)
Class A owned by Public 152.3 60%Limited partnership units owned by employees1 27.4 11%Class A owned by employees 22.1 9%Other owned by employees2 6.2 2%Partnership Units owned by Cantor 23.6 9%Class B owned by Cantor 21.3 8%Total 252.9 100%
Fully-Diluted Shares (millions) Ownership (%)
Public 152.3 60%Employees 55.7 22%Cantor 44.9 18%Total 252.9 100%

NEWMARK
0%
2%
4%
6%
8%
10%
12%
14%
$0
$10
$20
$30
$40
$50
$60
$70
$80
2015 2016 2017 2018 2019 2020 TTM 3Q21
Market Share (%
)Tr
ansa
ctio
n Vo
lum
e ($
Bn)
Debt Originations Investment Sales Debt Market Share IS Market Share
Newmark Has A Proven Track Record of Gaining Market Share
21
Note: “Debt originations” includes Newmark’s non-originated mortgage brokerage volume plus GSE/FHA origination volume, while the comparable industry statistics are U.S. financing volumes. Source for industry data: Newmark Research, Real Capital Analytics financing except 3Q2021 industry debt volumes, which is based on the Mortgage Bankers’Association commercial/multifamily origination index
– Comparing 2015 to the trailing twelve months ended September 30, 2021:
Industry U.S. debt originations have grown 23.5%, while Newmark has expanded its total debt volumes by 325.5%
U.S. investment sales volumes have increased 9.4%, while Newmark grew its volumes by 284.6%
– Newmark continued to gain market share in 3Q 2021 as it grew investment sales volumes by 208%, while total debt volumes increased by 126%, compared to the industry which saw U.S. investment sales volumes and debt originations increase by approximately 151% and 119%, respectively

NEWMARK
Projected Commercial Mortgage Maturities
22
Source: Newmark Research, Trepp
$0
$100
$200
$300
$400
$500
$600
2001 2002 2003 2004 2005 2006 2007 2008 2009 2010 2011 2012 2013 2014 2015 2016 2017 2018 2019 2020 2021 2022 2023 2024 2025
$ IN
BIL
LIO
NS
Banks CMBS Life Insurance GSE Other
$2.3TR ILL ION
‒ More than $2.3 trillion in commercial mortgage maturities from 2021 – 2025 should support strong levels of refinancing activity.

NEWMARK
Cap Rates Remain Attractive Spread over UST
23
Source: Newmark Research, Real Capital Analytics ($25M+ Transactions), Federal Reserve Bank of St. Louis, and Bloomberg
‒ National cap rates have compressed by 21 basis points year-over-year, reaching 4.88% on average in 3Q21. This in part due to the pent-up investor demand for multifamily, industrial and life science product and record levels of fund dry powder.
‒ Commercial real estate yields currently offer a 336 basis point premium to the 10-year U.S. Treasury Note, one basis point above the long-term average spread. While the Treasury Rate has increased from its record low in 2Q20, it remains well below the 20-year average of 3.00%.
Historical U.S. Cap Rate Yield Spread Over 10-Year U.S. Treasuries
0
100
200
300
400
500
600
0%
2%
4%
6%
8%
10%
2002 2003 2004 2005 2006 2007 2008 2009 2010 2011 2012 2013 2014 2015 2016 2017 2018 2019 2020 2021
SP
RE
AD
(B
PS
)
CA
P R
AT
E
Yield Spread Cap Rates, All Property Types 10-Year Treasury Rate 2002-3Q21 Avg.
3Q 2021 Yield Spread: 336 bps

Non-GAAPDefinitions and Reconciliation Tables
NEWMARK
Non-GAAP Financial Measures
Non-GAAP Financial MeasuresThis document contains non-GAAP financial measures that differ from the most directly comparable measures calculated and presented in accordance with Generally Accepted Accounting Principles in the United States ("GAAP"). Non-GAAP financial measures used by the Company include "Adjusted Earnings before noncontrolling interests and taxes", which is used interchangeably with "pre-tax Adjusted Earnings"; "Post-tax Adjusted Earnings to fully diluted shareholders", which is used interchangeably with "post-tax Adjusted Earnings"; "Adjusted EBITDA"; and "Liquidity". The definitions of these terms are below.
Adjusted Earnings DefinedNewmark uses non-GAAP financial measures, including “Adjusted Earnings before noncontrolling interests and taxes” and “Post-tax Adjusted Earnings to fully diluted shareholders”, which are supplemental measures of operating results used by management to evaluate the financial performance of the Company and its consolidated subsidiaries. Newmark believes that Adjusted Earnings best reflect the operating earnings generated by the Company on a consolidated basis and are the earnings which management considers when managing its business. As compared with “Income (loss) before income taxes and noncontrolling interests” and “Net income (loss) for fully diluted shares”, both prepared in accordance with GAAP, Adjusted Earnings calculations primarily exclude certain non-cash items and other expenses that generally do not involve the receipt or outlay of cash by the Company and/or which do not dilute existing stockholders. In addition, Adjusted Earnings calculations exclude certain gains and charges that management believes do not best reflect the ordinary results of Newmark. Adjusted Earnings is calculated by taking the most comparable GAAP measures and making adjustments for certain items with respect to compensation expenses, non-compensation expenses, and other income, as discussed below. Calculations of Compensation Adjustments for Adjusted Earnings and Adjusted EBITDA
CALCULATIONS OF COMPENSATION ADJUSTMENTS FOR ADJUSTED EARNINGS AND ADJUSTED EBITDATreatment of Equity-Based Compensation under Adjusted Earnings and Adjusted EBITDAThe Company’s Adjusted Earnings and Adjusted EBITDA measures exclude all GAAP charges included in the line item “Equity based compensation and allocations of net income to limited partnership units and FPUs” (or “equity-based compensation” for purposes of defining the Company’s non-GAAP results) as recorded on the Company’s GAAP Consolidated Statements of Operations and GAAP Consolidated Statements of Cash Flows. These GAAP equity-based compensation charges reflect the following items:
– Charges with respect to grants of exchangeability, which reflect the right of holders of limited partnership units with no capital accounts, such as LPUs and PSUs, to exchange these units into shares of common stock, or into partnership units with capital accounts, such as HDUs, as well as cash paid with respect to taxes withheld or expected to be owed by the unit holder upon such exchange. The withholding taxes related to the exchange of certain non-exchangeable units without a capital account into either common shares or units with a capital account may be funded by the redemption of preferred units such as PPSUs.
– Charges with respect to preferred units. Any preferred units would not be included in the Company’s fully diluted share count because they cannot be made exchangeable into shares of common stock and are entitled only to a fixed distribution. Preferred units are granted in connection with the grant of certain limited partnership units that may be granted exchangeability or redeemed in connection with the grant of shares of common stock at ratios designed to cover any withholding taxes expected to be paid. This is an acceptable alternative to the common practice among public companies of issuing the gross amount of shares to employees, subject to cashless withholding of shares, to pay applicable withholding taxes.
– GAAP equity-based compensation charges with respect to the grant of an offsetting amount of common stock or partnership units with capital accounts in connection with the redemption of non-exchangeable units, including PSUs and LPUs.
– Charges related to amortization of RSUs and limited partnership units.
– Charges related to grants of equity awards, including common stock or partnership units with capital accounts.
– Allocations of net income to limited partnership units and FPUs. Such allocations represent the pro-rata portion of post-tax GAAP earnings available to such unit holders.
25
NEWMARK
Non-GAAP Financial Measures (continued)
The amount of certain quarterly equity-based compensation charges is based upon the Company's estimate of such expected charges during the annual period, as described further below under "Methodology for Calculating Adjusted Earnings Taxes".
Virtually all of Newmark's key executives and producers have equity or partnership stakes in the Company and its subsidiaries and generally receive deferred equity or limited partnership units as part of their compensation. A significant percentage of Newmark's fully diluted shares are owned by its executives, partners and employees. The Company issues limited partnership units as well as other forms of equity-based compensation, including grants of exchangeability into shares of common stock, to provide liquidity to its employees, to align the interests of its employees and management with those of common stockholders, to help motivate and retain key employees, and to encourage a collaborative culture that drives cross-selling and growth.
All share equivalents that are part of the Company's equity-based compensation program, including REUs, PSUs, LPUs, certain HDUs, and other units that may be made exchangeable into common stock, as well as RSUs (which are recorded using the treasury stock method), are included in the fully diluted share count when issued or at the beginning of the subsequent quarter after the date of grant. Generally, limited partnership units other than preferred units are expected to be paid a pro-rata distribution based on Newmark's calculation of Adjusted Earnings per fully diluted share.
Certain Other Compensation-Related Items under Adjusted Earnings and Adjusted EBITDANewmark also excludes various other GAAP items that management views as not reflective of the Company's underlying performance for the given period from its calculation of Adjusted Earnings and Adjusted EBITDA. These may include compensation-related items with respect to cost-saving initiatives, such as severance charges incurred in connection with headcount reductions as part of broad restructuring and/or cost savings plans. The Company also excludes compensation charges related to non-cash GAAP gains attributable to originated mortgage servicing rights (which Newmark refers to as "OMSRs") because these gains are also excluded from Adjusted Earnings and Adjusted EBITDA.
Excluded Compensation-Related Items to Related to the 2021 Equity Event under Adjusted Earnings and Adjusted EBITDA (Beginning in Third Quarter 2021, as updated)
Newmark does not view the GAAP compensation charges related to 2021 Equity Event that were not equity-based compensation as being reflective of its ongoing operations (the "Impact of the 2021 Equity Event"). These consisted of charges relating to cash paid to independent contractors for their withholding taxes and the cash redemption of HDUs. These were recorded as expenses based on Newmark's current non-GAAP results, but will be excluded in the recast non-GAAP results beginning in the third quarter of 2021 for the following reasons:
– But for the 2021 Equity Event, the items comprising such charges would have otherwise been settled in shares and been recorded as equity-based compensation in future periods. Had this occurred, such amounts would have been excluded from Adjusted Earnings and Adjusted EBITDA, and would also have resulted in higher fully diluted share counts, all else equal.
– Newmark views the fully diluted share count reduction to be economically similar to the common practice among public companies of issuing the net amount of common shares to employees for their vested stock-based compensation, selling a portion of the gross shares pay applicable withholding taxes, and separately making open market repurchases of common shares.
– There was nothing comparable to the 2021 Equity Event in 2020 and nothing similar is currently contemplated after 2021.
26
NEWMARK
Non-GAAP Financial Measures (continued)
Calculation of Non-Compensation Expense Adjustments for Adjusted Earnings Newmark's calculation of pre-tax Adjusted Earnings excludes non-cash GAAP charges related to the following:
– Amortization of intangibles with respect to acquisitions.
– Amortization of mortgage servicing rights (which Newmark refers to as "MSRs"). Under GAAP, the Company recognizes OMSRs equal to the fair value of servicing rights retained on mortgage loans originated and sold. Subsequent to the initial recognition at fair value, MSRs are carried at the lower of amortized cost or fair value and amortized in proportion to the net servicing revenue expected to be earned. However, it is expected that any cash received with respect to these servicing rights, net of associated expenses, will increase Adjusted Earnings and Adjusted EBITDA in future periods.
– Various other GAAP items that management views as not reflective of the Company's underlying performance for the given period, including non-compensation-related charges incurred as part of broad restructuring and/or cost savings plans. Such GAAP items may include charges for exiting leases and/or other long-term contracts as part of cost-saving initiatives, as well as non-cash impairment charges related to assets, goodwill and/or intangibles created from acquisitions.
– Various other GAAP items that management views as not reflective of the Company’s underlying performance for the given period. These may include compensation-related items with respect to cost-saving initiatives, such as severance charges incurred in connection with headcount reductions as part of broad restructuring and/or cost savings plans; charges for exiting leases and/or other long-term contracts as part of cost-saving initiatives; and non-cash impairment charges related to assets, goodwill and/or intangibles created from acquisitions
Non-Cash Adjustment Related to Originated Mortgage Servicing Rights for Adjusted EarningsNewmark’s calculation of pre-tax Adjusted Earnings excludes non-cash GAAP gains attributable to originated mortgage servicing rights (which Newmark refers to as "OMSRs"). As previously disclosed, beginning in the fourth quarter of 2020, OMSRs are no longer included in non-compensation adjustments for Adjusted Earnings but instead shown as a separate line item in the Company's “Reconciliation of GAAP Net Income Available to Common Stockholders to Adjusted Earnings Before Noncontrolling Interests and Taxes and GAAP Fully Diluted EPS to Post-Tax Adjusted EPS”. This presentation has no impact on previously reported Adjusted Earnings.
Calculation of Other (income) losses for Adjusted Earnings and Adjusted EBITDA (Beginning in Third Quarter 2021, as Updated)Adjusted Earnings calculations also exclude certain other non-cash, non-dilutive, and/or non-economic items, which may, in some periods, include:
– Unusual, one-time, non-ordinary or non-recurring gains or losses;
– Non-cash GAAP asset impairment charges;
– The impact of any unrealized non-cash mark-to-market gains or losses on "Other income (loss)" related to the variable share forward agreements with respect to Newmark's expected receipt of the Nasdaq payments in 2021 and 2022 and the recently settled 2020 Nasdaq payment (the "Nasdaq Forwards");
– Mark-to-market adjustments for non-marketable investments;
– Certain other non-cash, non-dilutive, and/or non-economic items.
Due to the recent sale of Nasdaq’s U.S. fixed income business, the Nasdaq Earn-out and related Forward settlements were accelerated, less certain previously disclosed adjustments. Because these shares were originally expected to be received over a 15 year period ending in 2027, the Earn-out has been included in calculations of Adjusted Earnings and Adjusted EBITDA. Due to the acceleration of the Earn-out and the Nasdaq Forwards, the Company now views results excluding items related to the Earn-out to be a better reflection of the underlying performance of Newmark’s ongoing operations. Therefore, beginning with the third quarter of 2021, other (income) losses for Adjusted Earnings and Adjusted EBITDA will also exclude the impact of the below items, which may collectively be referred to as the "Impact of Nasdaq".
27

NEWMARK
Non-GAAP Financial Measures (continued)
– Realized gains related to the accelerated receipt on June 25, 2021 of Nasdaq shares.
– Realized gains or losses and unrealized mark-to-market gains or losses with respect to Nasdaq shares received prior to the Earn-out acceleration.
– Dividend income on Nasdaq shares.
– The impact of any unrealized non-cash mark-to-market gains or losses on “Other income (loss)” related to the variable share forward agreements with respect to Newmark’s expected receipt of the Nasdaq payments in 2021 and 2022 and the recently settled 2020 Nasdaq payment (the “Nasdaq Forwards”). This item was historically excluded under the previous non-GAAP definitions.
– Other items related to the Earn-out.
Methodology for Calculating Adjusted Earnings Taxes Although Adjusted Earnings are calculated on a pre-tax basis, Newmark also reports post-tax Adjusted Earnings to fully diluted shareholders. The Company defines post-tax Adjusted Earnings to fully diluted shareholders as pre-tax Adjusted Earnings reduced by the non-GAAP tax provision described below and net income (loss) attributable to noncontrolling interest for Adjusted Earnings.
The Company calculates its tax provision for post-tax Adjusted Earnings using an annual estimate similar to how it accounts for its income tax provision under GAAP. To calculate the quarterly tax provision under GAAP, Newmark estimates its full fiscal year GAAP income before noncontrolling interests and taxes and the expected inclusions and deductions for income tax purposes, including expected equity-based compensation during the annual period. The resulting annualized tax rate is applied to Newmark's quarterly GAAP income before income taxes and noncontrolling interests. At the end of the annual period, the Company updates its estimate to reflect the actual tax amounts owed for the period.
To determine the non-GAAP tax provision, Newmark first adjusts pre-tax Adjusted Earnings by recognizing any, and only, amounts for which a tax deduction applies under applicable law. The amounts include charges with respect to equity-based compensation; certain charges related to employee loan forgiveness; certain net operating loss carryforwards when taken for statutory purposes; and certain charges related to tax goodwill amortization. These adjustments may also reflect timing and measurement differences, including treatment of employee loans; changes in the value of units between the dates of grants of exchangeability and the date of actual unit exchange; variations in the value of certain deferred tax assets; and liabilities and the different timing of permitted deductions for tax under GAAP and statutory tax requirements.
After application of these adjustments, the result is the Company's taxable income for its pre-tax Adjusted Earnings, to which Newmark then applies the statutory tax rates to determine its non-GAAP tax provision. Newmark views the effective tax rate on pre-tax Adjusted Earnings as equal to the amount of its non-GAAP tax provision divided by the amount of pre-tax Adjusted Earnings.
Generally, the most significant factor affecting this non-GAAP tax provision is the amount of charges relating to equity-based compensation. Because the charges relating to equity-based compensation are deductible in accordance with applicable tax laws, increases in such charges have the effect of lowering the Company's non-GAAP effective tax rate and thereby increasing its post-tax Adjusted Earnings.
Newmark incurs income tax expenses based on the location, legal structure and jurisdictional taxing authorities of each of its subsidiaries. Certain of the Company's entities are taxed as U.S. partnerships and are subject to the Unincorporated Business Tax ("UBT") in New York City. Any U.S. federal and state income tax liability or benefit related to the partnership income or loss, with the exception of UBT, rests with the unit holders rather than with the partnership entity. The Company's consolidated financial statements include U.S. federal, state and local income taxes on the Company's allocable share of the U.S. results of operations. Outside of the U.S., Newmark is expected to operate principally through subsidiary corporations subject to local income taxes. For these reasons, taxes for Adjusted Earnings are expected to be presented to show the tax provision the consolidated Company would expect to pay if 100% of earnings were taxed at global corporate rates.
28

NEWMARK
Non-GAAP Financial Measures (continued)
Calculations of Pre- and Post-Tax Adjusted Earnings per ShareNewmark’s pre-tax Adjusted Earnings and post-tax Adjusted Earnings per share calculations assume either that:
– The fully diluted share count includes the shares related to any dilutive instruments, but excludes the associated expense, net of tax, when the impact would be dilutive; or
– The fully diluted share count excludes the shares related to these instruments, but includes the associated expense, net of tax.
The share count for Adjusted Earnings excludes certain shares and share equivalents expected to be issued in future periods but not yet eligible to receive dividends and/or distributions. Each quarter, the dividend payable to Newmark's stockholders, if any, is expected to be determined by the Company's Board of Directors with reference to a number of factors, including post-tax Adjusted Earnings per share. Newmark may also pay a pro-rata distribution of net income to limited partnership units, as well as to Cantor for its noncontrolling interest. The amount of this net income, and therefore of these payments per unit, would be determined using the above definition of Adjusted Earnings per share on a pre-tax basis.
The declaration, payment, timing and amount of any future dividends payable by the Company will be at the discretion of its Board of Directors using the fully diluted share count. In addition, the non-cash preferred dividends are excluded from Adjusted Earnings per share as Newmark expects to redeem the related exchangeable preferred limited partnership units ("EPUs") with Nasdaq shares. For more information on any share count adjustments, see the table in this document and/or the Company’s most recent financial results release titled "Fully Diluted Weighted-Average Share Count for GAAP and Adjusted Earnings".
Management Rationale for Using Adjusted EarningsNewmark's calculation of Adjusted Earnings excludes the items discussed above because they are either non-cash in nature, because the anticipated benefits from the expenditures are not expected to be fully realized until future periods, or because the Company views results excluding these items as a better reflection of the underlying performance of Newmark's ongoing operations. Management uses Adjusted Earnings in part to help it evaluate, among other things, the overall performance of the Company's business, to make decisions with respect to the Company's operations, and to determine the amount of dividends payable to common stockholders and distributions payable to holders of limited partnership units. Dividends payable to common stockholders and distributions payable to holders of limited partnership units are included within "Distributions to stockholders" and "Earnings distributions to limited partnership interests and noncontrolling interests," respectively, in our unaudited, condensed, consolidated statements of cash flows.
The term "Adjusted Earnings" should not be considered in isolation or as an alternative to GAAP net income (loss). The Company views Adjusted Earnings as a metric that is not indicative of liquidity, or the cash available to fund its operations, but rather as a performance measure. Pre- and post-tax Adjusted Earnings, as well as related measures, are not intended to replace the Company's presentation of its GAAP financial results. However, management believes that these measures help provide investors with a clearer understanding of Newmark's financial performance and offer useful information to both management and investors regarding certain financial and business trends related to the Company's financial condition and results of operations. Management believes that the GAAP and Adjusted Earnings measures of financial performance should be considered together.
For more information regarding Adjusted Earnings, see the sections of Exhibit 99.1 to this Current Report on Form 8-K and/or the Company’s most recent financial results press release titled “Reconciliation of GAAP Income to Adjusted Earnings and GAAP Fully Diluted EPS to Post-tax Adjusted EPS”, including the related footnotes, for details about how Newmark’s non-GAAP results are reconciled to those under GAAP.
29

NEWMARK
Non-GAAP Financial Measures (continued)
Adjusted EBITDA DefinedNewmark also provides an additional non-GAAP financial performance measure, "Adjusted EBITDA", which it defines as GAAP "Net income (loss) available to common stockholders", adjusted for the following items:
– Net income (loss) attributable to noncontrolling interest;
– Provision (benefit) for income taxes;
– OMSR revenue;
– MSR amortization;
– Compensation charges related to OMSRs.
– Other depreciation and amortization;
– Equity-based compensation and allocations of net income to limited partnership units and FPUs;
– Various other GAAP items that management views as not reflective of the Company’s underlying performance for the given period. These may include compensation-related items with respect to cost-saving initiatives, such as severance charges incurred in connection with headcount reductions as part of broad restructuring and/or cost savings plans; charges for exiting leases and/or other long-term contracts as part of cost-saving initiatives; and non-cash impairment charges related to assets, goodwill and/or intangibles created from acquisitions.
– Other non-cash, non-dilutive, and/or non-economic items, which may, in certain periods, include the impact of any unrealized non-cash mark-to-market gains or losses on "other income (loss)" related to the variable share forward agreements with respect to Newmark's expected receipt of the Nasdaq payments in 2021 and 2022 and the recently settled 2020 Nasdaq payment (the "Nasdaq Forwards"), as well as mark-to-market adjustments for non-marketable investments; and
– Interest expense.
Beginning with the third quarter of 2021, calculation of Adjusted EBITDA will also exclude the "Impact of Nasdaq" and the "Impact of the 2021 Equity Event", which are defined in the above slides. Newmark’s calculation of Adjusted EBITDA excludes certain items discussed above because they are either non-cash in nature, because the anticipated benefits from the expenditures are not expected to be fully realized until future periods, or because the Company views excluding these items as a better reflection of the underlying performance Newmark’s ongoing operations. The Company's management believes that its Adjusted EBITDA measure is useful in evaluating Newmark's operating performance, because the calculation of this measure generally eliminates the effects of financing and income taxes and the accounting effects of capital spending and acquisitions, which would include impairment charges of goodwill and intangibles created from acquisitions. Such items may vary for different companies for reasons unrelated to overall operating performance. As a result, the Company's management uses this measure to evaluate operating performance and for other discretionary purposes. Newmark believes that Adjusted EBITDA is useful to investors to assist them in getting a more complete picture of the Company's financial results and operations.
Since Newmark's Adjusted EBITDA is not a recognized measurement under GAAP, investors should use this measure in addition to GAAP measures of net income when analyzing Newmark's operating performance. Because not all companies use identical EBITDA calculations, the Company's presentation of Adjusted EBITDA may not be comparable to similarly titled measures of other companies. Furthermore, Adjusted EBITDA is not intended to be a measure of free cash flow or GAAP cash flow from operations because the Company's Adjusted EBITDA does not consider certain cash requirements, such as tax and debt service payments.
For more information regarding Adjusted EBITDA, see the section of Exhibit 99.1 to this Current Report on Form 8-K and/or the Company’s most recent financial results press release titled “Reconciliation of GAAP Income to Adjusted EBITDA”, including the related footnotes, for details about how Newmark’s non-GAAP results are reconciled to those under GAAP EPS.
30

NEWMARK
Non-GAAP Financial Measures (continued)
Timing of Outlook for Certain GAAP and Non-GAAP ItemsNewmark anticipates providing forward-looking guidance for GAAP revenues and for certain non-GAAP measures from time to time. However, the Company does not anticipate providing an outlook for other GAAP results. This is because certain GAAP items, which are excluded from Adjusted Earnings and/or Adjusted EBITDA, are difficult to forecast with precision before the end of each period. The Company therefore believes that it is not possible for it to have the required information necessary to forecast GAAP results or to quantitatively reconcile GAAP forecasts to non-GAAP forecasts with sufficient precision without unreasonable efforts. For the same reasons, the Company is unable to address the probable significance of the unavailable information. The relevant items that are difficult to predict on a quarterly and/or annual basis with precision and may materially impact the Company's GAAP results include, but are not limited, to the following:
‒ Certain equity-based compensation charges that may be determined at the discretion of management throughout and up to the period-end;
‒ Unusual, one-time, non-ordinary, or non-recurring items:
‒ The impact of gains or losses on certain marketable securities, as well as any gains or losses related to associated mark-to- market movements and/or hedging including with respect to the Nasdaq Forwards. These items are calculated using period-end closing prices;
‒ Non-cash asset impairment charges, which are calculated and analyzed based on the period-end values of the underlying assets. These amounts may not be known until after period-end;
‒ Acquisitions, dispositions and/or resolutions of litigation, which are fluid and unpredictable in nature.
Liquidity DefinedNewmark may also use a non-GAAP measure called "liquidity". The Company considers liquidity to be comprised of the sum of cash and cash equivalents, marketable securities, and reverse repurchase agreements (if any), less securities lent out in securities loaned transactions and repurchase agreements. The Company considers liquidity to be an important metric for determining the amount of cash that is available or that could be readily available to the Company on short notice.
For more information regarding liquidity, see the section of Exhibit 99.1 to Newmark’s most recent Current Report on Form 8-K and/or the Company’s most recent financial results press release titled “Liquidity Analysis”, including any related footnotes, for details about how Newmark’s non-GAAP results are reconciled to those under GAAP.
31

NEWMARK
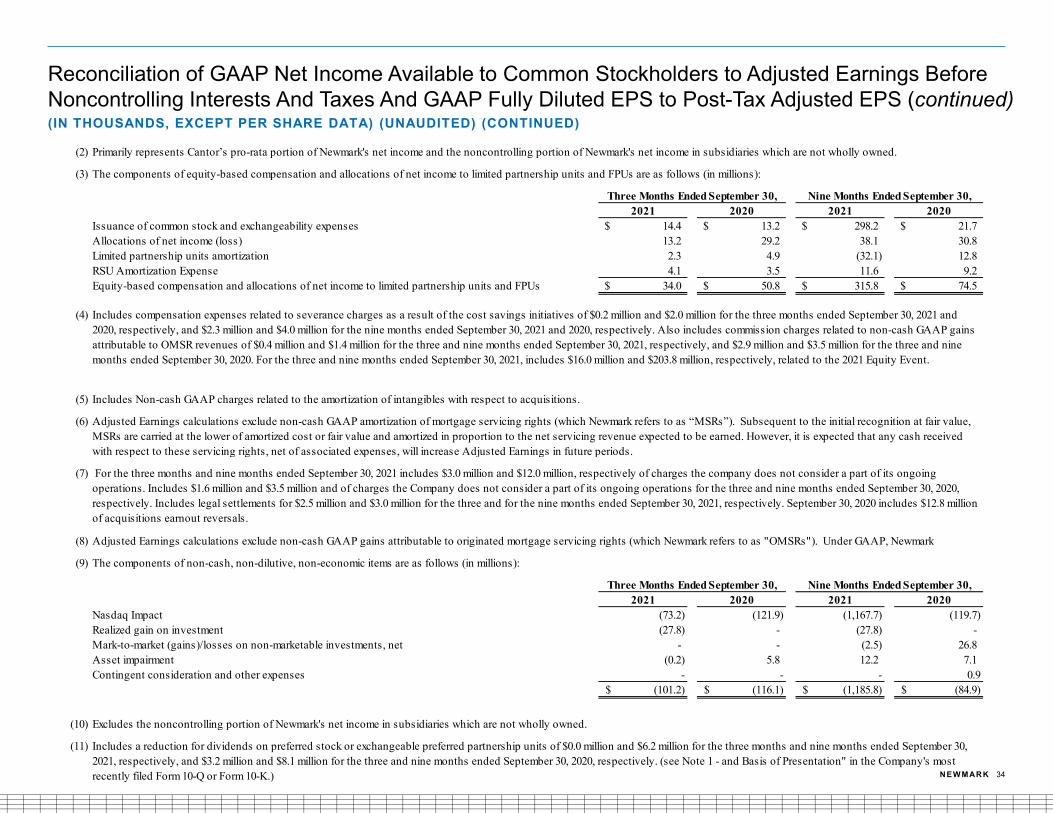
Reconciliation of GAAP Net Income Available to Common Stockholders to Adjusted Earnings Before Noncontrolling Interests And Taxes And GAAP Fully Diluted EPS to Post-Tax Adjusted EPS(IN THOUSANDS, EXCEPT PER SHARE DATA) (UNAUDITED)
32See the following page for a continuation of the table.
2021 2020 2021 2020GAAP net income available to common stockholders 128,549$ 75,349$ 601,398$ 83,841$
Provision for income taxes (1) 53,811 33,272 206,572 38,158 Net income attributable to noncontrolling interests(2) 34,707 24,176 191,627 30,563
GAAP income before income taxes and noncontrolling interests 217,067$ 132,797$ 999,597$ 152,562$
Pre-tax adjustments:
Compensation adjustments: Equity-based compensation and allocations of net income to limited partnership units and FPUs (3) 33,963 50,769 315,743 74,544 Other compensation adjustments(4) 16,491 5,147 207,142 7,555
Total Compensation adjustments 50,454 55,916 522,885 82,099
Non-Compensation expense adjustments:Amortization of intangibles (5) 2,416 1,744 6,503 5,053 MSR amortization(6) 20,103 22,601 57,854 85,937 Other non-compensation adjustments (7) 5,461 1,585 15,014 (9,359)
Total Non-Compensation expense adjustments 27,980 25,930 79,371 81,631
Non-cash adjustment for OMSR revenue(8) (33,644) (60,947) (88,175) (132,423)
Other (income) loss, net: Other non-cash, non-dilutive, and /or non-economic items and Nasdaq (9) (101,245) (116,134) (1,185,835) (84,932)
Total Other (income) loss, net (101,245) (116,134) (1,185,835) (84,932)
Total pre-tax adjustments (56,455) (95,235) (671,754) (53,625)
Adjusted Earnings before noncontrolling interests and taxes ("Pre-tax Adjusted Earnings") $ 160,612 $ 37,562 $ 327,843 $ 98,937
Three Months Ended September 30, Nine Months Ended September 30,

NEWMARK
(IN THOUSANDS, EXCEPT PER SHARE DATA) (UNAUDITED) (CONTINUED)
Reconciliation of GAAP Net Income Available to Common Stockholders to Adjusted Earnings Before Noncontrolling Interests And Taxes And GAAP Fully Diluted EPS to Post-Tax Adjusted EPS (continued)
33See the following page for notes to the table.
2021 2020 2021 2020Three Months Ended September 30, Nine Months Ended September 30,
GAAP net income available to common stockholders: $ 128,549 $ 75,349 $ 601,398 $ 83,841
Allocation of net income to noncontrolling interests (10) 33,748 24,185 189,261 29,904
Total pre-tax adjustments (from above) (56,455) (95,235) (671,754) (53,625)
Income tax adjustment to reflect adjusted earnings taxes (1) 23,330 27,638 147,546 23,375
Post-tax Adjusted Earnings to fully diluted shareholders ("Post-tax Adjusted Earnings") $ 129,172 $ 31,937 $ 266,451 $ 83,495
GAAP fully diluted earnings per share(11) 0.63$ 0.39$ 3.06$ 0.41$
Allocation of net income to noncontrolling interests - - (0.01) -
Exchangeable preferred limited partnership units non-cash preferred dividends 0.00 0.01 0.02 0.02
Total pre-tax adjustments (from above) (0.22) (0.36) (2.51) (0.20)
Income tax adjustment to reflect adjusted earnings taxes 0.09 0.10 0.55 0.09
Other (0.10) (0.02) (0.12) -
Post-tax Adjusted Earnings per share ("Adjusted Earnings EPS") 0.50$ 0.12$ 1.00$ 0.32$
Pre-tax adjusted earnings per share 0.62$ 0.14$ 1.23$ 0.37$
Fully diluted weighted-average shares of common stock outstanding 257,791 266,793 267,268 265,104
(1)
2021 2020 2021 2020GAAP provision for (benefit from) income taxes 53.8$ 33.3$ 206.6$ 38.2$ Income tax adjustment to reflect Adjusted Earnings (23.3) (27.7) (147.5) (23.4) Provision for income taxes for Adjusted Earnings 30.5$ 5.6$ 59.1$ 14.8$
Three Months Ended September 30, Nine Months Ended September 30,
Newmark’s GAAP provision (benefit) for income taxes is calculated based on an annualized methodology. Newmark includes additional tax-deductible items when calculating the provision (benefit) for taxes with respect to Adjusted Earnings using an annualized methodology. These include tax-deductions related to equity-based compensation, and certain net-operating loss carryforwards. The adjustment in the tax provision to reflect Adjusted Earnings is shown below (in millions):
NEWMARK
(IN THOUSANDS, EXCEPT PER SHARE DATA) (UNAUDITED) (CONTINUED)
Reconciliation of GAAP Net Income Available to Common Stockholders to Adjusted Earnings Before Noncontrolling Interests And Taxes And GAAP Fully Diluted EPS to Post-Tax Adjusted EPS (continued)
34
(2)
(3)
2021 2020 2021 2020Issuance of common stock and exchangeability expenses 14.4$ 13.2$ 298.2$ 21.7$ Allocations of net income (loss) 13.2 29.2 38.1 30.8 Limited partnership units amortization 2.3 4.9 (32.1) 12.8 RSU Amortization Expense 4.1 3.5 11.6 9.2 Equity-based compensation and allocations of net income to limited partnership units and FPUs 34.0$ 50.8$ 315.8$ 74.5$
(4)
(5)
(6)
(7)
(8)
(9)
2021 2020 2021 2020Nasdaq Impact (73.2) (121.9) (1,167.7) (119.7) Realized gain on investment (27.8) - (27.8) - Mark-to-market (gains)/losses on non-marketable investments, net - - (2.5) 26.8 Asset impairment (0.2) 5.8 12.2 7.1 Contingent consideration and other expenses - - - 0.9
(101.2)$ (116.1)$ (1,185.8)$ (84.9)$
(10)
(11)
Nine Months Ended September 30,
Nine Months Ended September 30,
Primarily represents Cantor’s pro-rata portion of Newmark's net income and the noncontrolling portion of Newmark's net income in subsidiaries which are not wholly owned.
The components of equity-based compensation and allocations of net income to limited partnership units and FPUs are as follows (in millions):
Includes compensation expenses related to severance charges as a result of the cost savings initiatives of $0.2 million and $2.0 million for the three months ended September 30, 2021 and 2020, respectively, and $2.3 million and $4.0 million for the nine months ended September 30, 2021 and 2020, respectively. Also includes commission charges related to non-cash GAAP gains attributable to OMSR revenues of $0.4 million and $1.4 million for the three and nine months ended September 30, 2021, respectively, and $2.9 million and $3.5 million for the three and nine months ended September 30, 2020. For the three and nine months ended September 30, 2021, includes $16.0 million and $203.8 million, respectively, related to the 2021 Equity Event.
Three Months Ended September 30,
Three Months Ended September 30,
Adjusted Earnings calculations exclude non-cash GAAP amortization of mortgage servicing rights (which Newmark refers to as “MSRs”). Subsequent to the initial recognition at fair value, MSRs are carried at the lower of amortized cost or fair value and amortized in proportion to the net servicing revenue expected to be earned. However, it is expected that any cash received with respect to these servicing rights, net of associated expenses, will increase Adjusted Earnings in future periods.
Adjusted Earnings calculations exclude non-cash GAAP gains attributable to originated mortgage servicing rights (which Newmark refers to as "OMSRs"). Under GAAP, Newmark
Excludes the noncontrolling portion of Newmark's net income in subsidiaries which are not wholly owned.
Includes Non-cash GAAP charges related to the amortization of intangibles with respect to acquisitions.
For the three months and nine months ended September 30, 2021 includes $3.0 million and $12.0 million, respectively of charges the company does not consider a part of its ongoing operations. Includes $1.6 million and $3.5 million and of charges the Company does not consider a part of its ongoing operations for the three and nine months ended September 30, 2020, respectively. Includes legal settlements for $2.5 million and $3.0 million for the three and for the nine months ended September 30, 2021, respectively. September 30, 2020 includes $12.8 million of acquisitions earnout reversals.
The components of non-cash, non-dilutive, non-economic items are as follows (in millions):
Includes a reduction for dividends on preferred stock or exchangeable preferred partnership units of $0.0 million and $6.2 million for the three months and nine months ended September 30, 2021, respectively, and $3.2 million and $8.1 million for the three and nine months ended September 30, 2020, respectively. (see Note 1 - and Basis of Presentation" in the Company's most recently filed Form 10-Q or Form 10-K.)

NEWMARK
Reconciliation of GAAP Income to Adjusted EBITDA (IN THOUSANDS) (UNAUDITED)
35
2021 2020 2021 2020GAAP net income available to common stockholders 128,549$ 75,349$ 601,398$ 83,841$ Adjustments:
Net income attributable to noncontrolling interests(1) 34,707 24,176 191,627 30,563 Provision for income taxes 53,811 33,272 206,572 38,158 OMSR revenue(2) (33,644) (60,947) (88,175) (132,423) MSR amortization(3) 20,103 22,601 57,854 85,937 Other depreciation and amortization(4) 8,780 7,023 22,950 18,673 Equity-based compensation and allocations of net income to limited partnership units and FPUs (5) 33,963 50,769 315,743 74,544 Other adjustments (6) 3,262 5,642 15,264 (3,192) Other non-cash, non-dilutive, non-economic items and Nasdaq (7) (85,271) (116,134) (982,049) (84,932) Interest expense 10,276 11,244 30,891 33,904
Adjusted EBITDA ("AEBITDA") 174,536$ 52,995$ 372,075$ 145,073$
Three Months Ended September 30, Nine Months Ended September 30,
(1)
(2)
(3)
(4)
(5)
(6)
2021 2020 2021 2020Severance charges 0.2 2.3 2.0 4.0 Assets impairment not considered a part of ongoing operations 2.7 0.5 11.9 2.1 Commission charges related to non-GAAP gains Attributable to OMSR revenues 0.4 2.9 1.3 3.5 Acquisition earnout reversal - - - (12.8)
3.3$ 5.6$ 15.3$ (3.2)$ (7)
Nine Months Ended September 30,
Includes fixed asset depreciation of $6.3 million and $5.3 million for the three months ended September 30, 2021 and 2020, respectively and $16.6 million and $13.6 million for the nine months ended September 30, 2021 and 2020, respectively. Also includes intangible asset amortization and impairments related to acquisitions of $2.4 million and $1.7 million for the three months ended September 30, 2021 and 2020, respectively, and $6.5 million and $5.1 million for the nine months ended September 30, 2021 and 2020, respectively.
Please refer to Footnote 9 under Reconciliation of GAAP Net Income (Loss) Available to Common Stockholders to Adjusted Earnings Before Noncontrolling Interests and Taxes and GAAP Fully Diluted EPS to Post-tax Adjusted EPS for additional information about the components of Other non-cash, non-dilutive, non-economic items".
Primarily represents Cantor and/or BGC’s pro-rata portion of Newmark's net income and the noncontrolling portion of Newmark's net income in subsidiaries which are not wholly owned.
Please refer to Footnote 3 under Reconciliation of GAAP Net Income (Loss) Available to Common Stockholders to Adjusted Earnings Before Noncontrolling Interests and GAAP Fully Diluted EPS to Post-tax Adjusted EPS for additional information about the components of "Equity-based compensation and allocations of net income to limited partnership units and FPUs".
Non-cash gains attributable to originated mortgage servicing rights.
Non-cash amortization of mortgage servicing rights in proportion to the net servicing revenue expected to be earned.
The components of other adjustments are as follows (in millions):
Three Months Ended September 30,

NEWMARK
Reconciliation of Operating Cash Flow (Excluding Activity from Loan Originations And Sales) to Adjusted EBITDA(IN MILLIONS) (UNAUDITED)
36
2021 2020 2021 2020Adjusted EBITDA 174.5$ 53.0$ 372.1$ 145.1$ Cash paid for interest (0.5) (11.2) (19.2) (33.9)Employee loans for new hires and producers (0.9) (1.0) (11.9) (61.0)2021 Equity Event (1) (484.4) - (484.4) -Other working capital (1.5) 23.2 70.3 73.3Corporate tax payments (14.7) (1.6) (38.1) (58.1)Net cash (used in) provided by operations excluding activities from loan originations and sales
(327.5)$ 62.4$ (213.2)$ (18.6)$
For the Three Months Ended September 30,
For the Nine Months Ended September 30,
(1) Reflects $484.4 million of cash used with respect to the 2021 Equity Event. Of this amount, $203.4 million related to the 16.3 million reduction in fully diluted shares, and $280.9 million related to amounts paid on behalf of, or to partners for withholding taxes related to unit exchanges and/or redemptions, cash paid for redemption of HDUs, and other items. But for these uses of cash, net cash provided by operating activities excluding loan originations and sales would have been $156.9 million and $271.2 million, respectively, in the three and nine months ended September 30, 2021.

NEWMARK
Liquidity Analysis Table(IN MILLIONS) (UNAUDITED)
37
September 30, 2021 December 31, 2020
Cash and cash equivalents 170,752$ 191,448$ Marketable securities 536,154 33,283 Securities loaned (140,000) (33,278)
Total (1) 566,906$ 191,453$
(1) Undrawn availability on the Credit Facility was $465.0 million and $325.0 million as of September 30, 2021 and as of December 31, 2020, respectively.

NEWMARK
Other Income($ IN MILLIONS)
Newmark's third quarter of 2021 other income, net under GAAP included realized and unrealized gains related to the appreciation of Nasdaq shares and a non-cash gain related to Newmark's acquisit ion of Deskeo.
38
3Q21 3Q20 Change
Nasdaq-related items $74.9 $116.1 (35)%Mark-to-market (losses) gains on non-marketable investments, net - - -Other items, net 27.8 (7.5) NMFOther income (loss), net under GAAP 102.7 108.6 (5)%
Exclude:Nasdaq-related items (73.4) (116.1) (37)%Mark-to-market (losses) gains on non-marketable investments, net - - -Other items, net (27.8) - NMFOther income (loss), net for pre-tax Adjusted Earnings and Adjusted EBITDA 1.5 (7.5) NMF

NEWMARK
Fully Diluted Weighted-Average Share Count for GAAP And Adjusted Earnings (IN THOUSANDS) (UNAUDITED)
39
2021 2020 2021 2020
Common stock outstanding 199,412 179,501 189,316 178,527 Limited partnership units - 58,959 - 57,972 Cantor units - 22,720 - 22,807 Founding partner units - 5,233 - 5,314 RSUs 4,697 155 3,816 254 Newmark exchange shares 1,172 225 1,188 231
Fully diluted weighted-average share count for GAAP 205,281 266,793 194,320 265,104
Adjusted Earnings Adjustments:Common stock outstanding - - - - Limited partnership units 24,383 - 44,901 - Cantor units 23,679 - 23,695 - Founding partner units 4,448 - 4,352 - RSUs - - - - Newmark exchange shares - - - -
Fully diluted weighted-average share count for Adjusted Earnings 257,791 266,793 267,268 265,104
Nine Months Ended September 30,Three Months Ended September 30,

125 Park Ave.
New York, NY 10017
t 212-372-2000
nmrk.com
Karen Laureano-Rikardsen
Chief Marketing Officer
t 212-829-4975
MEDIA CONTACT
Jason McGruder
t 212-829-7124
INVESTOR CONTACT Find out more about Newmarkat the following sites:
nmrk.com
twitter.com/newmark
linkedin.com/company/nmrk-cre
ir.nmrk.com
For more information:
For additional insights from Newmark Research, please go to the following websites:
nmrk.com/insights
nmrk.com/services#capital-markets