third tourism development project secondary cities revitalization study · · 2014-08-27third...
TRANSCRIPT
tTHE HASHEMITE KINGDOM OF JORDAN
MINISTRY OF TOURISM AND ANTIQUITIES THE WORLD BANK
THIRD TOURISM DEVELOPMENT PROJECT SECONDARY CITIES REVITALIZATION STUDY
General
������������ ������������ ����
��� ����
JOINT VENTURE OF COTECNO WITH ABT ALCHEMIA CDG MGA
Prepared by: MAS Rev: A
Checked by: RG Date: 24/05/05
COTECNO ABT ALCHEMIA CDG MGA
GENERAL - ANNEX B - ANALYSIS OF THE MUNICIPAL SECTOR 23-04-05 PAGE 2 OF 73
���� ����� ����
1. MUNICIPALITIES AND THE ADMINISTRATIVE SYSTEM IN JORDAN ..........................................4 1.1. The Governorates: decentralization with limited capacity of execution .........................................4 1.2. Municipalities: a juridico-administrative framework of subordination to the Government..............5
1.2.1. Setting-up of Municipalities and Villages Councils .........................................................5 1.2.2. Merging of Municipalities ................................................................................................6 1.2.3. Designation/Election of the Members of the Town Councils and of the Mayors............6
1.3. Municipalities: local territorial collectivities or administrative entities and territories? ...................7
2. THE MUNICIPALITIES AND THE CHALLENGES OF URBAN MUTATION AND SOCIAL RECOMPOSITION.........................................................................................................................9
2.1. Main challenges ...........................................................................................................................10 2.1.1. Control of expansion, planning and development of urban services ...........................10 2.1.2. The construction of social cohesion .............................................................................11 2.1.3. The local socio-economic development .......................................................................11
3. FUNCTIONS AND RESPONSIBILITIES OF THE MUNICIPALITIES ........................................13
4. MUNICIPAL FINANCE: EXPENDITURES AND RESOURCES OF THE MUNICIPAL SECTOR16 4.1. Very Low Expenditures and Resources.......................................................................................16 4.2. Inequality between municipalities ................................................................................................16
4.2.1. the Great Municipality of Amman and the other Jordanian municipalities. ..................16 4.2.2. Big Inequality of resources and expenditure among the municipalities .......................18
5. MUNICIPAL REVENUES: INTERGOVERNMENTAL TRANSFER SYSTEM .....................................20 5.1. The tax on property (Land & Building tax) ...................................................................................20
5.1.1. A partial and inequitable collection ...............................................................................21 5.1.2. a local tax or a distribution determined by the government?........................................22
5.2. The Fuel Tax ................................................................................................................................25 5.2.1. Stagnation and growth of the transfers of the State : transfers buoyancy ...................25 5.2.2. The distribution of governmental transfers among the municipalities ..........................27 5.2.3. Centers of governorates: a very unstable and uneven transfer ...................................32 5.2.4. A system of transfer with poor performance.................................................................33
6. FISCAL HEALTH OF THE DIFFERENT CENTER-OF-GOVERNORATE MUNICIPALITIES...35 6.1. Aggravation of fiscal Imbalance ...................................................................................................35 6.2. Effects of merging on self revenues and fiscal imbalance...........................................................38
7. SELF REVENUES OF MUNICIPALITIES...................................................................................42 7.1. Self Revenues of the whole Municipal Sector .............................................................................42 7.2. Self revenues of The group of Center-of-Governorate Municipalities .........................................43 7.3. Evolution of Self Revenues of the Different various center-of-governorate Municipalities.........44
7.3.1. Stagnation and reduction in Self Revenue in nominal value for the majority of the municipalities ................................................................................................................44
7.3.2. Fall of the Per Capita Self-Revenues of the Large Majority of the Municipalities ........46
8. THE COMPONENTS OF THE SELF-REVENUES OF THE MUNICIPALITIES.........................51 8.1. Business and professional licensING fees ..................................................................................51
COTECNO ABT ALCHEMIA CDG MGA
GENERAL - ANNEX B - ANALYSIS OF THE MUNICIPAL SECTOR 23-04-05 PAGE 3 OF 73
8.1.1. Partial and uneven Collection added to a big fall down ...............................................51 8.2. Fees on commercial activities and on transport ..........................................................................53
8.2.1. An important component of the revenues of certain municipalities..............................53 8.2.2. General dwindling of an already partial and largely below optimum level collection ...54 8.2.3. A collection limited only to some of the components of this tax ...................................55
8.3. Garbage Collection Fee: outstanding fluctuations and decreases ..............................................56 8.4. Taxes and Revenues related to Urban EXPANSION and Urbanism ..........................................57
8.4.1. Building and Construction Licensing fees ....................................................................58 8.4.2. Revenues from planning & urban development: A broad field of possibilities... ..........59 8.4.3. Revenues from planning & urban development: Yet few achievements!.....................59 8.4.4. A situation whose significance goes well beyond the issue of revenues .....................61
8.5. Revenues of "productive projects", primarily resulting from letting out real-estate patrimony.....62 8.5.1. A disparity of revenues which attenuates with the general fall of the level of revenues
after 2000 and after merging ........................................................................................63 8.5.2. The fall of per capita rental revenues is partly linked to merging .................................63 8.5.3. Revenues decrease and their initial weakness are also connected to management ..64 8.5.4. Rental revenues: a feature of a «Municipal Economy of Rent» ...................................66
8.6. Grants and contributions: another governmental transfer? .........................................................68 8.6.1. The category “Grants & Contributions” constitutes an important part of the total
revenue of the ten center-of-governorate municipalities. .............................................68 8.6.2. An extremely inequitable attribution .............................................................................69 8.6.3. A discretionary and discriminatory transfer ..................................................................70
COTECNO ABT ALCHEMIA CDG MGA
GENERAL - ANNEX B - ANALYSIS OF THE MUNICIPAL SECTOR 23-04-05 PAGE 4 OF 73
��� ������������ �������� �������������� ����� �����������
The administrative and governmental structure of Jordan consists, in addition to central ad-ministration, of two infra-national systems of institutions and authorities: (i) a decentralized system of administration with institutions representing and acting on behalf of the Govern-ment at four successive territorial levels: governorates (Mouhafazah) (administrative areas), districts (liwa'), sub-districts (Qda') and chief town (Nahia'). (ii) a municipal system which was, until 2000, made of three types of local institutions: the municipalities which managed the cities and the relatively important, in terms of number of inhabitants, localities which had, in theory, their autonomy, their own legal personality and their own budget; (iii) the councils of village which managed the small villages of the rural areas and which had, in comparison to the municipalities, less autonomy and less financial resources. The Councils of Joint Ser-vices grouped several municipalities and Councils of villages belonging to the same district in order to carry out common projects or services.
The reforms of the municipalities that took place in 2000 and 2001, resulted in the dissolution of the Councils of villages and in the merging of municipalities. From there on the Jordanian municipal system consisted of 100 municipalities.
����� ����� !�"# "���$%�&�'�#�"�()*��) #�+ )���()�)��&�'�,�')�-� .�
�/�'0�) #�
The Governorates are administrative structures depending directly on the Ministry of Interior. The latter employs the personnel of the former and determines and allocates their budget. All of the Ministries and Agencies of public services (except the Ministries of Defense and For-eign Affairs) have departments or regional offices in the governorates. Today, Jordan is di-vided into 12 administrative areas or Governorates1 (Amman, Irbid, Zerqa, Balqa, Karak, Ma-fraq, Ma' an, Tafiela, Jerash, Madaba, Ajloun, Aqaba).
Each Governorate is managed by a Governor (Mouhafiz) who is designated by the Council of Ministers based on the recommendation of the Minister of Interior. The Governors have the role of coordinating the work of governmental departments and public services in the Governorate; of ensuring the supervision and the monitoring of the provision of services and the execution of projects in close cooperation with the Ministries concerned; of identifying the priorities and of proposing projects, which the area needs to the Government. They have also the responsibility of approving the budget of the municipalities (except for the municipal-ity of Amman) and of according them the authorization to carry out certain expenditure. The policy of devolution announced by the government resulted recently in the reinforcement of the authority and the administrative responsibilities of the Governors. Nevertheless, their ca-pacity remains primarily a capacity of execution of the decisions taken at the central level. This is also the case of the Regional Managers of the various Ministries and public agencies, whose decisional and financial autonomy and capacity remain very limited.
The Governor is assisted by two councils: the Executive Council and the Advisory Council
• The Executive Council is composed of the Regional Managers of the various minis-tries, particularly the ministries concerned with the delivery of public services.
• The Advisory Council is composed of 15 members designated by the Minister of Inte-rior based on a recommendation by the Governor and chosen from local stakeholders (deputies, mayors, trade unions, private sector, organizations of the civil society, etc). Having a purely advisory role, this Council makes recommendations, which are submit-ted to the Executive Council and to the Governor who could either adopt or reject them.
The Governorates are subdivided into districts (liwa'), sub-districts (Qda') and Chief Towns
1 In order to take into account the increase in the population, the number of Governorates was increased few times. It went from 5 in 1985, to 8 in ? and to 12 in 1994.
COTECNO ABT ALCHEMIA CDG MGA
GENERAL - ANNEX B - ANALYSIS OF THE MUNICIPAL SECTOR 23-04-05 PAGE 5 OF 73
(Nahia'). The latter are managed by civil servants of the Ministry of Interior (Manager of Liwa, Qa' imaqam and Chief Town manager), whose task is to coordinate and supervise, under the authority of the Governor, the decentralized services of other ministries.
��1�� �0#)'),�()�)�$%����0")&)' 2�&�)#)$�"��)!��."���+ "3� .�
$0� "&)#��) #�� ������ !�"#��#��
The municipal traditions in Jordan go back to the end of the 19th century. Following the Ot-toman Law of the Municipalities of 1877, town councils were instituted in all of the important cities and localities in Trans Jordan like elsewhere in the Ottoman Empire. This is the case, for example, of the towns of Salt, Ajloun, Karak and Irbid, whose first Town councils go back to this date.
Since the establishment of the Jordanian State in 1921 and the first constitution of 1928, the legal framework concerning the municipalities was modified on several occasions. Today, it is the Law of the Municipalities of 1955, which continues to constitute the legal base for the definition of the territory, the functions and the authority of the municipalities and their coun-cils. However, many amendments were made to this law since its establishment, of which the latest goes back to 2002, relating in particular to the constitution of the Town council.
The Law of 1955 defines the Municipality as being "a financially independent national institu-tion ", having a "legal personality" and an administrative autonomy, which is managed by a Town council composed of the Mayor (rais Al-baladiyah) and 6 to 11 councilors. However, many provisions of this Law limit the authority and the autonomy of the municipalities and es-tablish the base for a relationship of dependence and subordination to the State.
1.2.1. SETTING-UP OF MUNICIPALITIES AND VILLAGES COUNCILS
According to the Law of 1955, all of the relatively important (generally having more than 2000 inhabitants) cities and the localities can constitute their own municipality or join the municipality of a close city. The Council of Ministers should verify that the majority of the lo-cal population wishes to do so, after which it must take the decision of creating the munici-pality by defining its territorial limits, the number of its Town council members, and by setting the date of the election by the population.
Nevertheless, the Council of Ministers can also decide, based on the recommendation of the Minister of Municipalities and the Governor, to modify the territorial borders of any of the cit-ies or village councils, to merge municipalities and village councils or a part of their territory or their population with another municipality, or even to constitute new municipalities by di-viding existing municipalities. (Art 5 of the Law 1955).
THE VILLAGE COUNCIL
A village council, which also has a "legal personality" is set up to manage "any place recog-nized by the Ministry of Municipalities as being a village or a tribal place of installation" (Law 5/1954). A "village" generally has a population of less than 2500 inhabitants. Although it has a "legal personality", the financial resources and the autonomy of the village council are ex-tremely limited. It is the Governor who determines the number of the members of the village Council (from 3 to 11), who chooses them, and who designates the president. Moreover, all the administrative, financial and technical decisions are subject to the approval of the Governor.
THE JOINT SERVICE COUNCILS
The Joint Service Councils enjoy equally a legal personality and exercise their authority as Town councils and village Councils with regard to common services and projects. However, the decision to constitute these Joint Services Councils remains with the Ministry of Munici-pal Affairs, based on a recommendation of the Governor, and not of the Municipalities or the village Councils concerned. The Ministry has also the right to dissolve these councils and to exclude a municipality or a village council from them. It is also the Ministry, which defines
COTECNO ABT ALCHEMIA CDG MGA
GENERAL - ANNEX B - ANALYSIS OF THE MUNICIPAL SECTOR 23-04-05 PAGE 6 OF 73
their functions and authorities, determines the number of their members, and designates a third of their members as well as the presidents.
1.2.2. MERGING OF MUNICIPALITIES
Jordan knew during the last decades a remarkable increase in demographic growth and a movement of accelerated urbanization. The Jordanian population (5.2millions) more than doubled in twenty years and is expected to reach 7.1 million in 2010. The rate of urbaniza-tion went from 44 % in 1961 to 73.6 % in 1999. These phenomena, which resulted in the growth of the cities and villages and in the multiplication of their numbers, had also as a con-sequence the proliferation of the municipalities and village councils. Between 1979 and 1996, the number of the municipalities increased from 86 to 183 and that of the village Councils increased from 287 to 354.
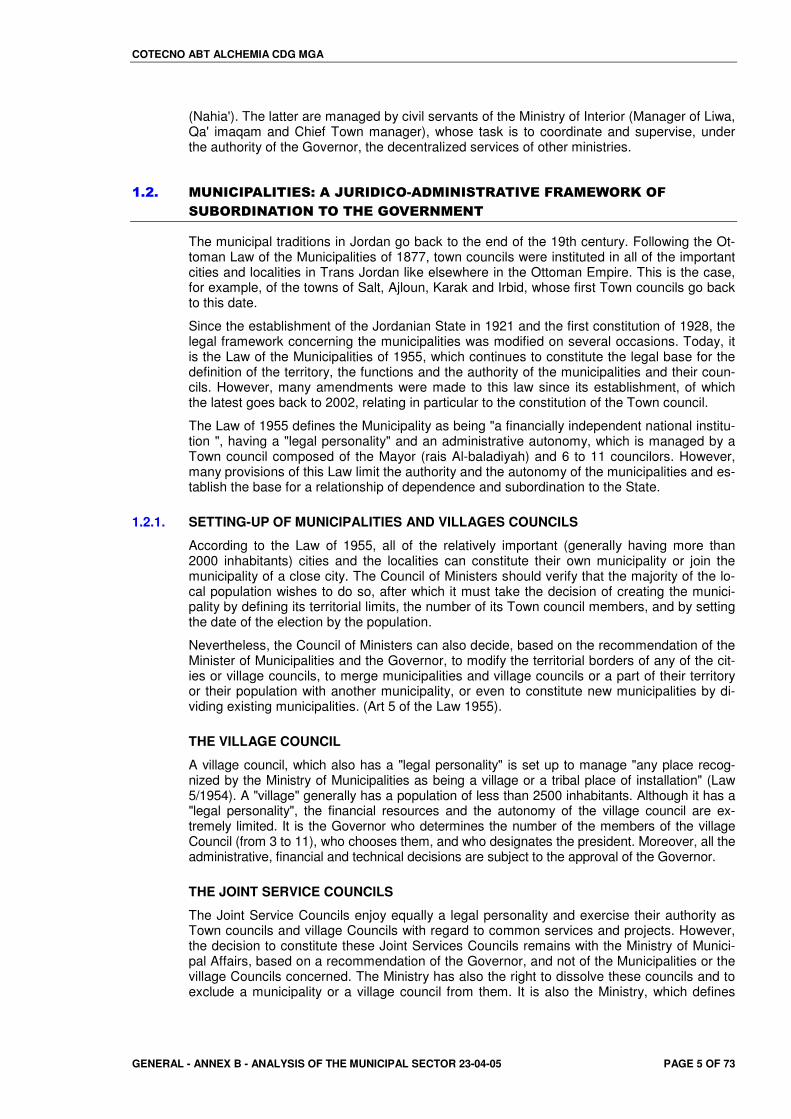
In this context, the Ministry of Municipalities gradually merged the village councils until it fi-nally dissolved them definitively in 2000, either through grouping them or by integrating them into municipal structures. Thereafter, in 2001, amidst the crisis of the municipalities, in par-ticular the financial one, the Ministry led a total reform of the municipal structures by merging the municipalities and by reducing their number from 328 to 99, in addition to the municipality of Amman. This merge also resulted in the disappearance of several Joint Service Councils, which were reduced from 38 to 20.
CHANGE IN THE NUMBER OF MUNICIPALITIES, VILLAGE COUNCILS, AND JOINT SERVICE COUNCILS
1976 1996 1997 1998 1999 2000 2001
Governorates 12 12 12 12 12 12
Municipalities 68 301 304 319 328 328 99
Village Councils 138 354 354 354 324 0 0
Joint Service Councils 40 40 40 40 38 20
CLASSIFICATION OF MUNICIPALITIES
The municipalities are classified, form the legislative point of view, into four categories, which determine, inter alia, the resources allocated to them by the State and the allowances re-ceived by the members of the Town council:
1) The First category groups the centers of the Governorates as well as all other cities having more than 100.000 inhabitants. Due to the fact that there is no other city or mu-nicipality, apart from Amman and the centers of the three other Govern orates (towns of Irbid and Zarka, and municipality of Madaba), which has a population exceeding 100.000 inhabitants, the municipalities of the first category are only 11 in addition to Amman;
2) The second category groups the municipalities which have the function of center of dis-trict or which have a population more than 15.000 inhabitants;
3) The third category is that of the municipalities/ cities which are the centers of sub-districts (Qda') or whose population is located between 5.000 and 15.000 inhabitants;
4) The fourth category groups all other municipalities.
1.2.3. DESIGNATION/ELECTION OF THE MEMBERS OF THE TOWN COUNCILS AND OF THE MAYORS
The Government determines the number of the Town council members, which must be be-tween 6 and 11 in addition to the Mayor.
Before the Law of 1955 was amended, the Town Council, including the Mayor, was elected by the local population for a mandate of four years. However, that same Law gave the Gov-ernment and the Ministry of Municipal Affairs the authority to defer the elections in one or more municipalities for a period going up to 6 months. It also authorized them to dissolve the elected Town Council and to form a committee to manage the municipality for a period of
COTECNO ABT ALCHEMIA CDG MGA
GENERAL - ANNEX B - ANALYSIS OF THE MUNICIPAL SECTOR 23-04-05 PAGE 7 OF 73
time, which could go up to two years. In addition, following an emergency law (ahkam ` urfi-yah) that was promulgated by the mandatory authorities and which was not repealed after independence, the Minister of Interior reserved the right to designate one or two members of the Town Council if he estimated that certain groups of the population were not represented in that Council.
Finally, even the principle of electing town councils was put into question. It initially con-cerned the municipality of Amman, following an amendment of the Municipal Law in 1994. From that date on, only half of the municipal councilors were elected and the other half as well as the Mayor were designated by the Council of Ministers. More recently, in 2002, one year after the merging of municipalities, a "provisional amendment" of the law generalized this rule to become applicable to all Jordanian municipalities. Thus, the local elections of 2003 aimed at electing half of the Councilors. The other Councilors, as well as the Mayors of the 99 municipalities, were designated by the Ministry of Municipalities.
��4�� �0#)'),�()�)�$%�( '�(���"")� ")�(�' ((�'�)!)�)�$� "�
�&�)#)$�"��)!���#�)�)�$��#&���"")� ")�$5�
In spite of the principle of autonomy of the municipal institution and in spite of the will for de-centralization affirmed by the Government from the end of the Eighties, the Municipalities are today deprived of their political and institutional autonomy and are still under the authority and the control of the Government.
The designation of the Mayors and half of the town councilors is undoubtedly the most salient aspect of this loss of autonomy. However, the authority of the Ministry is also exerted through the appointment of the "zone directors" who are given the responsibility of manag-ing, under the authority of the Mayor and the Town council, the communal territories which had, before merging, the status of municipality or village councils. This authority is also ex-erted through the appointment of the members of the "municipal committees" – nomination, which appears, in a way or another, like an administrative designation carried out under the control of the ministerial departments. Finally, it is to this Ministry that this personnel is ac-countable rather than to the local population, which is deprived of any formal authority of control and influence.
This loss of autonomy was justified by the multidimensional crisis of the municipalities and the will to staff the municipalities with qualified people having the capacity to rectify this situation.
However, as several analysts and observers highlight, the passage from election to ap-pointment of the mayors and town councilors, as well as the amendment of the provisions of the Law of Municipalities, were also especially motivated by the concern of the Government of keeping the political scene under control, particularly in a context marked by an upraise in the popularity of the Islamic party which gained control of several municipalities during the last local elections. It was also a question of keeping a certain "balance" threatened in cer-tain cities by the demographic weight and political growth of the populations of Palestinian origin. It is this same concern for political and demographic "balance" which underlies the principle of "management" based on the territorial delimitation of municipalities and the amendment of the Law which authorizes the Government to subdivide the communal territo-ries in zones and to determine for each one of them the number of councilors to elect.
Whatever the motives were, it is clear that these measures and provisions lead to a situation where the municipal institution is put under some kind of supervision, and to an administra-tive construction and delimitation of the communal territory, on the expense of the social re-lations and practices which structure it. At the same time, this contributes to the weakening of the cohesion of the local communities and to digging a hiatus between the municipal insti-tution and the local community.
Moreover, the distance between the Municipality and the local population is reinforced by the almosti-general absence of instituted mechanisms of dialogue, participation and ac-countability. Indeed, rare are the municipalities, which set up district committees of consul-tation as stated by the Law of Municipalities. Few municipalities make the effort to inform the
COTECNO ABT ALCHEMIA CDG MGA
GENERAL - ANNEX B - ANALYSIS OF THE MUNICIPAL SECTOR 23-04-05 PAGE 8 OF 73
local population of their projects and their decisions by organizing, for example, public meet-ings, by publishing a newsletter, or by making the meetings of the Town Council accessible to the public as envisaged by Law. For some “engineers”, this defect of not involving the public is even combined sometimes, with certain contempt of the local "illiterate" population, and of the municipal councilors elected by them. Thus one of these “engineers, zone direc-tor", does not hesitate to declare his contempt even in the presence of the mayor and the majority of the members of the Town Council: "These people should be managed! They are not apt to be self-managed. It would have been necessary to designate even all of the Town council.” With such attitudes, should not we consider that there is a cause and effect rela-tionship, at least partially, between the defect of not soliciting the participation of the popula-tion and the negative attitude which sometimes the population declares, and which one of the Mayors describes when he says: "people consider the municipality as their enemy who is there only to control them and make them pay infringements"? Could such a feeling be only explained by the fact that "the requests of people relate more to their particular interests than to the general interest"?
The way in which the local populations and certain associations sometimes try to force their way onto the municipal policy and management is in this respect particularly significant: sometimes rather than addressing the Town Hall, they prefer to directly challenge the Minis-ter ("the employer of the Mayor" as a president of a local association put it), the Governor or the deputies to complain or to make their voices heard. Thus, the Municipality is sometimes perceived as a decentralized administration rather than an institution representative of the local community. This situation creates a "feeling of illegitimacy" and weakens the Town Councils and their local authority. It is what undoubtedly explains the insistence of certain mayors, who had been elected before being designated, on the fact that, they unlike the “other mayors”, had been chosen by the population and not by the Administration. One can also note that some of these "elected" Mayors use and highlight this "legitimacy" to affirm their local authority as well as to safeguard or keep a certain autonomy vis-à-vis the Official Authorities.
COTECNO ABT ALCHEMIA CDG MGA
GENERAL - ANNEX B - ANALYSIS OF THE MUNICIPAL SECTOR 23-04-05 PAGE 9 OF 73
1�� �� ������������� �������� ������ �6 �������������2
��������������� ���������
The movement of accelerated urbanization that Jordan knew since the beginning of the 1970, combined with the demographic growth and the migratory waves of the populations, deeply transformed the socio-spatial structures of the country and often made null and void the definitions and administrative categorizations of the "cities" and the "villages".
The villages saw the considerable growth of their population, many news cities were born, small cities extended to include the surrounding villages, which also became urbanized, etc. But this transformation is not only the result of an "endogenous" demographic growth, which would have affected each locality as a result of the increase in its own population. It is also the effect of migratory movements of great amplitude which, far from being reduced to only the exodus towards Amman, had affected all the Jordanian localities: migrations from small villages towards bigger villages; migrations towards the small cities; migrations towards the few large cities; migrations from Palestinian camps towards the surrounding localities and to the large cities; sedentarization of tribes and pastoralists, nomads or seminomads. Moreover the State itself, in an effort to hold its influence on the territory, was at the origin of the crea-tion of many small cities: towns of sedentarization such as Jafr and Hussainiyah; mining cit-ies for phosphates and potash such as Hasa, El-Abyad, Shidiya, Ghor and Safi; road towns or railway crossroads such as Jiza, Qatrana or Qwira, etc.
The upheaval of the socio-spatial structures is also related to the swarming and the diffusion of the urban reality to the smallest rural localities. The massive emigration towards the oil countries and the important transfer of resources which benefited the families and the locali-ties of origin; the uprooting and the urban culture of the population of Palestinian origin (which constitutes more than half of the Jordanian population) of which a great part came from the cities and urban areas; investments of the State and the transfers which it affected towards the "rural" localities with an aim of reinforcing their social base and of securing the loyalty of the population of trans-Jordanian origin; the transformation of economic activities and the prevalence of urban activities of services on the expense of agricultural activities, even in the small rural villages, etc, are many phenomena which strongly contributed to this process of diffusion of urbanization.
In short, in all of the Jordanian localities, the spatial and urban morphology, the way of life and consumption, the socio-economic structures, the social and collective forms of organiza-tion were strongly affected and transformed.
In this context, it is not exaggerated to say that all the Jordanian localities are, to some ex-tent, new cities, which are formed by the assembly of various, more or less uprooted, groups, or "parts" brought back and juxtaposed. The local collectivities and communities, as collective structures having their formal and informal standards of organization, operation and regulation are far from being already accomplished or from being given realities in ad-vance.
Even in the case of the "historical cities" such as Madaba, Ajloun, Jarash, and to a lesser degree, Karak and Salt, Irbid and Aqaba, these local communities are rather realities in the course of construction and achievement through processes, which, still today, are far from being completed.
Admittedly, and contrary to the cities which resulted from the urbanization of rural villages or those which were created ex-nihilo by the State to respond to a precise function (town of sedentarization, mines city, garrisons cities, etc), the historical cities have a relatively old ur-ban tradition and patrimony:
• An urban structure marked by the existence of old centers which have an architectural and patrimonial value and which, despite everything, still keep their function of public federator spaces, and their function of economic, social and urban centrality;
COTECNO ABT ALCHEMIA CDG MGA
GENERAL - ANNEX B - ANALYSIS OF THE MUNICIPAL SECTOR 23-04-05 PAGE 10 OF 73
• A collective identity and memory strongly rooted and attached to the city and its patri-mony; an old commercial and artisanal tradition which was built through multiple net-works of exchange and communication with Palestine and even Syrian towns;
• A middle-class and liberal professionals who, although often carrying out their activities in the capital city, continue to occupy an important position in the local social structure; and have a relatively advanced level of education;
• A culture and an identity which affirm their urbanity and which dissociate themselves from a "Bedouin" culture locked up in a tribal order;
• A tradition of intercommunity, interconfessional and interethnic coexistence, communica-tion and “live-together”
• Collective authorities and mechanisms of self-dependence and self-regulation, which al-though being based on familial hierarchies and linkages, built a community framework which went beyond the tribal framework and "family business";
• A political culture which made of these cities the cradles for political parties and national-istic and left wing movements;
• A tradition of collective municipal management, which goes back to the Ottoman period.
However, all of the phenomena evoked previously (urban development, demographic growth, massive arrival of populations of Palestinian and/or rural origin, etc.) as well as the socio-economic evolutions and socio-policies of the Jordanian society have upset and trans-formed the socio-spatial structures of these cities and have put under question the various components of their socio-urban traditions, to a point that makes it possible to speak today about "cities in mutation and transition" and "local communities in the course of re-composition and reorganization".
1���� ��)#�'��((�#��$�
This context of urban mutation and social re-composition contributes to the problematic of the municipalities as we could observe today. While being a constitutive factor of the weak-ness and fragility of the municipalities, it puts at the foreground the question of the adaptabil-ity of the institutions and municipal services and their capacity to accompany the ongoing transformations and to direct them in a perspective of development. It highlights in particular the central role that the municipalities and the municipal institutions should play in coping with the several challenges, which are posed today for the Jordanian cities, including the his-torical ones:
2.1.1. CONTROL OF EXPANSION, PLANNING AND DEVELOPMENT OF URBAN SERVICES
Today a number of problems highlight the urgent need for a strong implication of the munici-pal institutions in this field: the urban growth which has occurred in an anarchistic way in the majority of towns, without planning and, often, without taking into account the elementary rules of town planning and respect of the environment; the spreading out of zones of recent construction in a disorganized way and without apparent structure; the fragmentation, de-struction and deterioration of a big part of the architectural heritage of the "historical cities"; the degradation of the socio-urban fabric of the historical centers; the crisis of the functions of centrality and the lack of articulation between the functions of local and regional centrality (cf the example of Karak); the insufficiency or the bad quality of urban services; the anarchy which dominates the distribution of commercial activities and services in the spaces of cen-trality; the tensions and conflicts related to the use of public spaces and the weakness of the functions of their management, regulation and maintenance, etc,
Such problems raise undoubtedly the question of the technical and operational competence of the local institutions. However, the technical competences alone are far from being enough to guarantee the efficiency and the effectiveness of the role of the municipal institu-tions in urban management and in the delivery of urban services. This is because an urban
COTECNO ABT ALCHEMIA CDG MGA
GENERAL - ANNEX B - ANALYSIS OF THE MUNICIPAL SECTOR 23-04-05 PAGE 11 OF 73
service, like any other service, is in the final analysis a co-production between the institution, which provides it and the users/citizens for whom it is intended. Thus, in addition to the tech-nical and regulatory dimension, it comprises two other essential dimensions, which condition its effectiveness:
• A contractual dimension: What are the terms of contract with the user? Are they elabo-rated and applied in a transparent and equitable way? Are they clearly stated and com-monly accepted? Etc
• A relational and "moral" dimension: What is the nature of the relation between the in-stitution and the user? Do the institution and its agents profit from the confidence of the users/citizen? Do they profit from the recognition of their competence, their impartiality, and their legitimacy as representatives of the common interest? Are the institution and its agents capable of building a relationship and a process of co-operation with the us-ers/citizens to carry out the service, to preserve the common assets and to promote the collective interest?
In short, the management of urban problems also raises the question of the political com-petences of the municipalities in the sense of a common, legitimate and recognized repre-sentation, capable of incarnating the collective interests of the local communities, of building a consensus around these interests and of mobilizing the population to make them prevail.
2.1.2. THE CONSTRUCTION OF SOCIAL COHESION
Facing the prevalence of Community and neo-tribal logics and the increased risks of social fragmentation between the various groups, which constitute the cities, the role of the munici-palities and the municipal institutions in the reinforcement of social cohesion is determining. It should be indeed the vocation of the municipalities to be independent authorities that rep-resent the collective interests and construct a shared vision for the common good. In this vi-sion, the municipality should be the space for dialogue and participation of the groups and the population in the local policy. Furthermore, the municipality could constitute the indispen-sable framework where the relationship between the various groups are negotiated, and even more, where these groups go beyond their particular interests to be organized as col-lective actors able to assume their responsibilities and to face their common problems. This question is all the more crucial today that the municipalities, since their merging, group sev-eral local localities and communities.
However, a fast examination of the recent history of the municipalities and local political economy in the "historical cities" shows that the majority of the Municipalities, instead of working for the reinforcement of social cohesion, are often contributing to the aggravation of divisions and cleavages between the various local groups.
The type of relationship established by the State with the local and tribal groups and the prevalence of the logic of “rent” and clientelism as means of social mobility, and of access to power and richness, etc., had very negative effects on the local institutions. They strongly contributed to the transformation of the municipalities and the municipal institutions from an autonomous and independent entities, where the various groups negotiate and build a con-sensus around the collective interest, to an exclusive object for appropriation allowing such or such a group to affirm its authority and to draw some material and symbolic profits on the expense of other groups and, obviously, on the expense of the general interest and the common good. (cf the example of Madaba).
2.1.3. THE LOCAL SOCIO-ECONOMIC DEVELOPMENT
Jordan is characterized by a very strong concentration of economic activities in the conurba-tion of Amman. With the exception of Irbid and Aqaba, almost all of the fifty urban centers that the country has, including the historical cities although to a lesser degree, are character-ized by the weakness of their functions and their economic activities and by their depend-ence on the Capital city. During the last decades, the population of these cities and regions, which surround them found a solution to the question of the access to activity and resources through the emigration towards the countries of the Gulf, employment in the Administration
COTECNO ABT ALCHEMIA CDG MGA
GENERAL - ANNEX B - ANALYSIS OF THE MUNICIPAL SECTOR 23-04-05 PAGE 12 OF 73
and the army, or employment in the Capital city. The closing up of the immigration countries and the expulsion of several hundreds of thousands of Jordanians by these countries follow-ing the war of the Gulf, the saturation of the administration, the economic recession during the Nineties affected these cities and their provinces harshly. The rate of poverty and unem-ployment (in particular the unemployment of young people) during the last 15 years knew a very sharp increase and is much higher today than that in the area of Amman (Cf Jordan Poverty Assessment, World Bank, 2004).
In this context, local development constitutes for these cities and regions and for their popu-lation a major stake. Such a perspective supposes the mobilization of institutions, popula-tions and local resources. However, the quasi totality of the municipalities does not play any part in the fight against poverty and in the social and economic development of their cities. Several municipalities are strongly challenged by associations and by the local populations who reproach them for not being interested in the social condition of their constituency, and question even the legitimacy and the representativity of the Town councils.
COTECNO ABT ALCHEMIA CDG MGA
GENERAL - ANNEX B - ANALYSIS OF THE MUNICIPAL SECTOR 23-04-05 PAGE 13 OF 73
4�� .������������� ����������� ����� ������������� ��
One of the most outstanding aspects of the municipal situation in east Jordan, is undoubt-edly, the big gap between the wide functions and responsibilities that the Law assigns to the municipalities and authorizes them to exert, on the one hand, and the extremely limited number of services which they provide and functions which they assume, on the other.
Indeed, according to article 41 of the Law of 1955, the municipality is in charge of exerting 39 functions, which vary from city planning to hygiene and public health. These functions cover multiple fields:
• Planning and urban management: town-planning, construction, and maintenance of roads; laying out and maintenance of spaces and public places such as parks and gar-dens; organization of traffic and transport and laying out of car parks; construction and organization of markets, commercial and industrial activities, and of services and places for their exercise; control of advertising boards and signs; construction of cemeteries; de-livery of building permits;
• Supply of urban services: water, electricity, sewage networks, collection of household re-fuse;
• Hygiene and Public Health: putting in place and control of establishments of health and care; construction and monitoring of slaughter-houses; medical and sanitary control, in particular for trade and foodstuffs, and taking measures necessary to maintain public health and to prevent the risks and epidemics;
• Education, culture and sport: construction and control of educational, cultural, and spor-tive institutions and amenities;
• Assistance to victims of fires and other disasters, and construction of residences for the old people;
• Public Safety: prevention of fires, civil defense; ordering the demolition of buildings pre-senting risks;
• In the field of regulations: to prescribe, with the agreement of the Government, regula-tions allowing to exert its functions and responsibilities and to collect local taxes.
• In the field of advisory services: the municipality must be consulted if one of its functions is taken over by the Government.
However, the definition of these functions and responsibilities was made in 1955 and was almost not modified since. It reflects neither the evolution of the socio-economic and urban stakes, nor the current stakes of management and local development, or the effective ca-pacities, functions and responsibilities; which the Jordanian municipalities assume today.
We can for a start note that, in spite of the large range of fields evoked by the Law, the func-tions and responsibilities it attributes to the municipalities, except of city planning perhaps, are in fact delegated or "decentralized" services, or are responsibilities for execution of work and services. They do not give the municipality the "political" power for guidance and deci-sion-making concerning the sphere of activities in which these services fit.
In other words, the Law does not provide the autonomy necessary to make it possible for the municipalities to build a local policy in response to specific local needs in such or such a field and, even less, a policy of local development. Moreover, It is significant that the only social action evoked by the Law is that of the assistance for the victims of fires and natural disas-ters.
In addition, an important part of the functions and services evoked by the law concern, in fact, the responsibility of the various centralized government departments or companies of public services. Water, electricity, sewerage, gas, services of the police force, education, health, social action, housing, etc, are many fields which are today completely outside the
COTECNO ABT ALCHEMIA CDG MGA
GENERAL - ANNEX B - ANALYSIS OF THE MUNICIPAL SECTOR 23-04-05 PAGE 14 OF 73
responsibility and the field of activity of the municipal institutions. The municipalities are nei-ther involved or made involved nor even consulted in the provision, and even less, in the de-sign of the services related to these fields.
This absence of implication of the municipal institutions makes it difficult to put in place any action for local development and generates many negative consequences as to the efficacy and the quality of the services rendered in the various fields concerned. Such is the case for example with regard to the companies of services such as water and electricity whose inter-ventions and work are carried out without coordination and consultation with the local au-thorities leading thus to many problems at the level of the local infrastructure.
In the urban field, the Law of Town and Village Planning of 1966 partially confirms the re-sponsibilities of the Municipality in city planning, by making it a shared responsibility with the "Committee of District Planning" and especially with the Ministry of Municipal Affairs. Thus, in theory, the Town council keeps the responsibility for the preparation of the Urban Develop-ment Plan but must have it approved by the Committee of District Planning and especially by the High Council of Planning of the Ministry (Majlis Al-Tanzim Al-A' la), which is also granted the authority to arbitrate any disagreement between the Committee of District Planning and the Municipality.
In reality, the weakness of the technical and financial capabilities makes the municipalities unable to perform their functions and leads to the transfer of the responsibility for city plan-ning to the High Council of Planning, which takes the lead in the preparation of the Urban Development Plans and makes them then approved by the town councils. Moreover, for any modification of these Plans, even if partial and minor, the Municipality must obtain the au-thorization of the High Council of Planning, which is often a long and complex process be-cause of the multiplicity of the administrative steps and the high degree of centralization.
Thus, for the large majority of the municipalities, their functions are, in the final analysis, re-duced to assuming the responsibility and the execution, as best they can, of the functions of maintenance and control and of the supply of a certain number of basic services and ser-vices related to the roads: maintenance of streets and pavements; maintenance of street lighting; cleaning of the streets and collecting of waste and household refuse; construction and maintenance of local roads; delivery of building permits; more or less formal control of the safety of the marketed foodstuffs; control and lay-out of fruit and vegetables markets; construction and lay-out of some public amenities such as gardens, libraries, etc.
However, this situation cannot be reduced to a question of attribution/distribution of compe-tences and responsibility or to a simple problem of dialogue and coordination between the municipalities and the various government departments and companies of public services. They raise as much if not more the question of the capacity of the municipal institutions to build their role, to exert their prerogatives and to assume their responsibility.
What this situation shows primarily is that the law attributes to the municipalities functions and responsibilities without the latter being equipped with the necessary capacities to fulfill and assume them. Thus, beyond the responsibilities and functions, which the municipality lose, completely or partially, to other institutions, a considerable part of the services and functions that the Law attributes to the municipality are today badly provided or not provided at all. The problems related to urban management that we evoked above are, in this respect, exemplary.
The anarchistic and un-controlled urban expansion, the degradation of the urban fabric of the historic centers, the problems of traffic in the secondary cities, the inadequacy of the mainte-nance of public spaces, which were evoked earlier, are without doubt among the effects of this situation. One could also quote the case of the sanitary control of foodstuffs, which is one of the responsibilities of the municipalities. Admittedly, the majority of the municipalities of the big and medium-sized cities have personnel in charge of this task, but in the majority of the cases this personnel has neither the technical skills nor the tools for performing their duties.
Moreover, the differences which we could observe between the municipalities and, more par-ticularly, the fact that some of them are able to gain a certain autonomy and to conceive and
COTECNO ABT ALCHEMIA CDG MGA
GENERAL - ANNEX B - ANALYSIS OF THE MUNICIPAL SECTOR 23-04-05 PAGE 15 OF 73
implement projects which go beyond the maintenance and execution of duties in which the majority of the municipalities are locked up, also show that the problem of the capacities of the municipalities constitutes the heart of the municipal problem today.
But, as we mentioned earlier, these capacities must be understood as the result of the inter-action of four interdependent levels, which are:
• The financial resources;
• The competences of the municipality (management and organization, human resources, individual competences, etc.);
• The relationship with the State and its institutions;
• The dynamics of local implication and participation.
COTECNO ABT ALCHEMIA CDG MGA
GENERAL - ANNEX B - ANALYSIS OF THE MUNICIPAL SECTOR 23-04-05 PAGE 16 OF 73
7�� ���������� .����� %� ��� ������ �� ���� " ���� �� �
�� �����������$ ����
7���� !�"-�( + ��/,�#&)�0"�$��#&�"�$ 0"'�$��
The municipal expenditures and resources remain very low by international standards particularly in the provinces.
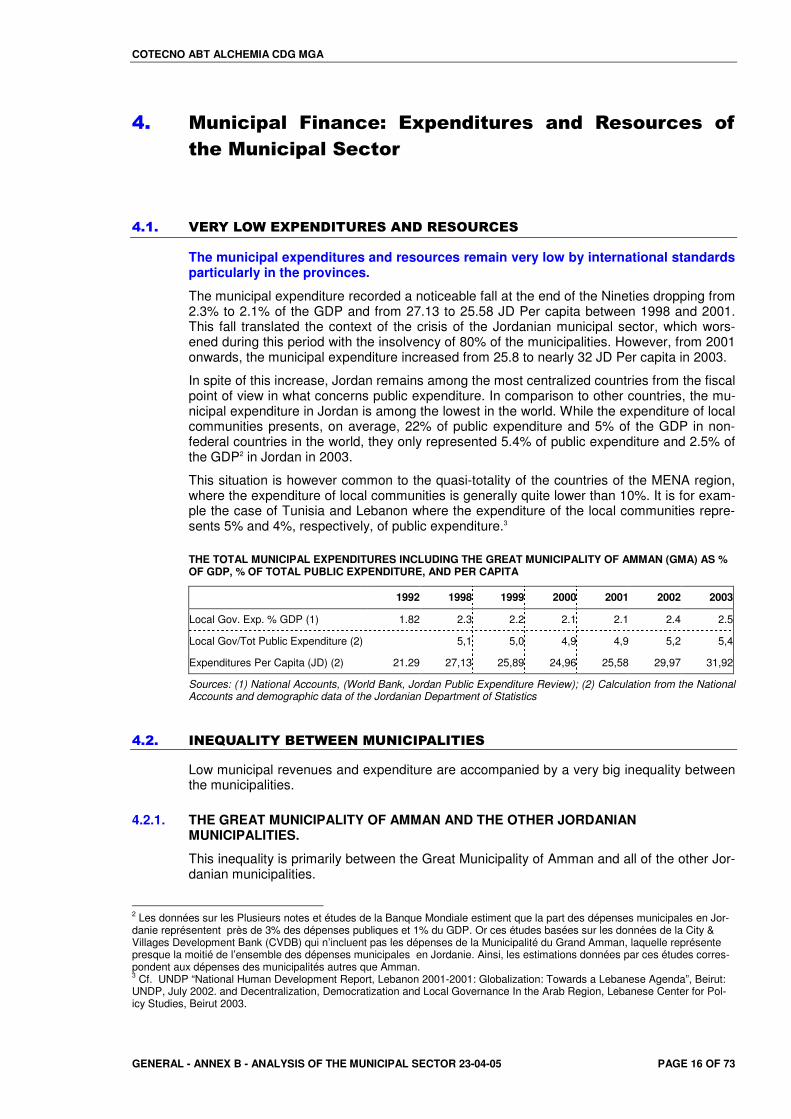
The municipal expenditure recorded a noticeable fall at the end of the Nineties dropping from 2.3% to 2.1% of the GDP and from 27.13 to 25.58 JD Per capita between 1998 and 2001. This fall translated the context of the crisis of the Jordanian municipal sector, which wors-ened during this period with the insolvency of 80% of the municipalities. However, from 2001 onwards, the municipal expenditure increased from 25.8 to nearly 32 JD Per capita in 2003.
In spite of this increase, Jordan remains among the most centralized countries from the fiscal point of view in what concerns public expenditure. In comparison to other countries, the mu-nicipal expenditure in Jordan is among the lowest in the world. While the expenditure of local communities presents, on average, 22% of public expenditure and 5% of the GDP in non-federal countries in the world, they only represented 5.4% of public expenditure and 2.5% of the GDP2 in Jordan in 2003.
This situation is however common to the quasi-totality of the countries of the MENA region, where the expenditure of local communities is generally quite lower than 10%. It is for exam-ple the case of Tunisia and Lebanon where the expenditure of the local communities repre-sents 5% and 4%, respectively, of public expenditure.3
THE TOTAL MUNICIPAL EXPENDITURES INCLUDING THE GREAT MUNICIPALITY OF AMMAN (GMA) AS % OF GDP, % OF TOTAL PUBLIC EXPENDITURE, AND PER CAPITA
1992 1998 1999 2000 2001 2002 2003
Local Gov. Exp. % GDP (1) 1.82 2.3 2.2 2.1 2.1 2.4 2.5
Local Gov/Tot Public Expenditure (2) 5,1 5,0 4,9 4,9 5,2 5,4
Expenditures Per Capita (JD) (2) 21.29 27,13 25,89 24,96 25,58 29,97 31,92
Sources: (1) National Accounts, (World Bank, Jordan Public Expenditure Review); (2) Calculation from the National Accounts and demographic data of the Jordanian Department of Statistics
7�1�� )#�80�()�-����+ ��#��0#)'),�()�)�$�
Low municipal revenues and expenditure are accompanied by a very big inequality between the municipalities.
4.2.1. THE GREAT MUNICIPALITY OF AMMAN AND THE OTHER JORDANIAN MUNICIPALITIES.
This inequality is primarily between the Great Municipality of Amman and all of the other Jor-danian municipalities.
2 Les données sur les Plusieurs notes et études de la Banque Mondiale estiment que la part des dépenses municipales en Jor-danie représentent près de 3% des dépenses publiques et 1% du GDP. Or ces études basées sur les données de la City & Villages Development Bank (CVDB) qui n’incluent pas les dépenses de la Municipalité du Grand Amman, laquelle représente presque la moitié de l’ensemble des dépenses municipales en Jordanie. Ainsi, les estimations données par ces études corres-pondent aux dépenses des municipalités autres que Amman. 3 Cf. UNDP “National Human Development Report, Lebanon 2001-2001: Globalization: Towards a Lebanese Agenda”, Beirut: UNDP, July 2002. and Decentralization, Democratization and Local Governance In the Arab Region, Lebanese Center for Pol-icy Studies, Beirut 2003.
COTECNO ABT ALCHEMIA CDG MGA
GENERAL - ANNEX B - ANALYSIS OF THE MUNICIPAL SECTOR 23-04-05 PAGE 17 OF 73
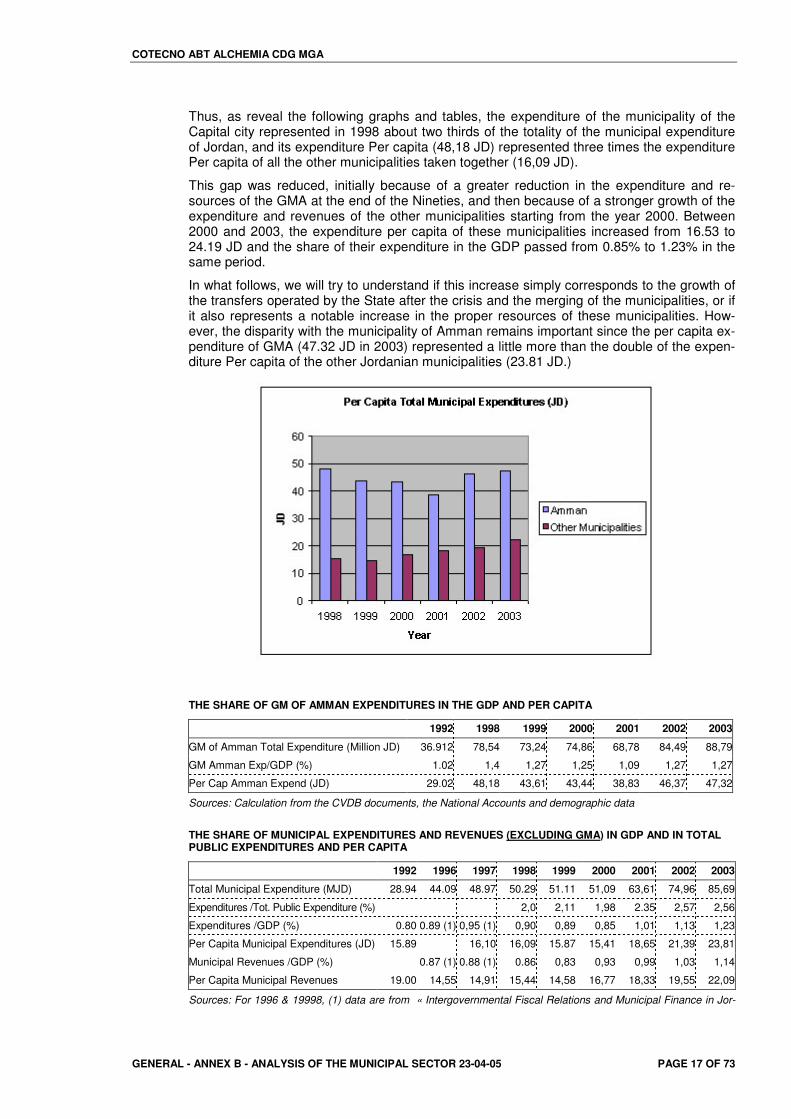
Thus, as reveal the following graphs and tables, the expenditure of the municipality of the Capital city represented in 1998 about two thirds of the totality of the municipal expenditure of Jordan, and its expenditure Per capita (48,18 JD) represented three times the expenditure Per capita of all the other municipalities taken together (16,09 JD).
This gap was reduced, initially because of a greater reduction in the expenditure and re-sources of the GMA at the end of the Nineties, and then because of a stronger growth of the expenditure and revenues of the other municipalities starting from the year 2000. Between 2000 and 2003, the expenditure per capita of these municipalities increased from 16.53 to 24.19 JD and the share of their expenditure in the GDP passed from 0.85% to 1.23% in the same period.
In what follows, we will try to understand if this increase simply corresponds to the growth of the transfers operated by the State after the crisis and the merging of the municipalities, or if it also represents a notable increase in the proper resources of these municipalities. How-ever, the disparity with the municipality of Amman remains important since the per capita ex-penditure of GMA (47.32 JD in 2003) represented a little more than the double of the expen-diture Per capita of the other Jordanian municipalities (23.81 JD.)
THE SHARE OF GM OF AMMAN EXPENDITURES IN THE GDP AND PER CAPITA
1992 1998 1999 2000 2001 2002 2003
GM of Amman Total Expenditure (Million JD) 36.912 78,54 73,24 74,86 68,78 84,49 88,79
GM Amman Exp/GDP (%) 1.02 1,4 1,27 1,25 1,09 1,27 1,27
Per Cap Amman Expend (JD) 29.02 48,18 43,61 43,44 38,83 46,37 47,32
Sources: Calculation from the CVDB documents, the National Accounts and demographic data
THE SHARE OF MUNICIPAL EXPENDITURES AND REVENUES (EXCLUDING GMA) IN GDP AND IN TOTAL PUBLIC EXPENDITURES AND PER CAPITA
1992 1996 1997 1998 1999 2000 2001 2002 2003
Total Municipal Expenditure (MJD) 28.94 44.09 48.97 50.29 51.11 51,09 63,61 74,96 85,69
Expenditures /Tot. Public Expenditure (%) 2,0 2,11 1,98 2.35 2,57 2,56
Expenditures /GDP (%) 0.80 0.89 (1) 0,95 (1) 0,90 0,89 0,85 1,01 1,13 1,23
Per Capita Municipal Expenditures (JD) 15.89 16,10 16,09 15.87 15,41 18,65 21,39 23,81
Municipal Revenues /GDP (%) 0.87 (1) 0.88 (1) 0.86 0,83 0,93 0,99 1,03 1,14
Per Capita Municipal Revenues 19.00 14,55 14,91 15,44 14,58 16,77 18,33 19,55 22,09
Sources: For 1996 & 19998, (1) data are from « Intergovernmental Fiscal Relations and Municipal Finance in Jor-
COTECNO ABT ALCHEMIA CDG MGA
GENERAL - ANNEX B - ANALYSIS OF THE MUNICIPAL SECTOR 23-04-05 PAGE 18 OF 73
dan », World Bank, 2002. Other data are calculated from the CVDB documents, the National Accounts and demo-graphic data.
4.2.2. BIG INEQUALITY OF RESOURCES AND EXPENDITURE AMONG THE MUNICIPALITIES
Beyond the substantial difference between Amman and the other municipalities, there also exists a very pronounced inequality of the municipal expenditure and revenues among the cities and the regions.
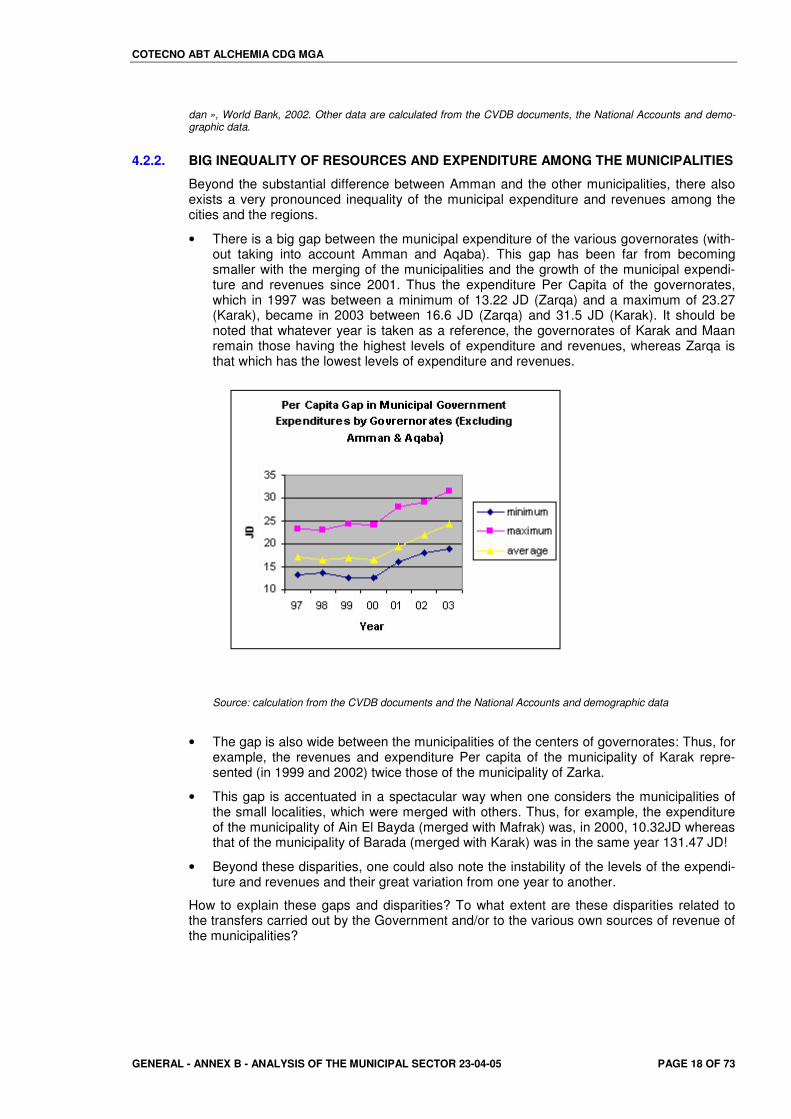
• There is a big gap between the municipal expenditure of the various governorates (with-out taking into account Amman and Aqaba). This gap has been far from becoming smaller with the merging of the municipalities and the growth of the municipal expendi-ture and revenues since 2001. Thus the expenditure Per Capita of the governorates, which in 1997 was between a minimum of 13.22 JD (Zarqa) and a maximum of 23.27 (Karak), became in 2003 between 16.6 JD (Zarqa) and 31.5 JD (Karak). It should be noted that whatever year is taken as a reference, the governorates of Karak and Maan remain those having the highest levels of expenditure and revenues, whereas Zarqa is that which has the lowest levels of expenditure and revenues.
Source: calculation from the CVDB documents and the National Accounts and demographic data
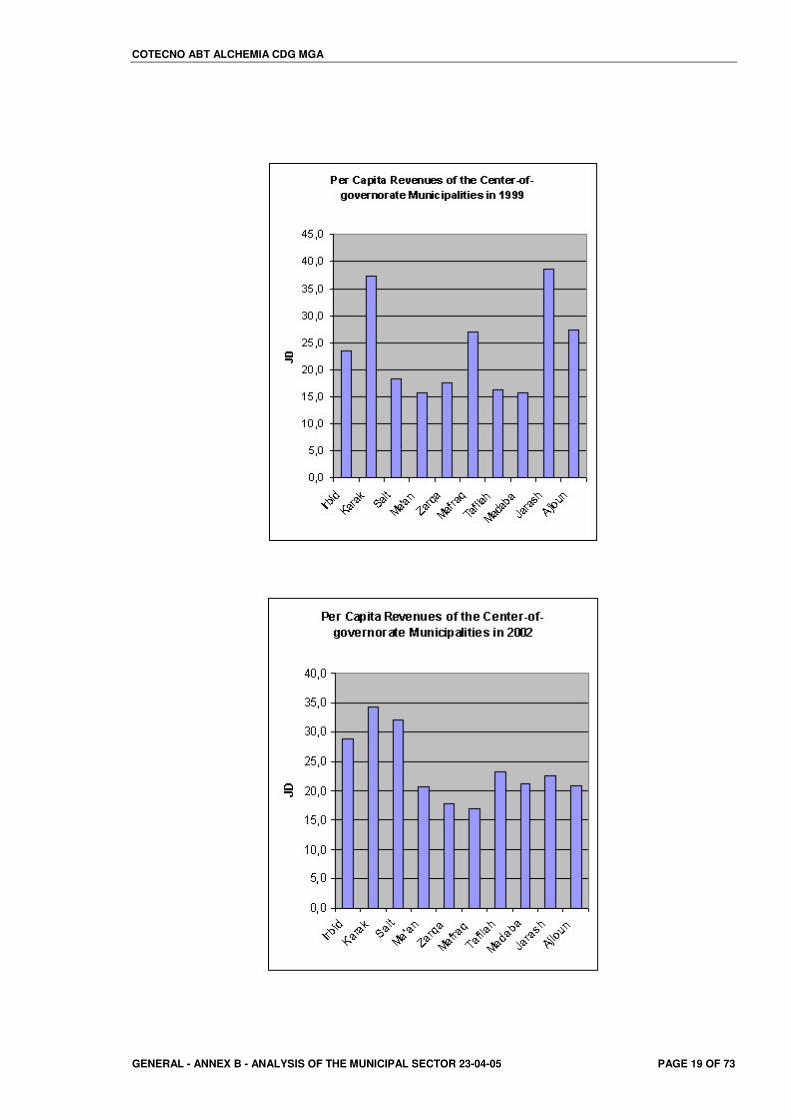
• The gap is also wide between the municipalities of the centers of governorates: Thus, for example, the revenues and expenditure Per capita of the municipality of Karak repre-sented (in 1999 and 2002) twice those of the municipality of Zarka.
• This gap is accentuated in a spectacular way when one considers the municipalities of the small localities, which were merged with others. Thus, for example, the expenditure of the municipality of Ain El Bayda (merged with Mafrak) was, in 2000, 10.32JD whereas that of the municipality of Barada (merged with Karak) was in the same year 131.47 JD!
• Beyond these disparities, one could also note the instability of the levels of the expendi-ture and revenues and their great variation from one year to another.
How to explain these gaps and disparities? To what extent are these disparities related to the transfers carried out by the Government and/or to the various own sources of revenue of the municipalities?
COTECNO ABT ALCHEMIA CDG MGA
GENERAL - ANNEX B - ANALYSIS OF THE MUNICIPAL SECTOR 23-04-05 PAGE 19 OF 73
COTECNO ABT ALCHEMIA CDG MGA
GENERAL - ANNEX B - ANALYSIS OF THE MUNICIPAL SECTOR 23-04-05 PAGE 20 OF 73
9�� ����������" � �� �%�)�� �6� ��� ���������� ��$��� ��
The Jordanian municipalities have several types of revenues, which could be grouped in two categories:
• Resources collected and transferred to the municipalities by the Government: 1. Taxes and fees collected by the Government and shared with the municipalities ac-
cording to criteria decided by the latter. This set, generally designated by the term “Fuel tax”, constitutes today, for the quasi-totality of the municipalities, the most im-portant source of revenue.
2. The tax on property (Land & Building tax) is a local tax on the property. This tax is generally collected by the Ministry of Finance on behalf of the municipalities and is transferred to the localities of origin.
• Revenues collected by the municipalities, could be grouped in two categories: 3. Royalties, rights, charges and donations collected by the municipalities (Job & Build-
ing and construction licensing, Revenues from planning & development, Fees, Revenues from garbage collection, etc)
4. Revenues from municipal projects, which generate income (rental revenues & Revenues from goods and services projects).
Type of revenue
Taxes and Fees: Fuel Tax & Land and Building Tax (Musakafat)
Job Licensing
Building and construction licensing
Revenues (planning, development,)
Fees
Revenues from preventing noxious areas and garbage collection
Other Revenues
Grants and contributions
Rental Revenues
Revenues from goods and services projects
Interest revenues
Financial investments revenues
To these revenues it is necessary to add the loans (with or without interest) that the munici-palities could contract at the City and Village Development Bank (CVDB).
9���� ������/� #�," ,�"�-�:(�#&�;��0)(&)#����/<�
The tax on property is collected according to tax rates and bases determined by Law. With the exception of Amman, Irbid and Zarqa which carry out the collection themselves, the Building Tax is collected on behalf of the municipalities by the Government, which should, in theory, transfer it back to the localities of origins in accordance with the principle of the source i.e. it must transfer to the municipalities the sums collected in their respective territo-ries after deducting some 10% for overheads. The State should, therefore, in theory, play the simple role of a "collector" without intervening in the determination of the amount, which goes back to the various municipalities.
This is in principle a local tax and not a governmental transfer. However, as we will see later, the Government not only has the responsibility for the determination and the actualization of the tax rate, but also has a role in the determination of the amount transferred to the munici-
COTECNO ABT ALCHEMIA CDG MGA
GENERAL - ANNEX B - ANALYSIS OF THE MUNICIPAL SECTOR 23-04-05 PAGE 21 OF 73
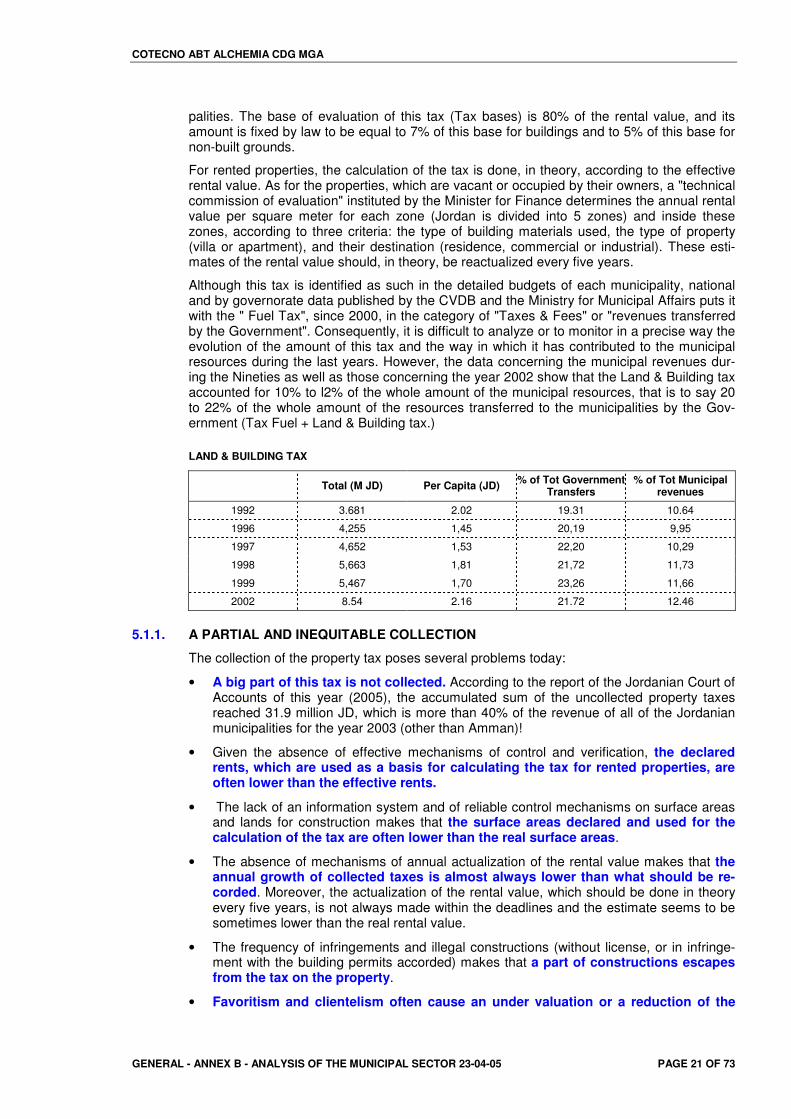
palities. The base of evaluation of this tax (Tax bases) is 80% of the rental value, and its amount is fixed by law to be equal to 7% of this base for buildings and to 5% of this base for non-built grounds.
For rented properties, the calculation of the tax is done, in theory, according to the effective rental value. As for the properties, which are vacant or occupied by their owners, a "technical commission of evaluation" instituted by the Minister for Finance determines the annual rental value per square meter for each zone (Jordan is divided into 5 zones) and inside these zones, according to three criteria: the type of building materials used, the type of property (villa or apartment), and their destination (residence, commercial or industrial). These esti-mates of the rental value should, in theory, be reactualized every five years.
Although this tax is identified as such in the detailed budgets of each municipality, national and by governorate data published by the CVDB and the Ministry for Municipal Affairs puts it with the " Fuel Tax", since 2000, in the category of "Taxes & Fees" or "revenues transferred by the Government". Consequently, it is difficult to analyze or to monitor in a precise way the evolution of the amount of this tax and the way in which it has contributed to the municipal resources during the last years. However, the data concerning the municipal revenues dur-ing the Nineties as well as those concerning the year 2002 show that the Land & Building tax accounted for 10% to l2% of the whole amount of the municipal resources, that is to say 20 to 22% of the whole amount of the resources transferred to the municipalities by the Gov-ernment (Tax Fuel + Land & Building tax.)
LAND & BUILDING TAX
Total (M JD) Per Capita (JD) % of Tot Government Transfers
% of Tot Municipal revenues
1992 3.681 2.02 19.31 10.64
1996 4,255 1,45 20,19 9,95
1997 4,652 1,53 22,20 10,29
1998 5,663 1,81 21,72 11,73
1999 5,467 1,70 23,26 11,66
2002 8.54 2.16 21.72 12.46
5.1.1. A PARTIAL AND INEQUITABLE COLLECTION
The collection of the property tax poses several problems today:
• A big part of this tax is not collected. According to the report of the Jordanian Court of Accounts of this year (2005), the accumulated sum of the uncollected property taxes reached 31.9 million JD, which is more than 40% of the revenue of all of the Jordanian municipalities for the year 2003 (other than Amman)!
• Given the absence of effective mechanisms of control and verification, the declared rents, which are used as a basis for calculating the tax for rented properties, are often lower than the effective rents.
• The lack of an information system and of reliable control mechanisms on surface areas and lands for construction makes that the surface areas declared and used for the calculation of the tax are often lower than the real surface areas.
• The absence of mechanisms of annual actualization of the rental value makes that the annual growth of collected taxes is almost always lower than what should be re-corded. Moreover, the actualization of the rental value, which should be done in theory every five years, is not always made within the deadlines and the estimate seems to be sometimes lower than the real rental value.
• The frequency of infringements and illegal constructions (without license, or in infringe-ment with the building permits accorded) makes that a part of constructions escapes from the tax on the property.
• Favoritism and clientelism often cause an under valuation or a reduction of the
COTECNO ABT ALCHEMIA CDG MGA
GENERAL - ANNEX B - ANALYSIS OF THE MUNICIPAL SECTOR 23-04-05 PAGE 22 OF 73
amount of tax to be paid.
• All of these mechanisms and problems give the tax on property an irregular and inequitable character. The buildings and residences recently rented (if the amount of the rent is really declared) are taxed more than old and vacant constructions; those who profit from relations of clientelism, and who often belong to the wealthier social groups, tend to be under-taxed in comparison to others.
5.1.2. A LOCAL TAX OR A DISTRIBUTION DETERMINED BY THE GOVERNMENT?
A system of transfer, which is not very transparent and little controlled by the munici-palities.
The analysis of the change in the amount of this tax per capita in the municipalities of the centers of governorates shows several significant facts:
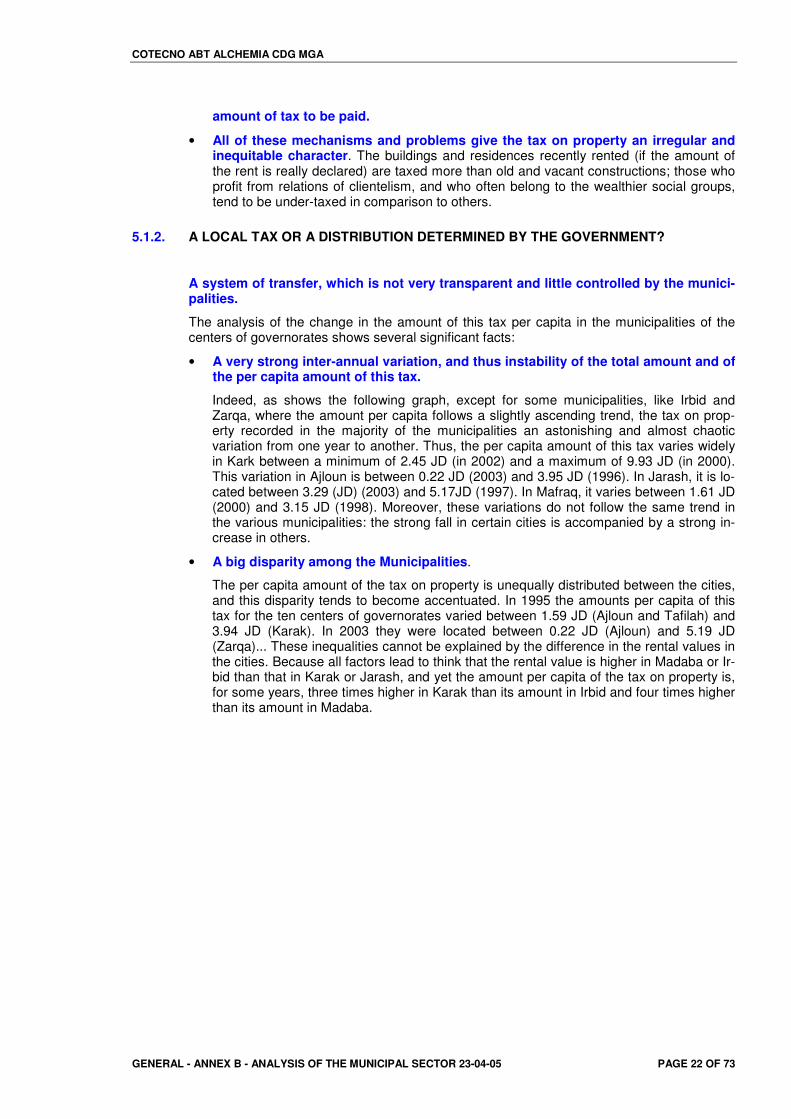
• A very strong inter-annual variation, and thus instability of the total amount and of the per capita amount of this tax.
Indeed, as shows the following graph, except for some municipalities, like Irbid and Zarqa, where the amount per capita follows a slightly ascending trend, the tax on prop-erty recorded in the majority of the municipalities an astonishing and almost chaotic variation from one year to another. Thus, the per capita amount of this tax varies widely in Kark between a minimum of 2.45 JD (in 2002) and a maximum of 9.93 JD (in 2000). This variation in Ajloun is between 0.22 JD (2003) and 3.95 JD (1996). In Jarash, it is lo-cated between 3.29 (JD) (2003) and 5.17JD (1997). In Mafraq, it varies between 1.61 JD (2000) and 3.15 JD (1998). Moreover, these variations do not follow the same trend in the various municipalities: the strong fall in certain cities is accompanied by a strong in-crease in others.
• A big disparity among the Municipalities.
The per capita amount of the tax on property is unequally distributed between the cities, and this disparity tends to become accentuated. In 1995 the amounts per capita of this tax for the ten centers of governorates varied between 1.59 JD (Ajloun and Tafilah) and 3.94 JD (Karak). In 2003 they were located between 0.22 JD (Ajloun) and 5.19 JD (Zarqa)... These inequalities cannot be explained by the difference in the rental values in the cities. Because all factors lead to think that the rental value is higher in Madaba or Ir-bid than that in Karak or Jarash, and yet the amount per capita of the tax on property is, for some years, three times higher in Karak than its amount in Irbid and four times higher than its amount in Madaba.
COTECNO ABT ALCHEMIA CDG MGA
GENERAL - ANNEX B - ANALYSIS OF THE MUNICIPAL SECTOR 23-04-05 PAGE 23 OF 73
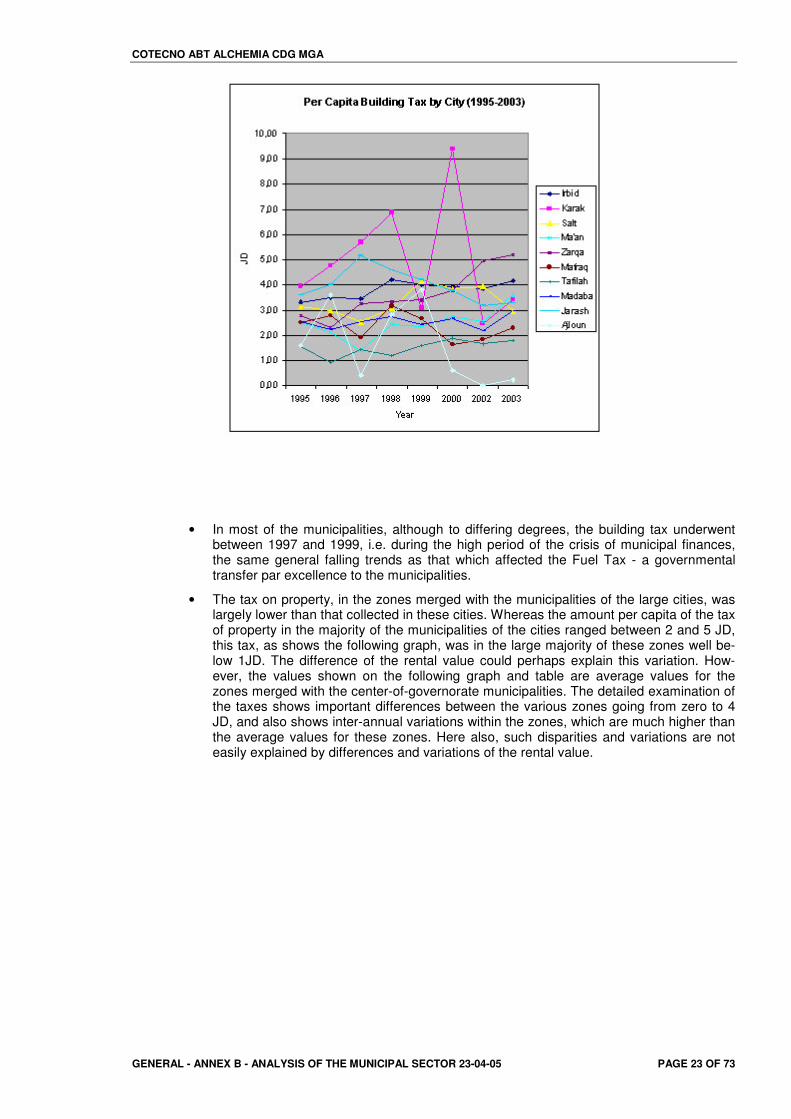
• In most of the municipalities, although to differing degrees, the building tax underwent between 1997 and 1999, i.e. during the high period of the crisis of municipal finances, the same general falling trends as that which affected the Fuel Tax - a governmental transfer par excellence to the municipalities.
• The tax on property, in the zones merged with the municipalities of the large cities, was largely lower than that collected in these cities. Whereas the amount per capita of the tax of property in the majority of the municipalities of the cities ranged between 2 and 5 JD, this tax, as shows the following graph, was in the large majority of these zones well be-low 1JD. The difference of the rental value could perhaps explain this variation. How-ever, the values shown on the following graph and table are average values for the zones merged with the center-of-governorate municipalities. The detailed examination of the taxes shows important differences between the various zones going from zero to 4 JD, and also shows inter-annual variations within the zones, which are much higher than the average values for these zones. Here also, such disparities and variations are not easily explained by differences and variations of the rental value.
COTECNO ABT ALCHEMIA CDG MGA
GENERAL - ANNEX B - ANALYSIS OF THE MUNICIPAL SECTOR 23-04-05 PAGE 24 OF 73
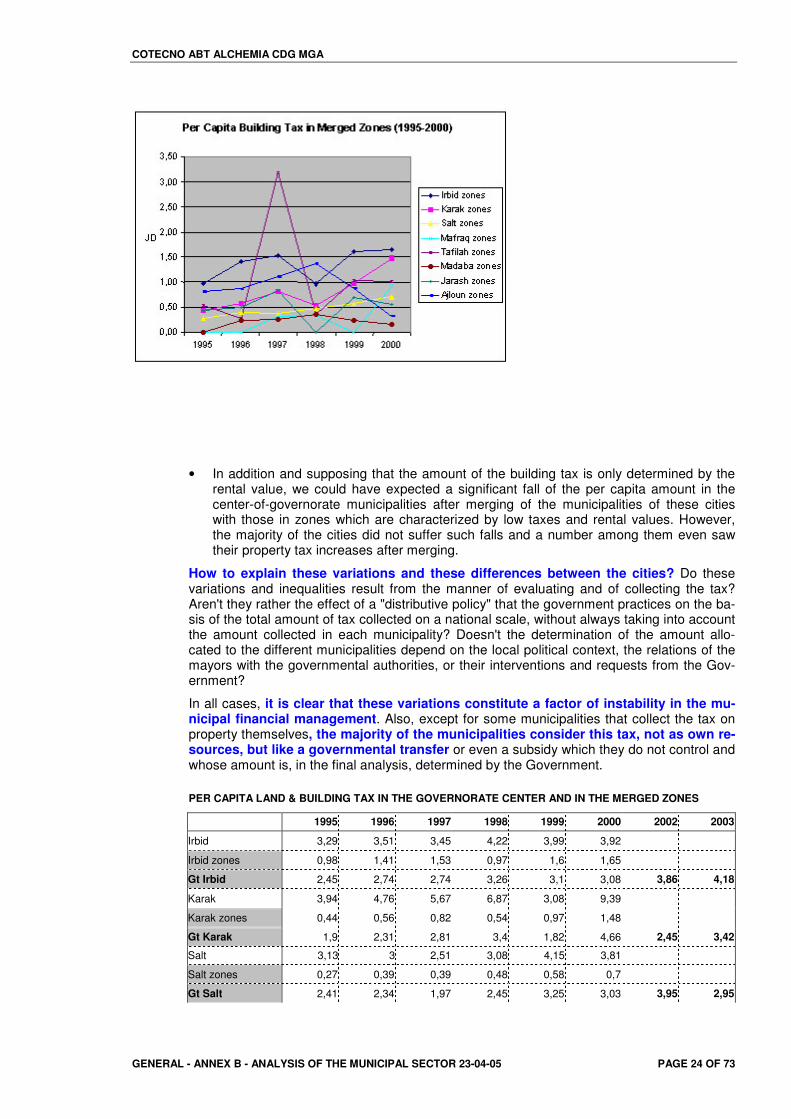
• In addition and supposing that the amount of the building tax is only determined by the rental value, we could have expected a significant fall of the per capita amount in the center-of-governorate municipalities after merging of the municipalities of these cities with those in zones which are characterized by low taxes and rental values. However, the majority of the cities did not suffer such falls and a number among them even saw their property tax increases after merging.
How to explain these variations and these differences between the cities? Do these variations and inequalities result from the manner of evaluating and of collecting the tax? Aren't they rather the effect of a "distributive policy" that the government practices on the ba-sis of the total amount of tax collected on a national scale, without always taking into account the amount collected in each municipality? Doesn't the determination of the amount allo-cated to the different municipalities depend on the local political context, the relations of the mayors with the governmental authorities, or their interventions and requests from the Gov-ernment?
In all cases, it is clear that these variations constitute a factor of instability in the mu-nicipal financial management. Also, except for some municipalities that collect the tax on property themselves, the majority of the municipalities consider this tax, not as own re-sources, but like a governmental transfer or even a subsidy which they do not control and whose amount is, in the final analysis, determined by the Government.
PER CAPITA LAND & BUILDING TAX IN THE GOVERNORATE CENTER AND IN THE MERGED ZONES
1995 1996 1997 1998 1999 2000 2002 2003
Irbid 3,29 3,51 3,45 4,22 3,99 3,92
Irbid zones 0,98 1,41 1,53 0,97 1,6 1,65
Gt Irbid 2,45 2,74 2,74 3,26 3,1 3,08 3,86 4,18
Karak 3,94 4,76 5,67 6,87 3,08 9,39
Karak zones 0,44 0,56 0,82 0,54 0,97 1,48
Gt Karak 1,9 2,31 2,81 3,4 1,82 4,66 2,45 3,42
Salt 3,13 3 2,51 3,08 4,15 3,81
Salt zones 0,27 0,39 0,39 0,48 0,58 0,7
Gt Salt 2,41 2,34 1,97 2,45 3,25 3,03 3,95 2,95
COTECNO ABT ALCHEMIA CDG MGA
GENERAL - ANNEX B - ANALYSIS OF THE MUNICIPAL SECTOR 23-04-05 PAGE 25 OF 73
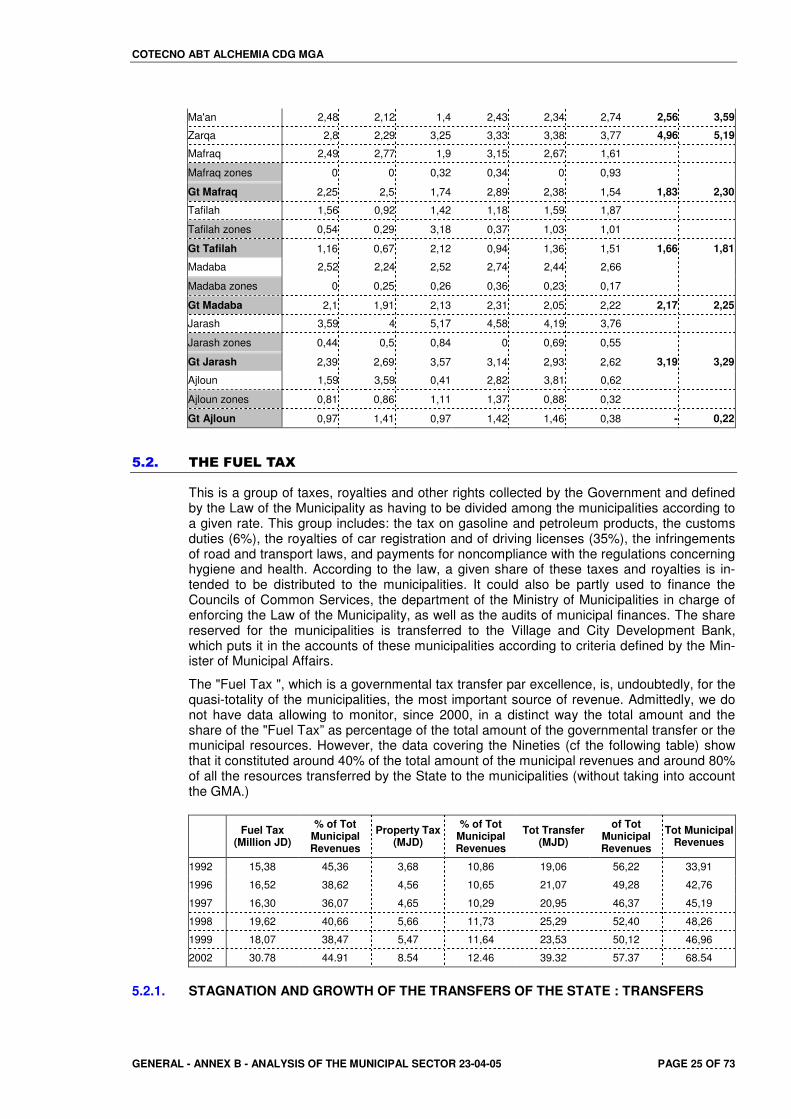
Ma'an 2,48 2,12 1,4 2,43 2,34 2,74 2,56 3,59
Zarqa 2,8 2,29 3,25 3,33 3,38 3,77 4,96 5,19
Mafraq 2,49 2,77 1,9 3,15 2,67 1,61
Mafraq zones 0 0 0,32 0,34 0 0,93
Gt Mafraq 2,25 2,5 1,74 2,89 2,38 1,54 1,83 2,30
Tafilah 1,56 0,92 1,42 1,18 1,59 1,87
Tafilah zones 0,54 0,29 3,18 0,37 1,03 1,01
Gt Tafilah 1,16 0,67 2,12 0,94 1,36 1,51 1,66 1,81
Madaba 2,52 2,24 2,52 2,74 2,44 2,66
Madaba zones 0 0,25 0,26 0,36 0,23 0,17
Gt Madaba 2,1 1,91 2,13 2,31 2,05 2,22 2,17 2,25
Jarash 3,59 4 5,17 4,58 4,19 3,76
Jarash zones 0,44 0,5 0,84 0 0,69 0,55
Gt Jarash 2,39 2,69 3,57 3,14 2,93 2,62 3,19 3,29
Ajloun 1,59 3,59 0,41 2,82 3,81 0,62
Ajloun zones 0,81 0,86 1,11 1,37 0,88 0,32
Gt Ajloun 0,97 1,41 0,97 1,42 1,46 0,38 - 0,22
9�1�� ����.0�(���/�
This is a group of taxes, royalties and other rights collected by the Government and defined by the Law of the Municipality as having to be divided among the municipalities according to a given rate. This group includes: the tax on gasoline and petroleum products, the customs duties (6%), the royalties of car registration and of driving licenses (35%), the infringements of road and transport laws, and payments for noncompliance with the regulations concerning hygiene and health. According to the law, a given share of these taxes and royalties is in-tended to be distributed to the municipalities. It could also be partly used to finance the Councils of Common Services, the department of the Ministry of Municipalities in charge of enforcing the Law of the Municipality, as well as the audits of municipal finances. The share reserved for the municipalities is transferred to the Village and City Development Bank, which puts it in the accounts of these municipalities according to criteria defined by the Min-ister of Municipal Affairs.
The "Fuel Tax ", which is a governmental tax transfer par excellence, is, undoubtedly, for the quasi-totality of the municipalities, the most important source of revenue. Admittedly, we do not have data allowing to monitor, since 2000, in a distinct way the total amount and the share of the "Fuel Tax” as percentage of the total amount of the governmental transfer or the municipal resources. However, the data covering the Nineties (cf the following table) show that it constituted around 40% of the total amount of the municipal revenues and around 80% of all the resources transferred by the State to the municipalities (without taking into account the GMA.)
Fuel Tax (Million JD)
% of Tot Municipal Revenues
Property Tax (MJD)
% of Tot Municipal Revenues
Tot Transfer (MJD)
of Tot Municipal Revenues
Tot Municipal Revenues
1992 15,38 45,36 3,68 10,86 19,06 56,22 33,91
1996 16,52 38,62 4,56 10,65 21,07 49,28 42,76
1997 16,30 36,07 4,65 10,29 20,95 46,37 45,19
1998 19,62 40,66 5,66 11,73 25,29 52,40 48,26
1999 18,07 38,47 5,47 11,64 23,53 50,12 46,96
2002 30.78 44.91 8.54 12.46 39.32 57.37 68.54
5.2.1. STAGNATION AND GROWTH OF THE TRANSFERS OF THE STATE : TRANSFERS
COTECNO ABT ALCHEMIA CDG MGA
GENERAL - ANNEX B - ANALYSIS OF THE MUNICIPAL SECTOR 23-04-05 PAGE 26 OF 73
BUOYANCY
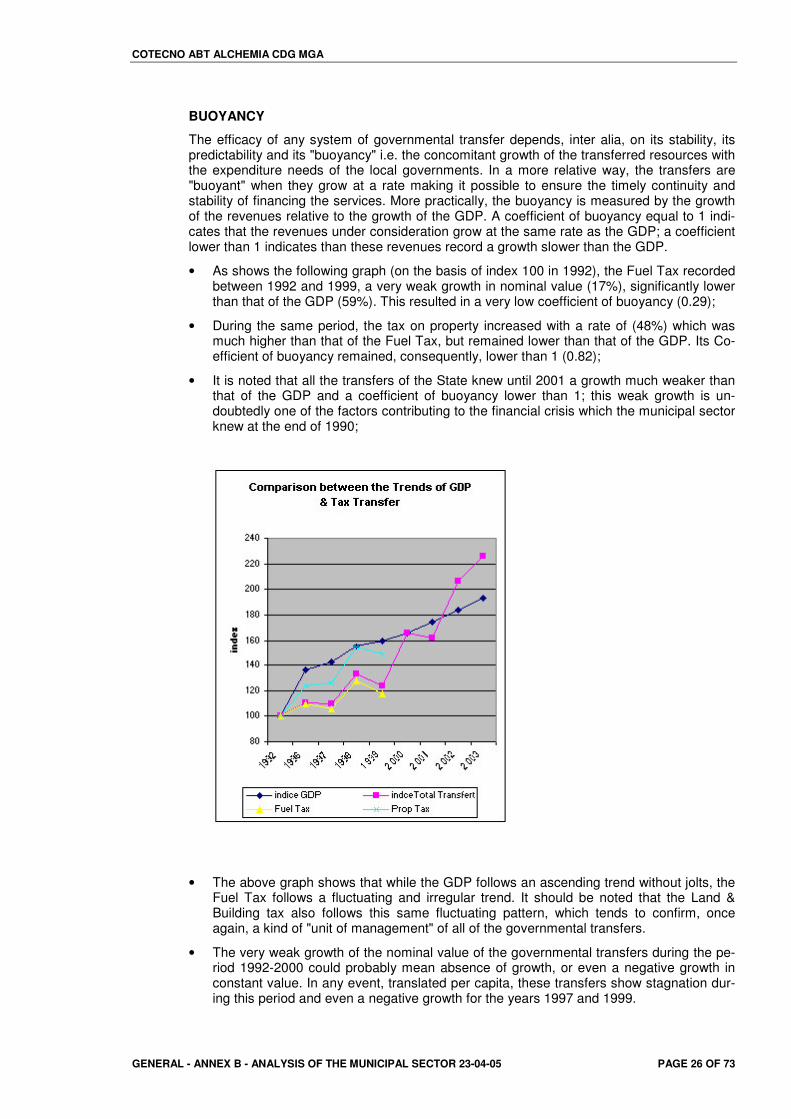
The efficacy of any system of governmental transfer depends, inter alia, on its stability, its predictability and its "buoyancy" i.e. the concomitant growth of the transferred resources with the expenditure needs of the local governments. In a more relative way, the transfers are "buoyant" when they grow at a rate making it possible to ensure the timely continuity and stability of financing the services. More practically, the buoyancy is measured by the growth of the revenues relative to the growth of the GDP. A coefficient of buoyancy equal to 1 indi-cates that the revenues under consideration grow at the same rate as the GDP; a coefficient lower than 1 indicates than these revenues record a growth slower than the GDP.
• As shows the following graph (on the basis of index 100 in 1992), the Fuel Tax recorded between 1992 and 1999, a very weak growth in nominal value (17%), significantly lower than that of the GDP (59%). This resulted in a very low coefficient of buoyancy (0.29);
• During the same period, the tax on property increased with a rate of (48%) which was much higher than that of the Fuel Tax, but remained lower than that of the GDP. Its Co-efficient of buoyancy remained, consequently, lower than 1 (0.82);
• It is noted that all the transfers of the State knew until 2001 a growth much weaker than that of the GDP and a coefficient of buoyancy lower than 1; this weak growth is un-doubtedly one of the factors contributing to the financial crisis which the municipal sector knew at the end of 1990;
• The above graph shows that while the GDP follows an ascending trend without jolts, the Fuel Tax follows a fluctuating and irregular trend. It should be noted that the Land & Building tax also follows this same fluctuating pattern, which tends to confirm, once again, a kind of "unit of management" of all of the governmental transfers.
• The very weak growth of the nominal value of the governmental transfers during the pe-riod 1992-2000 could probably mean absence of growth, or even a negative growth in constant value. In any event, translated per capita, these transfers show stagnation dur-ing this period and even a negative growth for the years 1997 and 1999.
COTECNO ABT ALCHEMIA CDG MGA
GENERAL - ANNEX B - ANALYSIS OF THE MUNICIPAL SECTOR 23-04-05 PAGE 27 OF 73
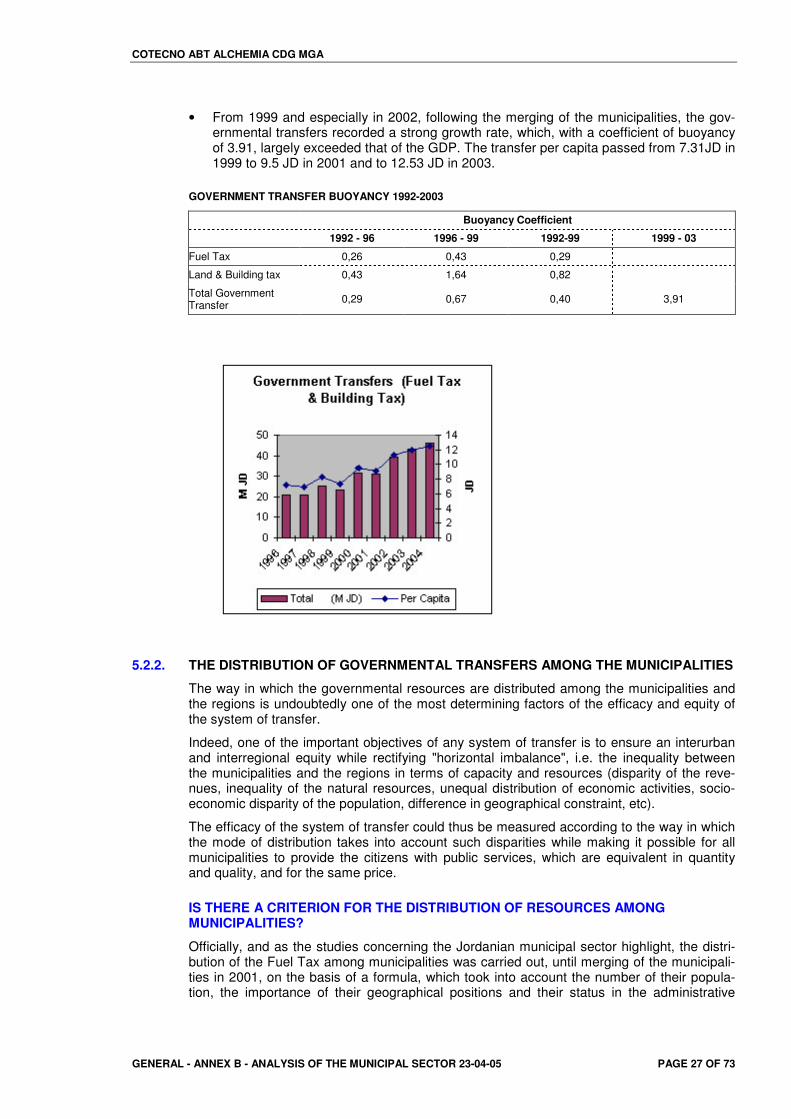
• From 1999 and especially in 2002, following the merging of the municipalities, the gov-ernmental transfers recorded a strong growth rate, which, with a coefficient of buoyancy of 3.91, largely exceeded that of the GDP. The transfer per capita passed from 7.31JD in 1999 to 9.5 JD in 2001 and to 12.53 JD in 2003.
GOVERNMENT TRANSFER BUOYANCY 1992-2003
Buoyancy Coefficient
1992 - 96 1996 - 99 1992-99 1999 - 03
Fuel Tax 0,26 0,43 0,29
Land & Building tax 0,43 1,64 0,82
Total Government Transfer 0,29 0,67 0,40 3,91
5.2.2. THE DISTRIBUTION OF GOVERNMENTAL TRANSFERS AMONG THE MUNICIPALITIES
The way in which the governmental resources are distributed among the municipalities and the regions is undoubtedly one of the most determining factors of the efficacy and equity of the system of transfer.
Indeed, one of the important objectives of any system of transfer is to ensure an interurban and interregional equity while rectifying "horizontal imbalance", i.e. the inequality between the municipalities and the regions in terms of capacity and resources (disparity of the reve-nues, inequality of the natural resources, unequal distribution of economic activities, socio-economic disparity of the population, difference in geographical constraint, etc).
The efficacy of the system of transfer could thus be measured according to the way in which the mode of distribution takes into account such disparities while making it possible for all municipalities to provide the citizens with public services, which are equivalent in quantity and quality, and for the same price.
IS THERE A CRITERION FOR THE DISTRIBUTION OF RESOURCES AMONG MUNICIPALITIES?
Officially, and as the studies concerning the Jordanian municipal sector highlight, the distri-bution of the Fuel Tax among municipalities was carried out, until merging of the municipali-ties in 2001, on the basis of a formula, which took into account the number of their popula-tion, the importance of their geographical positions and their status in the administrative
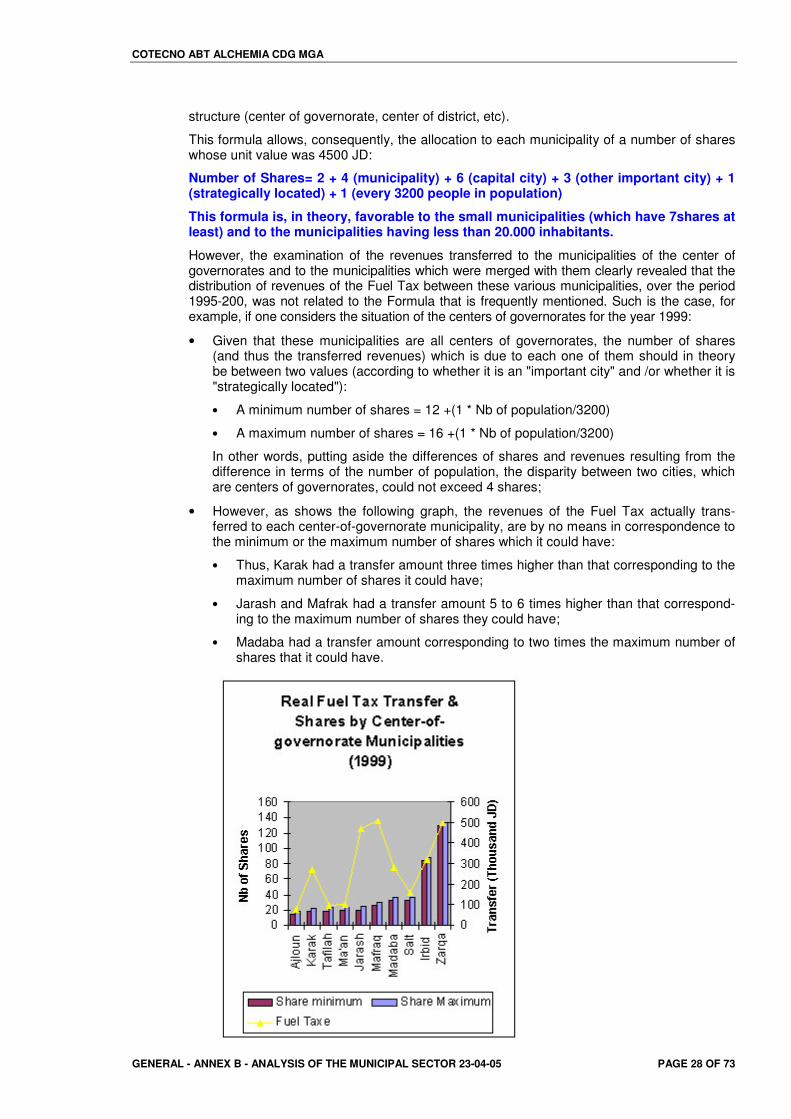
COTECNO ABT ALCHEMIA CDG MGA
GENERAL - ANNEX B - ANALYSIS OF THE MUNICIPAL SECTOR 23-04-05 PAGE 28 OF 73
structure (center of governorate, center of district, etc).
This formula allows, consequently, the allocation to each municipality of a number of shares whose unit value was 4500 JD:
Number of Shares= 2 + 4 (municipality) + 6 (capital city) + 3 (other important city) + 1 (strategically located) + 1 (every 3200 people in population)
This formula is, in theory, favorable to the small municipalities (which have 7shares at least) and to the municipalities having less than 20.000 inhabitants.
However, the examination of the revenues transferred to the municipalities of the center of governorates and to the municipalities which were merged with them clearly revealed that the distribution of revenues of the Fuel Tax between these various municipalities, over the period 1995-200, was not related to the Formula that is frequently mentioned. Such is the case, for example, if one considers the situation of the centers of governorates for the year 1999:
• Given that these municipalities are all centers of governorates, the number of shares (and thus the transferred revenues) which is due to each one of them should in theory be between two values (according to whether it is an "important city" and /or whether it is "strategically located"):
• A minimum number of shares = 12 +(1 * Nb of population/3200)
• A maximum number of shares = 16 +(1 * Nb of population/3200)
In other words, putting aside the differences of shares and revenues resulting from the difference in terms of the number of population, the disparity between two cities, which are centers of governorates, could not exceed 4 shares;
• However, as shows the following graph, the revenues of the Fuel Tax actually trans-ferred to each center-of-governorate municipality, are by no means in correspondence to the minimum or the maximum number of shares which it could have:
• Thus, Karak had a transfer amount three times higher than that corresponding to the maximum number of shares it could have;
• Jarash and Mafrak had a transfer amount 5 to 6 times higher than that correspond-ing to the maximum number of shares they could have;
• Madaba had a transfer amount corresponding to two times the maximum number of shares that it could have.
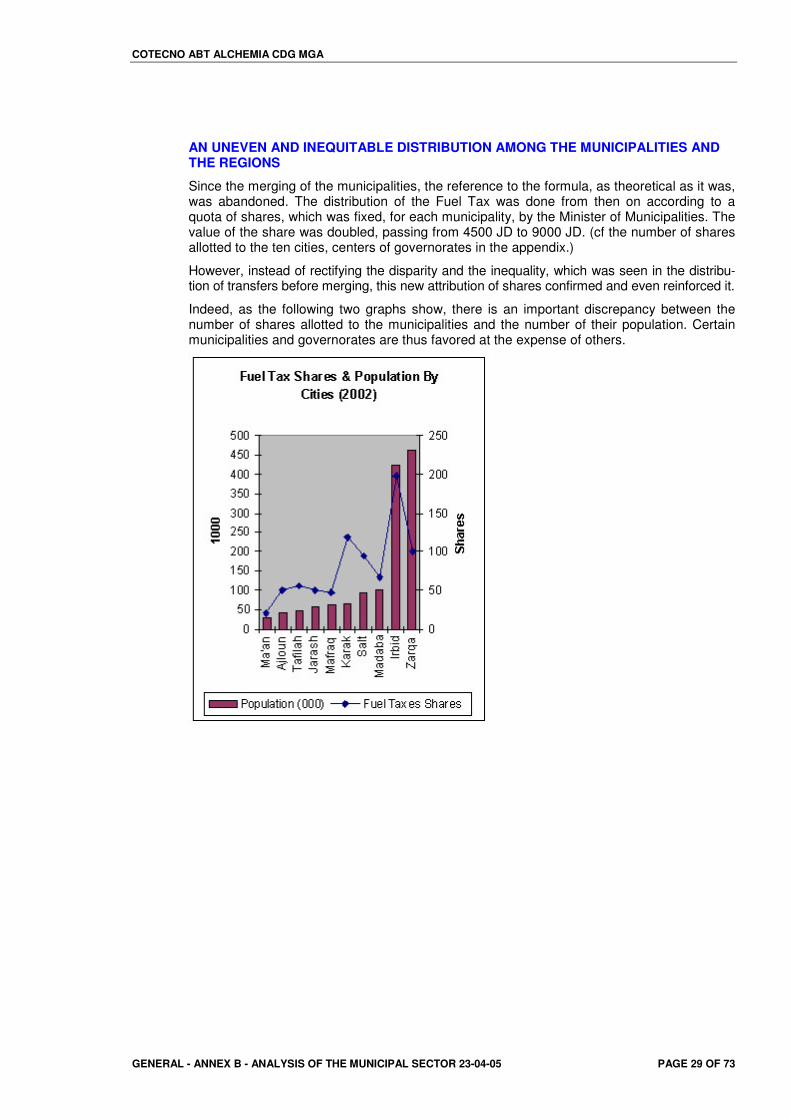
COTECNO ABT ALCHEMIA CDG MGA
GENERAL - ANNEX B - ANALYSIS OF THE MUNICIPAL SECTOR 23-04-05 PAGE 29 OF 73
AN UNEVEN AND INEQUITABLE DISTRIBUTION AMONG THE MUNICIPALITIES AND THE REGIONS
Since the merging of the municipalities, the reference to the formula, as theoretical as it was, was abandoned. The distribution of the Fuel Tax was done from then on according to a quota of shares, which was fixed, for each municipality, by the Minister of Municipalities. The value of the share was doubled, passing from 4500 JD to 9000 JD. (cf the number of shares allotted to the ten cities, centers of governorates in the appendix.)
However, instead of rectifying the disparity and the inequality, which was seen in the distribu-tion of transfers before merging, this new attribution of shares confirmed and even reinforced it.
Indeed, as the following two graphs show, there is an important discrepancy between the number of shares allotted to the municipalities and the number of their population. Certain municipalities and governorates are thus favored at the expense of others.
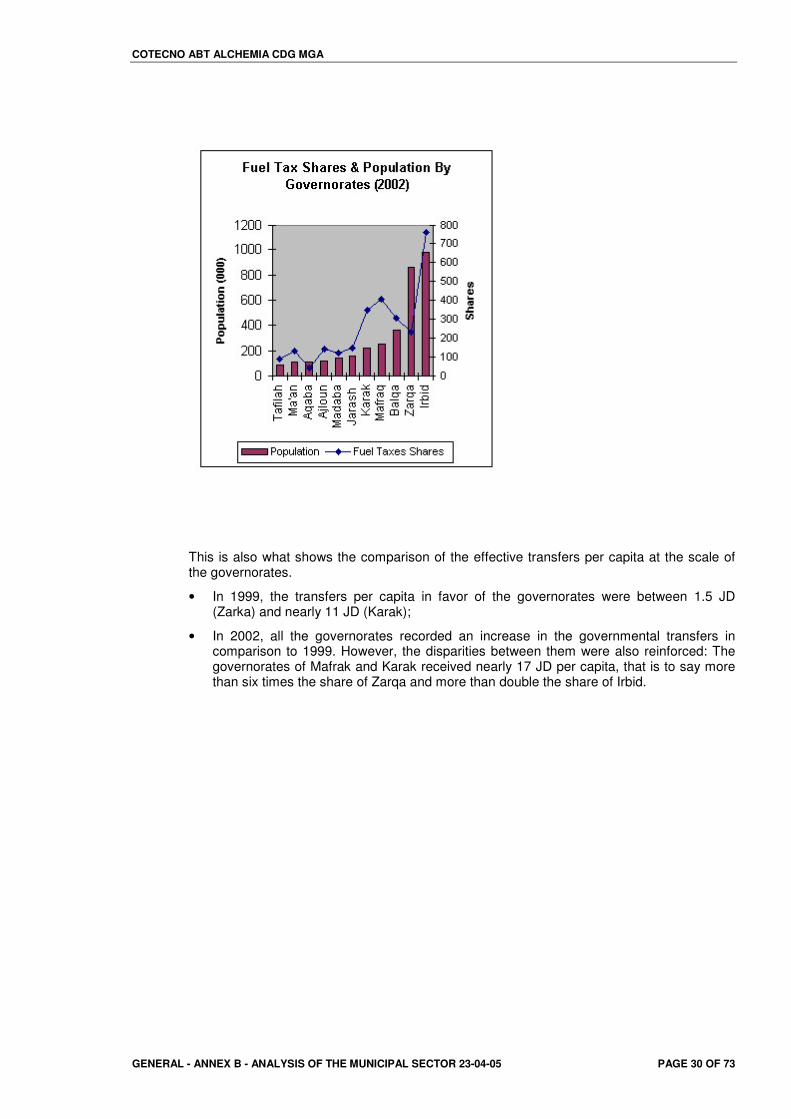
COTECNO ABT ALCHEMIA CDG MGA
GENERAL - ANNEX B - ANALYSIS OF THE MUNICIPAL SECTOR 23-04-05 PAGE 30 OF 73
This is also what shows the comparison of the effective transfers per capita at the scale of the governorates.
• In 1999, the transfers per capita in favor of the governorates were between 1.5 JD (Zarka) and nearly 11 JD (Karak);
• In 2002, all the governorates recorded an increase in the governmental transfers in comparison to 1999. However, the disparities between them were also reinforced: The governorates of Mafrak and Karak received nearly 17 JD per capita, that is to say more than six times the share of Zarqa and more than double the share of Irbid.
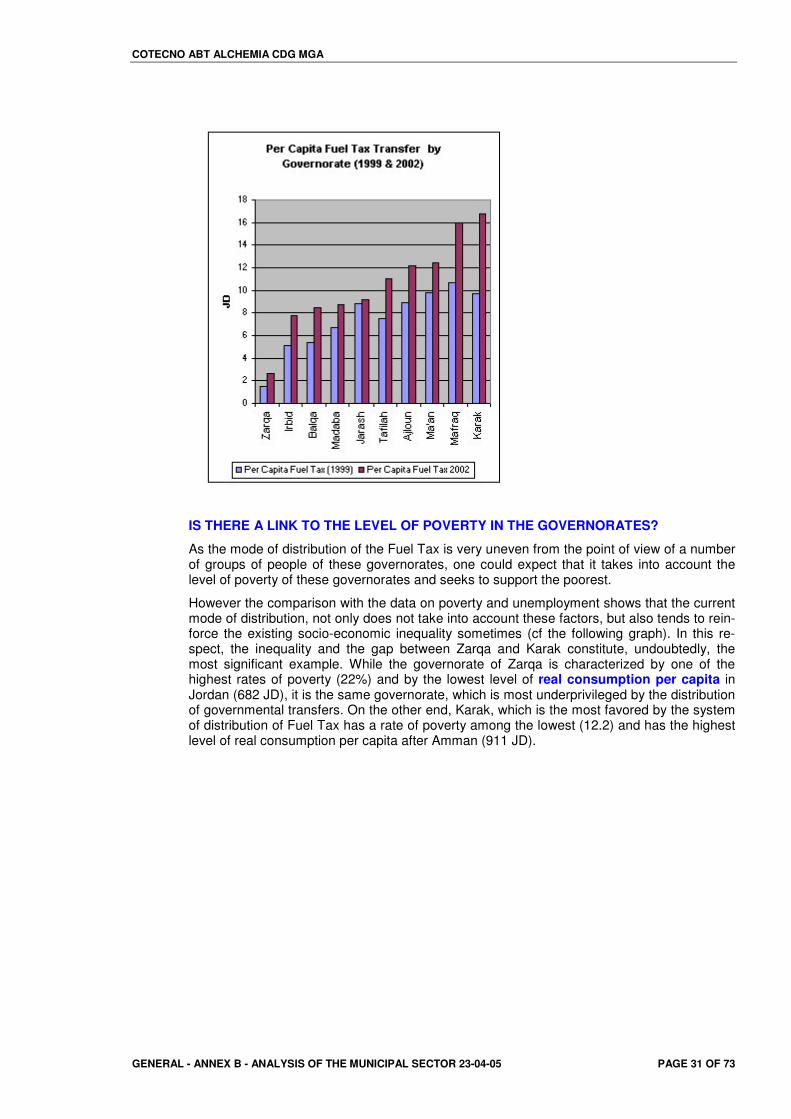
COTECNO ABT ALCHEMIA CDG MGA
GENERAL - ANNEX B - ANALYSIS OF THE MUNICIPAL SECTOR 23-04-05 PAGE 31 OF 73
IS THERE A LINK TO THE LEVEL OF POVERTY IN THE GOVERNORATES?
As the mode of distribution of the Fuel Tax is very uneven from the point of view of a number of groups of people of these governorates, one could expect that it takes into account the level of poverty of these governorates and seeks to support the poorest.
However the comparison with the data on poverty and unemployment shows that the current mode of distribution, not only does not take into account these factors, but also tends to rein-force the existing socio-economic inequality sometimes (cf the following graph). In this re-spect, the inequality and the gap between Zarqa and Karak constitute, undoubtedly, the most significant example. While the governorate of Zarqa is characterized by one of the highest rates of poverty (22%) and by the lowest level of real consumption per capita in Jordan (682 JD), it is the same governorate, which is most underprivileged by the distribution of governmental transfers. On the other end, Karak, which is the most favored by the system of distribution of Fuel Tax has a rate of poverty among the lowest (12.2) and has the highest level of real consumption per capita after Amman (911 JD).
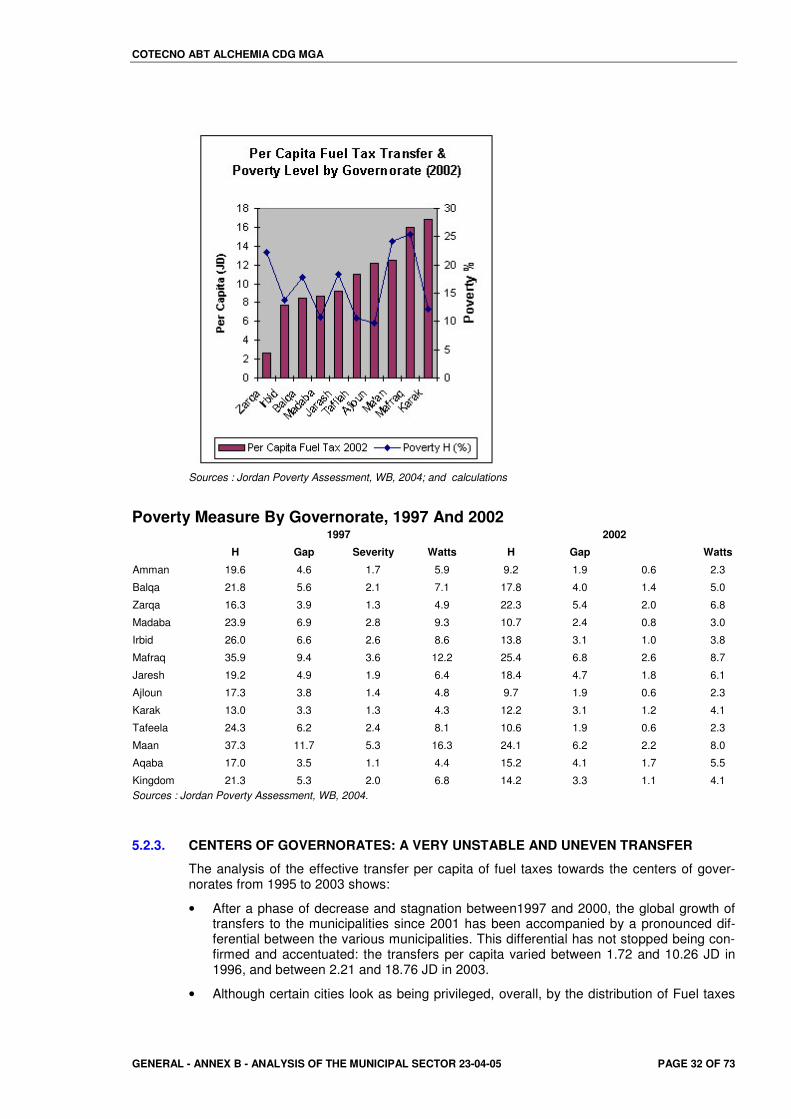
COTECNO ABT ALCHEMIA CDG MGA
GENERAL - ANNEX B - ANALYSIS OF THE MUNICIPAL SECTOR 23-04-05 PAGE 32 OF 73
Sources : Jordan Poverty Assessment, WB, 2004; and calculations
Poverty Measure By Governorate, 1997 And 2002 1997 2002
H Gap Severity Watts H Gap Watts
Amman 19.6 4.6 1.7 5.9 9.2 1.9 0.6 2.3
Balqa 21.8 5.6 2.1 7.1 17.8 4.0 1.4 5.0
Zarqa 16.3 3.9 1.3 4.9 22.3 5.4 2.0 6.8
Madaba 23.9 6.9 2.8 9.3 10.7 2.4 0.8 3.0
Irbid 26.0 6.6 2.6 8.6 13.8 3.1 1.0 3.8
Mafraq 35.9 9.4 3.6 12.2 25.4 6.8 2.6 8.7
Jaresh 19.2 4.9 1.9 6.4 18.4 4.7 1.8 6.1
Ajloun 17.3 3.8 1.4 4.8 9.7 1.9 0.6 2.3
Karak 13.0 3.3 1.3 4.3 12.2 3.1 1.2 4.1
Tafeela 24.3 6.2 2.4 8.1 10.6 1.9 0.6 2.3
Maan 37.3 11.7 5.3 16.3 24.1 6.2 2.2 8.0
Aqaba 17.0 3.5 1.1 4.4 15.2 4.1 1.7 5.5
Kingdom 21.3 5.3 2.0 6.8 14.2 3.3 1.1 4.1 Sources : Jordan Poverty Assessment, WB, 2004.
5.2.3. CENTERS OF GOVERNORATES: A VERY UNSTABLE AND UNEVEN TRANSFER
The analysis of the effective transfer per capita of fuel taxes towards the centers of gover-norates from 1995 to 2003 shows:
• After a phase of decrease and stagnation between1997 and 2000, the global growth of transfers to the municipalities since 2001 has been accompanied by a pronounced dif-ferential between the various municipalities. This differential has not stopped being con-firmed and accentuated: the transfers per capita varied between 1.72 and 10.26 JD in 1996, and between 2.21 and 18.76 JD in 2003.
• Although certain cities look as being privileged, overall, by the distribution of Fuel taxes
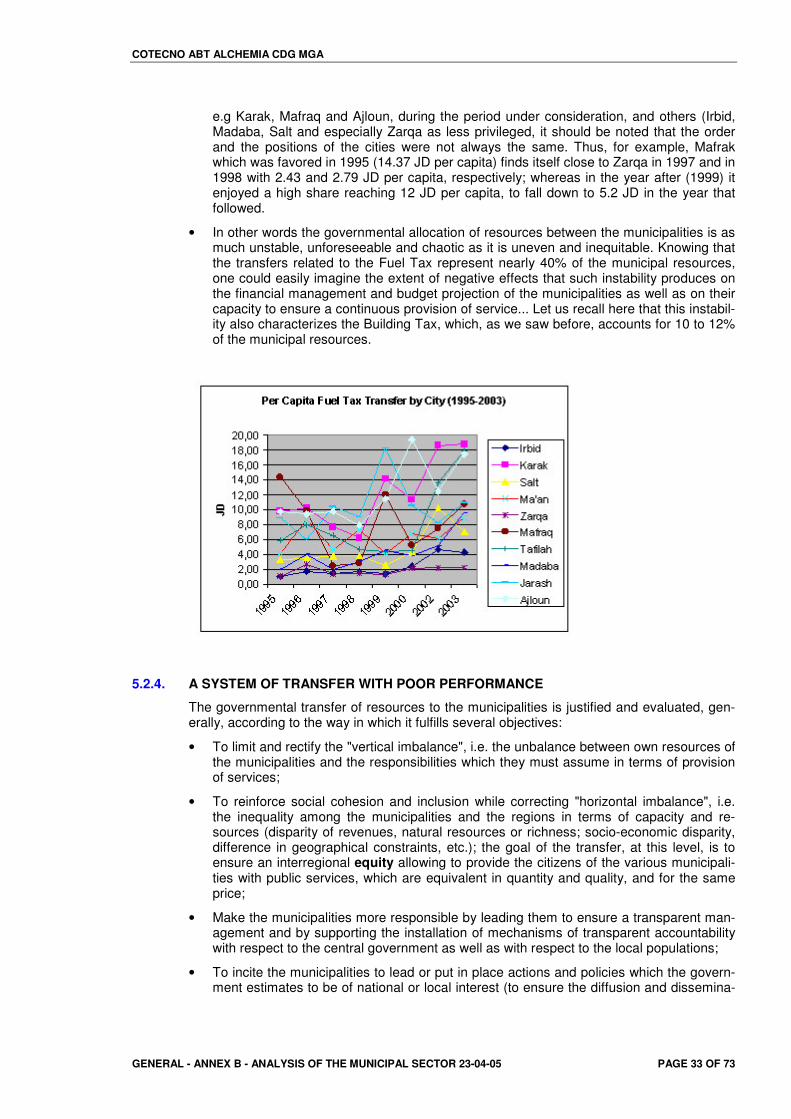
COTECNO ABT ALCHEMIA CDG MGA
GENERAL - ANNEX B - ANALYSIS OF THE MUNICIPAL SECTOR 23-04-05 PAGE 33 OF 73
e.g Karak, Mafraq and Ajloun, during the period under consideration, and others (Irbid, Madaba, Salt and especially Zarqa as less privileged, it should be noted that the order and the positions of the cities were not always the same. Thus, for example, Mafrak which was favored in 1995 (14.37 JD per capita) finds itself close to Zarqa in 1997 and in 1998 with 2.43 and 2.79 JD per capita, respectively; whereas in the year after (1999) it enjoyed a high share reaching 12 JD per capita, to fall down to 5.2 JD in the year that followed.
• In other words the governmental allocation of resources between the municipalities is as much unstable, unforeseeable and chaotic as it is uneven and inequitable. Knowing that the transfers related to the Fuel Tax represent nearly 40% of the municipal resources, one could easily imagine the extent of negative effects that such instability produces on the financial management and budget projection of the municipalities as well as on their capacity to ensure a continuous provision of service... Let us recall here that this instabil-ity also characterizes the Building Tax, which, as we saw before, accounts for 10 to 12% of the municipal resources.
5.2.4. A SYSTEM OF TRANSFER WITH POOR PERFORMANCE
The governmental transfer of resources to the municipalities is justified and evaluated, gen-erally, according to the way in which it fulfills several objectives:
• To limit and rectify the "vertical imbalance", i.e. the unbalance between own resources of the municipalities and the responsibilities which they must assume in terms of provision of services;
• To reinforce social cohesion and inclusion while correcting "horizontal imbalance", i.e. the inequality among the municipalities and the regions in terms of capacity and re-sources (disparity of revenues, natural resources or richness; socio-economic disparity, difference in geographical constraints, etc.); the goal of the transfer, at this level, is to ensure an interregional equity allowing to provide the citizens of the various municipali-ties with public services, which are equivalent in quantity and quality, and for the same price;
• Make the municipalities more responsible by leading them to ensure a transparent man-agement and by supporting the installation of mechanisms of transparent accountability with respect to the central government as well as with respect to the local populations;
• To incite the municipalities to lead or put in place actions and policies which the govern-ment estimates to be of national or local interest (to ensure the diffusion and dissemina-
COTECNO ABT ALCHEMIA CDG MGA
GENERAL - ANNEX B - ANALYSIS OF THE MUNICIPAL SECTOR 23-04-05 PAGE 34 OF 73
tion of different services, etc.); and to encourage them to reinforce their capacity, to bet-ter mobilize and manage their resources, and to assume their responsibilities and duties more effectively.
In view of such objectives, the data analysis shows that the current system of transfer, relat-ing to the Land & Building Tax and to the Fuel Tax, lacks effectiveness and equity, and con-stitutes a factor of fragility for the municipalities:
• The uneven distribution of the transferred resources tends to reinforce the local and re-gional disparities instead of attenuating them while contributing to reinforcing the less privileged communities and municipalities in terms of means and capacities. Admittedly, the current mode of distribution works better, overall, in the favor of small localities hav-ing less possibilities of generating their own resources than the cities. However, the dis-tribution of the transfers between the small localities and the cities is highly uneven and does not take into account the level of resources and the local capacities.
• The instability and the strong variation of transferred resources weaken the municipali-ties, including those favored by the current distribution of these resources. Knowing that the transfers represent currently more than 50% of the municipal resources, one can easily imagine the extent of the negative effects that such instability produces on the fi-nancial management and budget projection of the municipalities as well as on their ca-pacity to ensure a sustainable and effective provision of services.
• The unpredictability and the instability of the transferred amounts, combined with the ab-sence of criteria of distribution make difficult the construction and the reinforcement of the municipal capacities (whether capacities in human resources, capacities in man-agement or even capacity for supplying services) and do not motivate the mobilization of local resources.
• Instead of favoring a logic and an economy of institutional and local development, the current system tends rather to support a logic and an economy of “rent” based on clien-telism: the municipalities tend to regard the transfers as "favors" distributed by the gov-ernment and, to some extent, redistribute them in their turn to their local populations in the form of various services and "favors" (employment, supply of municipal services without return, "exemption" of taxes and non-application of regulations, etc.) Thus, as we will further see, the municipalities that are the most privileged by the State transfer are far from being the most effective in terms of mobilizing local resources and supplying services.
This not very transparent mode of distribution of governmental resources favors, in its turn, a nontransparent management at the local level and does little to encourage the installation of a rigorous system of management and, even less, administrative, economic and political mechanisms of accountability.
COTECNO ABT ALCHEMIA CDG MGA
GENERAL - ANNEX B - ANALYSIS OF THE MUNICIPAL SECTOR 23-04-05 PAGE 35 OF 73
=�� .������� �������� �&� � ���' �� �22�� ����� �
������������ ��
=���� ���"�!��) #� .�.)$'�(�)���(�#'��
One of the essential criteria for evaluating the financial health of the municipalities and of their capacity to assume their duties is their level of vertical fiscal balance or imbalance, i.e. the level of correspondence or adequacy between their own resources and the expenditure which they had engaged to fulfill their duties. Thus, a municipality reaches an ideal vertical fiscal balance when it has a level of own resources sufficient to cover the expenditure, which is necessary for it. Such a balance is, obviously, seldom reached and the quasi-totality of the municipalities resorts, although to differing degrees, to governmental transfer to be able to cover their expenditure adequately. However a municipality is in imbalance when there is a big difference between its self-resources and the expenditure necessary to assume its re-sponsibilities.
However, it is difficult to estimate the adequate volume of expenditure and to integrate the level of efficiency of financial management in the quantitative evaluation i.e. a municipality could have an adequate level of own resources but still finds itself in imbalance and incom-petent to fulfill its duties because of ineffective management. This is why vertical imbalance is, in practice, evaluated through the relationship between self-resources, not taking into ac-count governmental transfers and loans, and real expenditure. Thus imbalance is measured by a coefficient, which quantifies the share of the municipal expenditure that is covered by the resources collected and controlled by the municipalities:
Vertical Fiscal Imbalance Coefficient = 1 – (total municipal resources not under municipal control/ total municipal expenditures)
This coefficient varies between zero and 1: An ideal balance is reached when the coefficient is equal to 1 and imbalance increases when the coefficient approaches zero i.e. situation of maximum imbalance.
Based on financial data of the center-of-governorate municipalities and data on the whole Jordanian municipal sector but excluding GMA since 1995, and not taking into account the year 2001 because of the difficulties it raises due to merging that year, we have analyzed the evolution of fiscal imbalance for each center-of-governorate municipality, for the ten munici-palities taken together, and for all of the Jordanian municipal sector. The results are pre-sented in the following table and graph:
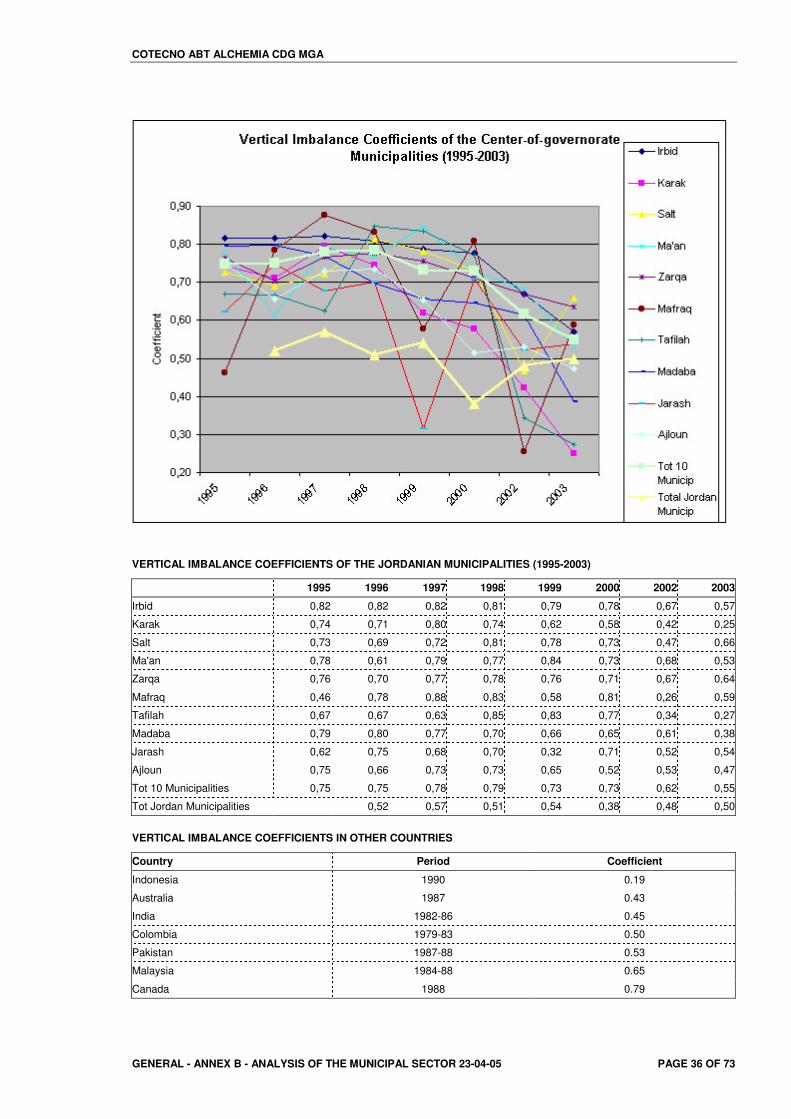
COTECNO ABT ALCHEMIA CDG MGA
GENERAL - ANNEX B - ANALYSIS OF THE MUNICIPAL SECTOR 23-04-05 PAGE 36 OF 73
VERTICAL IMBALANCE COEFFICIENTS OF THE JORDANIAN MUNICIPALITIES (1995-2003)
1995 1996 1997 1998 1999 2000 2002 2003
Irbid 0,82 0,82 0,82 0,81 0,79 0,78 0,67 0,57
Karak 0,74 0,71 0,80 0,74 0,62 0,58 0,42 0,25
Salt 0,73 0,69 0,72 0,81 0,78 0,73 0,47 0,66
Ma'an 0,78 0,61 0,79 0,77 0,84 0,73 0,68 0,53
Zarqa 0,76 0,70 0,77 0,78 0,76 0,71 0,67 0,64
Mafraq 0,46 0,78 0,88 0,83 0,58 0,81 0,26 0,59
Tafilah 0,67 0,67 0,63 0,85 0,83 0,77 0,34 0,27
Madaba 0,79 0,80 0,77 0,70 0,66 0,65 0,61 0,38
Jarash 0,62 0,75 0,68 0,70 0,32 0,71 0,52 0,54
Ajloun 0,75 0,66 0,73 0,73 0,65 0,52 0,53 0,47
Tot 10 Municipalities 0,75 0,75 0,78 0,79 0,73 0,73 0,62 0,55
Tot Jordan Municipalities 0,52 0,57 0,51 0,54 0,38 0,48 0,50
VERTICAL IMBALANCE COEFFICIENTS IN OTHER COUNTRIES
Country Period Coefficient
Indonesia 1990 0.19
Australia 1987 0.43
India 1982-86 0.45
Colombia 1979-83 0.50
Pakistan 1987-88 0.53
Malaysia 1984-88 0.65
Canada 1988 0.79
COTECNO ABT ALCHEMIA CDG MGA
GENERAL - ANNEX B - ANALYSIS OF THE MUNICIPAL SECTOR 23-04-05 PAGE 37 OF 73
United States 1988 0.88
Brazil 1988 0.89
Sources: S. Yilmaz & S. Bindebir4 d’après Shah (1994).
The above graphs and tables show several significant facts:
• The entire Jordanian municipal sector recorded an increase in its fiscal imbalance. The coefficient of imbalance decreased from 0.57 in 1997 to 0.38 in 2000. It then improved and reached 0.50 in 2003, however the general tendency over the whole period under consideration was an augmentation in fiscal imbalance.
• With regard to the center-of-governorate municipalities, the increase in fiscal imbalance started being strongly affirmed since 1998 and affected, although in an unequal way, all the municipalities. This imbalance strongly worsened in 2002 and 2003 after the merging of municipalities.
• Taken as a whole, the ten center-of-governorate municipalities had a coefficient of imbalance, which decrease from 0.79 in 1998 to 0.73 in 2000 to reach 0.55 in 2003.
• But the situation of the majority of the cities is even more unbalanced than shows this average in which the financial weight of large cities like Irbid and Zarqa strongly affects the average, and whose imbalance grows less quickly than the others. The fiscal imbalance of Karak, Tafilah, and Ajloun is even much bigger than that of the national average, even though this average covers all municipalities, including those of the small localities, which are generally characterized by a very strong fiscal im-balance.
• The majority of the center-of-governorate municipalities emerge as being increas-ingly dependent on governmental transfer and having an increasingly lesser margin of autonomy concerning their financial resources. The two municipalities of Karak and Tafilah are in this respect the most significant examples. The fall of their coeffi-cient of imbalance is spectacular: it decreased from 0.74 for Karak and 0.85 for Ta-filah in 1998 to 0.27 and 0.25, respectively, in 2003!
• The difference between the municipalities is strongly pronounced: their coefficient of imbalance ranged between 0.61 and 0.82 in 1996 and between 0.25 and 0.66 in 2003.
• The accentuation of imbalance is accompanied by a very strong inter annual varia-tion (see in particular the case of Jarash, Mafraq, Tafilah and Ma'an). These varia-tions mirror the variations of the governmental transfers, which we underlined previ-ously. This highlights, once again and in addition to a very big financial instability, the fact that self-revenues of the municipalities play a relatively minor part in a financial system based primarily on a system of random transfer.
However, how could one understand this strong aggravation of the fiscal imbalance of the municipalities after merging, particularly in 2002 and 2003, when the aim was precisely to re-inforce the capacities of the municipalities and to improve their financial standing following the crisis of the municipal sector at the end of the Nineties?
By confining the analysis to the above data on fiscal imbalance, it is difficult to simply con-clude that the situation of the municipalities was really worsened in 2002 and 2003. Indeed, the comparison between the financial data of the Nineties and those of 2003 requires that we take into account the process of merging, which increased the municipal territory and added other territories and localities to the municipality.
Would the aggravation of fiscal imbalance be then the effect of this merging with localities whose financial systems could have been in crisis? How would such a negative "heritage" have contributed to the increase in fiscal imbalance? Is this heritage alone to blame or is it rather the presence of two trends of imbalance increase, which were added to each other?
4 Serdar Yilmaz and Serap Bindebir, Intergovernmental Transfers: Concepts and Policy Issues, World Bank Institute, October, 2003
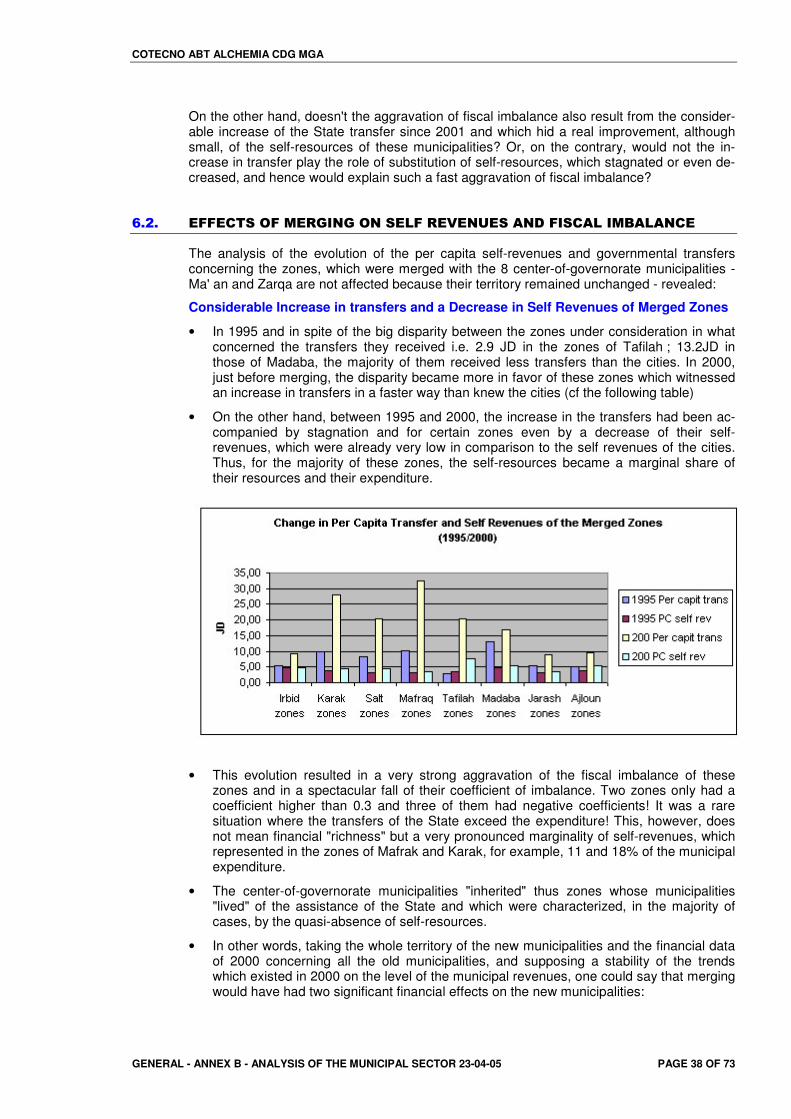
COTECNO ABT ALCHEMIA CDG MGA
GENERAL - ANNEX B - ANALYSIS OF THE MUNICIPAL SECTOR 23-04-05 PAGE 38 OF 73
On the other hand, doesn't the aggravation of fiscal imbalance also result from the consider-able increase of the State transfer since 2001 and which hid a real improvement, although small, of the self-resources of these municipalities? Or, on the contrary, would not the in-crease in transfer play the role of substitution of self-resources, which stagnated or even de-creased, and hence would explain such a fast aggravation of fiscal imbalance?
=�1�� �..�'�$� .���"�)#�� #�$�(.�"�!�#0�$��#&�.)$'�(�)���(�#'��
The analysis of the evolution of the per capita self-revenues and governmental transfers concerning the zones, which were merged with the 8 center-of-governorate municipalities - Ma' an and Zarqa are not affected because their territory remained unchanged - revealed:
Considerable Increase in transfers and a Decrease in Self Revenues of Merged Zones
• In 1995 and in spite of the big disparity between the zones under consideration in what concerned the transfers they received i.e. 2.9 JD in the zones of Tafilah ; 13.2JD in those of Madaba, the majority of them received less transfers than the cities. In 2000, just before merging, the disparity became more in favor of these zones which witnessed an increase in transfers in a faster way than knew the cities (cf the following table)
• On the other hand, between 1995 and 2000, the increase in the transfers had been ac-companied by stagnation and for certain zones even by a decrease of their self-revenues, which were already very low in comparison to the self revenues of the cities. Thus, for the majority of these zones, the self-resources became a marginal share of their resources and their expenditure.
• This evolution resulted in a very strong aggravation of the fiscal imbalance of these zones and in a spectacular fall of their coefficient of imbalance. Two zones only had a coefficient higher than 0.3 and three of them had negative coefficients! It was a rare situation where the transfers of the State exceed the expenditure! This, however, does not mean financial "richness" but a very pronounced marginality of self-revenues, which represented in the zones of Mafrak and Karak, for example, 11 and 18% of the municipal expenditure.
• The center-of-governorate municipalities "inherited" thus zones whose municipalities "lived" of the assistance of the State and which were characterized, in the majority of cases, by the quasi-absence of self-resources.
• In other words, taking the whole territory of the new municipalities and the financial data of 2000 concerning all the old municipalities, and supposing a stability of the trends which existed in 2000 on the level of the municipal revenues, one could say that merging would have had two significant financial effects on the new municipalities:
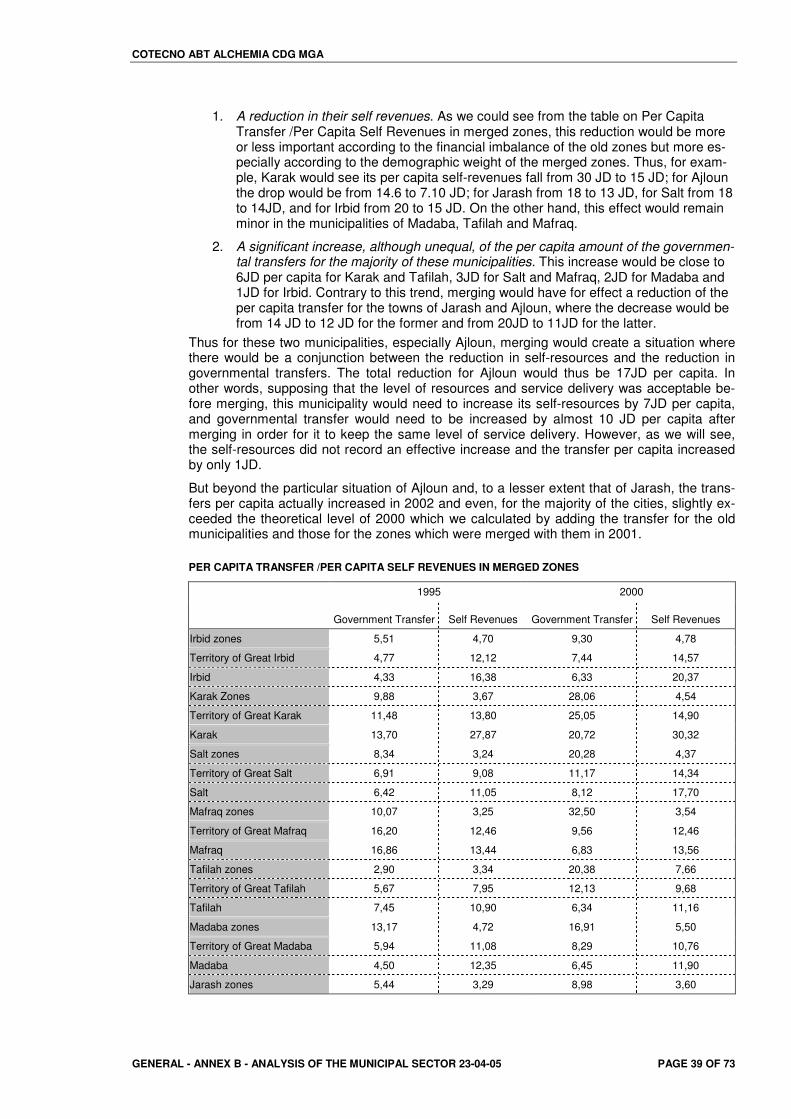
COTECNO ABT ALCHEMIA CDG MGA
GENERAL - ANNEX B - ANALYSIS OF THE MUNICIPAL SECTOR 23-04-05 PAGE 39 OF 73
1. A reduction in their self revenues. As we could see from the table on Per Capita Transfer /Per Capita Self Revenues in merged zones, this reduction would be more or less important according to the financial imbalance of the old zones but more es-pecially according to the demographic weight of the merged zones. Thus, for exam-ple, Karak would see its per capita self-revenues fall from 30 JD to 15 JD; for Ajloun the drop would be from 14.6 to 7.10 JD; for Jarash from 18 to 13 JD, for Salt from 18 to 14JD, and for Irbid from 20 to 15 JD. On the other hand, this effect would remain minor in the municipalities of Madaba, Tafilah and Mafraq.
2. A significant increase, although unequal, of the per capita amount of the governmen-tal transfers for the majority of these municipalities. This increase would be close to 6JD per capita for Karak and Tafilah, 3JD for Salt and Mafraq, 2JD for Madaba and 1JD for Irbid. Contrary to this trend, merging would have for effect a reduction of the per capita transfer for the towns of Jarash and Ajloun, where the decrease would be from 14 JD to 12 JD for the former and from 20JD to 11JD for the latter.
Thus for these two municipalities, especially Ajloun, merging would create a situation where there would be a conjunction between the reduction in self-resources and the reduction in governmental transfers. The total reduction for Ajloun would thus be 17JD per capita. In other words, supposing that the level of resources and service delivery was acceptable be-fore merging, this municipality would need to increase its self-resources by 7JD per capita, and governmental transfer would need to be increased by almost 10 JD per capita after merging in order for it to keep the same level of service delivery. However, as we will see, the self-resources did not record an effective increase and the transfer per capita increased by only 1JD.
But beyond the particular situation of Ajloun and, to a lesser extent that of Jarash, the trans-fers per capita actually increased in 2002 and even, for the majority of the cities, slightly ex-ceeded the theoretical level of 2000 which we calculated by adding the transfer for the old municipalities and those for the zones which were merged with them in 2001.
PER CAPITA TRANSFER /PER CAPITA SELF REVENUES IN MERGED ZONES
1995 2000
Government Transfer Self Revenues Government Transfer Self Revenues
Irbid zones 5,51 4,70 9,30 4,78
Territory of Great Irbid 4,77 12,12 7,44 14,57
Irbid 4,33 16,38 6,33 20,37
Karak Zones 9,88 3,67 28,06 4,54
Territory of Great Karak 11,48 13,80 25,05 14,90
Karak 13,70 27,87 20,72 30,32
Salt zones 8,34 3,24 20,28 4,37
Territory of Great Salt 6,91 9,08 11,17 14,34
Salt 6,42 11,05 8,12 17,70
Mafraq zones 10,07 3,25 32,50 3,54
Territory of Great Mafraq 16,20 12,46 9,56 12,46
Mafraq 16,86 13,44 6,83 13,56
Tafilah zones 2,90 3,34 20,38 7,66
Territory of Great Tafilah 5,67 7,95 12,13 9,68
Tafilah 7,45 10,90 6,34 11,16
Madaba zones 13,17 4,72 16,91 5,50
Territory of Great Madaba 5,94 11,08 8,29 10,76
Madaba 4,50 12,35 6,45 11,90
Jarash zones 5,44 3,29 8,98 3,60
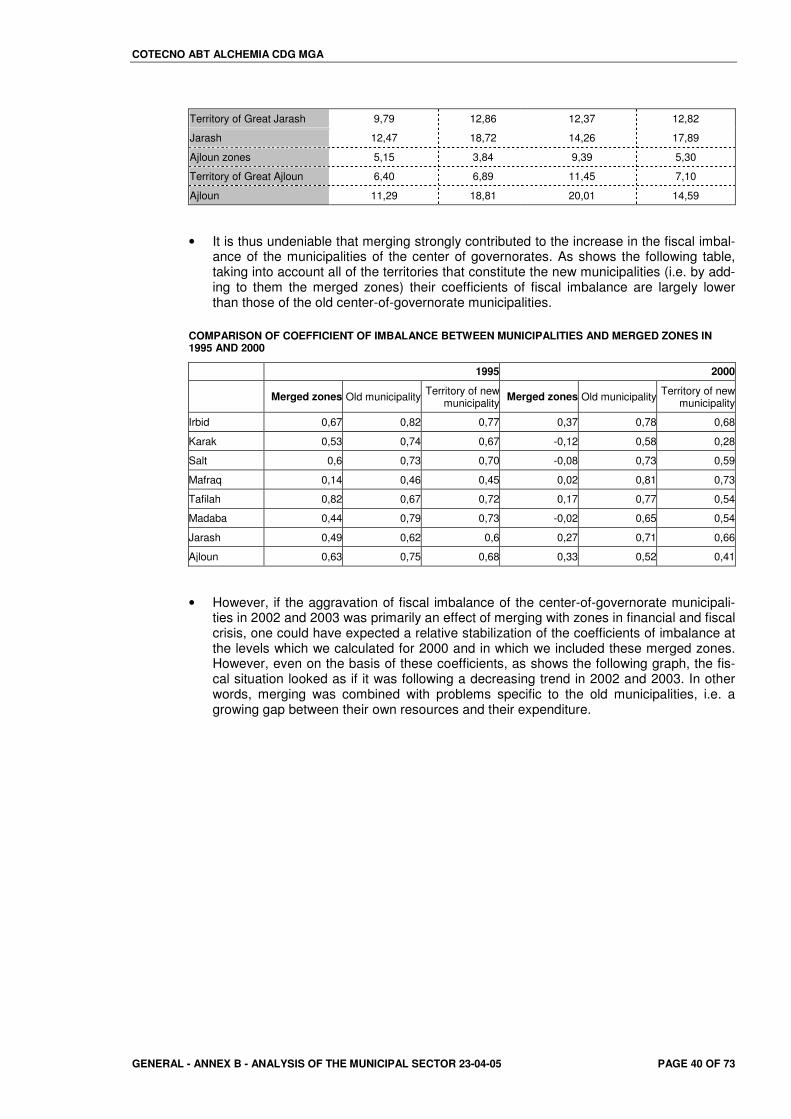
COTECNO ABT ALCHEMIA CDG MGA
GENERAL - ANNEX B - ANALYSIS OF THE MUNICIPAL SECTOR 23-04-05 PAGE 40 OF 73
Territory of Great Jarash 9,79 12,86 12,37 12,82
Jarash 12,47 18,72 14,26 17,89
Ajloun zones 5,15 3,84 9,39 5,30
Territory of Great Ajloun 6,40 6,89 11,45 7,10
Ajloun 11,29 18,81 20,01 14,59
• It is thus undeniable that merging strongly contributed to the increase in the fiscal imbal-ance of the municipalities of the center of governorates. As shows the following table, taking into account all of the territories that constitute the new municipalities (i.e. by add-ing to them the merged zones) their coefficients of fiscal imbalance are largely lower than those of the old center-of-governorate municipalities.
COMPARISON OF COEFFICIENT OF IMBALANCE BETWEEN MUNICIPALITIES AND MERGED ZONES IN 1995 AND 2000
1995 2000
Merged zones Old municipality Territory of new municipality Merged zones Old municipality Territory of new
municipality
Irbid 0,67 0,82 0,77 0,37 0,78 0,68
Karak 0,53 0,74 0,67 -0,12 0,58 0,28
Salt 0,6 0,73 0,70 -0,08 0,73 0,59
Mafraq 0,14 0,46 0,45 0,02 0,81 0,73
Tafilah 0,82 0,67 0,72 0,17 0,77 0,54
Madaba 0,44 0,79 0,73 -0,02 0,65 0,54
Jarash 0,49 0,62 0,6 0,27 0,71 0,66
Ajloun 0,63 0,75 0,68 0,33 0,52 0,41
• However, if the aggravation of fiscal imbalance of the center-of-governorate municipali-ties in 2002 and 2003 was primarily an effect of merging with zones in financial and fiscal crisis, one could have expected a relative stabilization of the coefficients of imbalance at the levels which we calculated for 2000 and in which we included these merged zones. However, even on the basis of these coefficients, as shows the following graph, the fis-cal situation looked as if it was following a decreasing trend in 2002 and 2003. In other words, merging was combined with problems specific to the old municipalities, i.e. a growing gap between their own resources and their expenditure.
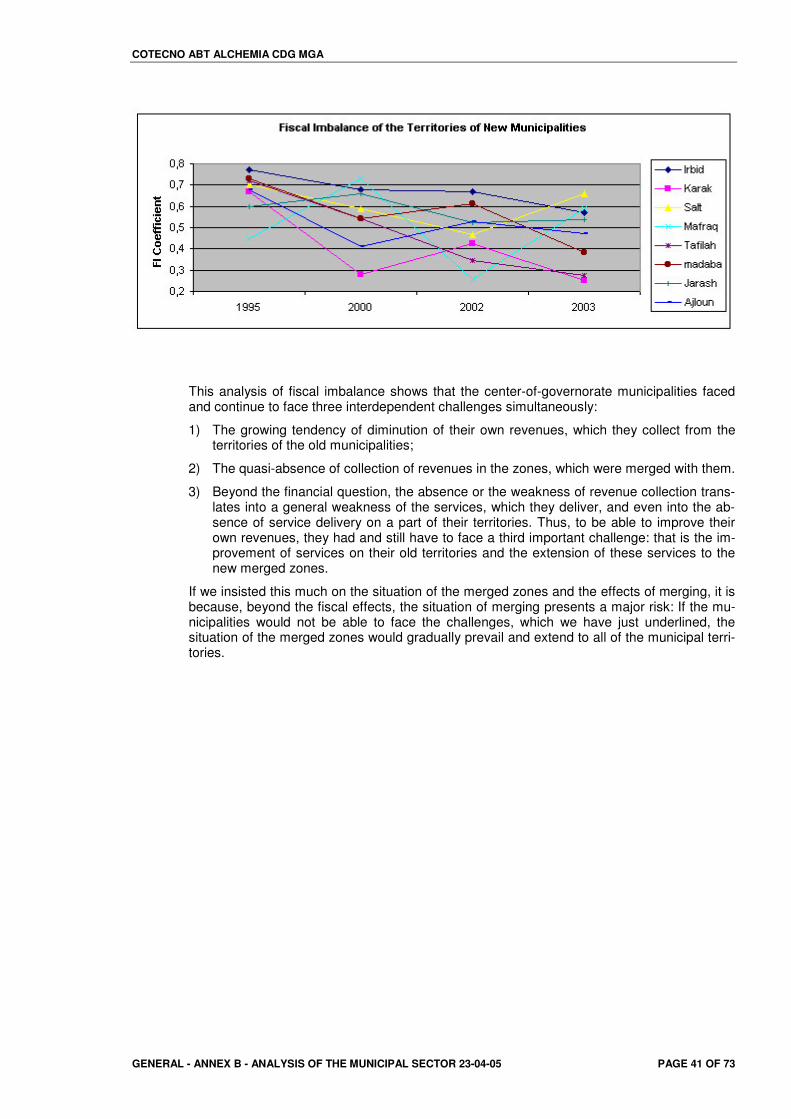
COTECNO ABT ALCHEMIA CDG MGA
GENERAL - ANNEX B - ANALYSIS OF THE MUNICIPAL SECTOR 23-04-05 PAGE 41 OF 73
This analysis of fiscal imbalance shows that the center-of-governorate municipalities faced and continue to face three interdependent challenges simultaneously:
1) The growing tendency of diminution of their own revenues, which they collect from the territories of the old municipalities;
2) The quasi-absence of collection of revenues in the zones, which were merged with them.
3) Beyond the financial question, the absence or the weakness of revenue collection trans-lates into a general weakness of the services, which they deliver, and even into the ab-sence of service delivery on a part of their territories. Thus, to be able to improve their own revenues, they had and still have to face a third important challenge: that is the im-provement of services on their old territories and the extension of these services to the new merged zones.
If we insisted this much on the situation of the merged zones and the effects of merging, it is because, beyond the fiscal effects, the situation of merging presents a major risk: If the mu-nicipalities would not be able to face the challenges, which we have just underlined, the situation of the merged zones would gradually prevail and extend to all of the municipal terri-tories.
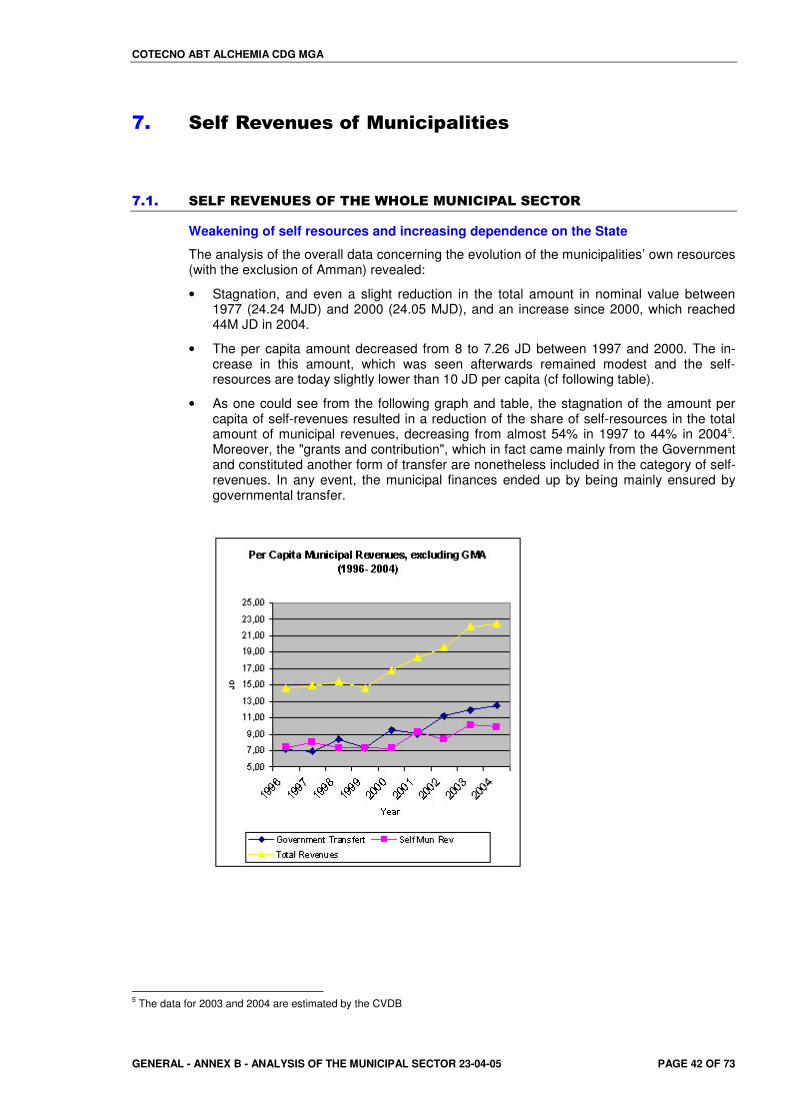
COTECNO ABT ALCHEMIA CDG MGA
GENERAL - ANNEX B - ANALYSIS OF THE MUNICIPAL SECTOR 23-04-05 PAGE 42 OF 73
>�� $ ��" � �� ��������������� ��
>���� $�(.�"�!�#0�$� .�����+ � (���0#)'),�(�$�'� "�
Weakening of self resources and increasing dependence on the State
The analysis of the overall data concerning the evolution of the municipalities’ own resources (with the exclusion of Amman) revealed:
• Stagnation, and even a slight reduction in the total amount in nominal value between 1977 (24.24 MJD) and 2000 (24.05 MJD), and an increase since 2000, which reached 44M JD in 2004.
• The per capita amount decreased from 8 to 7.26 JD between 1997 and 2000. The in-crease in this amount, which was seen afterwards remained modest and the self-resources are today slightly lower than 10 JD per capita (cf following table).
• As one could see from the following graph and table, the stagnation of the amount per capita of self-revenues resulted in a reduction of the share of self-resources in the total amount of municipal revenues, decreasing from almost 54% in 1997 to 44% in 20045. Moreover, the "grants and contribution", which in fact came mainly from the Government and constituted another form of transfer are nonetheless included in the category of self-revenues. In any event, the municipal finances ended up by being mainly ensured by governmental transfer.
5 The data for 2003 and 2004 are estimated by the CVDB
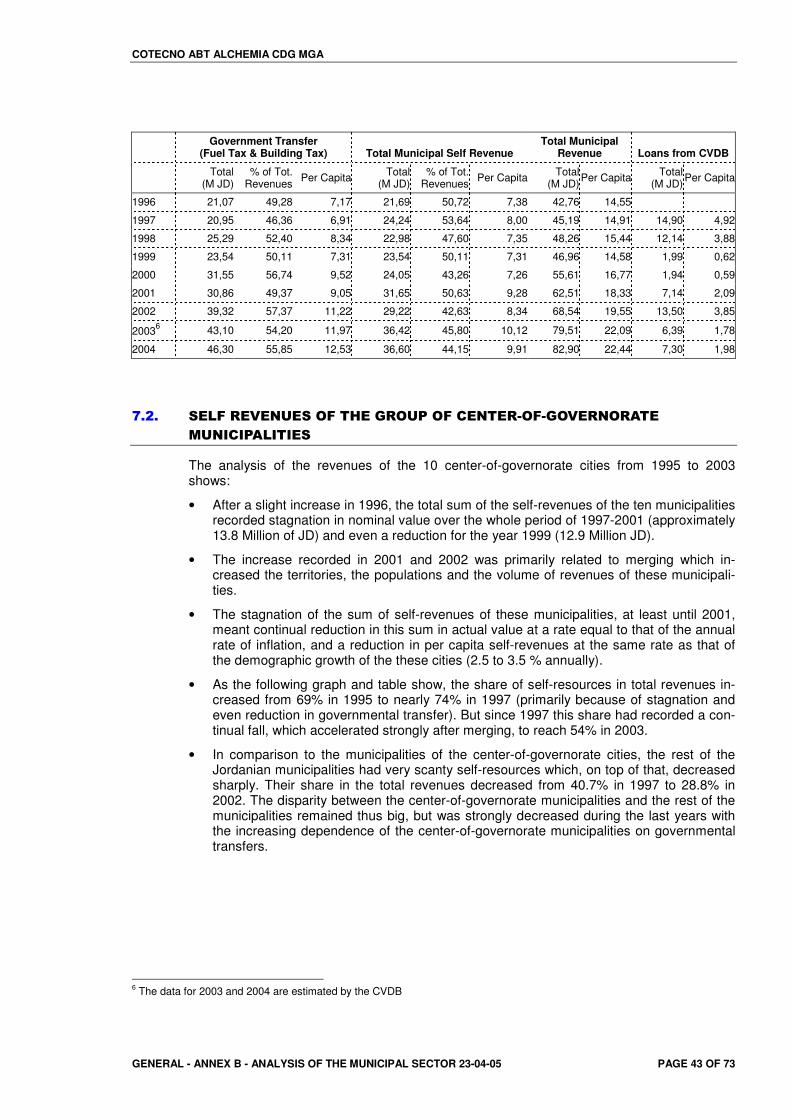
COTECNO ABT ALCHEMIA CDG MGA
GENERAL - ANNEX B - ANALYSIS OF THE MUNICIPAL SECTOR 23-04-05 PAGE 43 OF 73
Government Transfer
(Fuel Tax & Building Tax) Total Municipal Self Revenue Total Municipal
Revenue Loans from CVDB
Total
(M JD)% of Tot.
Revenues Per Capita Total(M JD)
% of Tot. Revenues Per Capita Total
(M JD)Per Capita Total (M JD) Per Capita
1996 21,07 49,28 7,17 21,69 50,72 7,38 42,76 14,55
1997 20,95 46,36 6,91 24,24 53,64 8,00 45,19 14,91 14,90 4,92
1998 25,29 52,40 8,34 22,98 47,60 7,35 48,26 15,44 12,14 3,88
1999 23,54 50,11 7,31 23,54 50,11 7,31 46,96 14,58 1,99 0,62
2000 31,55 56,74 9,52 24,05 43,26 7,26 55,61 16,77 1,94 0,59
2001 30,86 49,37 9,05 31,65 50,63 9,28 62,51 18,33 7,14 2,09
2002 39,32 57,37 11,22 29,22 42,63 8,34 68,54 19,55 13,50 3,85
20036 43,10 54,20 11,97 36,42 45,80 10,12 79,51 22,09 6,39 1,78
2004 46,30 55,85 12,53 36,60 44,15 9,91 82,90 22,44 7,30 1,98
>�1�� $�(.�"�!�#0�$� .������" 0,� .�'�#��"2 .2� !�"# "����
�0#)'),�()�)�$�
The analysis of the revenues of the 10 center-of-governorate cities from 1995 to 2003 shows:
• After a slight increase in 1996, the total sum of the self-revenues of the ten municipalities recorded stagnation in nominal value over the whole period of 1997-2001 (approximately 13.8 Million of JD) and even a reduction for the year 1999 (12.9 Million JD).
• The increase recorded in 2001 and 2002 was primarily related to merging which in-creased the territories, the populations and the volume of revenues of these municipali-ties.
• The stagnation of the sum of self-revenues of these municipalities, at least until 2001, meant continual reduction in this sum in actual value at a rate equal to that of the annual rate of inflation, and a reduction in per capita self-revenues at the same rate as that of the demographic growth of the these cities (2.5 to 3.5 % annually).
• As the following graph and table show, the share of self-resources in total revenues in-creased from 69% in 1995 to nearly 74% in 1997 (primarily because of stagnation and even reduction in governmental transfer). But since 1997 this share had recorded a con-tinual fall, which accelerated strongly after merging, to reach 54% in 2003.
• In comparison to the municipalities of the center-of-governorate cities, the rest of the Jordanian municipalities had very scanty self-resources which, on top of that, decreased sharply. Their share in the total revenues decreased from 40.7% in 1997 to 28.8% in 2002. The disparity between the center-of-governorate municipalities and the rest of the municipalities remained thus big, but was strongly decreased during the last years with the increasing dependence of the center-of-governorate municipalities on governmental transfers.
6 The data for 2003 and 2004 are estimated by the CVDB
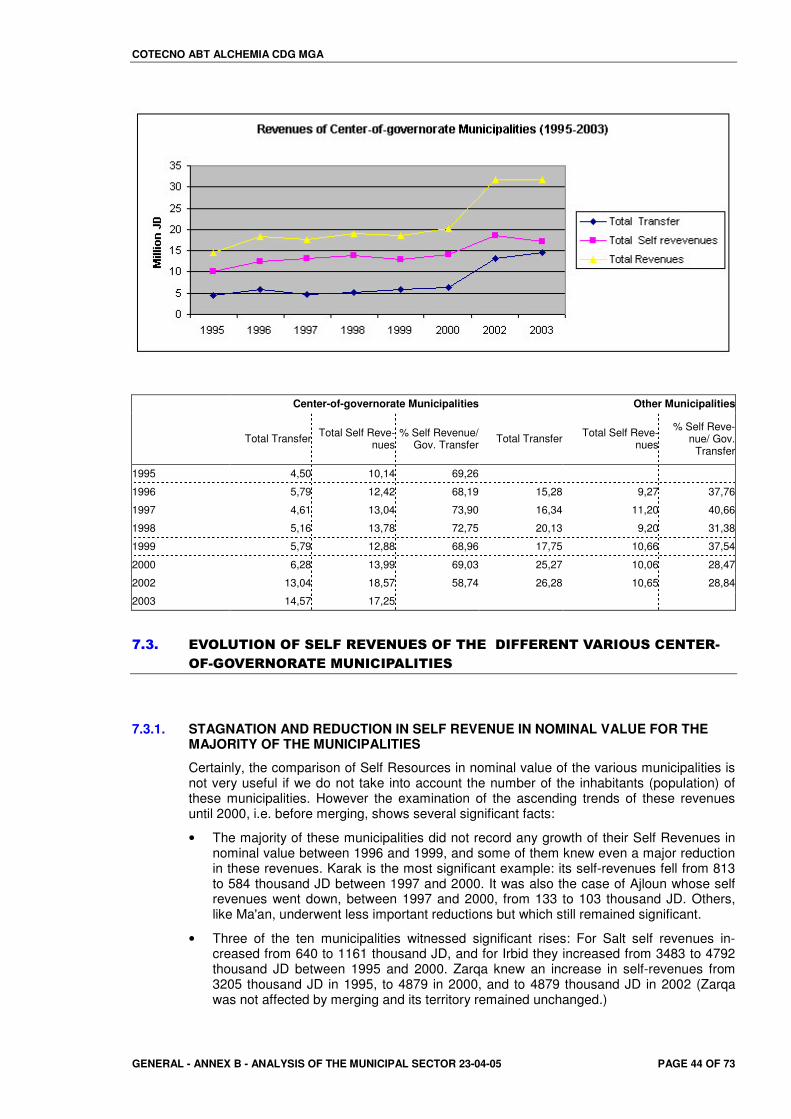
COTECNO ABT ALCHEMIA CDG MGA
GENERAL - ANNEX B - ANALYSIS OF THE MUNICIPAL SECTOR 23-04-05 PAGE 44 OF 73
Center-of-governorate Municipalities Other Municipalities
Total Transfer Total Self Reve-nues
% Self Revenue/ Gov. Transfer Total Transfer Total Self Reve-
nues
% Self Reve-nue/ Gov.
Transfer
1995 4,50 10,14 69,26
1996 5,79 12,42 68,19 15,28 9,27 37,76
1997 4,61 13,04 73,90 16,34 11,20 40,66
1998 5,16 13,78 72,75 20,13 9,20 31,38
1999 5,79 12,88 68,96 17,75 10,66 37,54
2000 6,28 13,99 69,03 25,27 10,06 28,47
2002 13,04 18,57 58,74 26,28 10,65 28,84
2003 14,57 17,25
>�4�� �! (0�) #� .�$�(.�"�!�#0�$� .������&)..�"�#��!�") 0$�'�#��"2
.2� !�"# "�����0#)'),�()�)�$�
7.3.1. STAGNATION AND REDUCTION IN SELF REVENUE IN NOMINAL VALUE FOR THE MAJORITY OF THE MUNICIPALITIES
Certainly, the comparison of Self Resources in nominal value of the various municipalities is not very useful if we do not take into account the number of the inhabitants (population) of these municipalities. However the examination of the ascending trends of these revenues until 2000, i.e. before merging, shows several significant facts:
• The majority of these municipalities did not record any growth of their Self Revenues in nominal value between 1996 and 1999, and some of them knew even a major reduction in these revenues. Karak is the most significant example: its self-revenues fell from 813 to 584 thousand JD between 1997 and 2000. It was also the case of Ajloun whose self revenues went down, between 1997 and 2000, from 133 to 103 thousand JD. Others, like Ma'an, underwent less important reductions but which still remained significant.
• Three of the ten municipalities witnessed significant rises: For Salt self revenues in-creased from 640 to 1161 thousand JD, and for Irbid they increased from 3483 to 4792 thousand JD between 1995 and 2000. Zarqa knew an increase in self-revenues from 3205 thousand JD in 1995, to 4879 in 2000, and to 4879 thousand JD in 2002 (Zarqa was not affected by merging and its territory remained unchanged.)
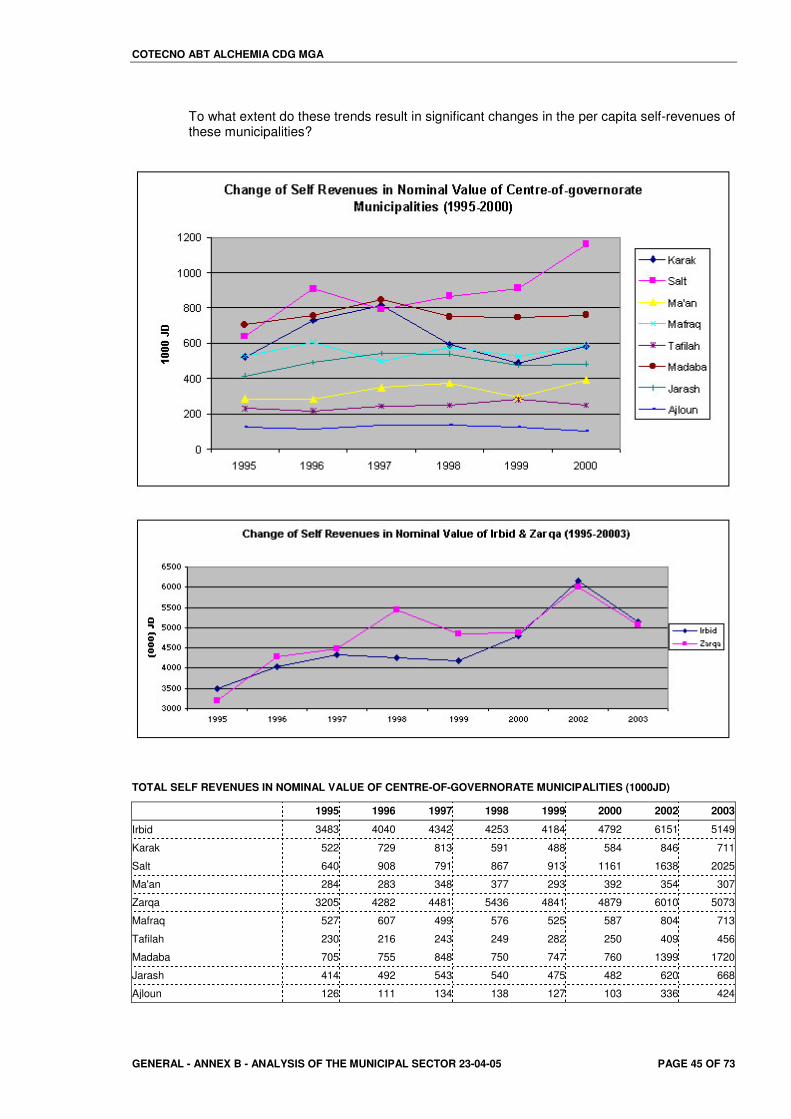
COTECNO ABT ALCHEMIA CDG MGA
GENERAL - ANNEX B - ANALYSIS OF THE MUNICIPAL SECTOR 23-04-05 PAGE 45 OF 73
To what extent do these trends result in significant changes in the per capita self-revenues of these municipalities?
TOTAL SELF REVENUES IN NOMINAL VALUE OF CENTRE-OF-GOVERNORATE MUNICIPALITIES (1000JD)
1995 1996 1997 1998 1999 2000 2002 2003
Irbid 3483 4040 4342 4253 4184 4792 6151 5149
Karak 522 729 813 591 488 584 846 711
Salt 640 908 791 867 913 1161 1638 2025
Ma'an 284 283 348 377 293 392 354 307
Zarqa 3205 4282 4481 5436 4841 4879 6010 5073
Mafraq 527 607 499 576 525 587 804 713
Tafilah 230 216 243 249 282 250 409 456
Madaba 705 755 848 750 747 760 1399 1720
Jarash 414 492 543 540 475 482 620 668
Ajloun 126 111 134 138 127 103 336 424
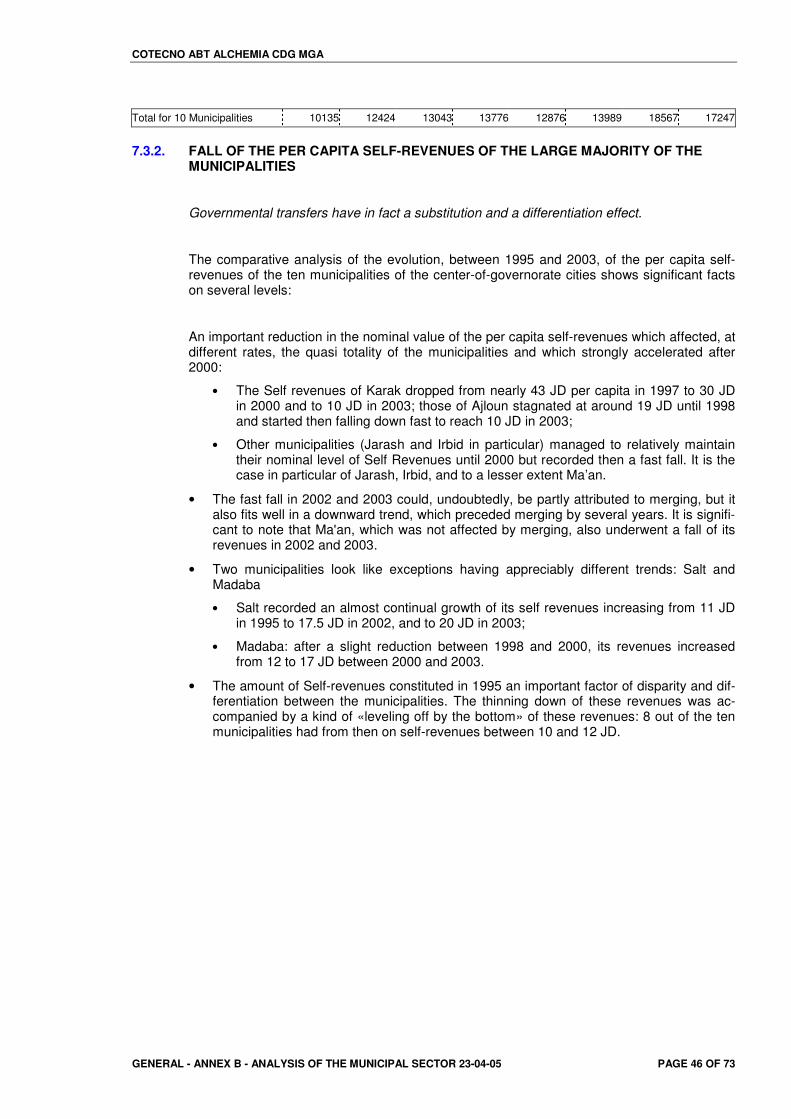
COTECNO ABT ALCHEMIA CDG MGA
GENERAL - ANNEX B - ANALYSIS OF THE MUNICIPAL SECTOR 23-04-05 PAGE 46 OF 73
Total for 10 Municipalities 10135 12424 13043 13776 12876 13989 18567 17247
7.3.2. FALL OF THE PER CAPITA SELF-REVENUES OF THE LARGE MAJORITY OF THE MUNICIPALITIES
Governmental transfers have in fact a substitution and a differentiation effect.
The comparative analysis of the evolution, between 1995 and 2003, of the per capita self-revenues of the ten municipalities of the center-of-governorate cities shows significant facts on several levels:
An important reduction in the nominal value of the per capita self-revenues which affected, at different rates, the quasi totality of the municipalities and which strongly accelerated after 2000:
• The Self revenues of Karak dropped from nearly 43 JD per capita in 1997 to 30 JD in 2000 and to 10 JD in 2003; those of Ajloun stagnated at around 19 JD until 1998 and started then falling down fast to reach 10 JD in 2003;
• Other municipalities (Jarash and Irbid in particular) managed to relatively maintain their nominal level of Self Revenues until 2000 but recorded then a fast fall. It is the case in particular of Jarash, Irbid, and to a lesser extent Ma’an.
• The fast fall in 2002 and 2003 could, undoubtedly, be partly attributed to merging, but it also fits well in a downward trend, which preceded merging by several years. It is signifi-cant to note that Ma'an, which was not affected by merging, also underwent a fall of its revenues in 2002 and 2003.
• Two municipalities look like exceptions having appreciably different trends: Salt and Madaba
• Salt recorded an almost continual growth of its self revenues increasing from 11 JD in 1995 to 17.5 JD in 2002, and to 20 JD in 2003;
• Madaba: after a slight reduction between 1998 and 2000, its revenues increased from 12 to 17 JD between 2000 and 2003.
• The amount of Self-revenues constituted in 1995 an important factor of disparity and dif-ferentiation between the municipalities. The thinning down of these revenues was ac-companied by a kind of «leveling off by the bottom» of these revenues: 8 out of the ten municipalities had from then on self-revenues between 10 and 12 JD.

COTECNO ABT ALCHEMIA CDG MGA
GENERAL - ANNEX B - ANALYSIS OF THE MUNICIPAL SECTOR 23-04-05 PAGE 47 OF 73
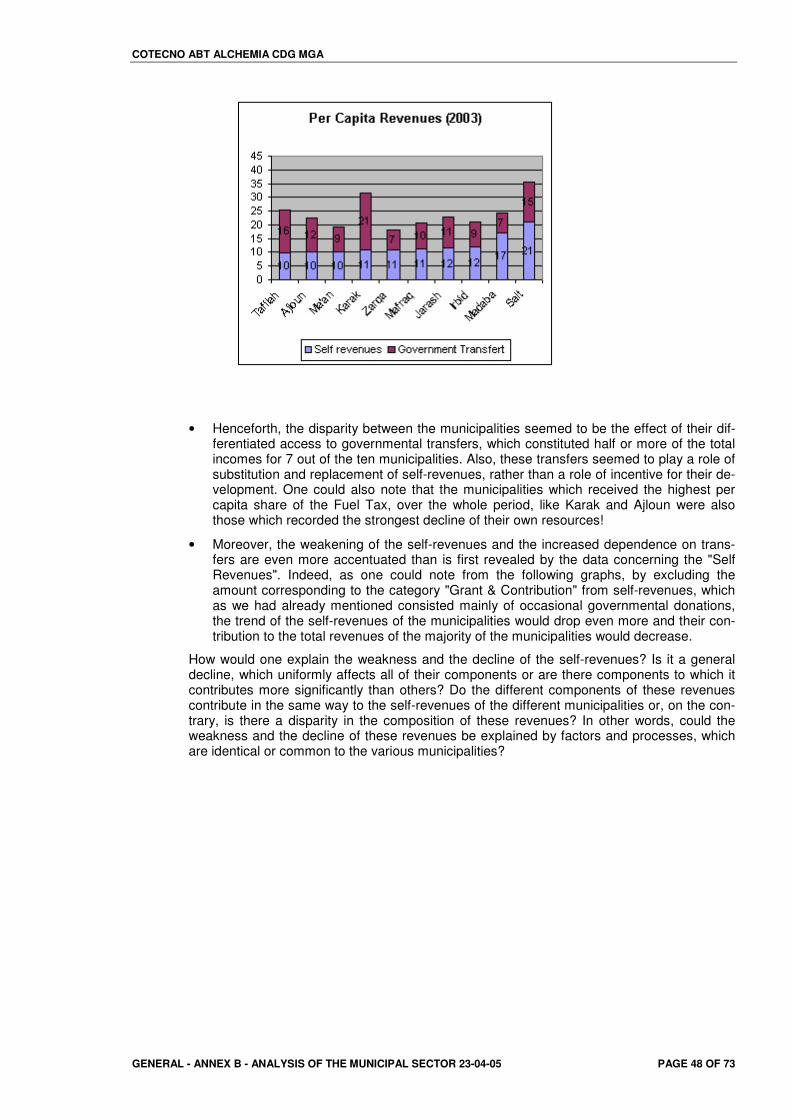
COTECNO ABT ALCHEMIA CDG MGA
GENERAL - ANNEX B - ANALYSIS OF THE MUNICIPAL SECTOR 23-04-05 PAGE 48 OF 73
• Henceforth, the disparity between the municipalities seemed to be the effect of their dif-ferentiated access to governmental transfers, which constituted half or more of the total incomes for 7 out of the ten municipalities. Also, these transfers seemed to play a role of substitution and replacement of self-revenues, rather than a role of incentive for their de-velopment. One could also note that the municipalities which received the highest per capita share of the Fuel Tax, over the whole period, like Karak and Ajloun were also those which recorded the strongest decline of their own resources!
• Moreover, the weakening of the self-revenues and the increased dependence on trans-fers are even more accentuated than is first revealed by the data concerning the "Self Revenues". Indeed, as one could note from the following graphs, by excluding the amount corresponding to the category "Grant & Contribution" from self-revenues, which as we had already mentioned consisted mainly of occasional governmental donations, the trend of the self-revenues of the municipalities would drop even more and their con-tribution to the total revenues of the majority of the municipalities would decrease.
How would one explain the weakness and the decline of the self-revenues? Is it a general decline, which uniformly affects all of their components or are there components to which it contributes more significantly than others? Do the different components of these revenues contribute in the same way to the self-revenues of the different municipalities or, on the con-trary, is there a disparity in the composition of these revenues? In other words, could the weakness and the decline of these revenues be explained by factors and processes, which are identical or common to the various municipalities?
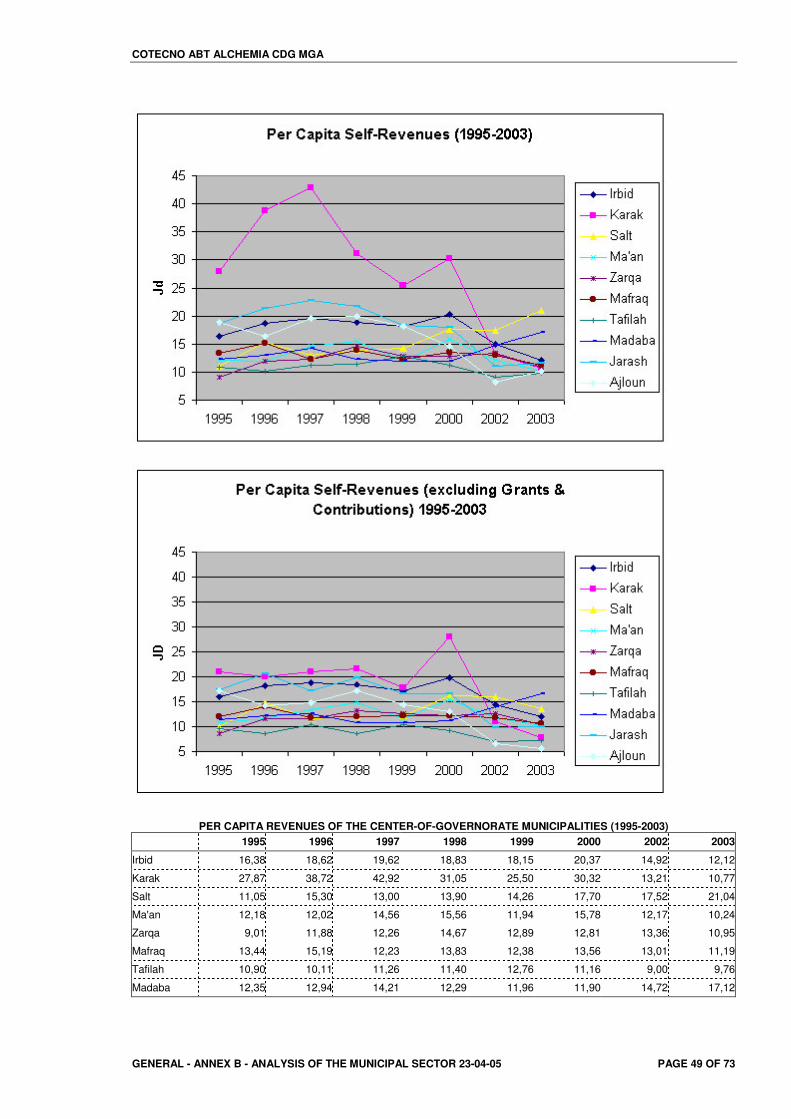
COTECNO ABT ALCHEMIA CDG MGA
GENERAL - ANNEX B - ANALYSIS OF THE MUNICIPAL SECTOR 23-04-05 PAGE 49 OF 73
PER CAPITA REVENUES OF THE CENTER-OF-GOVERNORATE MUNICIPALITIES (1995-2003) 1995 1996 1997 1998 1999 2000 2002 2003
Irbid 16,38 18,62 19,62 18,83 18,15 20,37 14,92 12,12
Karak 27,87 38,72 42,92 31,05 25,50 30,32 13,21 10,77
Salt 11,05 15,30 13,00 13,90 14,26 17,70 17,52 21,04
Ma'an 12,18 12,02 14,56 15,56 11,94 15,78 12,17 10,24
Zarqa 9,01 11,88 12,26 14,67 12,89 12,81 13,36 10,95
Mafraq 13,44 15,19 12,23 13,83 12,38 13,56 13,01 11,19
Tafilah 10,90 10,11 11,26 11,40 12,76 11,16 9,00 9,76
Madaba 12,35 12,94 14,21 12,29 11,96 11,90 14,72 17,12
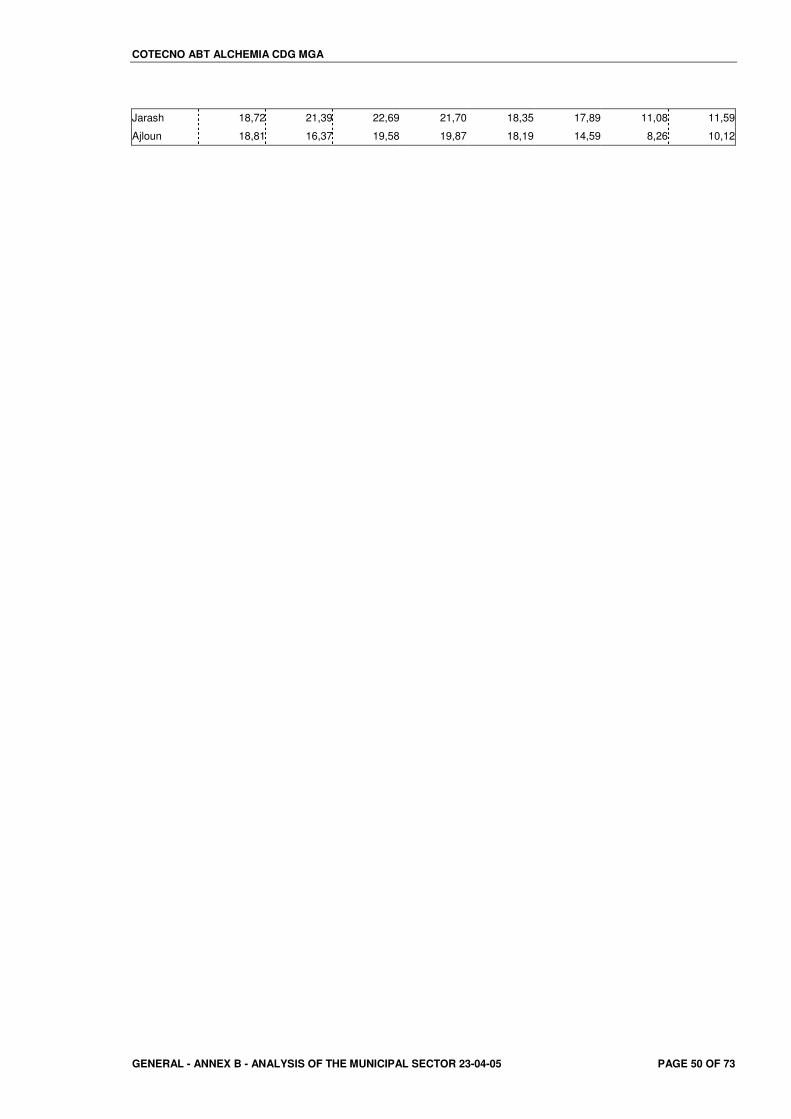
COTECNO ABT ALCHEMIA CDG MGA
GENERAL - ANNEX B - ANALYSIS OF THE MUNICIPAL SECTOR 23-04-05 PAGE 50 OF 73
Jarash 18,72 21,39 22,69 21,70 18,35 17,89 11,08 11,59
Ajloun 18,81 16,37 19,58 19,87 18,19 14,59 8,26 10,12
COTECNO ABT ALCHEMIA CDG MGA
GENERAL - ANNEX B - ANALYSIS OF THE MUNICIPAL SECTOR 23-04-05 PAGE 51 OF 73
?�� �� �'��� ������� �$ �2" � �� ����� �������2
������ ���
In spite of the strong centralization of the structures of the government of Jordan, the mu-nicipal authorities have the possibility and the responsibility to collect a relatively significant number of taxes and fees in comparison with the weakness of their effective revenues.
?���� �0$)#�$$��#&�," .�$$) #�(�()'�#$)#��.��$��
8.1.1. PARTIAL AND UNEVEN COLLECTION ADDED TO A BIG FALL DOWN
Any exercise of an artisanal, commercial or industrial occupation is, in theory, conditioned by obtaining a municipal license and by the payment of an annual fee whose amount is fixed by law. Not obtaining such an authorization or non-payment of renewal fees before the deadline subjects the contravener, according to law, to the provisional closing down of their activity and to the payment of a penalty which varies from 35 to 50% of the amount of the tax. The taxes are calculated using different bases, and the rates could be either specific or ad valorem. The per-seat or per-room bases are used for theaters and hotels, respectively, whereas large-scale manufacturing, construction, and import-export businesses are taxed as a percent of capital. On the contrary, small firms often pay a flat fee. When it is collected, the professional tax constitutes an important source of revenue, in particular, for the large cit-ies, and also for the small cities, which always have a considerable number of services and economic activities, and which provide a function of centrality for the surrounding regions.
However, it is far from being the case for the 10 municipalities under consideration:
• The tax on the professional licenses is actually a weak sources of revenue since it con-stitutes only 3.56% of the total revenues for the 10 municipalities and 6.57% of their self-revenue;
• Their contribution to the total revenues of the 10 municipalities dropped from almost 6% in 1995 to 3.56% in 2003; and their contribution to self-revenues - which underwent themselves, as we saw, a strong reduction - decreased during the same period from 8.5% to 6.57%;
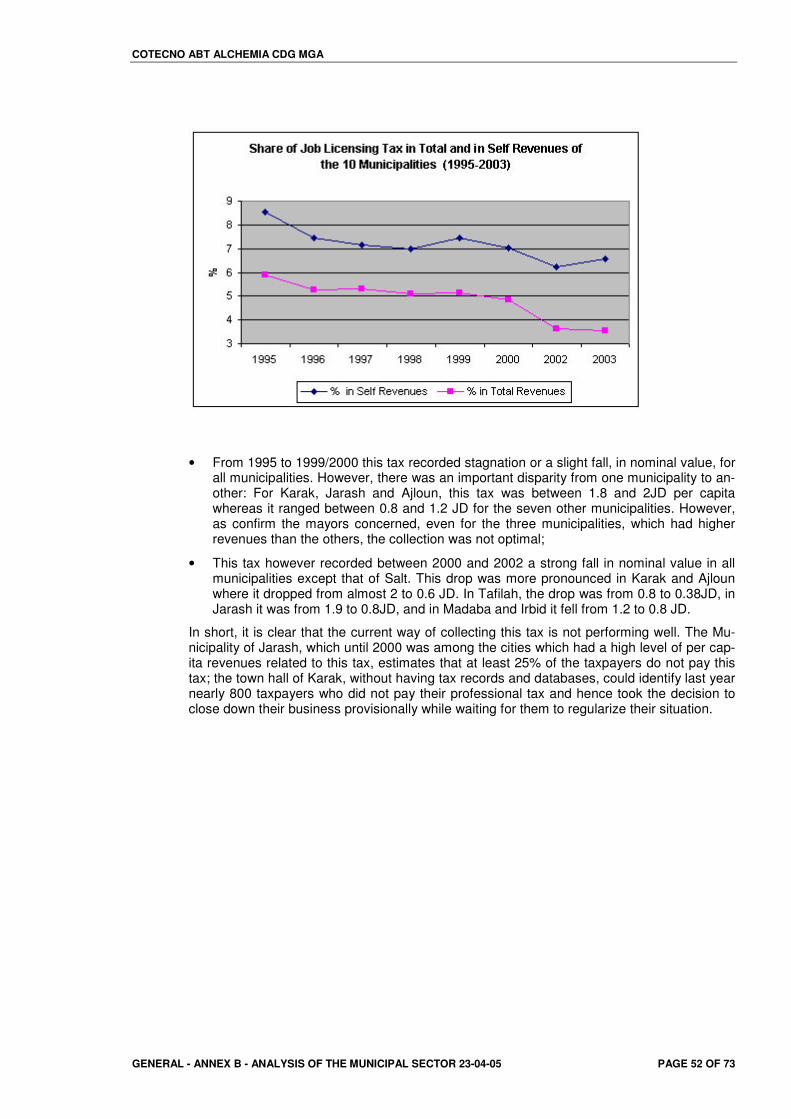
COTECNO ABT ALCHEMIA CDG MGA
GENERAL - ANNEX B - ANALYSIS OF THE MUNICIPAL SECTOR 23-04-05 PAGE 52 OF 73
• From 1995 to 1999/2000 this tax recorded stagnation or a slight fall, in nominal value, for all municipalities. However, there was an important disparity from one municipality to an-other: For Karak, Jarash and Ajloun, this tax was between 1.8 and 2JD per capita whereas it ranged between 0.8 and 1.2 JD for the seven other municipalities. However, as confirm the mayors concerned, even for the three municipalities, which had higher revenues than the others, the collection was not optimal;
• This tax however recorded between 2000 and 2002 a strong fall in nominal value in all municipalities except that of Salt. This drop was more pronounced in Karak and Ajloun where it dropped from almost 2 to 0.6 JD. In Tafilah, the drop was from 0.8 to 0.38JD, in Jarash it was from 1.9 to 0.8JD, and in Madaba and Irbid it fell from 1.2 to 0.8 JD.
In short, it is clear that the current way of collecting this tax is not performing well. The Mu-nicipality of Jarash, which until 2000 was among the cities which had a high level of per cap-ita revenues related to this tax, estimates that at least 25% of the taxpayers do not pay this tax; the town hall of Karak, without having tax records and databases, could identify last year nearly 800 taxpayers who did not pay their professional tax and hence took the decision to close down their business provisionally while waiting for them to regularize their situation.
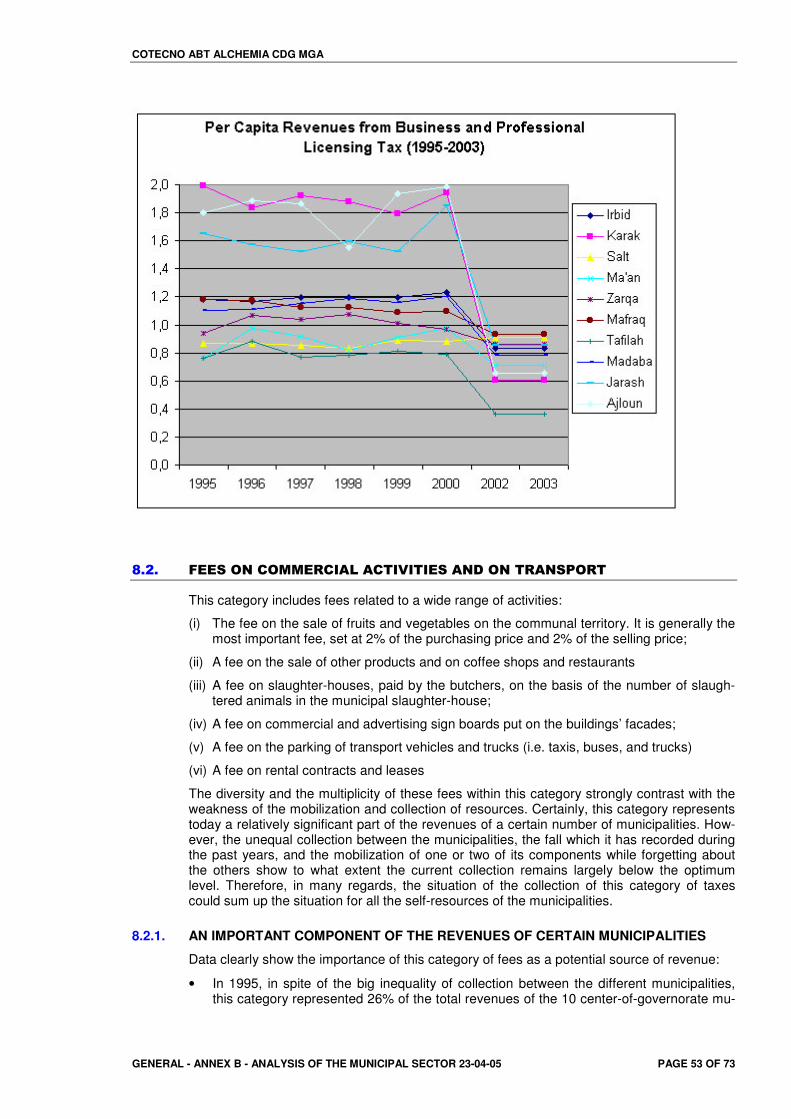
COTECNO ABT ALCHEMIA CDG MGA
GENERAL - ANNEX B - ANALYSIS OF THE MUNICIPAL SECTOR 23-04-05 PAGE 53 OF 73
?�1�� .��$� #�' ���"')�(��'�)!)�)�$��#&� #��"�#$, "���
This category includes fees related to a wide range of activities:
(i) The fee on the sale of fruits and vegetables on the communal territory. It is generally the most important fee, set at 2% of the purchasing price and 2% of the selling price;
(ii) A fee on the sale of other products and on coffee shops and restaurants
(iii) A fee on slaughter-houses, paid by the butchers, on the basis of the number of slaugh-tered animals in the municipal slaughter-house;
(iv) A fee on commercial and advertising sign boards put on the buildings’ facades;
(v) A fee on the parking of transport vehicles and trucks (i.e. taxis, buses, and trucks)
(vi) A fee on rental contracts and leases
The diversity and the multiplicity of these fees within this category strongly contrast with the weakness of the mobilization and collection of resources. Certainly, this category represents today a relatively significant part of the revenues of a certain number of municipalities. How-ever, the unequal collection between the municipalities, the fall which it has recorded during the past years, and the mobilization of one or two of its components while forgetting about the others show to what extent the current collection remains largely below the optimum level. Therefore, in many regards, the situation of the collection of this category of taxes could sum up the situation for all the self-resources of the municipalities.
8.2.1. AN IMPORTANT COMPONENT OF THE REVENUES OF CERTAIN MUNICIPALITIES
Data clearly show the importance of this category of fees as a potential source of revenue:
• In 1995, in spite of the big inequality of collection between the different municipalities, this category represented 26% of the total revenues of the 10 center-of-governorate mu-
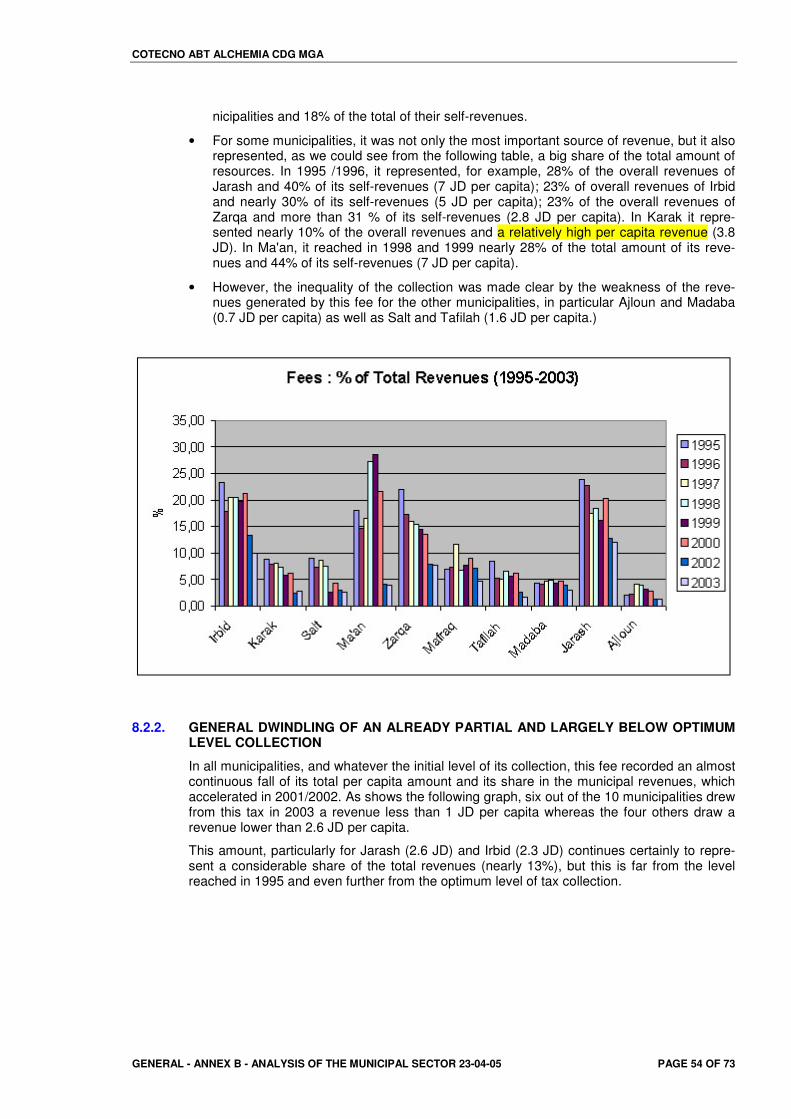
COTECNO ABT ALCHEMIA CDG MGA
GENERAL - ANNEX B - ANALYSIS OF THE MUNICIPAL SECTOR 23-04-05 PAGE 54 OF 73
nicipalities and 18% of the total of their self-revenues.
• For some municipalities, it was not only the most important source of revenue, but it also represented, as we could see from the following table, a big share of the total amount of resources. In 1995 /1996, it represented, for example, 28% of the overall revenues of Jarash and 40% of its self-revenues (7 JD per capita); 23% of overall revenues of Irbid and nearly 30% of its self-revenues (5 JD per capita); 23% of the overall revenues of Zarqa and more than 31 % of its self-revenues (2.8 JD per capita). In Karak it repre-sented nearly 10% of the overall revenues and a relatively high per capita revenue (3.8 JD). In Ma'an, it reached in 1998 and 1999 nearly 28% of the total amount of its reve-nues and 44% of its self-revenues (7 JD per capita).
• However, the inequality of the collection was made clear by the weakness of the reve-nues generated by this fee for the other municipalities, in particular Ajloun and Madaba (0.7 JD per capita) as well as Salt and Tafilah (1.6 JD per capita.)
8.2.2. GENERAL DWINDLING OF AN ALREADY PARTIAL AND LARGELY BELOW OPTIMUM LEVEL COLLECTION
In all municipalities, and whatever the initial level of its collection, this fee recorded an almost continuous fall of its total per capita amount and its share in the municipal revenues, which accelerated in 2001/2002. As shows the following graph, six out of the 10 municipalities drew from this tax in 2003 a revenue less than 1 JD per capita whereas the four others draw a revenue lower than 2.6 JD per capita.
This amount, particularly for Jarash (2.6 JD) and Irbid (2.3 JD) continues certainly to repre-sent a considerable share of the total revenues (nearly 13%), but this is far from the level reached in 1995 and even further from the optimum level of tax collection.
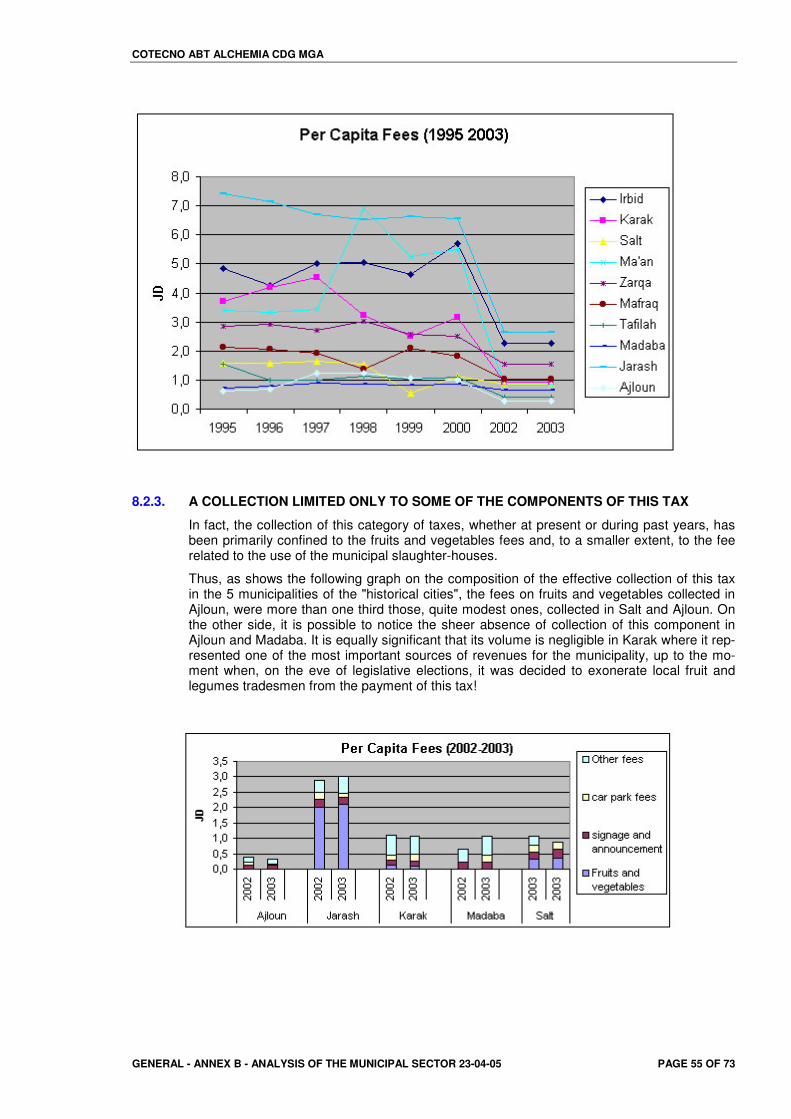
COTECNO ABT ALCHEMIA CDG MGA
GENERAL - ANNEX B - ANALYSIS OF THE MUNICIPAL SECTOR 23-04-05 PAGE 55 OF 73
8.2.3. A COLLECTION LIMITED ONLY TO SOME OF THE COMPONENTS OF THIS TAX
In fact, the collection of this category of taxes, whether at present or during past years, has been primarily confined to the fruits and vegetables fees and, to a smaller extent, to the fee related to the use of the municipal slaughter-houses.
Thus, as shows the following graph on the composition of the effective collection of this tax in the 5 municipalities of the "historical cities", the fees on fruits and vegetables collected in Ajloun, were more than one third those, quite modest ones, collected in Salt and Ajloun. On the other side, it is possible to notice the sheer absence of collection of this component in Ajloun and Madaba. It is equally significant that its volume is negligible in Karak where it rep-resented one of the most important sources of revenues for the municipality, up to the mo-ment when, on the eve of legislative elections, it was decided to exonerate local fruit and legumes tradesmen from the payment of this tax!
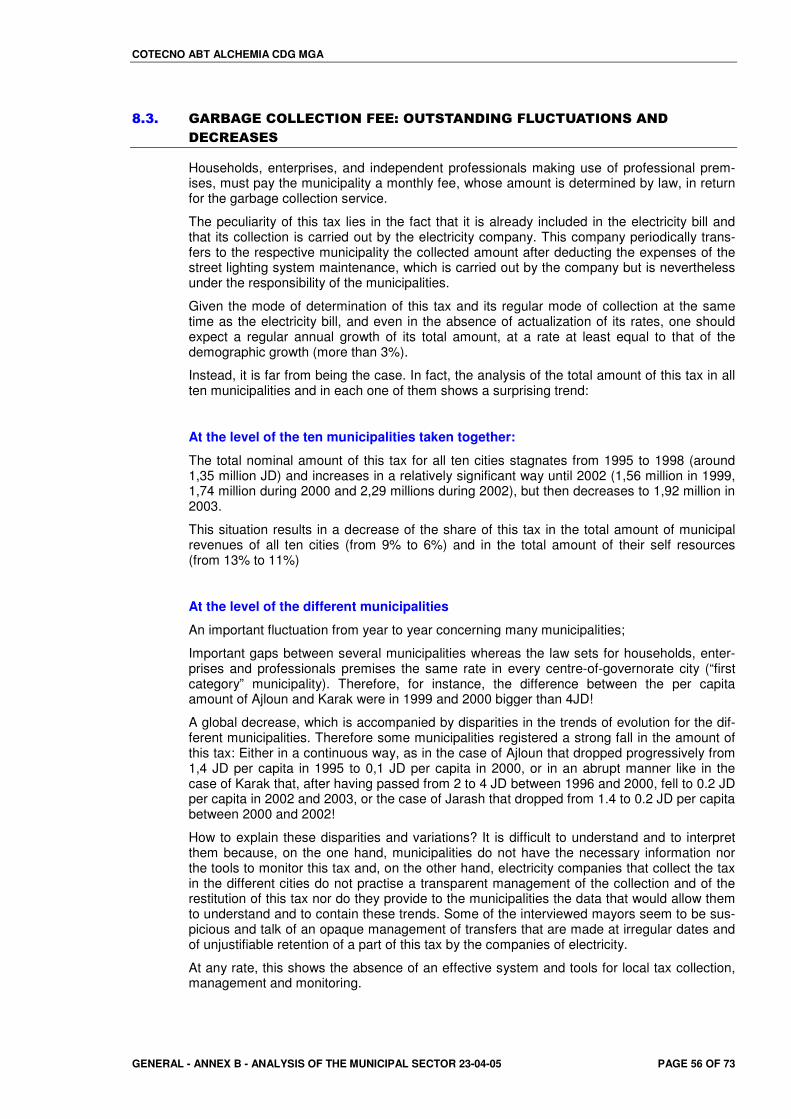
COTECNO ABT ALCHEMIA CDG MGA
GENERAL - ANNEX B - ANALYSIS OF THE MUNICIPAL SECTOR 23-04-05 PAGE 56 OF 73
?�4�� ��"�����' ((�'�) #�.��%� 0�$��#&)#��.(0'�0��) #$��#&�
&�'"��$�$�
Households, enterprises, and independent professionals making use of professional prem-ises, must pay the municipality a monthly fee, whose amount is determined by law, in return for the garbage collection service.
The peculiarity of this tax lies in the fact that it is already included in the electricity bill and that its collection is carried out by the electricity company. This company periodically trans-fers to the respective municipality the collected amount after deducting the expenses of the street lighting system maintenance, which is carried out by the company but is nevertheless under the responsibility of the municipalities.
Given the mode of determination of this tax and its regular mode of collection at the same time as the electricity bill, and even in the absence of actualization of its rates, one should expect a regular annual growth of its total amount, at a rate at least equal to that of the demographic growth (more than 3%).
Instead, it is far from being the case. In fact, the analysis of the total amount of this tax in all ten municipalities and in each one of them shows a surprising trend:
At the level of the ten municipalities taken together:
The total nominal amount of this tax for all ten cities stagnates from 1995 to 1998 (around 1,35 million JD) and increases in a relatively significant way until 2002 (1,56 million in 1999, 1,74 million during 2000 and 2,29 millions during 2002), but then decreases to 1,92 million in 2003.
This situation results in a decrease of the share of this tax in the total amount of municipal revenues of all ten cities (from 9% to 6%) and in the total amount of their self resources (from 13% to 11%)
At the level of the different municipalities
An important fluctuation from year to year concerning many municipalities;
Important gaps between several municipalities whereas the law sets for households, enter-prises and professionals premises the same rate in every centre-of-governorate city (“first category” municipality). Therefore, for instance, the difference between the per capita amount of Ajloun and Karak were in 1999 and 2000 bigger than 4JD!
A global decrease, which is accompanied by disparities in the trends of evolution for the dif-ferent municipalities. Therefore some municipalities registered a strong fall in the amount of this tax: Either in a continuous way, as in the case of Ajloun that dropped progressively from 1,4 JD per capita in 1995 to 0,1 JD per capita in 2000, or in an abrupt manner like in the case of Karak that, after having passed from 2 to 4 JD between 1996 and 2000, fell to 0.2 JD per capita in 2002 and 2003, or the case of Jarash that dropped from 1.4 to 0.2 JD per capita between 2000 and 2002!
How to explain these disparities and variations? It is difficult to understand and to interpret them because, on the one hand, municipalities do not have the necessary information nor the tools to monitor this tax and, on the other hand, electricity companies that collect the tax in the different cities do not practise a transparent management of the collection and of the restitution of this tax nor do they provide to the municipalities the data that would allow them to understand and to contain these trends. Some of the interviewed mayors seem to be sus-picious and talk of an opaque management of transfers that are made at irregular dates and of unjustifiable retention of a part of this tax by the companies of electricity.
At any rate, this shows the absence of an effective system and tools for local tax collection, management and monitoring.
COTECNO ABT ALCHEMIA CDG MGA
GENERAL - ANNEX B - ANALYSIS OF THE MUNICIPAL SECTOR 23-04-05 PAGE 57 OF 73
?�7�� ��/�$��#&�"�!�#0�$�"�(���&�� �0"��#��/,�#$) #��#&�0"��#)$���
The tax system on urban planning and development was introduced in Jordan in 1955 with the Law No 31/1955. This law was replaced in 1966 by the Law 79/19966 and completed in 1979 by the Law no 79, so-called «law for the organization of the cities, the villages and con-struction».
These laws instituted (i) a compulsory construction license attainable through the payment of a tax; (i) the power of the municipalities to oblige real estate owners to join the plan of urban-ism and to pay a planning fee and also to pay a " improvement tax" that is, a tax related to the land gaining in value as a result of the effort made by the municipalities and the public
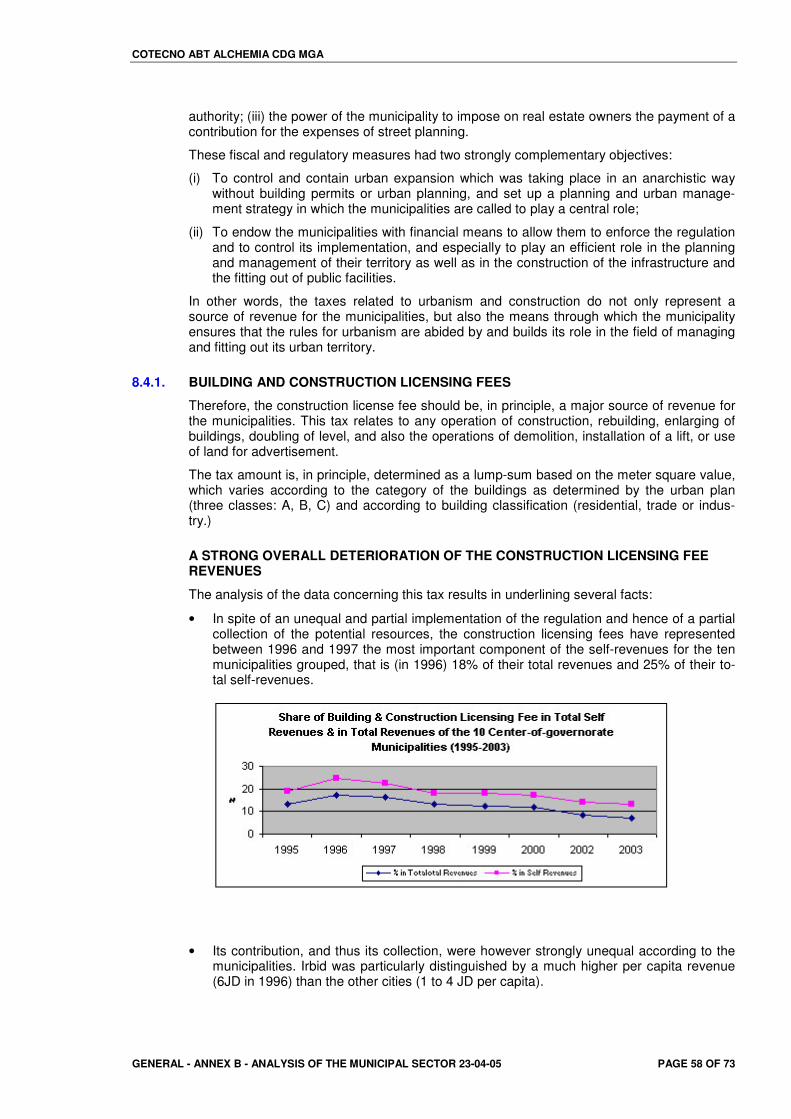
COTECNO ABT ALCHEMIA CDG MGA
GENERAL - ANNEX B - ANALYSIS OF THE MUNICIPAL SECTOR 23-04-05 PAGE 58 OF 73
authority; (iii) the power of the municipality to impose on real estate owners the payment of a contribution for the expenses of street planning.
These fiscal and regulatory measures had two strongly complementary objectives:
(i) To control and contain urban expansion which was taking place in an anarchistic way without building permits or urban planning, and set up a planning and urban manage-ment strategy in which the municipalities are called to play a central role;
(ii) To endow the municipalities with financial means to allow them to enforce the regulation and to control its implementation, and especially to play an efficient role in the planning and management of their territory as well as in the construction of the infrastructure and the fitting out of public facilities.
In other words, the taxes related to urbanism and construction do not only represent a source of revenue for the municipalities, but also the means through which the municipality ensures that the rules for urbanism are abided by and builds its role in the field of managing and fitting out its urban territory.
8.4.1. BUILDING AND CONSTRUCTION LICENSING FEES
Therefore, the construction license fee should be, in principle, a major source of revenue for the municipalities. This tax relates to any operation of construction, rebuilding, enlarging of buildings, doubling of level, and also the operations of demolition, installation of a lift, or use of land for advertisement.
The tax amount is, in principle, determined as a lump-sum based on the meter square value, which varies according to the category of the buildings as determined by the urban plan (three classes: A, B, C) and according to building classification (residential, trade or indus-try.)
A STRONG OVERALL DETERIORATION OF THE CONSTRUCTION LICENSING FEE REVENUES
The analysis of the data concerning this tax results in underlining several facts:
• In spite of an unequal and partial implementation of the regulation and hence of a partial collection of the potential resources, the construction licensing fees have represented between 1996 and 1997 the most important component of the self-revenues for the ten municipalities grouped, that is (in 1996) 18% of their total revenues and 25% of their to-tal self-revenues.
• Its contribution, and thus its collection, were however strongly unequal according to the municipalities. Irbid was particularly distinguished by a much higher per capita revenue (6JD in 1996) than the other cities (1 to 4 JD per capita).
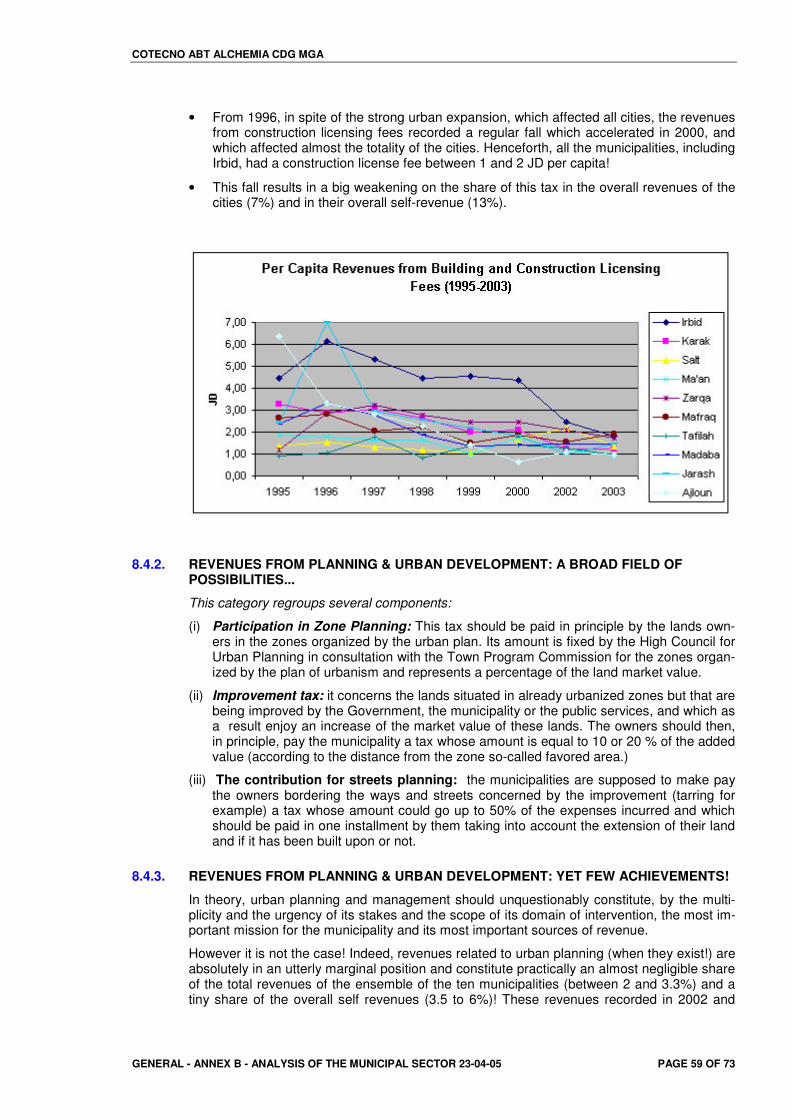
COTECNO ABT ALCHEMIA CDG MGA
GENERAL - ANNEX B - ANALYSIS OF THE MUNICIPAL SECTOR 23-04-05 PAGE 59 OF 73
• From 1996, in spite of the strong urban expansion, which affected all cities, the revenues from construction licensing fees recorded a regular fall which accelerated in 2000, and which affected almost the totality of the cities. Henceforth, all the municipalities, including Irbid, had a construction license fee between 1 and 2 JD per capita!
• This fall results in a big weakening on the share of this tax in the overall revenues of the cities (7%) and in their overall self-revenue (13%).
8.4.2. REVENUES FROM PLANNING & URBAN DEVELOPMENT: A BROAD FIELD OF POSSIBILITIES...
This category regroups several components:
(i) Participation in Zone Planning: This tax should be paid in principle by the lands own-ers in the zones organized by the urban plan. Its amount is fixed by the High Council for Urban Planning in consultation with the Town Program Commission for the zones organ-ized by the plan of urbanism and represents a percentage of the land market value.
(ii) Improvement tax: it concerns the lands situated in already urbanized zones but that are being improved by the Government, the municipality or the public services, and which as a result enjoy an increase of the market value of these lands. The owners should then, in principle, pay the municipality a tax whose amount is equal to 10 or 20 % of the added value (according to the distance from the zone so-called favored area.)
(iii) The contribution for streets planning: the municipalities are supposed to make pay the owners bordering the ways and streets concerned by the improvement (tarring for example) a tax whose amount could go up to 50% of the expenses incurred and which should be paid in one installment by them taking into account the extension of their land and if it has been built upon or not.
8.4.3. REVENUES FROM PLANNING & URBAN DEVELOPMENT: YET FEW ACHIEVEMENTS!
In theory, urban planning and management should unquestionably constitute, by the multi-plicity and the urgency of its stakes and the scope of its domain of intervention, the most im-portant mission for the municipality and its most important sources of revenue.
However it is not the case! Indeed, revenues related to urban planning (when they exist!) are absolutely in an utterly marginal position and constitute practically an almost negligible share of the total revenues of the ensemble of the ten municipalities (between 2 and 3.3%) and a tiny share of the overall self revenues (3.5 to 6%)! These revenues recorded in 2002 and
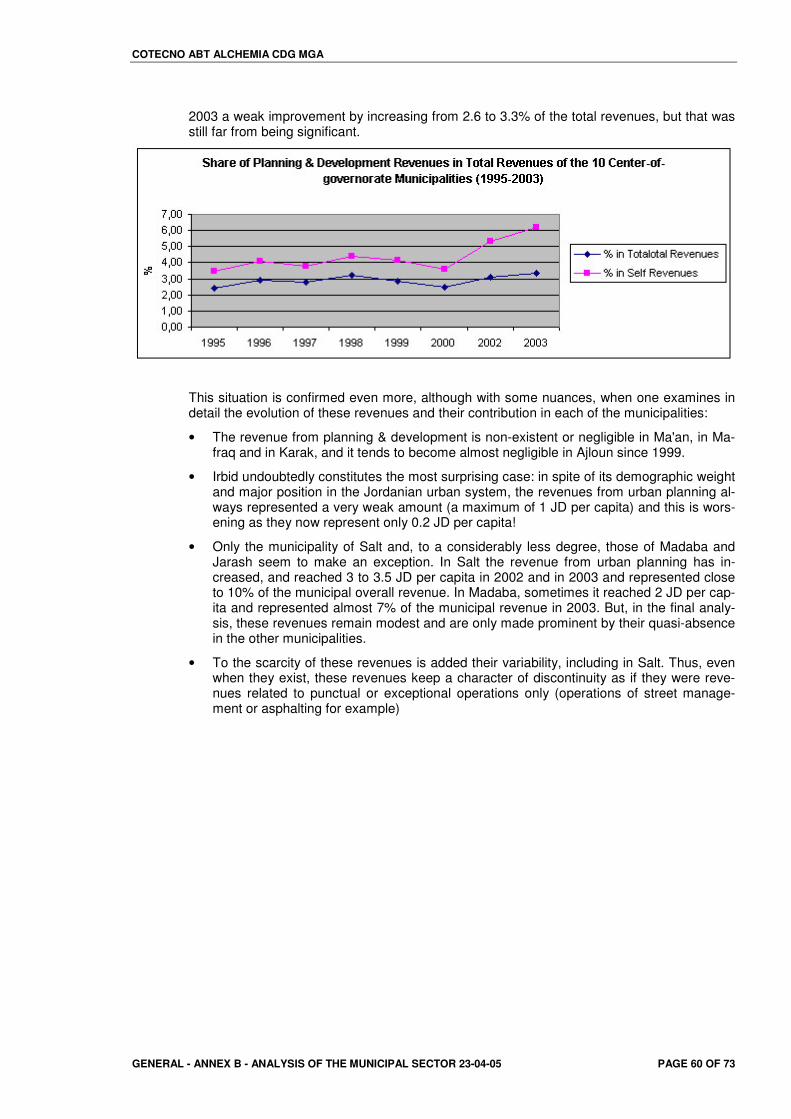
COTECNO ABT ALCHEMIA CDG MGA
GENERAL - ANNEX B - ANALYSIS OF THE MUNICIPAL SECTOR 23-04-05 PAGE 60 OF 73
2003 a weak improvement by increasing from 2.6 to 3.3% of the total revenues, but that was still far from being significant.
This situation is confirmed even more, although with some nuances, when one examines in detail the evolution of these revenues and their contribution in each of the municipalities:
• The revenue from planning & development is non-existent or negligible in Ma'an, in Ma-fraq and in Karak, and it tends to become almost negligible in Ajloun since 1999.
• Irbid undoubtedly constitutes the most surprising case: in spite of its demographic weight and major position in the Jordanian urban system, the revenues from urban planning al-ways represented a very weak amount (a maximum of 1 JD per capita) and this is wors-ening as they now represent only 0.2 JD per capita!
• Only the municipality of Salt and, to a considerably less degree, those of Madaba and Jarash seem to make an exception. In Salt the revenue from urban planning has in-creased, and reached 3 to 3.5 JD per capita in 2002 and in 2003 and represented close to 10% of the municipal overall revenue. In Madaba, sometimes it reached 2 JD per cap-ita and represented almost 7% of the municipal revenue in 2003. But, in the final analy-sis, these revenues remain modest and are only made prominent by their quasi-absence in the other municipalities.
• To the scarcity of these revenues is added their variability, including in Salt. Thus, even when they exist, these revenues keep a character of discontinuity as if they were reve-nues related to punctual or exceptional operations only (operations of street manage-ment or asphalting for example)
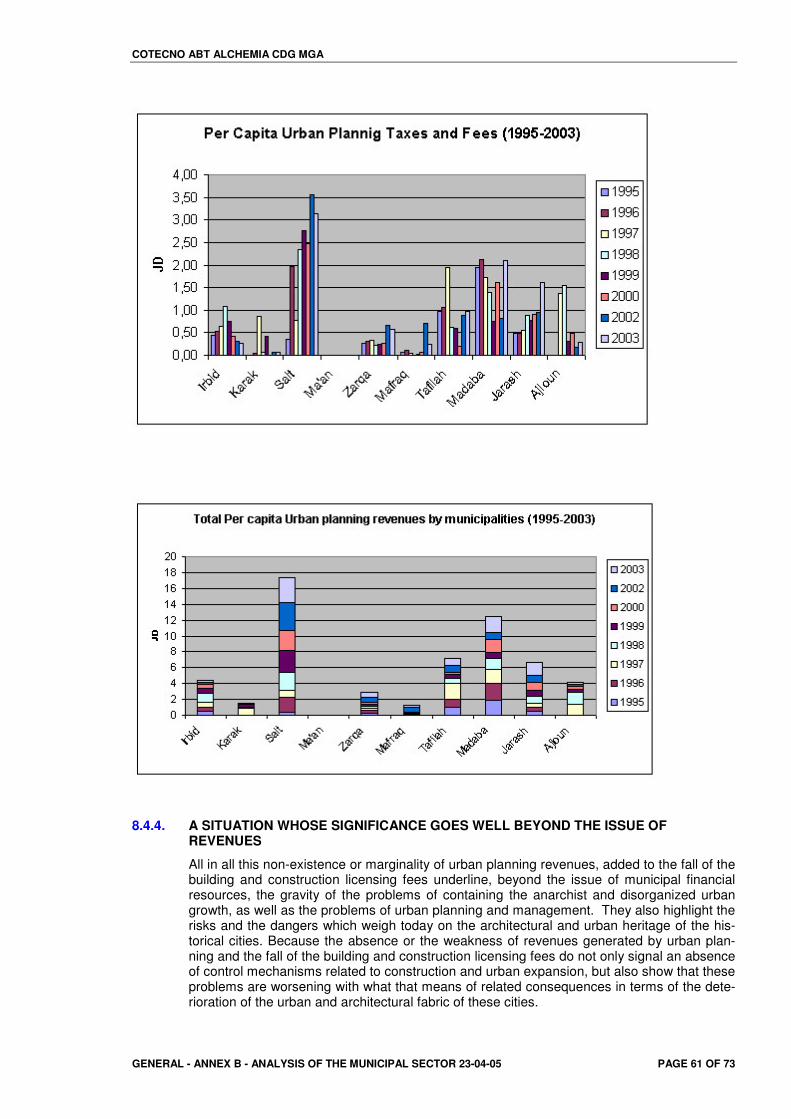
COTECNO ABT ALCHEMIA CDG MGA
GENERAL - ANNEX B - ANALYSIS OF THE MUNICIPAL SECTOR 23-04-05 PAGE 61 OF 73
8.4.4. A SITUATION WHOSE SIGNIFICANCE GOES WELL BEYOND THE ISSUE OF REVENUES
All in all this non-existence or marginality of urban planning revenues, added to the fall of the building and construction licensing fees underline, beyond the issue of municipal financial resources, the gravity of the problems of containing the anarchist and disorganized urban growth, as well as the problems of urban planning and management. They also highlight the risks and the dangers which weigh today on the architectural and urban heritage of the his-torical cities. Because the absence or the weakness of revenues generated by urban plan-ning and the fall of the building and construction licensing fees do not only signal an absence of control mechanisms related to construction and urban expansion, but also show that these problems are worsening with what that means of related consequences in terms of the dete-rioration of the urban and architectural fabric of these cities.
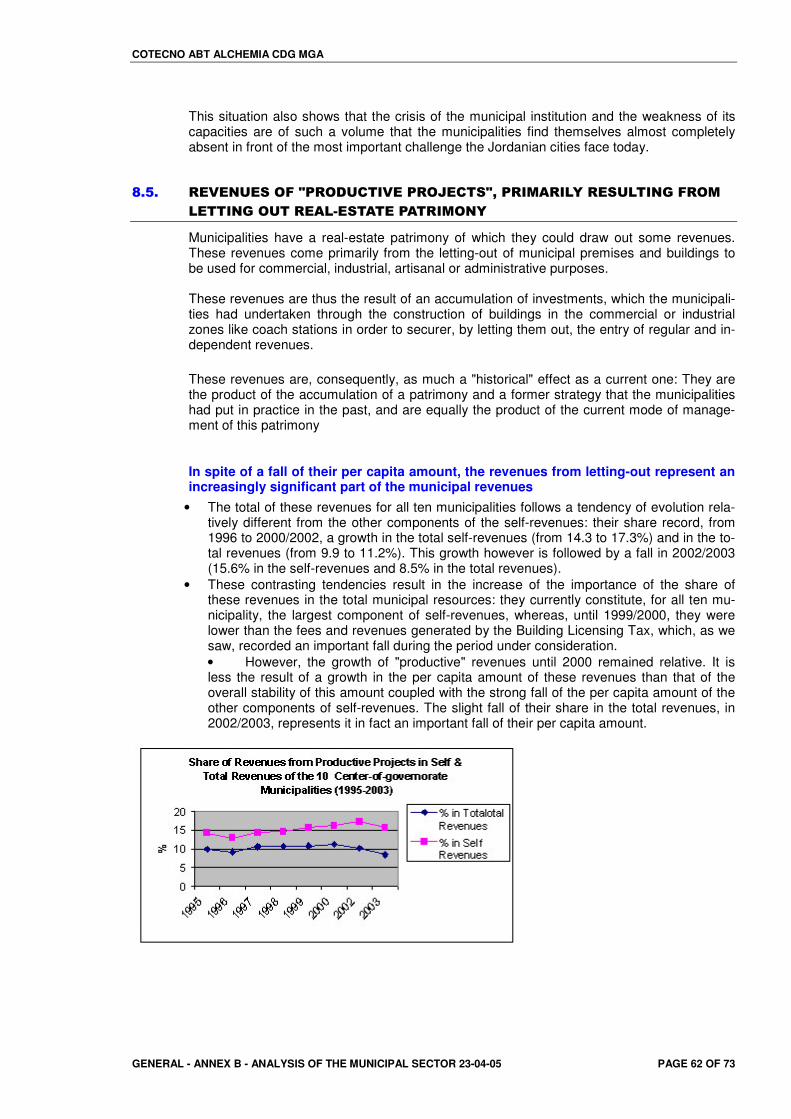
COTECNO ABT ALCHEMIA CDG MGA
GENERAL - ANNEX B - ANALYSIS OF THE MUNICIPAL SECTOR 23-04-05 PAGE 62 OF 73
This situation also shows that the crisis of the municipal institution and the weakness of its capacities are of such a volume that the municipalities find themselves almost completely absent in front of the most important challenge the Jordanian cities face today.
?�9�� "�!�#0�$� .�@," &0'�)!��," ��'�$@A�,")��")(-�"�$0(�)#��." ��
(���)#�� 0��"��(2�$�����,��")� #-��
Municipalities have a real-estate patrimony of which they could draw out some revenues. These revenues come primarily from the letting-out of municipal premises and buildings to be used for commercial, industrial, artisanal or administrative purposes. These revenues are thus the result of an accumulation of investments, which the municipali-ties had undertaken through the construction of buildings in the commercial or industrial zones like coach stations in order to securer, by letting them out, the entry of regular and in-dependent revenues.
These revenues are, consequently, as much a "historical" effect as a current one: They are the product of the accumulation of a patrimony and a former strategy that the municipalities had put in practice in the past, and are equally the product of the current mode of manage-ment of this patrimony
In spite of a fall of their per capita amount, the revenues from letting-out represent an increasingly significant part of the municipal revenues
• The total of these revenues for all ten municipalities follows a tendency of evolution rela-tively different from the other components of the self-revenues: their share record, from 1996 to 2000/2002, a growth in the total self-revenues (from 14.3 to 17.3%) and in the to-tal revenues (from 9.9 to 11.2%). This growth however is followed by a fall in 2002/2003 (15.6% in the self-revenues and 8.5% in the total revenues).
• These contrasting tendencies result in the increase of the importance of the share of these revenues in the total municipal resources: they currently constitute, for all ten mu-nicipality, the largest component of self-revenues, whereas, until 1999/2000, they were lower than the fees and revenues generated by the Building Licensing Tax, which, as we saw, recorded an important fall during the period under consideration. • However, the growth of "productive" revenues until 2000 remained relative. It is less the result of a growth in the per capita amount of these revenues than that of the overall stability of this amount coupled with the strong fall of the per capita amount of the other components of self-revenues. The slight fall of their share in the total revenues, in 2002/2003, represents it in fact an important fall of their per capita amount.
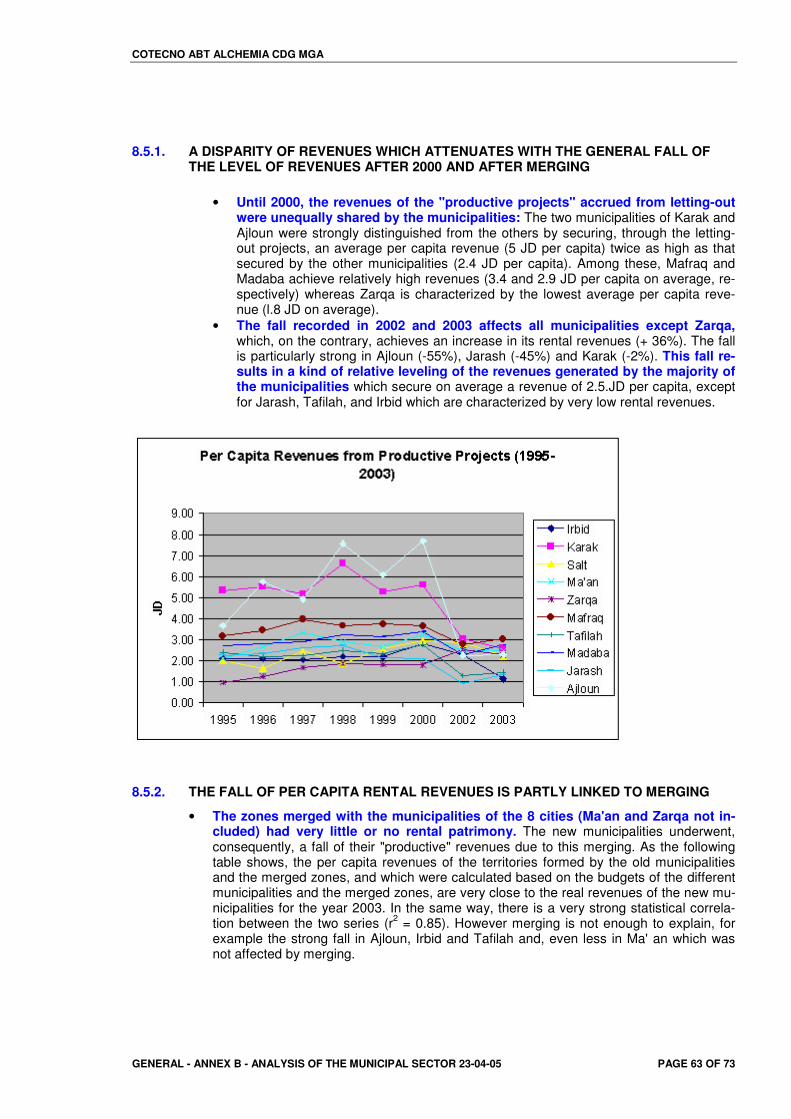
COTECNO ABT ALCHEMIA CDG MGA
GENERAL - ANNEX B - ANALYSIS OF THE MUNICIPAL SECTOR 23-04-05 PAGE 63 OF 73
8.5.1. A DISPARITY OF REVENUES WHICH ATTENUATES WITH THE GENERAL FALL OF THE LEVEL OF REVENUES AFTER 2000 AND AFTER MERGING
• Until 2000, the revenues of the "productive projects" accrued from letting-out were unequally shared by the municipalities: The two municipalities of Karak and Ajloun were strongly distinguished from the others by securing, through the letting-out projects, an average per capita revenue (5 JD per capita) twice as high as that secured by the other municipalities (2.4 JD per capita). Among these, Mafraq and Madaba achieve relatively high revenues (3.4 and 2.9 JD per capita on average, re-spectively) whereas Zarqa is characterized by the lowest average per capita reve-nue (l.8 JD on average).
• The fall recorded in 2002 and 2003 affects all municipalities except Zarqa, which, on the contrary, achieves an increase in its rental revenues (+ 36%). The fall is particularly strong in Ajloun (-55%), Jarash (-45%) and Karak (-2%). This fall re-sults in a kind of relative leveling of the revenues generated by the majority of the municipalities which secure on average a revenue of 2.5.JD per capita, except for Jarash, Tafilah, and Irbid which are characterized by very low rental revenues.
8.5.2. THE FALL OF PER CAPITA RENTAL REVENUES IS PARTLY LINKED TO MERGING
• The zones merged with the municipalities of the 8 cities (Ma'an and Zarqa not in-cluded) had very little or no rental patrimony. The new municipalities underwent, consequently, a fall of their "productive" revenues due to this merging. As the following table shows, the per capita revenues of the territories formed by the old municipalities and the merged zones, and which were calculated based on the budgets of the different municipalities and the merged zones, are very close to the real revenues of the new mu-nicipalities for the year 2003. In the same way, there is a very strong statistical correla-tion between the two series (r2 = 0.85). However merging is not enough to explain, for example the strong fall in Ajloun, Irbid and Tafilah and, even less in Ma' an which was not affected by merging.
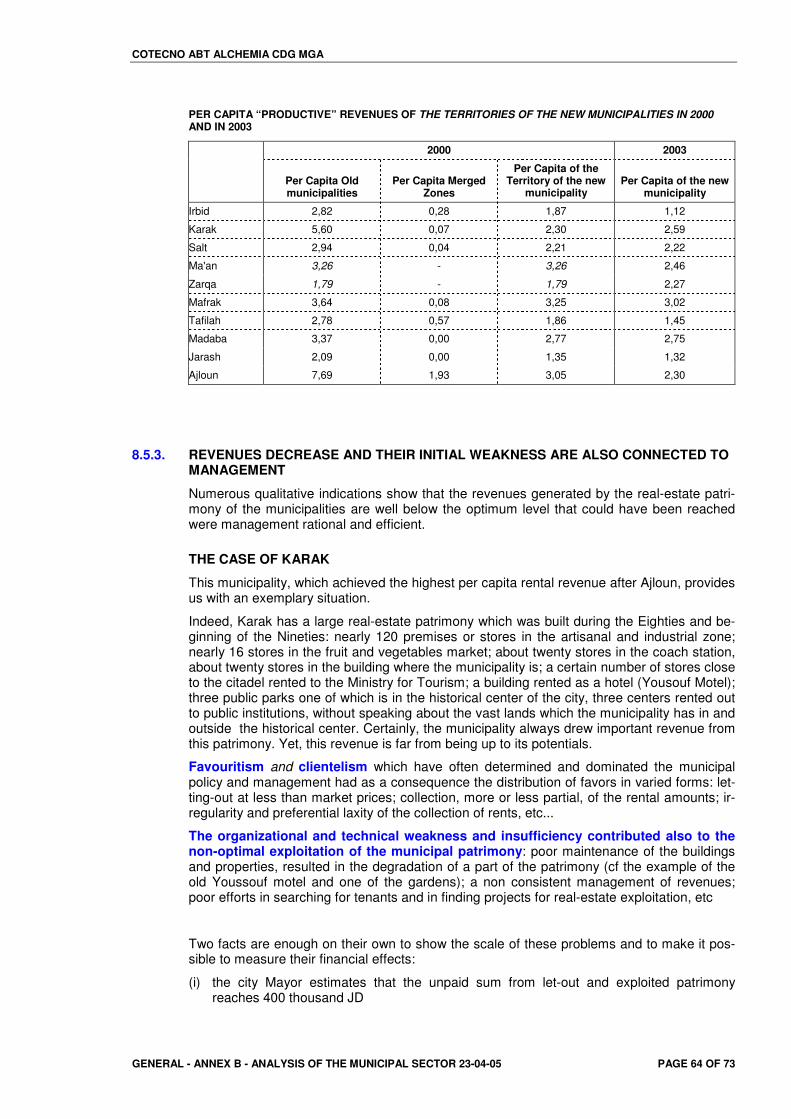
COTECNO ABT ALCHEMIA CDG MGA
GENERAL - ANNEX B - ANALYSIS OF THE MUNICIPAL SECTOR 23-04-05 PAGE 64 OF 73
PER CAPITA “PRODUCTIVE” REVENUES OF THE TERRITORIES OF THE NEW MUNICIPALITIES IN 2000 AND IN 2003
2000 2003
Per Capita Old municipalities
Per Capita Merged Zones
Per Capita of the Territory of the new
municipality Per Capita of the new
municipality
Irbid 2,82 0,28 1,87 1,12
Karak 5,60 0,07 2,30 2,59
Salt 2,94 0,04 2,21 2,22
Ma'an 3,26 - 3,26 2,46
Zarqa 1,79 - 1,79 2,27
Mafrak 3,64 0,08 3,25 3,02
Tafilah 2,78 0,57 1,86 1,45
Madaba 3,37 0,00 2,77 2,75
Jarash 2,09 0,00 1,35 1,32
Ajloun 7,69 1,93 3,05 2,30
8.5.3. REVENUES DECREASE AND THEIR INITIAL WEAKNESS ARE ALSO CONNECTED TO MANAGEMENT
Numerous qualitative indications show that the revenues generated by the real-estate patri-mony of the municipalities are well below the optimum level that could have been reached were management rational and efficient.
THE CASE OF KARAK
This municipality, which achieved the highest per capita rental revenue after Ajloun, provides us with an exemplary situation.
Indeed, Karak has a large real-estate patrimony which was built during the Eighties and be-ginning of the Nineties: nearly 120 premises or stores in the artisanal and industrial zone; nearly 16 stores in the fruit and vegetables market; about twenty stores in the coach station, about twenty stores in the building where the municipality is; a certain number of stores close to the citadel rented to the Ministry for Tourism; a building rented as a hotel (Yousouf Motel); three public parks one of which is in the historical center of the city, three centers rented out to public institutions, without speaking about the vast lands which the municipality has in and outside the historical center. Certainly, the municipality always drew important revenue from this patrimony. Yet, this revenue is far from being up to its potentials.
Favouritism and clientelism which have often determined and dominated the municipal policy and management had as a consequence the distribution of favors in varied forms: let-ting-out at less than market prices; collection, more or less partial, of the rental amounts; ir-regularity and preferential laxity of the collection of rents, etc...
The organizational and technical weakness and insufficiency contributed also to the non-optimal exploitation of the municipal patrimony: poor maintenance of the buildings and properties, resulted in the degradation of a part of the patrimony (cf the example of the old Youssouf motel and one of the gardens); a non consistent management of revenues; poor efforts in searching for tenants and in finding projects for real-estate exploitation, etc
Two facts are enough on their own to show the scale of these problems and to make it pos-sible to measure their financial effects:
(i) the city Mayor estimates that the unpaid sum from let-out and exploited patrimony reaches 400 thousand JD
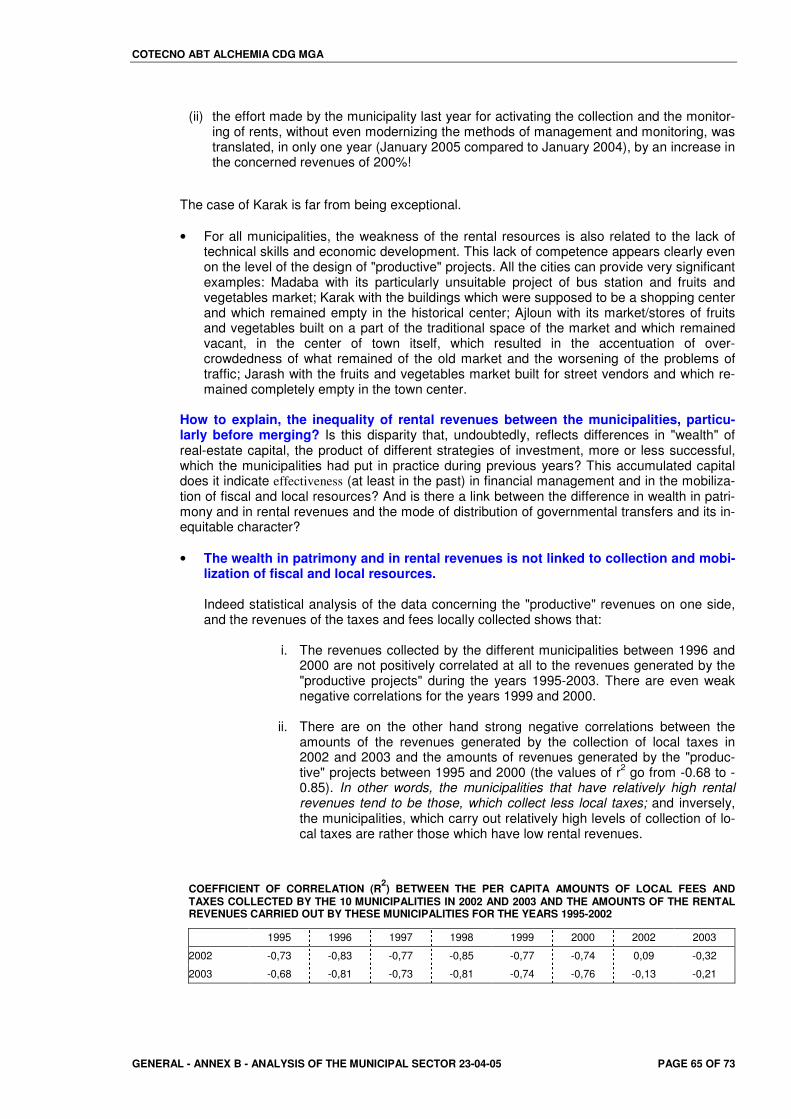
COTECNO ABT ALCHEMIA CDG MGA
GENERAL - ANNEX B - ANALYSIS OF THE MUNICIPAL SECTOR 23-04-05 PAGE 65 OF 73
(ii) the effort made by the municipality last year for activating the collection and the monitor-ing of rents, without even modernizing the methods of management and monitoring, was translated, in only one year (January 2005 compared to January 2004), by an increase in the concerned revenues of 200%!
The case of Karak is far from being exceptional. • For all municipalities, the weakness of the rental resources is also related to the lack of
technical skills and economic development. This lack of competence appears clearly even on the level of the design of "productive" projects. All the cities can provide very significant examples: Madaba with its particularly unsuitable project of bus station and fruits and vegetables market; Karak with the buildings which were supposed to be a shopping center and which remained empty in the historical center; Ajloun with its market/stores of fruits and vegetables built on a part of the traditional space of the market and which remained vacant, in the center of town itself, which resulted in the accentuation of over-crowdedness of what remained of the old market and the worsening of the problems of traffic; Jarash with the fruits and vegetables market built for street vendors and which re-mained completely empty in the town center.
How to explain, the inequality of rental revenues between the municipalities, particu-larly before merging? Is this disparity that, undoubtedly, reflects differences in "wealth" of real-estate capital, the product of different strategies of investment, more or less successful, which the municipalities had put in practice during previous years? This accumulated capital does it indicate effectiveness (at least in the past) in financial management and in the mobiliza-tion of fiscal and local resources? And is there a link between the difference in wealth in patri-mony and in rental revenues and the mode of distribution of governmental transfers and its in-equitable character? • The wealth in patrimony and in rental revenues is not linked to collection and mobi-
lization of fiscal and local resources.
Indeed statistical analysis of the data concerning the "productive" revenues on one side, and the revenues of the taxes and fees locally collected shows that:
i. The revenues collected by the different municipalities between 1996 and 2000 are not positively correlated at all to the revenues generated by the "productive projects" during the years 1995-2003. There are even weak negative correlations for the years 1999 and 2000.
ii. There are on the other hand strong negative correlations between the
amounts of the revenues generated by the collection of local taxes in 2002 and 2003 and the amounts of revenues generated by the "produc-tive" projects between 1995 and 2000 (the values of r2 go from -0.68 to - 0.85). In other words, the municipalities that have relatively high rental revenues tend to be those, which collect less local taxes; and inversely, the municipalities, which carry out relatively high levels of collection of lo-cal taxes are rather those which have low rental revenues.
COEFFICIENT OF CORRELATION (R2) BETWEEN THE PER CAPITA AMOUNTS OF LOCAL FEES AND TAXES COLLECTED BY THE 10 MUNICIPALITIES IN 2002 AND 2003 AND THE AMOUNTS OF THE RENTAL REVENUES CARRIED OUT BY THESE MUNICIPALITIES FOR THE YEARS 1995-2002
1995 1996 1997 1998 1999 2000 2002 2003
2002 -0,73 -0,83 -0,77 -0,85 -0,77 -0,74 0,09 -0,32
2003 -0,68 -0,81 -0,73 -0,81 -0,74 -0,76 -0,13 -0,21
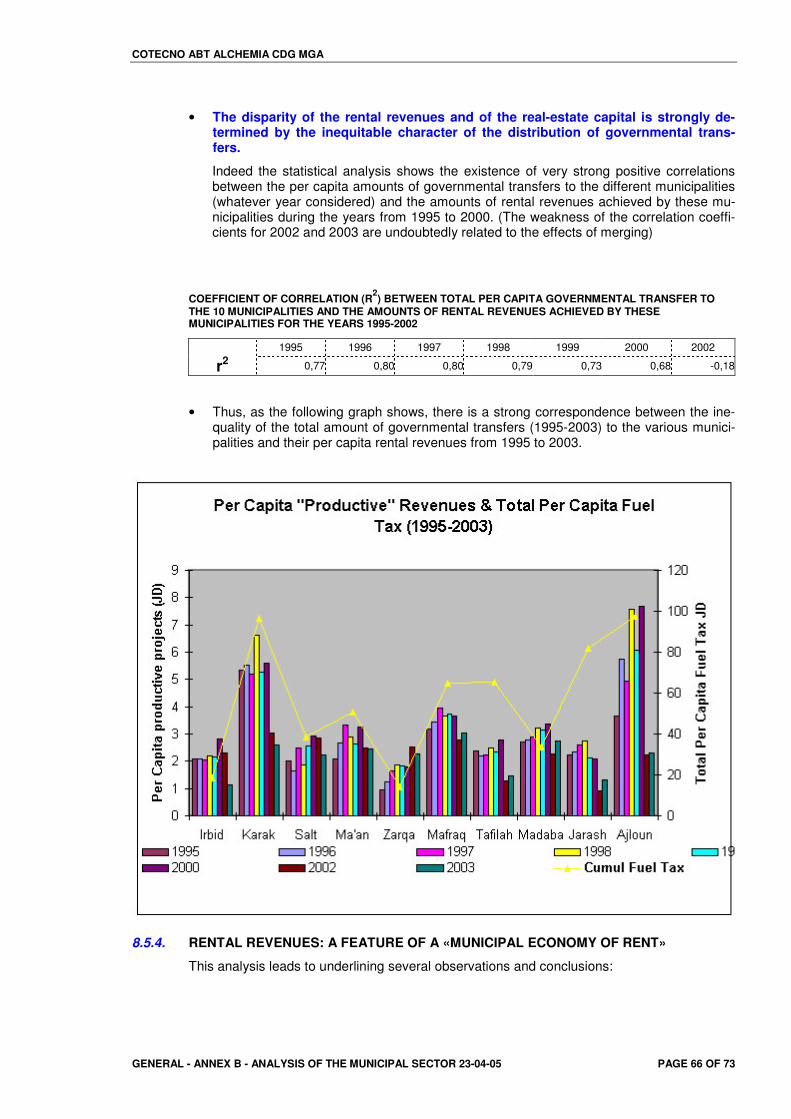
COTECNO ABT ALCHEMIA CDG MGA
GENERAL - ANNEX B - ANALYSIS OF THE MUNICIPAL SECTOR 23-04-05 PAGE 66 OF 73
• The disparity of the rental revenues and of the real-estate capital is strongly de-termined by the inequitable character of the distribution of governmental trans-fers.
Indeed the statistical analysis shows the existence of very strong positive correlations between the per capita amounts of governmental transfers to the different municipalities (whatever year considered) and the amounts of rental revenues achieved by these mu-nicipalities during the years from 1995 to 2000. (The weakness of the correlation coeffi-cients for 2002 and 2003 are undoubtedly related to the effects of merging)
COEFFICIENT OF CORRELATION (R2) BETWEEN TOTAL PER CAPITA GOVERNMENTAL TRANSFER TO THE 10 MUNICIPALITIES AND THE AMOUNTS OF RENTAL REVENUES ACHIEVED BY THESE MUNICIPALITIES FOR THE YEARS 1995-2002
1995 1996 1997 1998 1999 2000 2002
r2 0,77 0,80 0,80 0,79 0,73 0,68 -0,18
• Thus, as the following graph shows, there is a strong correspondence between the ine-quality of the total amount of governmental transfers (1995-2003) to the various munici-palities and their per capita rental revenues from 1995 to 2003.
8.5.4. RENTAL REVENUES: A FEATURE OF A «MUNICIPAL ECONOMY OF RENT»
This analysis leads to underlining several observations and conclusions:
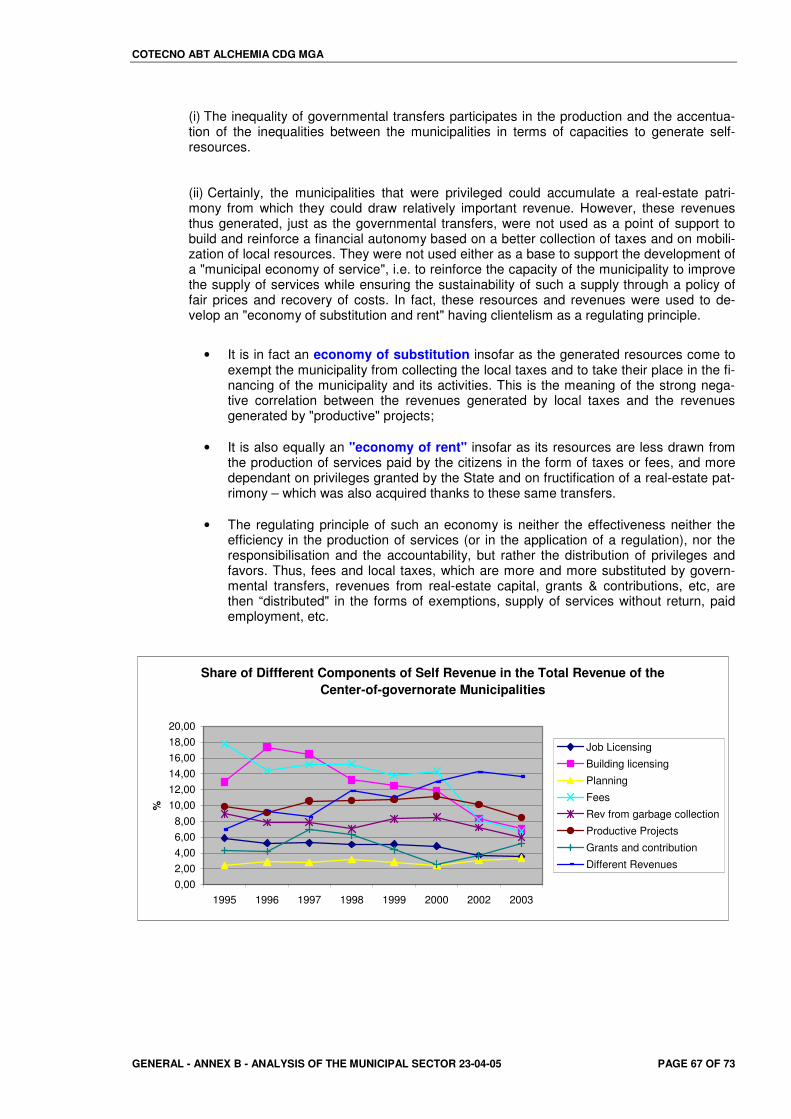
COTECNO ABT ALCHEMIA CDG MGA
GENERAL - ANNEX B - ANALYSIS OF THE MUNICIPAL SECTOR 23-04-05 PAGE 67 OF 73
(i) The inequality of governmental transfers participates in the production and the accentua-tion of the inequalities between the municipalities in terms of capacities to generate self-resources.
(ii) Certainly, the municipalities that were privileged could accumulate a real-estate patri-mony from which they could draw relatively important revenue. However, these revenues thus generated, just as the governmental transfers, were not used as a point of support to build and reinforce a financial autonomy based on a better collection of taxes and on mobili-zation of local resources. They were not used either as a base to support the development of a "municipal economy of service", i.e. to reinforce the capacity of the municipality to improve the supply of services while ensuring the sustainability of such a supply through a policy of fair prices and recovery of costs. In fact, these resources and revenues were used to de-velop an "economy of substitution and rent" having clientelism as a regulating principle.
• It is in fact an economy of substitution insofar as the generated resources come to
exempt the municipality from collecting the local taxes and to take their place in the fi-nancing of the municipality and its activities. This is the meaning of the strong nega-tive correlation between the revenues generated by local taxes and the revenues generated by "productive" projects;
• It is also equally an "economy of rent" insofar as its resources are less drawn from
the production of services paid by the citizens in the form of taxes or fees, and more dependant on privileges granted by the State and on fructification of a real-estate pat-rimony – which was also acquired thanks to these same transfers.
• The regulating principle of such an economy is neither the effectiveness neither the
efficiency in the production of services (or in the application of a regulation), nor the responsibilisation and the accountability, but rather the distribution of privileges and favors. Thus, fees and local taxes, which are more and more substituted by govern-mental transfers, revenues from real-estate capital, grants & contributions, etc, are then “distributed" in the forms of exemptions, supply of services without return, paid employment, etc.
Share of Diffferent Components of Self Revenue in the Total Revenue of the Center-of-governorate Municipalities
0,002,004,006,008,00
10,0012,0014,0016,0018,0020,00
1995 1996 1997 1998 1999 2000 2002 2003
%
Job Licensing
Building licensing
Planning
Fees
Rev from garbage collection
Productive Projects
Grants and contribution
Different Revenues
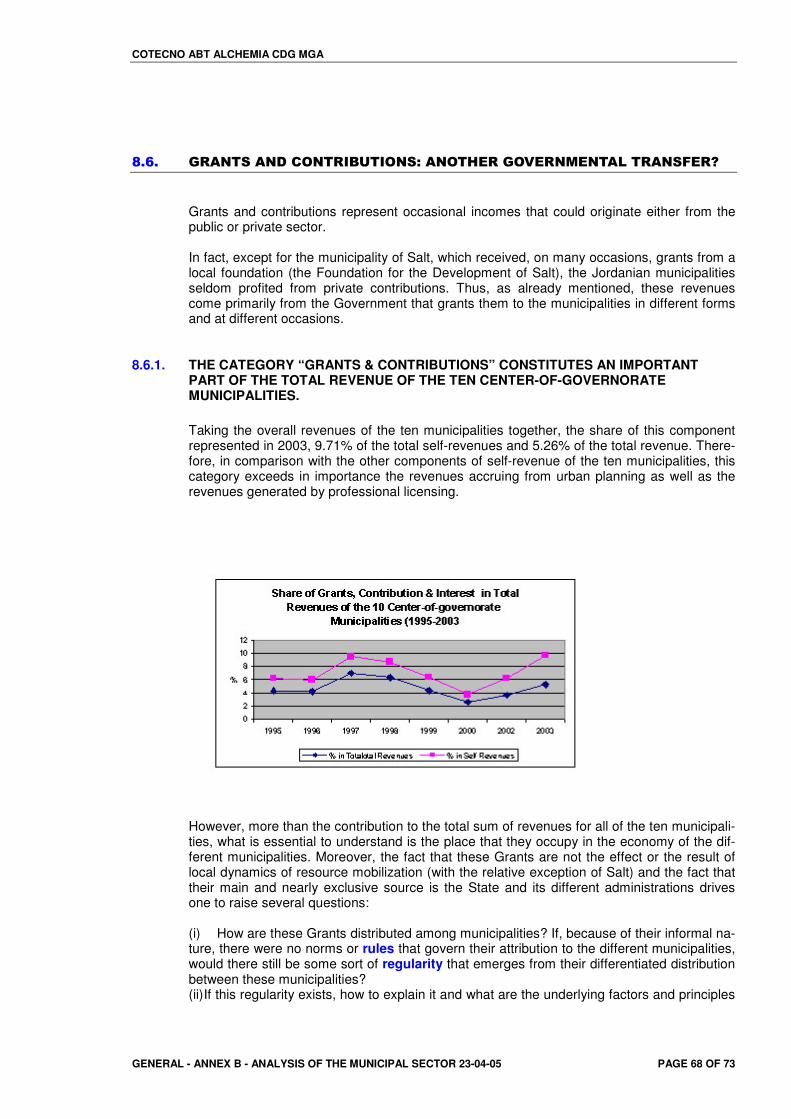
COTECNO ABT ALCHEMIA CDG MGA
GENERAL - ANNEX B - ANALYSIS OF THE MUNICIPAL SECTOR 23-04-05 PAGE 68 OF 73
?�=�� �"�#�$��#&�' #�")�0�) #$%��# ���"�� !�"#��#��(��"�#$.�"5�
Grants and contributions represent occasional incomes that could originate either from the public or private sector. In fact, except for the municipality of Salt, which received, on many occasions, grants from a local foundation (the Foundation for the Development of Salt), the Jordanian municipalities seldom profited from private contributions. Thus, as already mentioned, these revenues come primarily from the Government that grants them to the municipalities in different forms and at different occasions.
8.6.1. THE CATEGORY “GRANTS & CONTRIBUTIONS” CONSTITUTES AN IMPORTANT PART OF THE TOTAL REVENUE OF THE TEN CENTER-OF-GOVERNORATE MUNICIPALITIES. Taking the overall revenues of the ten municipalities together, the share of this component represented in 2003, 9.71% of the total self-revenues and 5.26% of the total revenue. There-fore, in comparison with the other components of self-revenue of the ten municipalities, this category exceeds in importance the revenues accruing from urban planning as well as the revenues generated by professional licensing.
However, more than the contribution to the total sum of revenues for all of the ten municipali-ties, what is essential to understand is the place that they occupy in the economy of the dif-ferent municipalities. Moreover, the fact that these Grants are not the effect or the result of local dynamics of resource mobilization (with the relative exception of Salt) and the fact that their main and nearly exclusive source is the State and its different administrations drives one to raise several questions: (i) How are these Grants distributed among municipalities? If, because of their informal na-ture, there were no norms or rules that govern their attribution to the different municipalities, would there still be some sort of regularity that emerges from their differentiated distribution between these municipalities? (ii) If this regularity exists, how to explain it and what are the underlying factors and principles
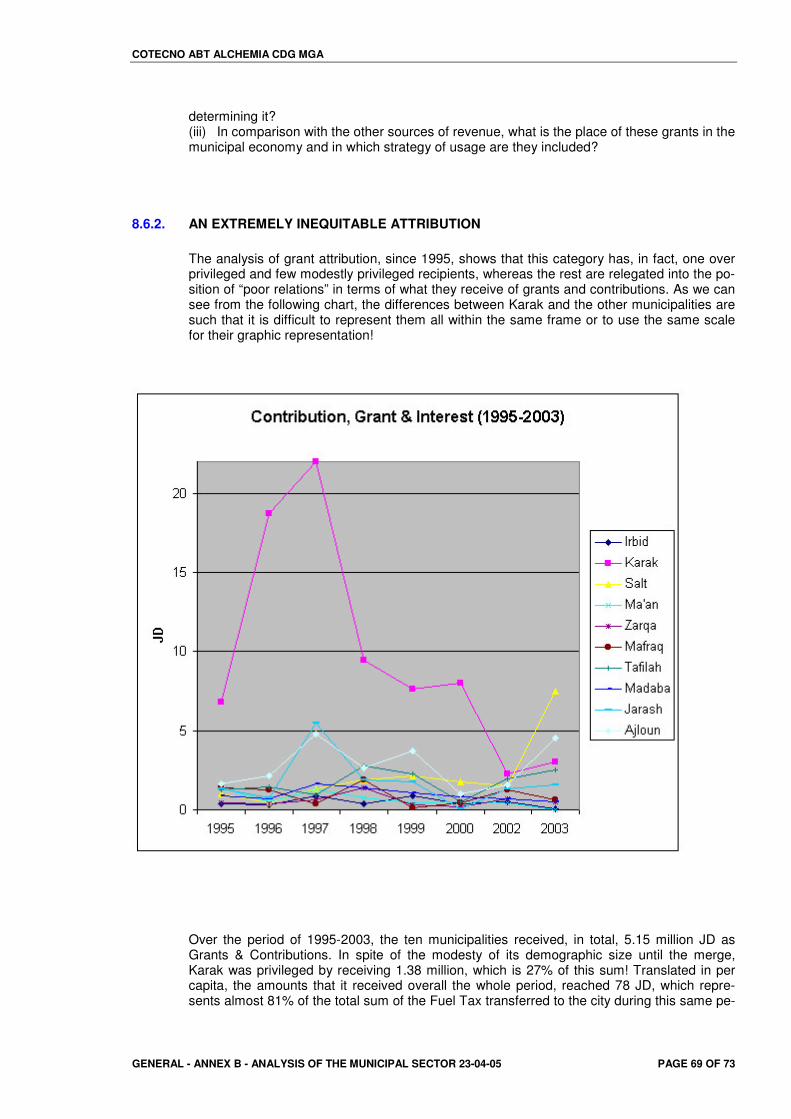
COTECNO ABT ALCHEMIA CDG MGA
GENERAL - ANNEX B - ANALYSIS OF THE MUNICIPAL SECTOR 23-04-05 PAGE 69 OF 73
determining it? (iii) In comparison with the other sources of revenue, what is the place of these grants in the municipal economy and in which strategy of usage are they included?
8.6.2. AN EXTREMELY INEQUITABLE ATTRIBUTION The analysis of grant attribution, since 1995, shows that this category has, in fact, one over privileged and few modestly privileged recipients, whereas the rest are relegated into the po-sition of “poor relations” in terms of what they receive of grants and contributions. As we can see from the following chart, the differences between Karak and the other municipalities are such that it is difficult to represent them all within the same frame or to use the same scale for their graphic representation!
Over the period of 1995-2003, the ten municipalities received, in total, 5.15 million JD as Grants & Contributions. In spite of the modesty of its demographic size until the merge, Karak was privileged by receiving 1.38 million, which is 27% of this sum! Translated in per capita, the amounts that it received overall the whole period, reached 78 JD, which repre-sents almost 81% of the total sum of the Fuel Tax transferred to the city during this same pe-
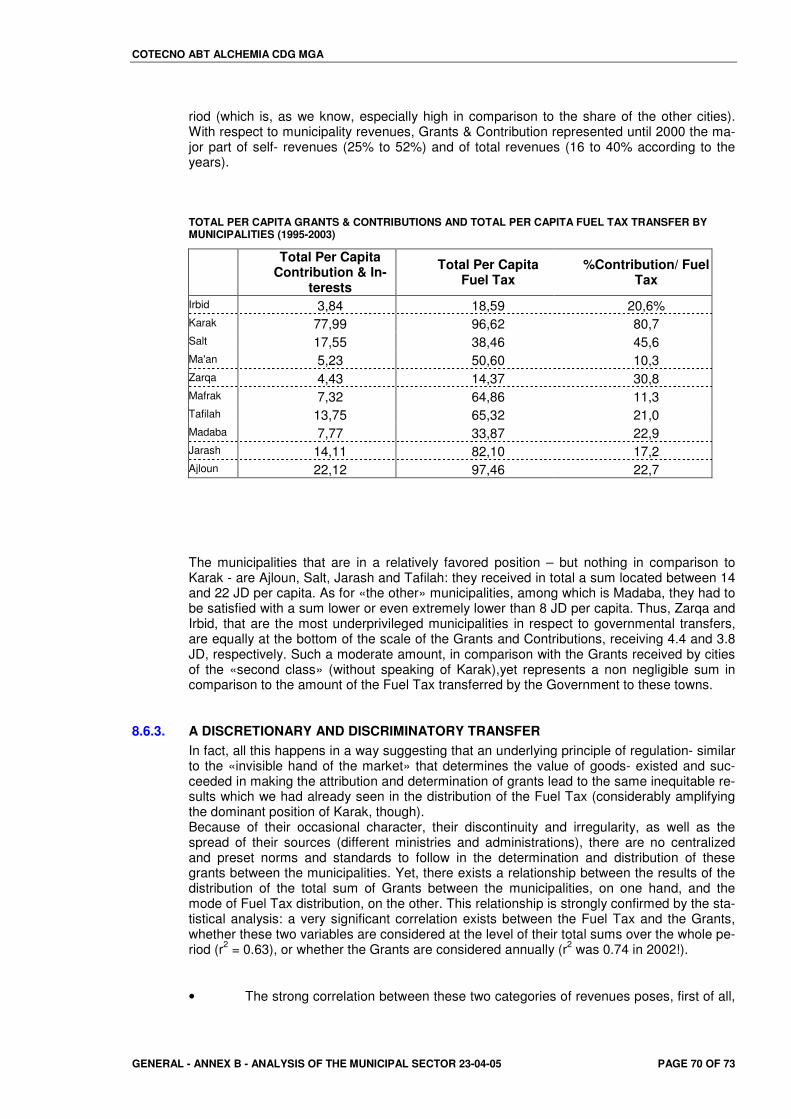
COTECNO ABT ALCHEMIA CDG MGA
GENERAL - ANNEX B - ANALYSIS OF THE MUNICIPAL SECTOR 23-04-05 PAGE 70 OF 73
riod (which is, as we know, especially high in comparison to the share of the other cities). With respect to municipality revenues, Grants & Contribution represented until 2000 the ma-jor part of self- revenues (25% to 52%) and of total revenues (16 to 40% according to the years).
TOTAL PER CAPITA GRANTS & CONTRIBUTIONS AND TOTAL PER CAPITA FUEL TAX TRANSFER BY MUNICIPALITIES (1995-2003)
Total Per Capita Contribution & In-
terests
Total Per Capita Fuel Tax
%Contribution/ Fuel Tax
Irbid 3,84 18,59 20,6% Karak 77,99 96,62 80,7 Salt 17,55 38,46 45,6 Ma'an 5,23 50,60 10,3 Zarqa 4,43 14,37 30,8 Mafrak 7,32 64,86 11,3 Tafilah 13,75 65,32 21,0 Madaba 7,77 33,87 22,9 Jarash 14,11 82,10 17,2 Ajloun 22,12 97,46 22,7 The municipalities that are in a relatively favored position – but nothing in comparison to Karak - are Ajloun, Salt, Jarash and Tafilah: they received in total a sum located between 14 and 22 JD per capita. As for «the other» municipalities, among which is Madaba, they had to be satisfied with a sum lower or even extremely lower than 8 JD per capita. Thus, Zarqa and Irbid, that are the most underprivileged municipalities in respect to governmental transfers, are equally at the bottom of the scale of the Grants and Contributions, receiving 4.4 and 3.8 JD, respectively. Such a moderate amount, in comparison with the Grants received by cities of the «second class» (without speaking of Karak),yet represents a non negligible sum in comparison to the amount of the Fuel Tax transferred by the Government to these towns.
8.6.3. A DISCRETIONARY AND DISCRIMINATORY TRANSFER In fact, all this happens in a way suggesting that an underlying principle of regulation- similar to the «invisible hand of the market» that determines the value of goods- existed and suc-ceeded in making the attribution and determination of grants lead to the same inequitable re-sults which we had already seen in the distribution of the Fuel Tax (considerably amplifying the dominant position of Karak, though). Because of their occasional character, their discontinuity and irregularity, as well as the spread of their sources (different ministries and administrations), there are no centralized and preset norms and standards to follow in the determination and distribution of these grants between the municipalities. Yet, there exists a relationship between the results of the distribution of the total sum of Grants between the municipalities, on one hand, and the mode of Fuel Tax distribution, on the other. This relationship is strongly confirmed by the sta-tistical analysis: a very significant correlation exists between the Fuel Tax and the Grants, whether these two variables are considered at the level of their total sums over the whole pe-riod (r2 = 0.63), or whether the Grants are considered annually (r2 was 0.74 in 2002!). • The strong correlation between these two categories of revenues poses, first of all,
COTECNO ABT ALCHEMIA CDG MGA
GENERAL - ANNEX B - ANALYSIS OF THE MUNICIPAL SECTOR 23-04-05 PAGE 71 OF 73
the problem of the very nature of the category of Grants & Contributions. Because, beyond the qualitative information regarding some cities, this correlation clearly shows that, all in all, this category is a component of governmental transfer, even though the transfer takes place in an «informal way», and even though its distribution is not at all the result of a centralized decision, but rather the result of various initiatives and requests dispersed in time and in the “governmental and administrative space;” • The issue of the pertinence of this component to the governmental transfer cate-gory is clearly not merely an issue of nomenclature. Shouldn’t the confirmation of this perti-nence drive us to question the way in which it is taken into account in the municipal financial analysis (including the analysis that has been made in the previous chapters) and, therefore, drive us to include it as a component of governmental transfer in the analysis of municipal revenues? If this is done, then the modifications that would occur in the results of analysis become very important, as this category represents, on the whole, the equivalent of 31% of Fuel Tax and constitutes, today, nearly 6% of the municipal revenues. Therefore, the inequi-table and random feature of governmental transfers, the dependence of municipalities and the weakening of their financial autonomy, the weakness and decrease of their self-resources, the fiscal imbalance and its increase, etc., would be even more pronounced than what the analysis showed in the previous chapters. • However, the ways by which the Grants are obtained and distributed raise a prob-lem that goes well beyond the quantitative aspects of the weakening of the self-resources of municipalities and the worsening of their fiscal imbalance. This problem is related to the na-ture of the relationship between the municipality and the State and to the effects of such a relationship on the level of municipal management. Indeed, the strong inequality in the distri-bution of Grants does not happen by chance, and the absence of rules or decisions which determine their attribution does not imply the absence of an implicit and underlying principle that governs the practices and that produces the regularity of the inequitable mode of distri-bution we have observed. This principle, as confirmed by the qualitative information obtained from several municipalities, is in fact «institutional clientelism» that is based on an unequal distribution of «social and institutional capital» of mayors and cities, that is to say of their networks of influence and support in the spheres of the administration and the central au-thority. It is this clientelism that constitutes «the invisible hand» that regulates the «weight» and the «value» of the municipalities in the market of Grants & Attributions. The «efficiency» of this regulating principle goes beyond the distribution of grants, and sheds light, from a dif-ferent angle, on the question of the distribution of all governmental transfers, which, as we saw, were not based on a formal and explicit rule. Here as well, as confirmed by testimo-nies in several municipalities, it is this very institutional clientelism that constitutes the regu-lating principle of the unequal endowments of municipalities. The consequences and effects on the local municipal management of this free-hand institutional clientelism and haggling are deep and multiple. They could be summed up bye saying that they encourage and rein-force the setting up of what we called a municipal economy «of rent and substitution». In fact, local and institutional clientelism reinforce each other dragging along the way the mu-nicipalities into a vicious circle of loss of effectiveness and efficiency of the municipal de-partments and into the marginalization of the «service economy» which is based on the pro-duction of quality services at better costs. • The most salient manifestation and the proof of the “triumph” of the “economy of rent” over the “economy of service” is not only the drop but also the marginalization of the revenue components related to the provision of service, the collection of taxes and fees, and the application of regulations in the municipal economy. This marginalization, as shows the following chart and tables, is common to almost all municipalities, no matter what their level of revenue is. In this context, the category of self revenues loses a great part of its signifi-cance and becomes of little pertinence for indicating the level of implication of the municipal-ity in the local provision of services. This is not only because it includes a component which is in fact a component of governmental transfer but also because of the accrued importance of revenue categories that are in fact revenues of “rent”. This is the case of the “productive revenues”, as we have seen, and of the category “other revenues” that we have not ad-
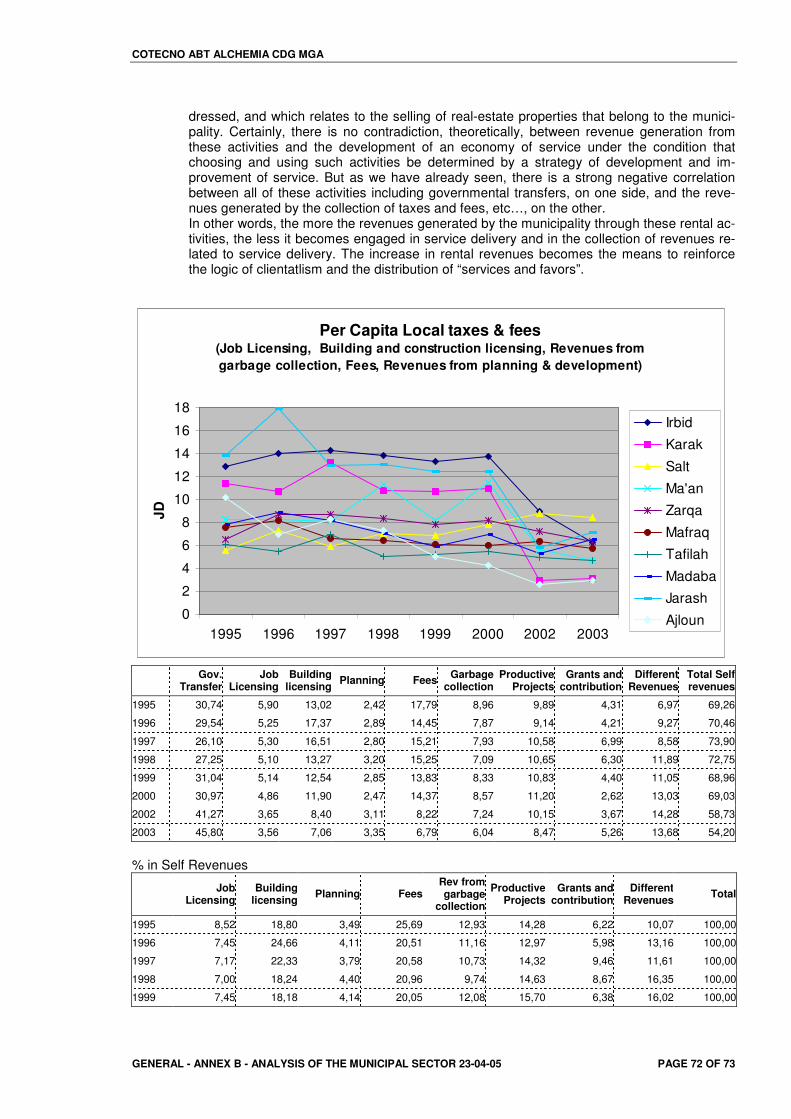
COTECNO ABT ALCHEMIA CDG MGA
GENERAL - ANNEX B - ANALYSIS OF THE MUNICIPAL SECTOR 23-04-05 PAGE 72 OF 73
dressed, and which relates to the selling of real-estate properties that belong to the munici-pality. Certainly, there is no contradiction, theoretically, between revenue generation from these activities and the development of an economy of service under the condition that choosing and using such activities be determined by a strategy of development and im-provement of service. But as we have already seen, there is a strong negative correlation between all of these activities including governmental transfers, on one side, and the reve-nues generated by the collection of taxes and fees, etc…, on the other. In other words, the more the revenues generated by the municipality through these rental ac-tivities, the less it becomes engaged in service delivery and in the collection of revenues re-lated to service delivery. The increase in rental revenues becomes the means to reinforce the logic of clientatlism and the distribution of “services and favors”.
Per Capita Local taxes & fees(Job Licensing, Building and construction licensing, Revenues from garbage collection, Fees, Revenues from planning & development)
0
2
4
6
8
10
12
14
16
18
1995 1996 1997 1998 1999 2000 2002 2003
JD
Irbid
Karak
Salt
Ma'an
Zarqa
Mafraq
Tafilah
Madaba
Jarash
Ajloun
Gov. Transfer
Job Licensing
Building licensing Planning Fees Garbage
collection Productive
ProjectsGrants and
contributionDifferent
RevenuesTotal Self revenues
1995 30,74 5,90 13,02 2,42 17,79 8,96 9,89 4,31 6,97 69,26
1996 29,54 5,25 17,37 2,89 14,45 7,87 9,14 4,21 9,27 70,46
1997 26,10 5,30 16,51 2,80 15,21 7,93 10,58 6,99 8,58 73,90
1998 27,25 5,10 13,27 3,20 15,25 7,09 10,65 6,30 11,89 72,75
1999 31,04 5,14 12,54 2,85 13,83 8,33 10,83 4,40 11,05 68,96
2000 30,97 4,86 11,90 2,47 14,37 8,57 11,20 2,62 13,03 69,03
2002 41,27 3,65 8,40 3,11 8,22 7,24 10,15 3,67 14,28 58,73
2003 45,80 3,56 7,06 3,35 6,79 6,04 8,47 5,26 13,68 54,20
% in Self Revenues
Job Licensing
Building licensing Planning Fees
Rev from garbage
collection
Productive Projects
Grants and contribution
Different Revenues Total
1995 8,52 18,80 3,49 25,69 12,93 14,28 6,22 10,07 100,00
1996 7,45 24,66 4,11 20,51 11,16 12,97 5,98 13,16 100,00
1997 7,17 22,33 3,79 20,58 10,73 14,32 9,46 11,61 100,00
1998 7,00 18,24 4,40 20,96 9,74 14,63 8,67 16,35 100,00
1999 7,45 18,18 4,14 20,05 12,08 15,70 6,38 16,02 100,00
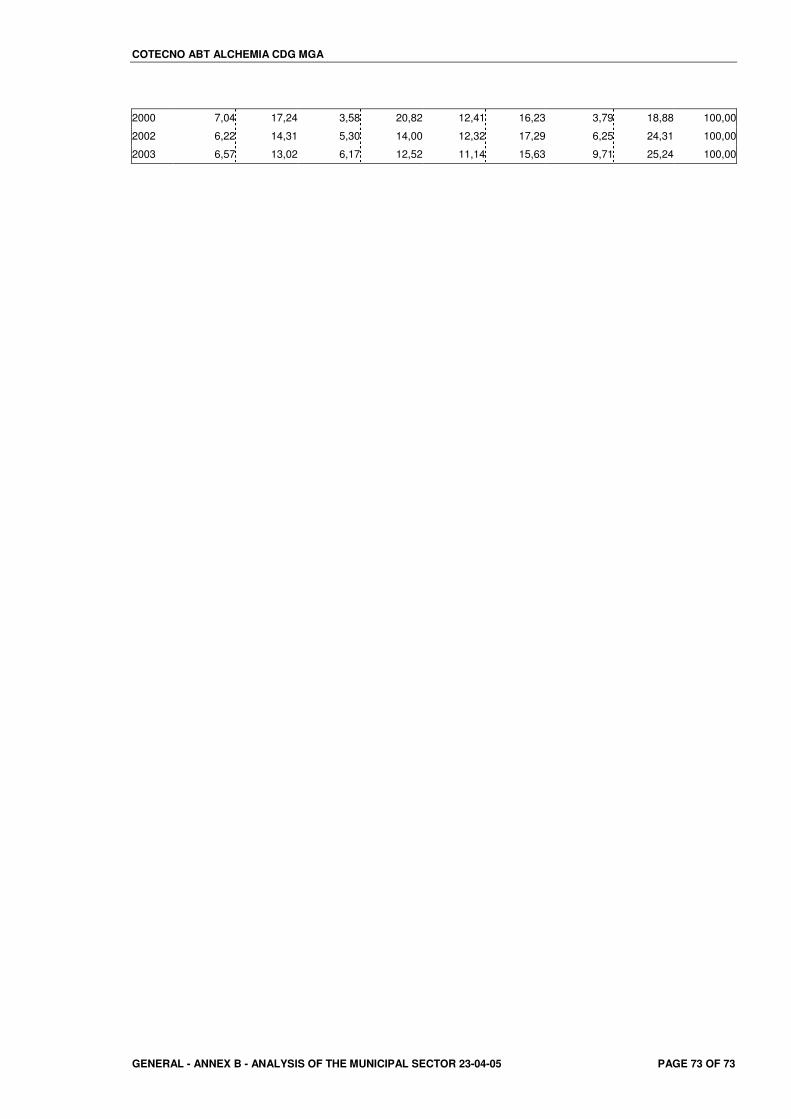
COTECNO ABT ALCHEMIA CDG MGA
GENERAL - ANNEX B - ANALYSIS OF THE MUNICIPAL SECTOR 23-04-05 PAGE 73 OF 73
2000 7,04 17,24 3,58 20,82 12,41 16,23 3,79 18,88 100,00
2002 6,22 14,31 5,30 14,00 12,32 17,29 6,25 24,31 100,00
2003 6,57 13,02 6,17 12,52 11,14 15,63 9,71 25,24 100,00