this document contains forward-looking statements
TRANSCRIPT
1

2
Disclaimer
This document contains forward-looking statements, specifically in the sections entitled "Events after the reporting
period" and "Business outlook", that relate to future events and the operating, economic and financial results of Prysmian
Group. By their nature, forward-looking statements involve risk and uncertainty because they depend on the occurrence
of future events and circumstances. Actual results may differ materially from those reflected in forward-looking
statements due to multiple factors.
PRYSMIAN GROUP | CONTENTS
3
Directors’ Report
Directors and auditors .................................................................................................... 5
Significant events during the period ................................................................................. 7
Consolidated financial highlights .................................................................................... 11
Group performance and results ..................................................................................... 12
Review of Projects operating segment ............................................................................ 15
Review of Energy operating segment ............................................................................. 18
Review of Telecom operating segment ........................................................................... 25
Results by geographical area ........................................................................................ 28
Group statement of financial position ............................................................................. 30
Alternative performance indicators ................................................................................ 35
Business outlook ......................................................................................................... 40
Foreseeable risks in 2021 ............................................................................................. 42
Related party transactions……………………………………………………………………………………………………………59
Consolidated Financial Statements and Explanatory Notes
Consolidated statement of financial position .................................................................... 60
Consolidated income statement ..................................................................................... 62
Other comprehensive income ........................................................................................ 62
Consolidated statement of changes in equity................................................................... 63
Consolidated statement of cash flows ............................................................................. 64
Explanatory notes ........................................................................................................ 65
Scope of consolidation – Appendix A ............................................................................. 116

PRYSMIAN GROUP | DIRECTORS' REPORT
4
Director’s Report
PRYSMIAN GROUP | DIRECTORS' REPORT
5
DIRECTORS AND AUDITORS
Board of Directors (4) Chairman Claudio De Conto (*) (2)
Chief Executive Officer Valerio Battista Directors Francesco Gori (**)(1)
Maria Letizia Mariani (**)(3) Jaska Marianne de Bakker (**)(1) Massimo Battaini Tarak Mehta (**)(1) Pier Francesco Facchini Ines Kolmsee (**)(3) Annalisa Stupenengo (**)(2) Paolo Amato (**)(2) Mimi Kung (**)(3)
Board of Statutory Auditors (5) Chairman Pellegrino Libroia Standing Statutory Auditors Laura Gualtieri Paolo Francesco Lazzati
Alternative Statutory Auditors Michele Milano Claudia Mezzabotta
Independent Auditors (6) EY S.p.A.
(*) Independent director as per Italian Legislative Decree 58/1998
(**) Independent director as per Italian Legislative Decree 58/1998 and Italy's Corporate Governance Code issued by
Borsa Italiana S.p.A.
(1) Members of the Control and Risks Committee
(2) Members of the Remuneration and Nominations Committee
(3) Members of the Sustainability Committee
(4)Appointed by the Shareholders' Meeting on 28 April 2021
(5) Appointed by the Shareholders' Meeting on 5 June 2019
(6)Appointed by the Shareholders' Meeting on 16 April 2015

PRYSMIAN GROUP | DIRECTORS' REPORT
6
Preface
Further to Legislative Decree 25/2016, which came into force on 18 March 2016 and has
eliminated the requirement for quarterly reporting, Prysmian Group has prepared the present
Quarterly Financial Report at 31 March 2021 on a voluntary basis and in continuity with its past
reporting format.
The present Quarterly Financial Report is not subject to limited review by the auditors.
PRYSMIAN GROUP | DIRECTORS' REPORT
7
SIGNIFICANT EVENTS DURING THE PERIOD
Prysmian Group completes the acquisition of EHC Global
On 8 January 2021, the Group announced it had completed the acquisition of EHC Global, a
leading manufacturer of strategic components and integrated solutions for the vertical
transportation industry. Established in 1977, EHC Global is a manufacturer and supplier of
escalator handrails, rollers, elevator belts, strategic components and integrated solutions for the
vertical transportation industry. EHC Global also offers a comprehensive range of technical and
installation services for escalators and moving walkways.
The acquisition of EHC Global is in line with Prysmian Group's strategy to develop and strengthen
its value-added businesses. EHC Global is a complementary add-on to the Draka Elevator
business, broadening its product portfolio to include a wide range of escalator products and
services.
Following the acquisition, the Group has consolidated EHC Global with effect from 1 January
2021 as more fully explained in the section on "Business Combinations" within the Explanatory
Notes to which reference should be made.
Placement of a Euro 750 million equity-linked bond
On 26 January 2021, the Group announced the successful placement (the "Placement") of an
equity-linked bond (the "Bonds") for an amount of Euro 750 million.
The Bonds, with a 5-year maturity from 2 February 2021 and minimum denomination of Euro
100,000 each, are zero coupon. The issue price is Euro 102.50, representing a yield to maturity
of minus 0.49% per annum. The initial price for the conversion of the Bonds into the Company's
ordinary shares is Euro 40.2355, representing a 47.50% premium on the weighted average price
by volume of Prysmian ordinary shares on the Milan Stock Exchange between the start and end
of the book-building process.
The Shareholders' Meeting held on 28 April 2021 authorised the convertibility of the equity-
linked bond and approved the proposal for a share capital increase pursuant to art. 2420-bis,
par. 2, of the Italian Civil Code, in one or more tranches, with the exclusion of pre-emptive rights
under art. 2441, par. 5, of the Italian Civil Code, serving the conversion of the convertible bond
for a maximum nominal amount of Euro 1,864,025.50 through the issue of up to 18,640,255
ordinary shares with nominal value Euro 0.10 each.
The Group has the option to redeem all - but not only some - of the Bonds at their principal
amount from 12 February 2024, should the value of the new and/or existing ordinary shares
exceed 130% of the conversion price for a specified period of time.
PRYSMIAN GROUP | DIRECTORS' REPORT
8
Repurchase of the 2017 Bonds
On 26 January 2021, the Group announced a partial repurchase of the Company's outstanding
Euro 500 million zero-coupon equity-linked bonds due in 2022 and issued on 17 January 2017
(the "2017 Bonds").
The total principal of the 2017 Bonds which the Company agreed to repurchase on 2 February
was equal to Euro 250,000,000 representing 50% of the 2017 Bonds initially issued, at a
repurchase price ("Repurchase Price") of Euro 104,250 for each 2017 Bond of face value Euro
100,000.
CDP Loan
On 28 January 2021, a new loan for Euro 75 million over 4.5 years was agreed with Cassa
Depositi e Prestiti S.p.A. (CDP), for the purpose of financing part of the Group's expenditure to
purchase the "Leonardo Da Vinci" cable-laying vessel.
This loan was drawn down in its entirety on 9 February 2021, with a bullet repayment envisaged
at maturity on 28 July 2025.
Interest Rate Swaps (IRS) to hedge the CDP Loan
On 4 February 2021, Prysmian S.p.A. negotiated two IRSs, effective from 9 February 2021, to
hedge the new Euro 75 million loan.
New organisational structure
On 3 February 2021, the Group announced that it had adopted a new organisational structure,
in line with international best practices, with the aim of reinforcing its focus on the strategic
opportunities offered by the global transition to low-carbon energy and digitalisation-based
economies.
The introduction of this new structure marks the successful completion of the integration with
General Cable, which has significantly enlarged the Group and broadened its geographical
diversification.
Under the leadership of the CEO, the new organisation will pivot around the following key roles:
- Chief Operating Officer
- Business Divisions
- Group Functions
Under the new organisation, the CEO will further intensify the Group's focus on its organic and
non-organic growth strategy, as well as on accelerating major innovation projects. The two
global megatrends of transition to low-carbon energy and development of telecommunications
networks to support digitalisation are among the major growth opportunities on which the Group
will be focusing to ensure sustainable growth. In order to leverage the Group's wide geographic
presence and customer proximity, while delivering business synergies at the same time, the new
PRYSMIAN GROUP | DIRECTORS' REPORT
9
role of Chief Operating Officer (COO) will oversee the Group's operational strategy and
performance and results of the Regions, in conjunction with the Group's three Business Divisions.
The Business Divisions, which report directly to the CEO, are focused on the strategic
development of their different segments, with P&L responsibility for the global Business Units,
in conjunction with the COO. In addition, they drive key decisions on product technology,
production allocation and the most important projects. The Group Functions, reporting directly
to the CEO, guide the governance and harmonisation of the main corporate processes, providing
operational support to all Group entities. With the aim of strengthening the focus on ESG
objectives, a Group Chief Sustainability Officer and a Chief Innovation Officer have been
appointed.
Construction of new fibre-optic Telecom link in Brazil
On 24 February 2021, the Group announced that it will supply 770 km of MINISUB submarine
optical fibre telecom cables to link the city of Macapá to Santarém and Alenquer, located in the
north of the Amazon region, as part of the Norte Conectado project awarded by RNP, Rede
Nacional de Ensino and Pesquisa, a Brazilian internet provider. The MINISUB solution is one of
the most widely used technologies in the world. The cables will be produced at Prysmian's state-
of-the-art manufacturing facility in Nordenham (Germany) and will be delivered in the second
half of 2021.
Finalisation of contract worth over Euro 200 million with RWE for Sofia offshore wind
farm
On 29 March 2021, the Group announced the finalisation of a contract with RWE Renewables,
one of the world's largest offshore wind farm developers, for the construction of a turnkey high
voltage submarine and onshore cable system worth over Euro 200 million for the 1.4 gigawatt
(GW) Sofia offshore wind farm. The Group had already announced a preferred bidder agreement
in November 2020.
Prysmian Group will be responsible for the design, supply, installation and commissioning of an
HVDC symmetrical single-core cable system that will connect the wind farm's offshore substation
to the onshore converter station in Teesside. The project requires over 440 km of ±320 kV XLPE-
insulated submarine cables and 15 km of ±320 kV P-Laser-insulated underground cables.
Offshore installation operations will be carried out using the Leonardo da Vinci, Prysmian's new
state-of-the-art cable-laying vessel, the most high performance ship on the market offering
enhanced versatility in project implementation. Project commissioning is expected towards the
end of 2026.
PRYSMIAN GROUP | DIRECTORS' REPORT
10
Other significant events
Ravin Cables Limited
In January 2010, Prysmian Group acquired a 51% interest in the Indian company Ravin Cables
Limited (the "Company"), with the remaining 49% held by other shareholders directly or
indirectly associated with the Karia family (the "Local Shareholders"). Under the agreements
signed with the Local Shareholders, after a limited transition period, management of the
Company would be transferred to a Chief Executive Officer appointed by Prysmian. However,
this failed to occur and, in breach of the agreements, the Company's management remained in
the hands of the Local Shareholders and their representatives. Consequently, having now lost
control, Prysmian Group ceased to consolidate the Company and its subsidiary Power Plus Cable
Co. LLC. with effect from 1 April 2012. In February 2012, Prysmian was thus forced to initiate
arbitration proceedings before the London Court of International Arbitration (LCIA), requesting
that the Local Shareholders be declared in breach of contract and ordered to sell the shares
representing 49% of the Company's share capital to Prysmian. In a ruling handed down in April
2017, the LCIA upheld Prysmian's claims and ordered the Local Shareholders to sell the shares
representing 49% of the Company's share capital to Prysmian. However, the Local Shareholders
did not voluntarily enforce the arbitration award and so Prysmian had to initiate proceedings in
the Indian courts in order to have the arbitration award recognised in India. Having gone through
two levels of the court system, these proceedings were finally concluded on 13 February 2020
with the pronouncement of a ruling by the Indian Supreme Court under which the latter
definitively declared the arbitration award enforceable in India. In view of the continuing failure
of the Local Shareholders to comply voluntarily, Prysmian has requested the Mumbai court to
enforce the arbitration award so as to purchase the shares representing 49% of the Company's
share capital as soon as possible. This case is currently still pending, slowed down by the ongoing
Covid-19 emergency that has also affected India, and so control of the company is considered
to have not yet been acquired.
PRYSMIAN GROUP | DIRECTORS' REPORT
11
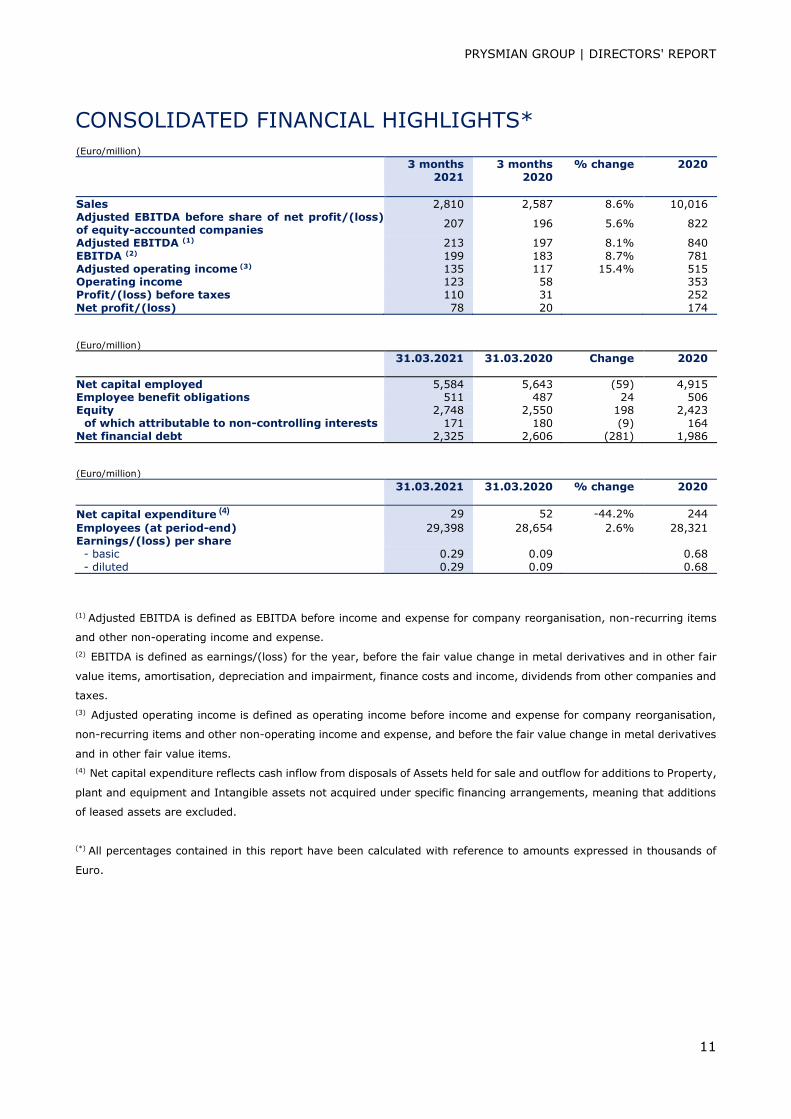
CONSOLIDATED FINANCIAL HIGHLIGHTS*
(Euro/million)
3 months 2021
3 months 2020
% change 2020
Sales 2,810 2,587 8.6% 10,016 Adjusted EBITDA before share of net profit/(loss) of equity-accounted companies
207 196 5.6% 822
Adjusted EBITDA (1) 213 197 8.1% 840
EBITDA (2) 199 183 8.7% 781 Adjusted operating income (3) 135 117 15.4% 515 Operating income 123 58 353 Profit/(loss) before taxes 110 31 252
Net profit/(loss) 78 20 174
(Euro/million)
31.03.2021 31.03.2020 Change 2020
Net capital employed 5,584 5,643 (59) 4,915 Employee benefit obligations 511 487 24 506 Equity 2,748 2,550 198 2,423 of which attributable to non-controlling interests 171 180 (9) 164 Net financial debt 2,325 2,606 (281) 1,986
(Euro/million)
31.03.2021 31.03.2020 % change 2020
Net capital expenditure (4) 29 52 -44.2% 244
Employees (at period-end) 29,398 28,654 2.6% 28,321 Earnings/(loss) per share
- basic 0.29 0.09 0.68
- diluted 0.29 0.09 0.68
(1) Adjusted EBITDA is defined as EBITDA before income and expense for company reorganisation, non-recurring items
and other non-operating income and expense.
(2) EBITDA is defined as earnings/(loss) for the year, before the fair value change in metal derivatives and in other fair
value items, amortisation, depreciation and impairment, finance costs and income, dividends from other companies and
taxes.
(3) Adjusted operating income is defined as operating income before income and expense for company reorganisation,
non-recurring items and other non-operating income and expense, and before the fair value change in metal derivatives
and in other fair value items.
(4) Net capital expenditure reflects cash inflow from disposals of Assets held for sale and outflow for additions to Property,
plant and equipment and Intangible assets not acquired under specific financing arrangements, meaning that additions
of leased assets are excluded.
(*) All percentages contained in this report have been calculated with reference to amounts expressed in thousands of
Euro.
PRYSMIAN GROUP | DIRECTORS' REPORT
12
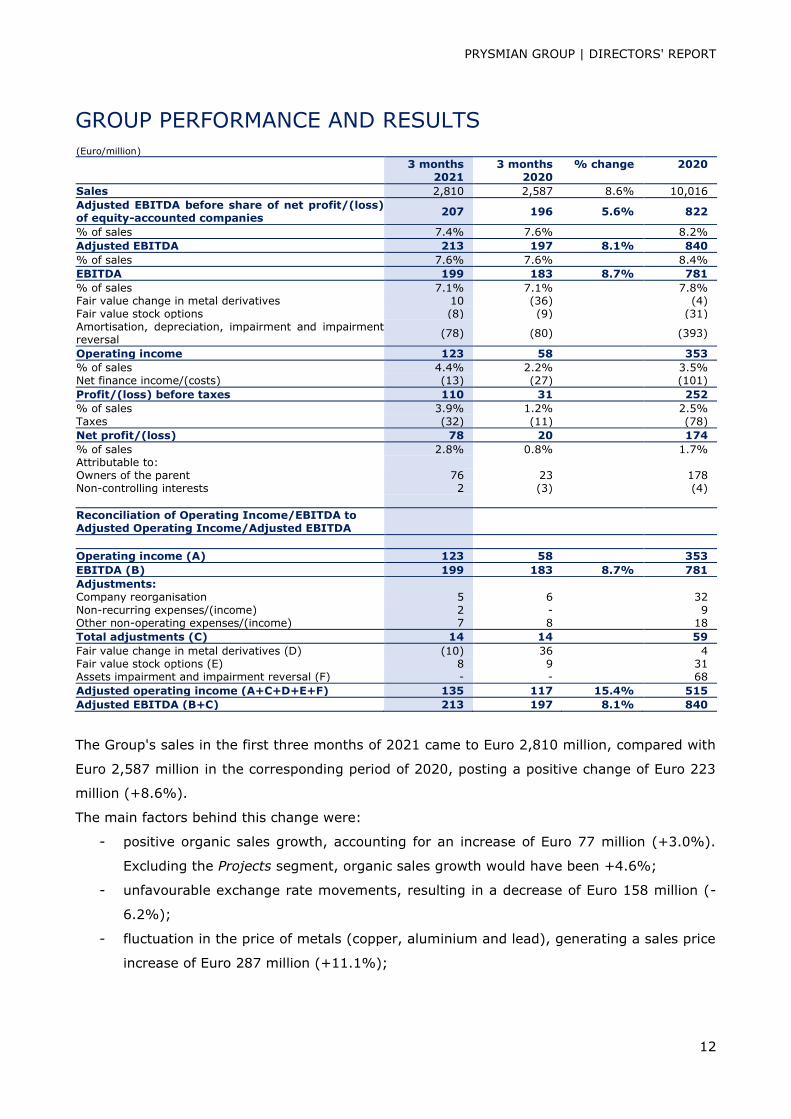
GROUP PERFORMANCE AND RESULTS
(Euro/million)
3 months 2021
3 months 2020
% change 2020
Sales 2,810 2,587 8.6% 10,016
Adjusted EBITDA before share of net profit/(loss) of equity-accounted companies
207 196 5.6% 822
% of sales 7.4% 7.6% 8.2%
Adjusted EBITDA 213 197 8.1% 840
% of sales 7.6% 7.6% 8.4%
EBITDA 199 183 8.7% 781
% of sales 7.1% 7.1% 7.8% Fair value change in metal derivatives 10 (36) (4) Fair value stock options (8) (9) (31) Amortisation, depreciation, impairment and impairment reversal
(78) (80) (393)
Operating income 123 58 353
% of sales 4.4% 2.2% 3.5% Net finance income/(costs) (13) (27) (101)
Profit/(loss) before taxes 110 31 252
% of sales 3.9% 1.2% 2.5%
Taxes (32) (11) (78)
Net profit/(loss) 78 20 174
% of sales 2.8% 0.8% 1.7% Attributable to:
Owners of the parent 76 23 178 Non-controlling interests 2 (3) (4)
Reconciliation of Operating Income/EBITDA to Adjusted Operating Income/Adjusted EBITDA
Operating income (A) 123 58 353
EBITDA (B) 199 183 8.7% 781
Adjustments:
Company reorganisation 5 6 32
Non-recurring expenses/(income) 2 - 9 Other non-operating expenses/(income) 7 8 18
Total adjustments (C) 14 14 59
Fair value change in metal derivatives (D) (10) 36 4 Fair value stock options (E) 8 9 31 Assets impairment and impairment reversal (F) - - 68
Adjusted operating income (A+C+D+E+F) 135 117 15.4% 515
Adjusted EBITDA (B+C) 213 197 8.1% 840
The Group's sales in the first three months of 2021 came to Euro 2,810 million, compared with
Euro 2,587 million in the corresponding period of 2020, posting a positive change of Euro 223
million (+8.6%).
The main factors behind this change were:
- positive organic sales growth, accounting for an increase of Euro 77 million (+3.0%).
Excluding the Projects segment, organic sales growth would have been +4.6%;
- unfavourable exchange rate movements, resulting in a decrease of Euro 158 million (-
6.2%);
- fluctuation in the price of metals (copper, aluminium and lead), generating a sales price
increase of Euro 287 million (+11.1%);
PRYSMIAN GROUP | DIRECTORS' REPORT
13
- increase of Euro 17 million (+0.7%) due to a change in the scope of consolidation after
acquiring control of EHC Global, as already discussed in the earlier section "Significant
events in the period".
Organic sales growth by the three operating segments was as follows:
Projects -7.9%;
Energy +3.4%;
Telecom +11.4%.
The year 2021 has started very well for the Group, with organic growth of +3% and +4.6% if
the Projects segment is excluded. The Energy segment is recovering strongly, mainly thanks to
the T&I, O&M and Renewables businesses. The Telecom segment (especially the optical cables
business) has reported a recovery in sales volumes.
The organic change described above is due to the following main factors:
- a significant increase by the Telecom segment of +11.4%;
- an increase by the Energy & Infrastructure business of +3.5%;
- an increase by the Industrial & Network Components business of +3.5%.
The Group's Adjusted EBITDA (before net expenses for company reorganisation, net non-
recurring expenses and other net non-operating expenses) came to Euro 213 million in the first
three months of 2021, up Euro 16 million (+8.1%) on the corresponding 2020 figure of Euro
197 million. Adjusted EBITDA improved despite adverse exchange rate trends, producing a
negative impact of Euro 14 million, and the less favourable state of work in progress in the
Projects segment than in the previous year. This improvement was possible thanks to the
Group's resilience in defending its margins, to the priority given to protecting people and to its
commitment to supporting its customers. The Energy segment exceeded its pre-Covid-19 levels,
despite the increase in the cost of raw materials. The Telecom segment is also recovering.
EBITDA is stated after net expenses for company reorganisation, net non-recurring expenses
and other net non-operating expenses, totalling Euro 14 million (Euro 14 million in the first three
months of 2020). These adjustments mainly consist of Euro 7 million in non-operating expenses
and income and Euro 5 million in reorganisation costs.
Amortisation, depreciation and impairment amounted to Euro 78 million in the first quarter of
2021, reporting a decrease from Euro 80 million in the same period last year.
PRYSMIAN GROUP | DIRECTORS' REPORT
14
The fair value change in metal derivatives was a positive Euro 10 million in the first three months
of 2021 compared with a negative Euro 36 million in the same period of 2020.
After adopting hedge accounting for most of its metal derivatives, which has been affected by
price increases for copper, aluminium and lead, the Group has recognised a positive pre-tax
amount of Euro 64 million in the cash flow hedge reserve for metals.
A total of Euro 8 million in costs were recognised in the first quarter of 2021 to account for the
effects of the long-term incentive plan and employee share purchase scheme.
Reflecting the effects described above, the Group's operating income came to Euro 123 million,
compared with Euro 58 million in the previous year, thus reporting an increase of Euro 65 million.
Net finance costs amounted to Euro 13 million in the first quarter of 2021, down on the prior
year figure of Euro 27 million. The decrease is primarily due to the recognition of Euro 16 million
in income for the fair value change in the conversion option of the Convertible Bond 2021, as
described more fully in the Explanatory Notes.
Taxes came to Euro 32 million, representing an effective tax rate of around 29% (36% in the
first three months of 2020).
Net profit for the first quarter of 2021 was Euro 78 million, of which Euro 76 million attributable
to the Group, compared with Euro 20 million in the same period of 2020, of which Euro 23 million
attributable to the Group.
The Group has continued to reduce its net financial debt, which stood at Euro 2,325 million at
31 March 2021, down Euro 281 million from Euro 2,606 million at 31 March 2020. This reduction
was achieved thanks to the significant level of cash generated in the last 12 months of Euro 553
million, before Euro 112 million in disbursements for antitrust litigation.
In the first three months of the year, the Group completed the Crete-Peloponnese
interconnection project, finalised a contract with RWE worth over Euro 200 million for the Sofia
offshore wind farm, and completed the first Sirocco Extreme installation in Germany.
PRYSMIAN GROUP | DIRECTORS' REPORT
15
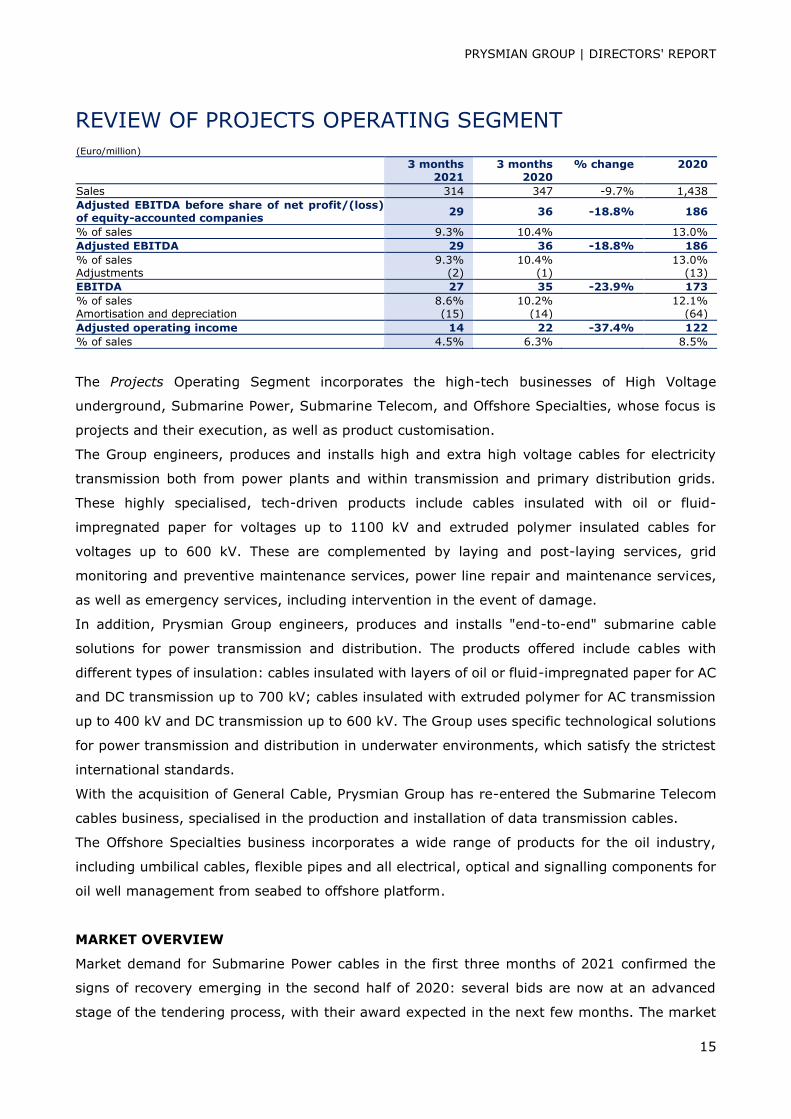
REVIEW OF PROJECTS OPERATING SEGMENT
(Euro/million)
3 months 2021
3 months 2020
% change 2020
Sales 314 347 -9.7% 1,438
Adjusted EBITDA before share of net profit/(loss) of equity-accounted companies
29 36 -18.8% 186
% of sales 9.3% 10.4% 13.0%
Adjusted EBITDA 29 36 -18.8% 186
% of sales 9.3% 10.4% 13.0% Adjustments (2) (1) (13)
EBITDA 27 35 -23.9% 173
% of sales 8.6% 10.2% 12.1% Amortisation and depreciation (15) (14) (64)
Adjusted operating income 14 22 -37.4% 122
% of sales 4.5% 6.3% 8.5%
The Projects Operating Segment incorporates the high-tech businesses of High Voltage
underground, Submarine Power, Submarine Telecom, and Offshore Specialties, whose focus is
projects and their execution, as well as product customisation.
The Group engineers, produces and installs high and extra high voltage cables for electricity
transmission both from power plants and within transmission and primary distribution grids.
These highly specialised, tech-driven products include cables insulated with oil or fluid-
impregnated paper for voltages up to 1100 kV and extruded polymer insulated cables for
voltages up to 600 kV. These are complemented by laying and post-laying services, grid
monitoring and preventive maintenance services, power line repair and maintenance services,
as well as emergency services, including intervention in the event of damage.
In addition, Prysmian Group engineers, produces and installs "end-to-end" submarine cable
solutions for power transmission and distribution. The products offered include cables with
different types of insulation: cables insulated with layers of oil or fluid-impregnated paper for AC
and DC transmission up to 700 kV; cables insulated with extruded polymer for AC transmission
up to 400 kV and DC transmission up to 600 kV. The Group uses specific technological solutions
for power transmission and distribution in underwater environments, which satisfy the strictest
international standards.
With the acquisition of General Cable, Prysmian Group has re-entered the Submarine Telecom
cables business, specialised in the production and installation of data transmission cables.
The Offshore Specialties business incorporates a wide range of products for the oil industry,
including umbilical cables, flexible pipes and all electrical, optical and signalling components for
oil well management from seabed to offshore platform.
MARKET OVERVIEW
Market demand for Submarine Power cables in the first three months of 2021 confirmed the
signs of recovery emerging in the second half of 2020: several bids are now at an advanced
stage of the tendering process, with their award expected in the next few months. The market
PRYSMIAN GROUP | DIRECTORS' REPORT
16
is expected to grow strongly over the medium term, especially the Offshore Wind and
Interconnections segments, fostered by the continuous reduction in electricity generation costs.
Market demand remained stable for Submarine Telecom cables.
In the High Voltage underground business, the HVAC market was largely stable in Europe, with
mixed trends between the different countries, while reporting growth in North America but
persistently soft demand in Southeast Asia, exacerbated by the impact of Covid-19.
In the HVDC market, typically for interconnectors, following the award of major contracts in
Germany in 2020, as a result of which Prysmian Group has secured contracts worth
approximately Euro 1.8 billion, no contracts are expected to be awarded in Europe in 2021, while
the tendering process is reaching its final stages for a number of major projects in North America.
The Offshore Specialties business continued to experience declining prices and volumes.
FINANCIAL PERFORMANCE
Sales to third parties by the Projects segment amounted to Euro 314 million in the first three
months of 2021, versus Euro 347 million in the same period of 2020, recording a negative change
of Euro 33 million (-9.7%).
The factors behind this change were:
- negative organic sales growth, accounting for a decrease of Euro 27 million (-7.9%);
- exchange rate trends, resulting in a decrease of Euro 8 million (-2.4%);
- metal price fluctuations, producing an increase of Euro 2 million (+0.6%).
The Projects segment's negative organic growth is largely explained by the different mix of
contracts in progress in the Submarine Power business, with its installation assets recording a
lower level of utilisation in the quarter. The Submarine Telecom and Offshore Specialties
businesses both recorded reasonable growth due to the effect of project phasing.
The main Submarine Power projects on which work was performed during the period were: the
Crete-Peloponnese and Crete-Attica interconnector projects in Greece, the Viking Link between
the UK and Denmark, the offshore wind projects in France and Germany (Dolwin5), plus
contracts to supply cables for connecting offshore wind farms.
Sales in the period were the result of cable manufacturing activities by the Group's industrial
facilities (Pikkala in Finland, Arco Felice in Italy, Drammen in Norway and Nordenham in
Germany) and installation services, performed with the assistance of both its own assets and
third-party equipment.
The value of the Group's Submarine Power order backlog stands at around Euro 1.8 billion,
mainly consisting of the following contracts: the offshore wind contracts in France (St. Nazaire,
Fecamp and Calvados) and Germany (Dolwin5); the interconnector between the UK and
PRYSMIAN GROUP | DIRECTORS' REPORT
17
Denmark (Viking Link); the link between Scotland and the NNG offshore wind farm and the
Crete-Attica link in Greece. The Group has also finalised a contract with RWE worth over Euro
200 million for the Sofia offshore wind farm.
The value of the Group's High Voltage order backlog is confirmed at a value of close to Euro 2
billion.
The Group's overall order backlog therefore has a value of Euro 3.8 billion.
First-quarter Adjusted EBITDA came to Euro 29 million, down from the prior year figure of Euro
36 million; the main source of contraction was the negative mix of contracts in progress in the
Submarine Power business, which also had to contend with underutilised production capacity.
PRYSMIAN GROUP | DIRECTORS' REPORT
18
REVIEW OF ENERGY OPERATING SEGMENT
(Euro/million)
3 months 2021
3 months 2020
% change 2020
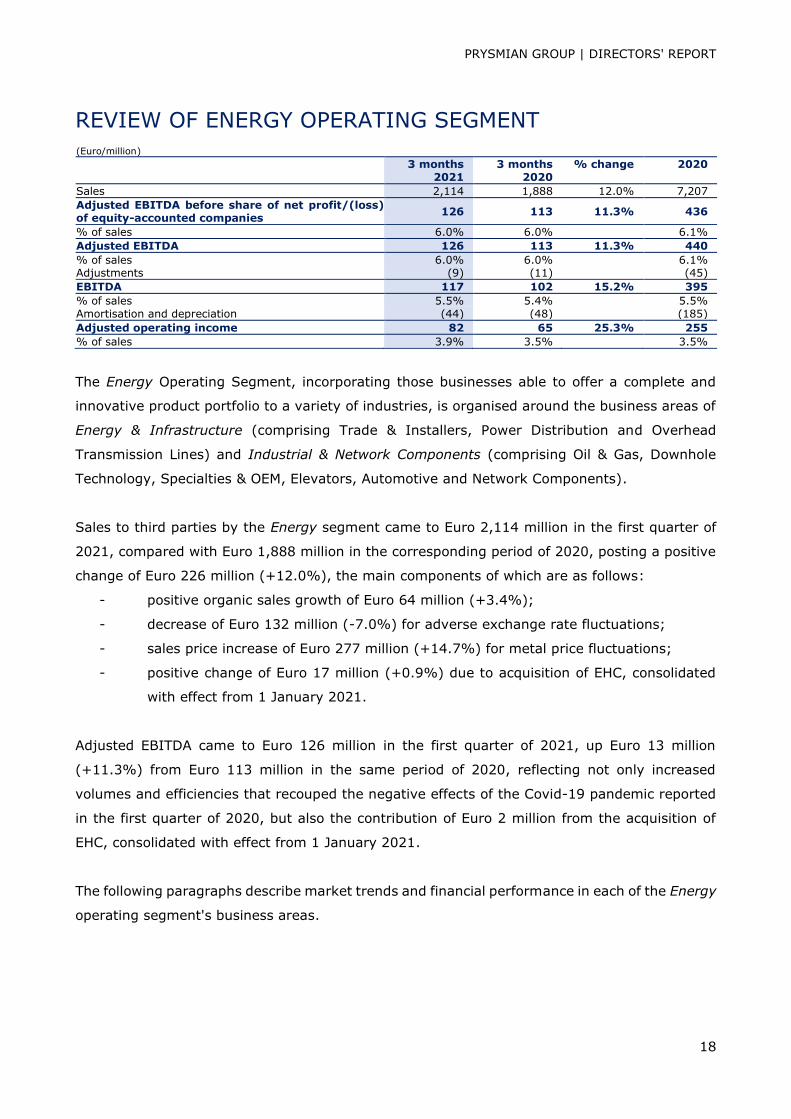
Sales 2,114 1,888 12.0% 7,207
Adjusted EBITDA before share of net profit/(loss) of equity-accounted companies
126 113 11.3% 436
% of sales 6.0% 6.0% 6.1%
Adjusted EBITDA 126 113 11.3% 440
% of sales 6.0% 6.0% 6.1% Adjustments (9) (11) (45)
EBITDA 117 102 15.2% 395
% of sales 5.5% 5.4% 5.5% Amortisation and depreciation (44) (48) (185)
Adjusted operating income 82 65 25.3% 255
% of sales 3.9% 3.5% 3.5%
The Energy Operating Segment, incorporating those businesses able to offer a complete and
innovative product portfolio to a variety of industries, is organised around the business areas of
Energy & Infrastructure (comprising Trade & Installers, Power Distribution and Overhead
Transmission Lines) and Industrial & Network Components (comprising Oil & Gas, Downhole
Technology, Specialties & OEM, Elevators, Automotive and Network Components).
Sales to third parties by the Energy segment came to Euro 2,114 million in the first quarter of
2021, compared with Euro 1,888 million in the corresponding period of 2020, posting a positive
change of Euro 226 million (+12.0%), the main components of which are as follows:
- positive organic sales growth of Euro 64 million (+3.4%);
- decrease of Euro 132 million (-7.0%) for adverse exchange rate fluctuations;
- sales price increase of Euro 277 million (+14.7%) for metal price fluctuations;
- positive change of Euro 17 million (+0.9%) due to acquisition of EHC, consolidated
with effect from 1 January 2021.
Adjusted EBITDA came to Euro 126 million in the first quarter of 2021, up Euro 13 million
(+11.3%) from Euro 113 million in the same period of 2020, reflecting not only increased
volumes and efficiencies that recouped the negative effects of the Covid-19 pandemic reported
in the first quarter of 2020, but also the contribution of Euro 2 million from the acquisition of
EHC, consolidated with effect from 1 January 2021.
The following paragraphs describe market trends and financial performance in each of the Energy
operating segment's business areas.
PRYSMIAN GROUP | DIRECTORS' REPORT
19
ENERGY & INFRASTRUCTURE
(Euro/million)
3 months 2021
3 months 2020
% change 2020
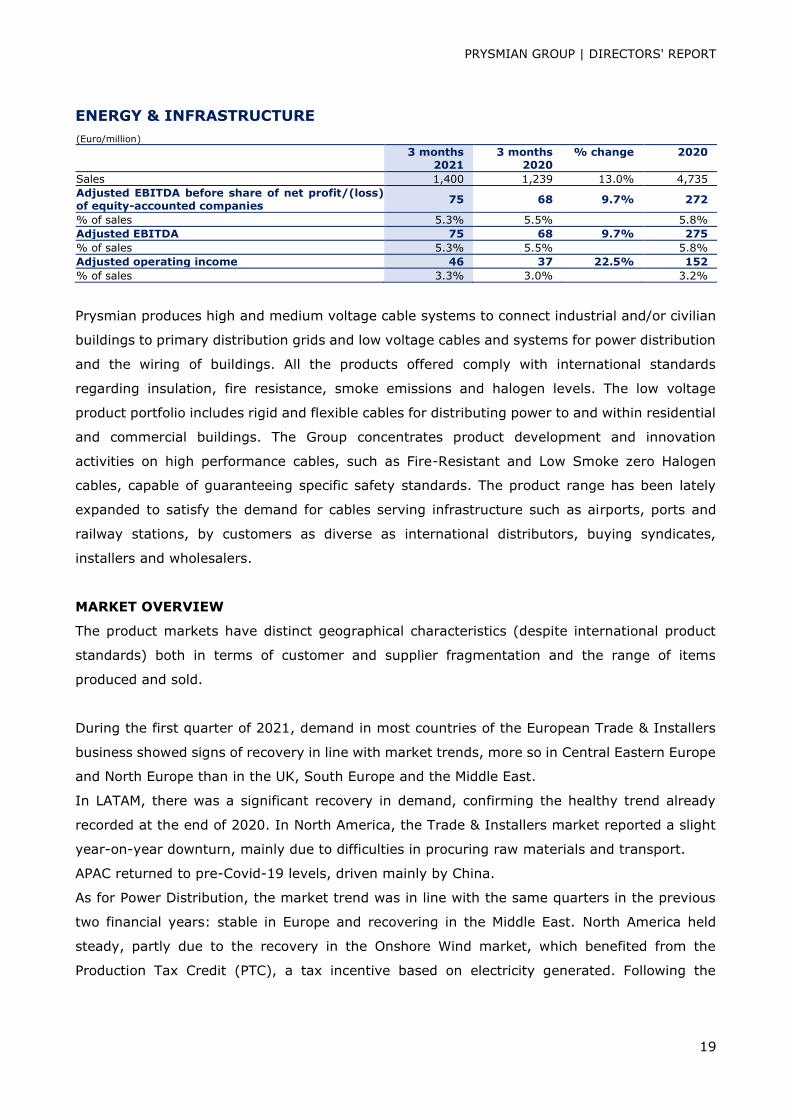
Sales 1,400 1,239 13.0% 4,735
Adjusted EBITDA before share of net profit/(loss) of equity-accounted companies
75 68 9.7% 272
% of sales 5.3% 5.5% 5.8%
Adjusted EBITDA 75 68 9.7% 275
% of sales 5.3% 5.5% 5.8%
Adjusted operating income 46 37 22.5% 152
% of sales 3.3% 3.0% 3.2%
Prysmian produces high and medium voltage cable systems to connect industrial and/or civilian
buildings to primary distribution grids and low voltage cables and systems for power distribution
and the wiring of buildings. All the products offered comply with international standards
regarding insulation, fire resistance, smoke emissions and halogen levels. The low voltage
product portfolio includes rigid and flexible cables for distributing power to and within residential
and commercial buildings. The Group concentrates product development and innovation
activities on high performance cables, such as Fire-Resistant and Low Smoke zero Halogen
cables, capable of guaranteeing specific safety standards. The product range has been lately
expanded to satisfy the demand for cables serving infrastructure such as airports, ports and
railway stations, by customers as diverse as international distributors, buying syndicates,
installers and wholesalers.
MARKET OVERVIEW
The product markets have distinct geographical characteristics (despite international product
standards) both in terms of customer and supplier fragmentation and the range of items
produced and sold.
During the first quarter of 2021, demand in most countries of the European Trade & Installers
business showed signs of recovery in line with market trends, more so in Central Eastern Europe
and North Europe than in the UK, South Europe and the Middle East.
In LATAM, there was a significant recovery in demand, confirming the healthy trend already
recorded at the end of 2020. In North America, the Trade & Installers market reported a slight
year-on-year downturn, mainly due to difficulties in procuring raw materials and transport.
APAC returned to pre-Covid-19 levels, driven mainly by China.
As for Power Distribution, the market trend was in line with the same quarters in the previous
two financial years: stable in Europe and recovering in the Middle East. North America held
steady, partly due to the recovery in the Onshore Wind market, which benefited from the
Production Tax Credit (PTC), a tax incentive based on electricity generated. Following the
PRYSMIAN GROUP | DIRECTORS' REPORT
20
pandemic, the deadline for installations was extended until the end of the year, without
increasing the amount of incentives.
The principal European countries have experienced a general stagnation in energy consumption
in recent years, in turn adversely affecting demand by the major utilities. Operating in a
recessionary economic environment, the latter have either remained cautious, given the
impossibility of forecasting future growth, or have concentrated on business restructuring to
improve efficiency and contain supply-side costs. This situation has exacerbated the competitive
dynamics in terms of price and mix, leaving an extremely challenging environment almost
everywhere. During the first quarter of 2021, the Power Distribution business segment saw
European demand remain at the same level as the previous year, with marginal growth in South
Europe and the UK and a slight contraction in North Europe and Germany.
Demand recovered in the Middle East, having been heavily penalised in the previous period by
the effects of Covid-19, while remaining stable in LATAM and APAC.
As for Overhead Transmission Lines, this business saw volumes increase in North America year-
on-year while remaining stable in LATAM, in line with market expectations.
FINANCIAL PERFORMANCE
Sales to third parties by the Energy & Infrastructure business amounted to Euro 1,400 million in
the first quarter of 2021, compared with Euro 1,239 million in the corresponding quarter of 2020,
posting a positive change of Euro 161 million (+13.0%), the main components of which are as
follows:
- positive organic sales growth of Euro 43 million (+3.5%);
- negative change of Euro 83 million (-6.7%) for exchange rate fluctuations;
- sales price increase of Euro 201 million (+16.2%) for metal price fluctuations.
The Energy & Infrastructure business recorded positive organic sales growth of +3.5% in the
first quarter of 2021. Trade & Installers enjoyed strong organic growth, albeit with geographical
differences, especially in South Europe, Central Eastern Europe and North Europe, with a
recovery in the UK but a slight decline in the Middle East. Strong recovery in LATAM contrasted
with a downturn in North America as a result of difficulties in procuring raw materials and
transport. APAC, the first region to be affected by the Covid-19 pandemic in the same period
last year, recorded a good recovery, particularly in China. Overall profitability of the Trade &
Installers business improved on 2020, mainly due to recovery of volumes and efficiencies that
offset the higher cost of most raw materials.
The Power Distribution business had negative organic growth, reflecting mixed performances by
region: positive in EMEA and LATAM, stable in APAC and negative in North America. There was
PRYSMIAN GROUP | DIRECTORS' REPORT
21
a slight decrease in profitability, generated by a combination of negative exchange rate trends
and the product mix in North America. In North America, the trend for the Power Distribution
business normalised after the strong tax incentive-driven growth in previous periods. There was
persistently strong price pressure in Europe.
The Overhead Lines business enjoyed strong positive organic growth especially in North America,
while remaining stable in LATAM.
Given the factors described above, Adjusted EBITDA in the first quarter of 2021 came to Euro
75 million, compared with Euro 68 million in the same period of 2020, reflecting an increase of
Euro 7 million (+9.7%).
INDUSTRIAL & NETWORK COMPONENTS
(Euro/million)
3 months 2021
3 months 2020
% change 2020
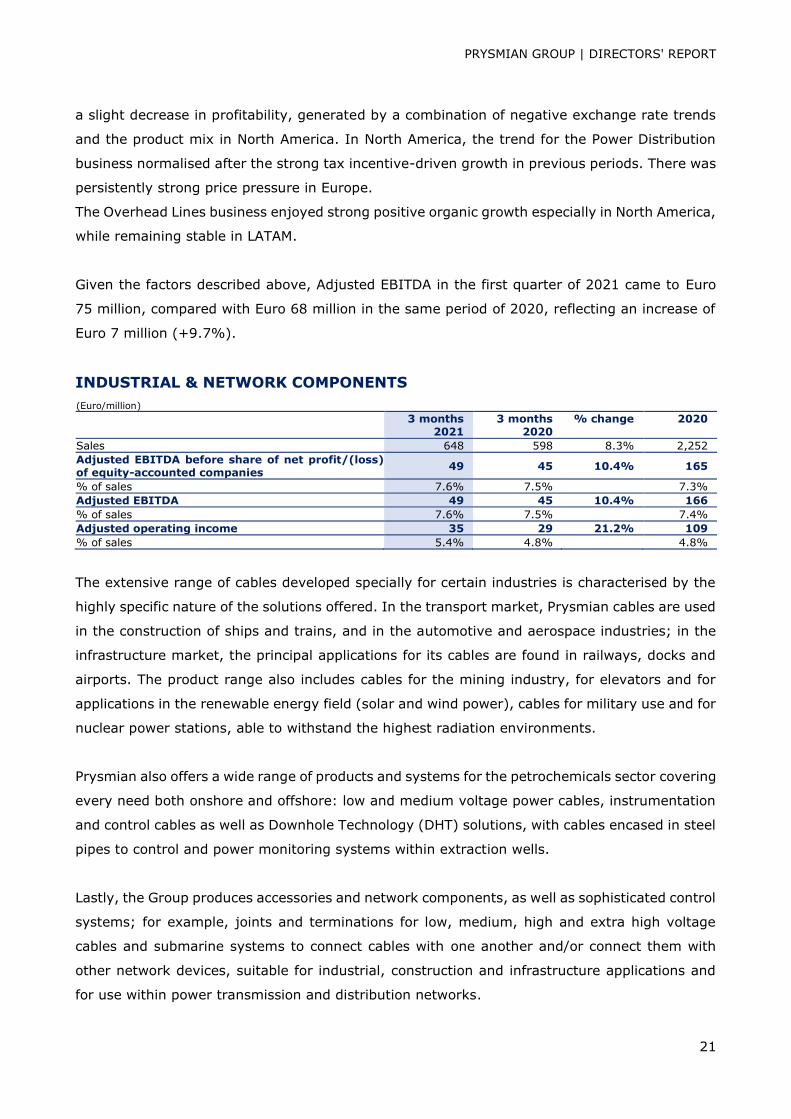
Sales 648 598 8.3% 2,252
Adjusted EBITDA before share of net profit/(loss) of equity-accounted companies
49 45 10.4% 165
% of sales 7.6% 7.5% 7.3%
Adjusted EBITDA 49 45 10.4% 166
% of sales 7.6% 7.5% 7.4%
Adjusted operating income 35 29 21.2% 109
% of sales 5.4% 4.8% 4.8%
The extensive range of cables developed specially for certain industries is characterised by the
highly specific nature of the solutions offered. In the transport market, Prysmian cables are used
in the construction of ships and trains, and in the automotive and aerospace industries; in the
infrastructure market, the principal applications for its cables are found in railways, docks and
airports. The product range also includes cables for the mining industry, for elevators and for
applications in the renewable energy field (solar and wind power), cables for military use and for
nuclear power stations, able to withstand the highest radiation environments.
Prysmian also offers a wide range of products and systems for the petrochemicals sector covering
every need both onshore and offshore: low and medium voltage power cables, instrumentation
and control cables as well as Downhole Technology (DHT) solutions, with cables encased in steel
pipes to control and power monitoring systems within extraction wells.
Lastly, the Group produces accessories and network components, as well as sophisticated control
systems; for example, joints and terminations for low, medium, high and extra high voltage
cables and submarine systems to connect cables with one another and/or connect them with
other network devices, suitable for industrial, construction and infrastructure applications and
for use within power transmission and distribution networks.
PRYSMIAN GROUP | DIRECTORS' REPORT
22
MARKET OVERVIEW
Markets for Industrial cables displayed good resilience with some understandable disparities
within the various business lines and between the different geographical areas. Some market
segments are growing and recovering thanks to a strong existing order backlog and customer
investment programs. Certain applications for the OEM sector have performed well: Railway,
Nuclear, Marine, Water and Electromedical. The Mining business has recovered thanks to
renewed MRO demand in Europe and the call-off of certain projects already in the order backlog
in South America. Stable results for the Crane business nonetheless compare with a healthy
first-quarter performance in 2020 resulting from orders accumulated in the fourth quarter of
2019. Water lost momentum, especially in North America, and Nuclear was affected by the
positive phasing of projects that had benefited North America in 2020.
The Rolling stock segment also saw lower volumes due not only to the postponement of CRRC
call-offs in China under a multi-year program announced in 2020 but also to delays in full-swing
resumption of some customer platforms in Europe. The Renewables business enjoyed positive
demand for both Solar and Wind products: in Central Eastern Europe especially for Wind and in
APAC, MEAT and North America also for Solar.
However, both segments saw an increase in competitive pressure due to higher raw material
and logistics costs, which affected unit margins and more than offset the healthy trend in
volumes.
In the O&G segment, demand is still being affected by the aftermath of the Covid-19 pandemic.
During the first quarter of the year, volumes continued to slow in the Middle East, offset by
recovery in the APAC region. The pace of order intake had slowed in the final quarters of 2020
with the spread of the pandemic and postponement of further investment decisions by major oil
company customers.
The Elevator market showed a certain stability thanks to the good performance of the North
American market and the recovery of the Chinese market, the first country to be affected by
Covid-19 in the previous year. It should be noted that the EHC Global Group operating in the
elevator business has been consolidated as from 1 January 2021, making a Euro 2 million
contribution to the Group's EBITDA.
The Automotive segment's first-quarter volumes in 2021 were in line with those in the same
period of the previous year, maintaining the positive trend reported in the final quarter of 2020.
The LATAM and APAC regions nonetheless displayed continuing tension on volumes. Despite
strong growth in the market for electric cars and good performance in the premium market, the
PRYSMIAN GROUP | DIRECTORS' REPORT
23
latter region reported a sharp downturn at the mid and low end of the market. The tendency for
cable manufacturers to intercept the market upstream continued.
The Network Components market in the first quarter of 2021 displayed a recovery in demand,
especially in the HV and EHV segments, and resilience in the MV segment, reflecting the effects
of the recovery from Covid-19 pandemic in South Europe and APAC, while remaining stable in
the rest of the world.
FINANCIAL PERFORMANCE
Sales to third parties by the Industrial & Network Components business area amounted to Euro
648 million in the first quarter of 2021, compared with Euro 598 million in the corresponding
period of 2020, recording a positive change of Euro 50 million (+8.3%), the main components
of which were as follows:
- positive organic sales growth of Euro 21 million (+3.5%).
- negative change of Euro 44 million (-7.3%) for exchange rate fluctuations;
- sales price increase of Euro 56 million (+9.3%) for metal price fluctuations;
- positive change of Euro 17 million (+2.8%) following the acquisition of EHC,
consolidated with effect from 1 January 2021.
The principal business lines of Industrial & Network Components performed better in the first
quarter of 2021 than in the same period of 2020, except for Oil & Gas, DHT and Aviation which
were still affected by the aftermath of the Covid-19 pandemic.
The Oil & Gas business saw business volumes deteriorate steadily in the EMEA region due to
project phasing, while remaining depressed in North America. Asia Pacific as a whole displayed
a positive level of activity. The business's overall margins degenerated due to the downturn in
activity and parallel increase in competitive pressure.
Specialties, OEM and Renewables recorded a healthy level of profit in line with expectations,
displaying good resilience to the global economic situation, particularly thanks to the contribution
of Central Eastern and North Europe, North America and the Railway, Infrastructure, Mining,
Wind and Solar businesses.
This positive performance was partially tempered by worse results for the Rolling Stock, Cranes
and Nuclear businesses due to project phasing and delays in the call-off of orders already in the
backlog.
PRYSMIAN GROUP | DIRECTORS' REPORT
24
The profitability of the Elevator business, which performed well in North America, was in line
with expectations.
The acquisition of the EHC group was completed in January 2021, enabling the Group to integrate
vertical transportation solutions into the product portfolio of its Elevator business.
The Automotive business reported a recovery in volumes everywhere, commencing from the
final quarter of 2020.
The Network Components business regained its pre-Covid-19 levels, driven above all by the HV
and EHV segment in South Europe. The MV market was stable, with strong pressure on prices.
Given the factors described above, Adjusted EBITDA for the first quarter of 2021 came to Euro
49 million, up from Euro 45 million in the same period last year, reporting a positive change of
Euro 4 million (+10.4%).
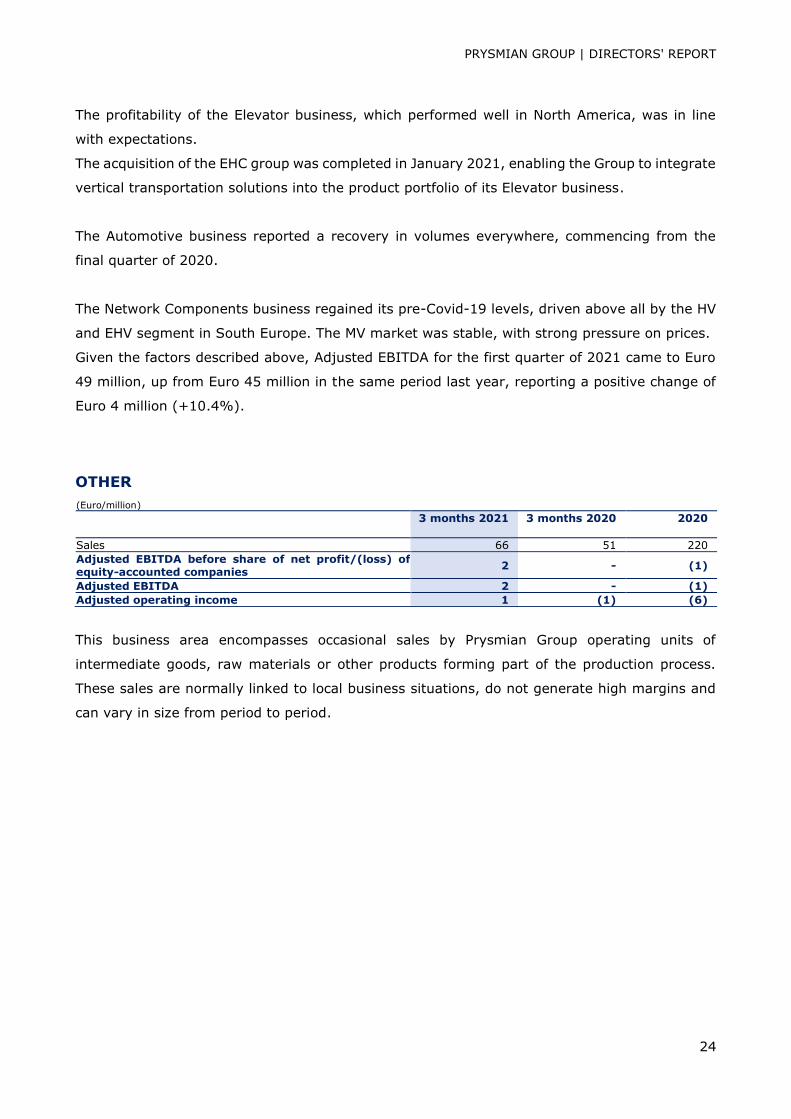
OTHER
(Euro/million)
3 months 2021 3 months 2020 2020
Sales 66 51 220
Adjusted EBITDA before share of net profit/(loss) of equity-accounted companies
2 - (1)
Adjusted EBITDA 2 - (1)
Adjusted operating income 1 (1) (6)
This business area encompasses occasional sales by Prysmian Group operating units of
intermediate goods, raw materials or other products forming part of the production process.
These sales are normally linked to local business situations, do not generate high margins and
can vary in size from period to period.
PRYSMIAN GROUP | DIRECTORS' REPORT
25
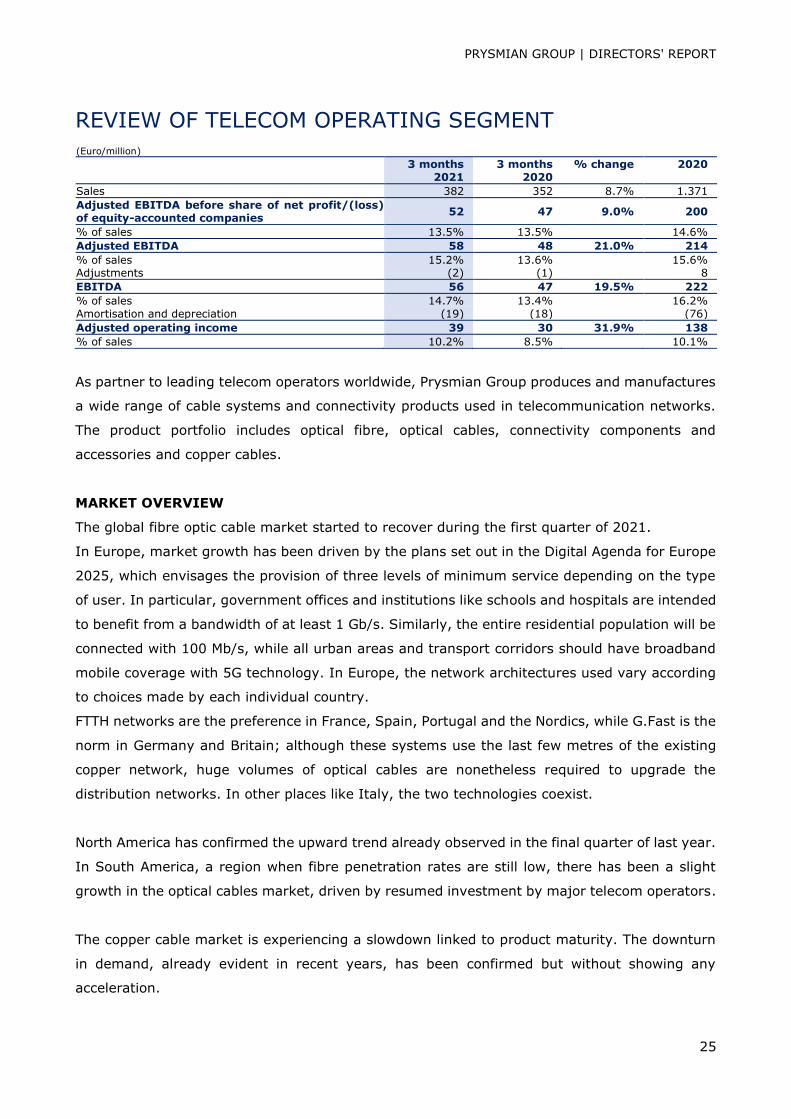
REVIEW OF TELECOM OPERATING SEGMENT
(Euro/million)
3 months 2021
3 months 2020
% change 2020
Sales 382 352 8.7% 1.371
Adjusted EBITDA before share of net profit/(loss) of equity-accounted companies
52 47 9.0% 200
% of sales 13.5% 13.5% 14.6%
Adjusted EBITDA 58 48 21.0% 214
% of sales 15.2% 13.6% 15.6% Adjustments (2) (1) 8
EBITDA 56 47 19.5% 222
% of sales 14.7% 13.4% 16.2% Amortisation and depreciation (19) (18) (76)
Adjusted operating income 39 30 31.9% 138
% of sales 10.2% 8.5% 10.1%
As partner to leading telecom operators worldwide, Prysmian Group produces and manufactures
a wide range of cable systems and connectivity products used in telecommunication networks.
The product portfolio includes optical fibre, optical cables, connectivity components and
accessories and copper cables.
MARKET OVERVIEW
The global fibre optic cable market started to recover during the first quarter of 2021.
In Europe, market growth has been driven by the plans set out in the Digital Agenda for Europe
2025, which envisages the provision of three levels of minimum service depending on the type
of user. In particular, government offices and institutions like schools and hospitals are intended
to benefit from a bandwidth of at least 1 Gb/s. Similarly, the entire residential population will be
connected with 100 Mb/s, while all urban areas and transport corridors should have broadband
mobile coverage with 5G technology. In Europe, the network architectures used vary according
to choices made by each individual country.
FTTH networks are the preference in France, Spain, Portugal and the Nordics, while G.Fast is the
norm in Germany and Britain; although these systems use the last few metres of the existing
copper network, huge volumes of optical cables are nonetheless required to upgrade the
distribution networks. In other places like Italy, the two technologies coexist.
North America has confirmed the upward trend already observed in the final quarter of last year.
In South America, a region when fibre penetration rates are still low, there has been a slight
growth in the optical cables market, driven by resumed investment by major telecom operators.
The copper cable market is experiencing a slowdown linked to product maturity. The downturn
in demand, already evident in recent years, has been confirmed but without showing any
acceleration.
PRYSMIAN GROUP | DIRECTORS' REPORT
26
Given the high demand for internet access, the major operators have opted to renew their
networks using optical fibre, rather than perform extensive maintenance work or upgrade
existing networks. It is still worth retaining a presence in this segment since the gradual
decommissioning of assets by competitor cable manufacturers nonetheless offers attractive
opportunities.
The MMS cable market has recovered, particularly in Germany, France, China and North
America. In South America, a gradual recovery is underway after commencing in the final quarter
of last year.
FINANCIAL PERFORMANCE
Sales to third parties by the Telecom operating segment came to Euro 382 million in the first
three months of 2021, compared with Euro 352 million in the same period of 2020.
The positive change of Euro 30 million (+8.7%) is explained by:
- organic sales growth of Euro 40 million (+11.4%);
- sales price increase of Euro 8 million (+2.3%) for metal price fluctuations;
negative change of Euro 18 million (-5.0%) for exchange rate fluctuations.
Organic sales growth in the first quarter of 2021 was mainly due to a recovery in demand for
optical fibre cables and special cables, particularly in South Europe and North America.
In Europe, first-quarter volumes were up on the same period last year. The policy of "destocking"
adopted by the main European operators during 2020 has given way to a gradual recovery in
volumes.
In South America, volumes grew in line with the positive market trend.
Globally, copper cables continued their steady decline with the retirement of traditional networks
in favour of new-generation ones.
The high value-added business of optical connectivity accessories continued to perform well,
prompted by the development of new FTTx (last-mile broadband) networks.
The Multimedia Solutions business recorded positive organic growth, in line with the market
trend.

PRYSMIAN GROUP | DIRECTORS' REPORT
27
The return on investments in relocating some cable manufacturing sources to Eastern Europe
also made a substantial contribution to the segment's overall results.
Adjusted EBITDA for the first quarter of 2021 came to Euro 58 million, reporting an increase of
Euro 10 million (+21.0%) from Euro 48 million in the same period of 2020. This increase was
mainly attributable to the positive results of the Group described above, benefiting from
operational efficiencies even if partially offset by persistent price pressure, and to those of the
associate Yangtze Optical Fibre and Cable Joint Stock Limited Company in China with its positive
contribution of some Euro 6 million.
PRYSMIAN GROUP | DIRECTORS' REPORT
28
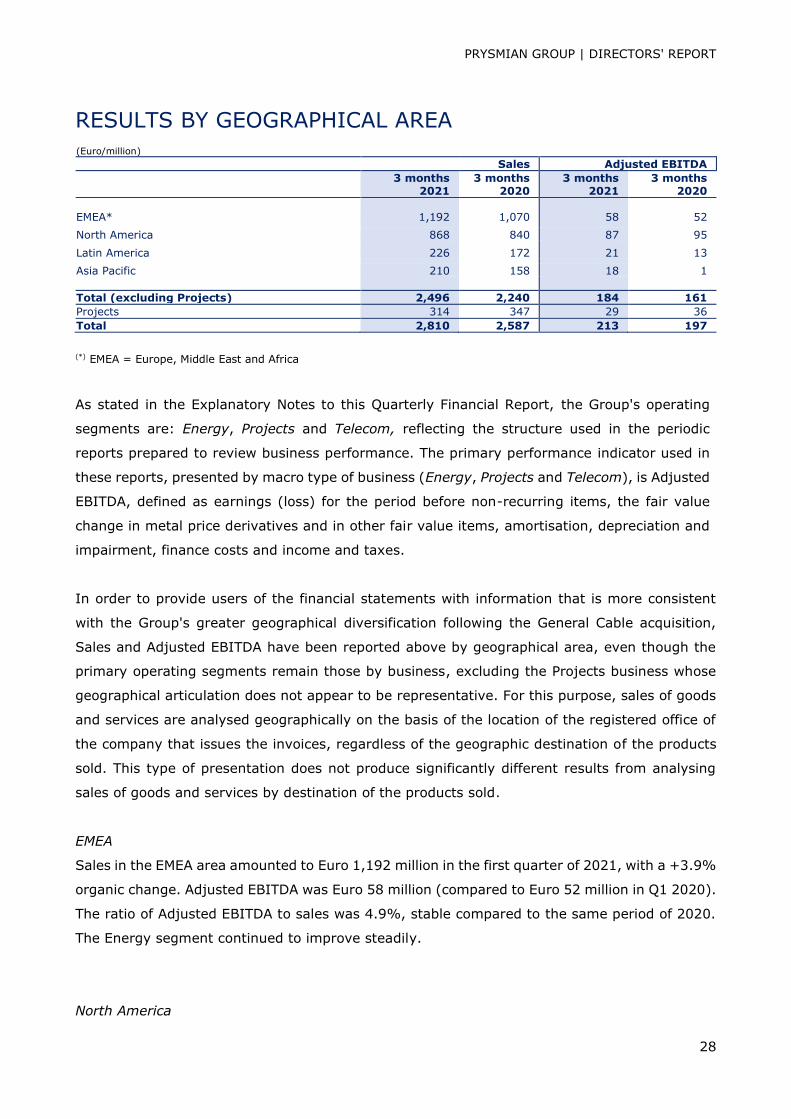
RESULTS BY GEOGRAPHICAL AREA
(Euro/million) Sales Adjusted EBITDA
3 months 2021
3 months 2020
3 months 2021
3 months 2020
EMEA* 1,192 1,070 58 52
North America 868 840 87 95
Latin America 226 172 21 13
Asia Pacific 210 158 18 1
Total (excluding Projects) 2,496 2,240 184 161
Projects 314 347 29 36
Total 2,810 2,587 213 197
(*) EMEA = Europe, Middle East and Africa
As stated in the Explanatory Notes to this Quarterly Financial Report, the Group's operating
segments are: Energy, Projects and Telecom, reflecting the structure used in the periodic
reports prepared to review business performance. The primary performance indicator used in
these reports, presented by macro type of business (Energy, Projects and Telecom), is Adjusted
EBITDA, defined as earnings (loss) for the period before non-recurring items, the fair value
change in metal price derivatives and in other fair value items, amortisation, depreciation and
impairment, finance costs and income and taxes.
In order to provide users of the financial statements with information that is more consistent
with the Group's greater geographical diversification following the General Cable acquisition,
Sales and Adjusted EBITDA have been reported above by geographical area, even though the
primary operating segments remain those by business, excluding the Projects business whose
geographical articulation does not appear to be representative. For this purpose, sales of goods
and services are analysed geographically on the basis of the location of the registered office of
the company that issues the invoices, regardless of the geographic destination of the products
sold. This type of presentation does not produce significantly different results from analysing
sales of goods and services by destination of the products sold.
EMEA
Sales in the EMEA area amounted to Euro 1,192 million in the first quarter of 2021, with a +3.9%
organic change. Adjusted EBITDA was Euro 58 million (compared to Euro 52 million in Q1 2020).
The ratio of Adjusted EBITDA to sales was 4.9%, stable compared to the same period of 2020.
The Energy segment continued to improve steadily.
North America
PRYSMIAN GROUP | DIRECTORS' REPORT
29
Sales in this area amounted to Euro 868 million, with a -0.9% organic change compared to the
first quarter of 2020. Adjusted EBITDA was Euro 87 million, (compared to Euro 95 million in Q1
2020). The ratio of Adjusted EBITDA to sales was 10.0% compared to 11.3% in Q1 2020. The
results were stable and, in line with expectations, the Power Distribution business also stabilised
after the recent significant growth. The optical cable business showed a solid uptrend.
LATAM
Sales of the LatAm area totalled Euro 226 million, with a +27.9% organic change. Adjusted
EBITDA was Euro 21 million (compared to Euro 13 million in Q1 2020). The ratio of Adjusted
EBITDA to sales was 9.6% compared to 8.0% in Q1 2020. The solid performance was mainly
driven by the construction sector and the Telecom business.
APAC
Sales in the Asia Pacific area amounted to Euro 210 million in the first quarter of 2021, with a
+14.1% organic change. Adjusted EBITDA was Euro 18 million (compared to Euro 1 million in
Q1 2020). The ratio of Adjusted EBITDA to sales was 8.5% compared to 0.4% in Q1 2020. This
area fully recovered from the negative Covid-19 impacts that affected the same period of the
previous year.
PRYSMIAN GROUP | DIRECTORS' REPORT
30
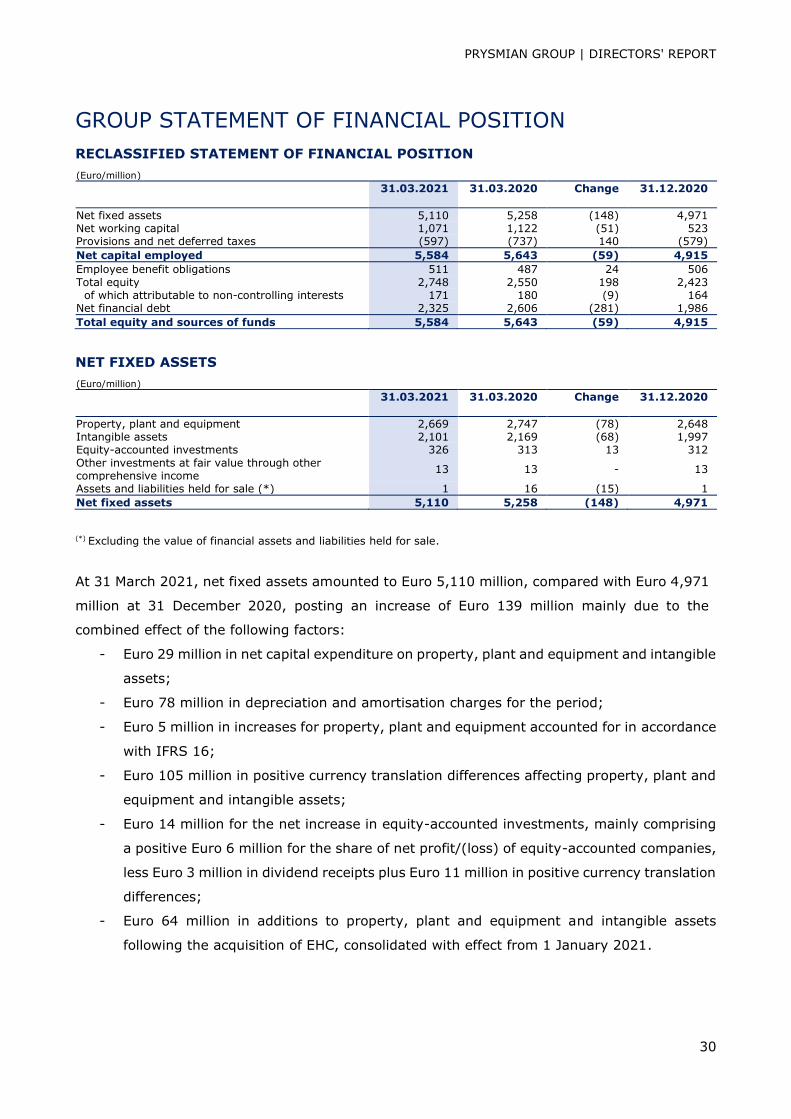
GROUP STATEMENT OF FINANCIAL POSITION
RECLASSIFIED STATEMENT OF FINANCIAL POSITION
(Euro/million) 31.03.2021 31.03.2020 Change 31.12.2020
Net fixed assets 5,110 5,258 (148) 4,971 Net working capital 1,071 1,122 (51) 523 Provisions and net deferred taxes (597) (737) 140 (579)
Net capital employed 5,584 5,643 (59) 4,915
Employee benefit obligations 511 487 24 506
Total equity 2,748 2,550 198 2,423 of which attributable to non-controlling interests 171 180 (9) 164 Net financial debt 2,325 2,606 (281) 1,986
Total equity and sources of funds 5,584 5,643 (59) 4,915
NET FIXED ASSETS
(Euro/million) 31.03.2021 31.03.2020 Change 31.12.2020
Property, plant and equipment 2,669 2,747 (78) 2,648 Intangible assets 2,101 2,169 (68) 1,997 Equity-accounted investments 326 313 13 312
Other investments at fair value through other comprehensive income
13 13 - 13
Assets and liabilities held for sale (*) 1 16 (15) 1
Net fixed assets 5,110 5,258 (148) 4,971
(*) Excluding the value of financial assets and liabilities held for sale.
At 31 March 2021, net fixed assets amounted to Euro 5,110 million, compared with Euro 4,971
million at 31 December 2020, posting an increase of Euro 139 million mainly due to the
combined effect of the following factors:
- Euro 29 million in net capital expenditure on property, plant and equipment and intangible
assets;
- Euro 78 million in depreciation and amortisation charges for the period;
- Euro 5 million in increases for property, plant and equipment accounted for in accordance
with IFRS 16;
- Euro 105 million in positive currency translation differences affecting property, plant and
equipment and intangible assets;
- Euro 14 million for the net increase in equity-accounted investments, mainly comprising
a positive Euro 6 million for the share of net profit/(loss) of equity-accounted companies,
less Euro 3 million in dividend receipts plus Euro 11 million in positive currency translation
differences;
- Euro 64 million in additions to property, plant and equipment and intangible assets
following the acquisition of EHC, consolidated with effect from 1 January 2021.
PRYSMIAN GROUP | DIRECTORS' REPORT
31
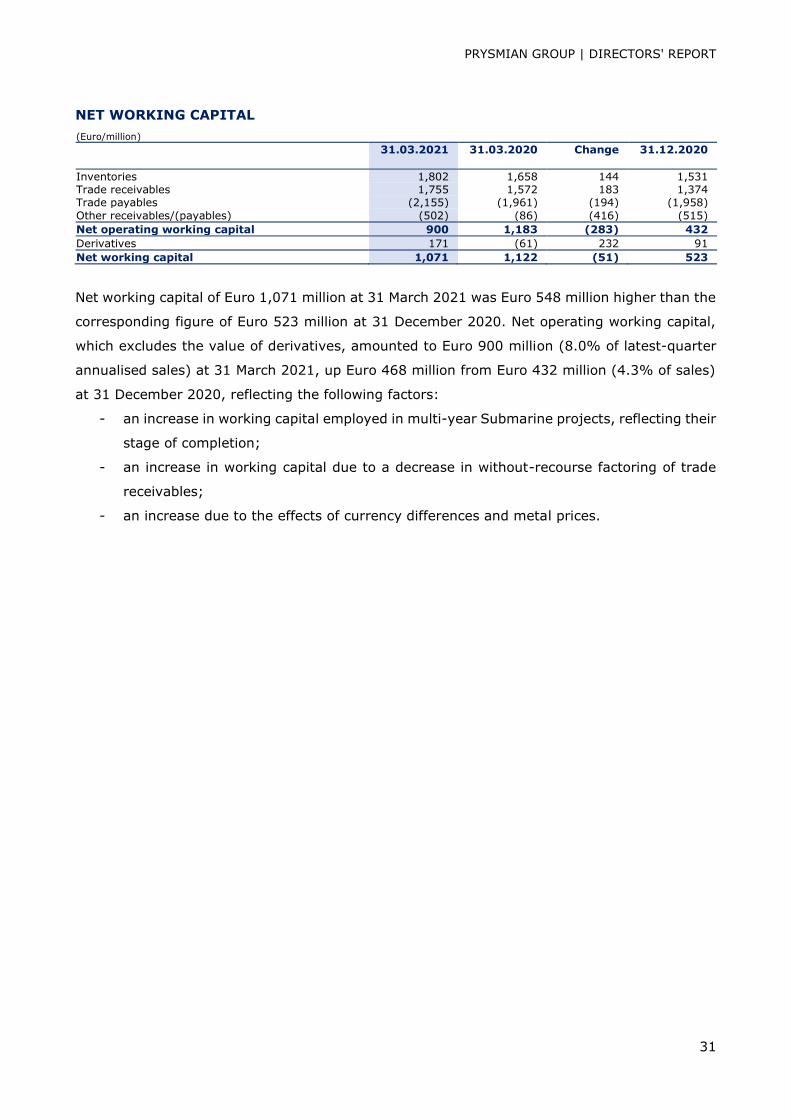
NET WORKING CAPITAL
(Euro/million) 31.03.2021 31.03.2020 Change 31.12.2020
Inventories 1,802 1,658 144 1,531 Trade receivables 1,755 1,572 183 1,374 Trade payables (2,155) (1,961) (194) (1,958)
Other receivables/(payables) (502) (86) (416) (515)
Net operating working capital 900 1,183 (283) 432
Derivatives 171 (61) 232 91
Net working capital 1,071 1,122 (51) 523
Net working capital of Euro 1,071 million at 31 March 2021 was Euro 548 million higher than the
corresponding figure of Euro 523 million at 31 December 2020. Net operating working capital,
which excludes the value of derivatives, amounted to Euro 900 million (8.0% of latest-quarter
annualised sales) at 31 March 2021, up Euro 468 million from Euro 432 million (4.3% of sales)
at 31 December 2020, reflecting the following factors:
- an increase in working capital employed in multi-year Submarine projects, reflecting their
stage of completion;
- an increase in working capital due to a decrease in without-recourse factoring of trade
receivables;
- an increase due to the effects of currency differences and metal prices.
PRYSMIAN GROUP | DIRECTORS' REPORT
32
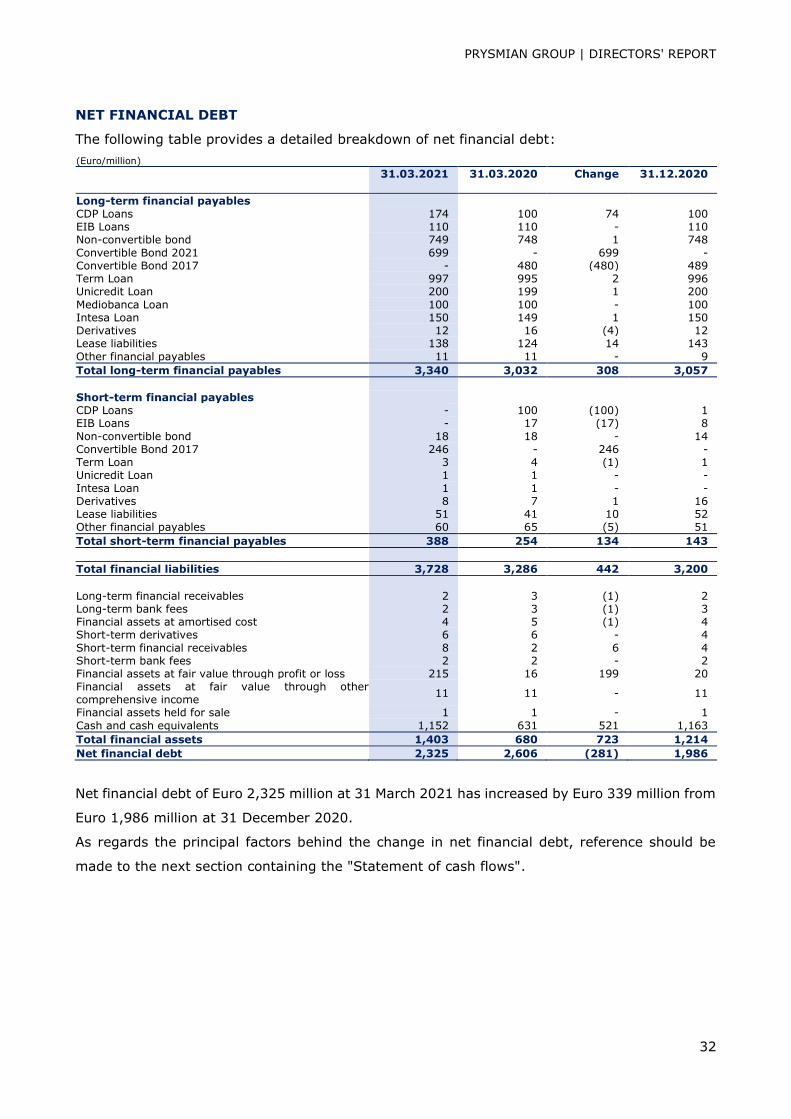
NET FINANCIAL DEBT
The following table provides a detailed breakdown of net financial debt:
(Euro/million) 31.03.2021 31.03.2020 Change 31.12.2020
Long-term financial payables
CDP Loans 174 100 74 100 EIB Loans 110 110 - 110 Non-convertible bond 749 748 1 748
Convertible Bond 2021 699 - 699 - Convertible Bond 2017 - 480 (480) 489 Term Loan 997 995 2 996 Unicredit Loan 200 199 1 200
Mediobanca Loan 100 100 - 100 Intesa Loan 150 149 1 150 Derivatives 12 16 (4) 12 Lease liabilities 138 124 14 143
Other financial payables 11 11 - 9
Total long-term financial payables 3,340 3,032 308 3,057
Short-term financial payables
CDP Loans - 100 (100) 1 EIB Loans - 17 (17) 8
Non-convertible bond 18 18 - 14 Convertible Bond 2017 246 - 246 - Term Loan 3 4 (1) 1 Unicredit Loan 1 1 - -
Intesa Loan 1 1 - - Derivatives 8 7 1 16 Lease liabilities 51 41 10 52 Other financial payables 60 65 (5) 51
Total short-term financial payables 388 254 134 143
Total financial liabilities 3,728 3,286 442 3,200
Long-term financial receivables 2 3 (1) 2 Long-term bank fees 2 3 (1) 3 Financial assets at amortised cost 4 5 (1) 4 Short-term derivatives 6 6 - 4
Short-term financial receivables 8 2 6 4 Short-term bank fees 2 2 - 2 Financial assets at fair value through profit or loss 215 16 199 20 Financial assets at fair value through other comprehensive income
11 11 - 11
Financial assets held for sale 1 1 - 1
Cash and cash equivalents 1,152 631 521 1,163
Total financial assets 1,403 680 723 1,214
Net financial debt 2,325 2,606 (281) 1,986
Net financial debt of Euro 2,325 million at 31 March 2021 has increased by Euro 339 million from
Euro 1,986 million at 31 December 2020.
As regards the principal factors behind the change in net financial debt, reference should be
made to the next section containing the "Statement of cash flows".
PRYSMIAN GROUP | DIRECTORS' REPORT
33
STATEMENT OF CASH FLOWS
(Euro/million) 3 months
2021 3 months
2020 Change 12 months
(from 1 April 2020 to 31 March
2021)
2020
EBITDA 199 183 16 797 781
Changes in provisions (including employee benefit obligations) and other movements
(10) (44) 34 (129) (163)
(Gains)/losses on disposal of property, plant and equipment and intangible assets
- - - (20) (20)
Share of net profit/(loss) of equity-accounted companies
(6) (1) (5) (23) (18)
Net cash flow from operating activities (before changes in net working capital)
183 138 45 625 580
Changes in net working capital (477) (473) (4) 255 259 Taxes paid (10) (15) 5 (137) (142) Dividends from investments in equity-accounted companies
3 2 1 9 8
Net cash flow from operating activities (301) (348) 47 752 705
Cash flow from acquisitions and/or disposals (73) - (73) (78) (5) Net cash flow used in operating investing activities
(29) (52) 23 (221) (244)
Free cash flow (unlevered) (403) (400) (3) 453 456
Net finance costs (13) (9) (4) (90) (86)
Free cash flow (levered) (416) (409) (7) 363 370
Dividend distribution - - - (70) (70) Capital contributions and other changes in equity
- - - 1 1
Net cash flow provided/(used) in the period
(416) (409) (7) 294 301
Opening net financial debt (1,986) (2,140) 154 (2,606) (2,140)
Net cash flow provided/(used) in the period (416) (409) (7) 294 301
Equity component of Convertible Bond 2021 49 49 49
Partial redemption of Convertible Bond 2017 (13) (13) (13)
Increase in net financial debt for IFRS 16 (5) - (5) (84) (79) Net financial debt of EHC 9 9 9
Other changes 37 (57) 94 26 (68)
Closing net financial debt (2,325) (2,606) 281 (2,325) (1,986)
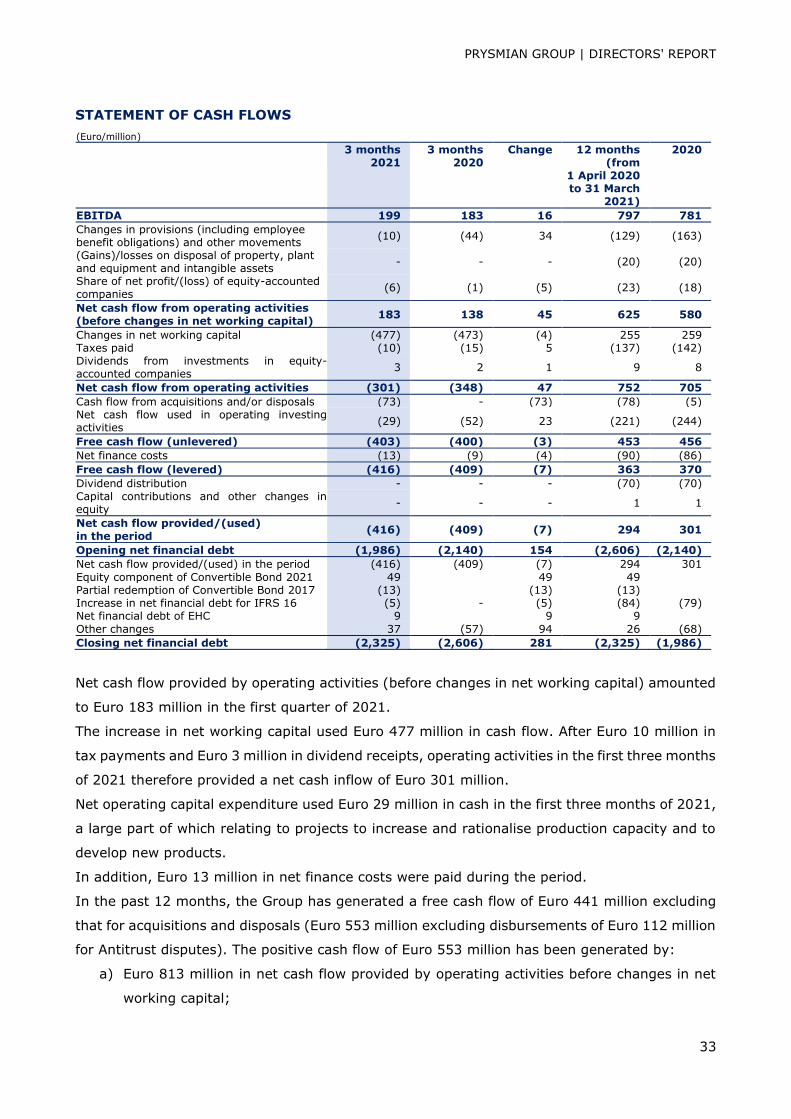
Net cash flow provided by operating activities (before changes in net working capital) amounted
to Euro 183 million in the first quarter of 2021.
The increase in net working capital used Euro 477 million in cash flow. After Euro 10 million in
tax payments and Euro 3 million in dividend receipts, operating activities in the first three months
of 2021 therefore provided a net cash inflow of Euro 301 million.
Net operating capital expenditure used Euro 29 million in cash in the first three months of 2021,
a large part of which relating to projects to increase and rationalise production capacity and to
develop new products.
In addition, Euro 13 million in net finance costs were paid during the period.
In the past 12 months, the Group has generated a free cash flow of Euro 441 million excluding
that for acquisitions and disposals (Euro 553 million excluding disbursements of Euro 112 million
for Antitrust disputes). The positive cash flow of Euro 553 million has been generated by:
a) Euro 813 million in net cash flow provided by operating activities before changes in net
working capital;

PRYSMIAN GROUP | DIRECTORS' REPORT
34
b) Euro 255 million in cash flow provided by the decrease in net working capital;
c) Euro 76 million in cash flow absorbed by restructuring costs and other non-operating
expenses;
d) Euro 221 million in cash outflows for net capital expenditure;
e) Euro 90 million in payments of net finance costs;
f) Euro 137 million in tax payments;
g) Euro 9 million in dividend receipts from associates.
PRYSMIAN GROUP | DIRECTORS' REPORT
35
ALTERNATIVE PERFORMANCE INDICATORS
In addition to the standard financial reporting formats and indicators required under IFRS, this
document contains a number of reclassified statements and alternative performance indicators.
The purpose is to help users better evaluate the Group's economic and financial performance.
However, these statements and indicators should not be treated as a substitute for the accepted
ones required by IFRS.
In this regard, on 3 December 2015, Consob adopted the ESMA guidelines in Italy with
publication of "ESMA Guidelines/2015/1415" which supersede the "CESR Recommendation 2005
(CESR/05-178b)". The alternative performance measures have therefore been revised in light of
these guidelines.
The alternative indicators used for reviewing the income statement include:
• Adjusted operating income: operating income before income and expense for company
reorganisation1, before non-recurring items2, as presented in the consolidated income
statement, before other non-operating income and expense3 and before the fair value change in
metal derivatives and in other fair value items. The purpose of this indicator is to present the
Group's operating profitability without the effects of events considered to be outside its recurring
operations;
• EBITDA: operating income before the fair value change in metal price derivatives and in other
fair value items and before amortisation, depreciation and impairment. The purpose of this
indicator is to present the Group's operating profitability before the main non-monetary items;
• Adjusted EBITDA: EBITDA as defined above calculated before income and expense for
company reorganisation, before non-recurring items, as presented in the consolidated income
statement, and before other non-operating income and expense. The purpose of this indicator
is to present the Group's operating profitability before the main non-monetary items, without
the effects of events considered to be outside the Group's recurring operations;
• Adjusted EBITDA before share of net profit/(loss) of equity-accounted companies:
Adjusted EBITDA as defined above calculated before the share of net profit/(loss) of equity-
accounted companies;
1 Income and expense for company reorganisation: these refer to income and expense that arise as a result of the
closure of production facilities and/or as a result of projects to enhance the organisational structure's efficiency;
2 Non-recurring income and expense: these refer to income and expense related to unusual events that have not affected
the income statement in past periods and that will probably not affect the results in future periods;
3 Other non-operating income and expense: these refer to income and expense that management considers should not
be taken into account when measuring business performance.
PRYSMIAN GROUP | DIRECTORS' REPORT
36
• Organic growth: growth in sales calculated net of changes in the scope of consolidation,
changes in metal prices and exchange rate effects.
The alternative indicators used for reviewing the reclassified statement of financial position
include:
• Net fixed assets: sum of the following items contained in the statement of financial position:
- Intangible assets
- Property, plant and equipment
- Equity-accounted investments
- Other investments at fair value through other comprehensive income
- Assets held for sale involving Land and Buildings (excluding financial assets and liabilities
held for sale)
• Net working capital: sum of the following items contained in the statement of financial
position:
- Inventories
- Trade receivables
- Trade payables
- Other non-current receivables and payables, net of long-term financial receivables
classified in net financial debt
- Other current receivables and payables, net of short-term financial receivables classified
in net financial debt
- Derivatives net of financial instruments for hedging interest rate and currency risks
relating to financial transactions, classified in net financial debt
- Current tax payables
- Assets and liabilities held for sale involving current assets and liabilities
• Net operating working capital: sum of the following items contained in the statement of
financial position:
- Inventories
- Trade receivables
- Trade payables
- Other non-current receivables and payables, net of long-term financial receivables
classified in net financial debt
- Other current receivables and payables, net of short-term financial receivables classified
in net financial debt
PRYSMIAN GROUP | DIRECTORS' REPORT
37
- Current tax payables
• Provisions and net deferred taxes: sum of the following items contained in the statement
of financial position:
- Provisions for risks and charges – current portion
- Provisions for risks and charges – non-current portion
- Provisions for deferred tax liabilities
- Deferred tax assets
• Net capital employed: sum of Net fixed assets, Net working capital and Provisions.
• Employee benefit obligations and Total equity: these indicators correspond to Employee
benefit obligations and Total equity reported in the statement of financial position.
• Net financial debt: sum of the following items:
- Borrowings from banks and other lenders – non-current portion
- Borrowings from banks and other lenders – current portion
- Derivatives on financial transactions recorded as Non-current derivatives and classified
under Long-term financial receivables
- Derivatives on financial transactions recorded as Current derivatives and classified under
Short-term financial receivables
- Derivatives on financial transactions recorded as Non-current derivatives and classified
under Long-term financial payables
- Derivatives on financial transactions recorded as Current derivatives and classified under
Short-term financial payables
- Medium/long-term financial receivables recorded in Other non-current receivables
- Loan arrangement fees recorded in Other non-current receivables
- Short-term financial receivables recorded in Other current receivables
- Loan arrangement fees recorded in Other current receivables
- Financial assets at amortised cost
- Financial assets at fair value through profit or loss
- Financial assets at fair value through other comprehensive income
- Cash and cash equivalents
PRYSMIAN GROUP | DIRECTORS' REPORT
38
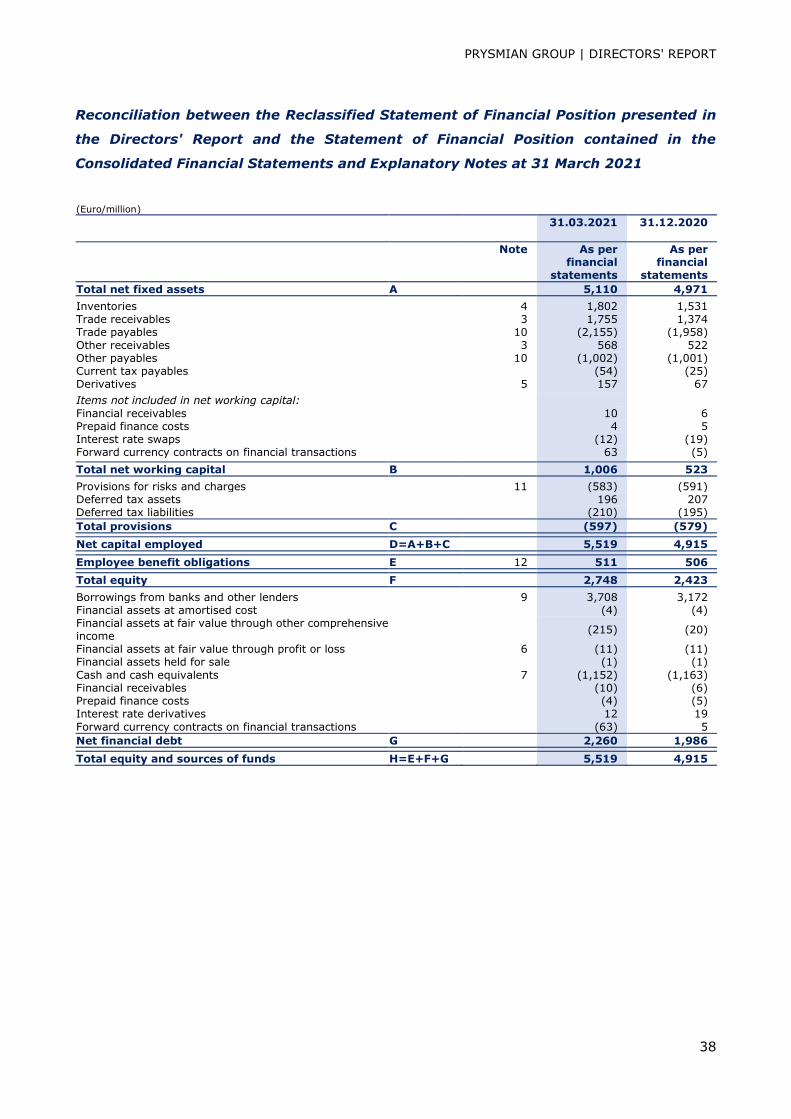
Reconciliation between the Reclassified Statement of Financial Position presented in
the Directors' Report and the Statement of Financial Position contained in the
Consolidated Financial Statements and Explanatory Notes at 31 March 2021
(Euro/million)
31.03.2021 31.12.2020
Note As per
financial statements
As per financial
statements
Total net fixed assets A 5,110 4,971 Inventories 4 1,802 1,531 Trade receivables 3 1,755 1,374 Trade payables 10 (2,155) (1,958)
Other receivables 3 568 522 Other payables 10 (1,002) (1,001) Current tax payables (54) (25) Derivatives 5 157 67 Items not included in net working capital:
Financial receivables 10 6 Prepaid finance costs 4 5 Interest rate swaps (12) (19) Forward currency contracts on financial transactions 63 (5)
Total net working capital B 1,006 523 Provisions for risks and charges 11 (583) (591) Deferred tax assets 196 207 Deferred tax liabilities (210) (195)
Total provisions C (597) (579)
Net capital employed D=A+B+C 5,519 4,915
Employee benefit obligations E 12 511 506
Total equity F 2,748 2,423 Borrowings from banks and other lenders 9 3,708 3,172 Financial assets at amortised cost (4) (4) Financial assets at fair value through other comprehensive income
(215) (20)
Financial assets at fair value through profit or loss 6 (11) (11) Financial assets held for sale (1) (1)
Cash and cash equivalents 7 (1,152) (1,163) Financial receivables (10) (6) Prepaid finance costs (4) (5) Interest rate derivatives 12 19
Forward currency contracts on financial transactions (63) 5
Net financial debt G 2,260 1,986
Total equity and sources of funds H=E+F+G 5,519 4,915
PRYSMIAN GROUP | DIRECTORS' REPORT
39
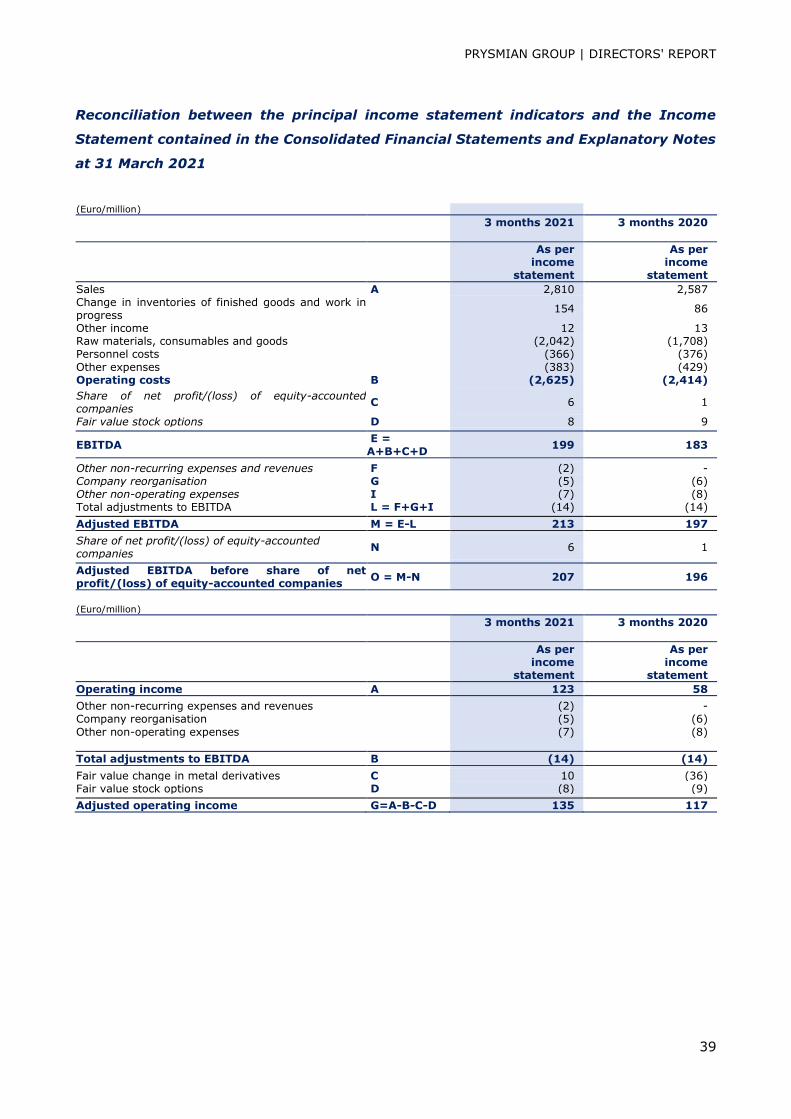
Reconciliation between the principal income statement indicators and the Income
Statement contained in the Consolidated Financial Statements and Explanatory Notes
at 31 March 2021
(Euro/million)
3 months 2021 3 months 2020
As per
income statement
As per income
statement
Sales A 2,810 2,587 Change in inventories of finished goods and work in progress
154 86
Other income 12 13 Raw materials, consumables and goods (2,042) (1,708) Personnel costs (366) (376)
Other expenses (383) (429) Operating costs B (2,625) (2,414) Share of net profit/(loss) of equity-accounted companies
C 6 1
Fair value stock options D 8 9
EBITDA E = A+B+C+D
199 183 Other non-recurring expenses and revenues F (2) - Company reorganisation G (5) (6) Other non-operating expenses I (7) (8) Total adjustments to EBITDA L = F+G+I (14) (14)
Adjusted EBITDA M = E-L 213 197 Share of net profit/(loss) of equity-accounted companies
N 6 1
Adjusted EBITDA before share of net profit/(loss) of equity-accounted companies
O = M-N 207 196
(Euro/million) 3 months 2021 3 months 2020
As per
income statement
As per income
statement
Operating income A 123 58 Other non-recurring expenses and revenues (2) - Company reorganisation (5) (6)
Other non-operating expenses (7) (8)
Total adjustments to EBITDA B (14) (14) Fair value change in metal derivatives C 10 (36) Fair value stock options D (8) (9)
Adjusted operating income G=A-B-C-D 135 117
PRYSMIAN GROUP | DIRECTORS' REPORT
40
BUSINESS OUTLOOK
The year 2020 was characterised by the spread of the Covid-19 pandemic, which had
unprecedented negative effects on the global macroeconomic scenario. Economic activity was
slowed considerably by the containment measures taken by most countries to combat the spread
of the virus, including restrictions on movement, quarantines and other public emergency
measures, with severe repercussions on the entire economy. In response to this scenario, many
countries prepared national plans to relaunch their economies in support of infrastructure and
digitalisation projects.
According to the most recent estimates by the International Monetary Fund, the global economy
is expected to grow by 6.0% in 2021 after contracting by 3.3% in the previous year. These
estimates represent an improvement compared to October, when the decline was expected to
amount to 4.4% in 2020, followed by expansion of 5.2% in 2021. This improvement reflects the
faster-than-expected growth in the second half of the previous year for most countries following
the easing of restrictions. In addition, the stronger forecasts also reflect expectations of positive
effects on growth due to the execution of the vaccination plan currently underway in many
countries.
At the geographical level, the United States — with estimated growth of 6.4% — are expected
to return to the levels of activity seen at the end of 2019 as early as this year, whereas in the
Eurozone and the United Kingdom this recovery is expected to occur in the following year. The
Chinese economy — the only major economy to close 2020 on a positive note (+2.3%) — is
expected to pick up pace, with estimated growth of 8.4% in 2021.
In 2020, the extraordinary impacts of the Covid-19 pandemic also had an effect on the Prysmian
Group’s results, above all in businesses relating to the construction sector (Trade & Installers)
and characterised by significant installation activities. The gradual recovery of business,
accompanied by timely cost management, an extremely flexible supply chain and a highly-
focused level of customer service, enabled management to protect the Group’s performance and
limit the impact of the pandemic on the Group’s margins.
These positive trends were consolidated in early 2021, with the Energy business exceeding pre-
pandemic levels in terms of both volumes and results and with Telecom volumes up considerably
at the global level, although there remains a high level of uncertainty, exacerbated by the effects
of the pandemic on the availability and prices of raw materials.
PRYSMIAN GROUP | DIRECTORS' REPORT
41
Within this macroeconomic scenario, Prysmian Group expects that in 2021 demand in the
construction and industrial cable businesses will recover compared to the previous year. In the
submarine systems and cables business, the Group is committed to confirming its leadership in
a market that is expected to grow, in 2021 and in subsequent years, thanks to the development
of the offshore wind farms and interconnections required for fostering renewable energy in
support of the energy transition. With regard to this segment, the Group expects an
improvement compared to the previous year’s results, with a more marked growth starting in
2022, when also the German Corridors projects will reach a more advanced stage of execution.
In the Telecom segment, the Group forecasts an increase in volumes of the optical cable business
in North America and Europe and a persisting price pressure, particularly in Europe. According
to estimates, this could generate a decrease in margins, despite the action plan implemented to
contain cost and improve production efficiency.
Prysmian Group continues to pursue long-term growth drivers mainly relating to the energy
transition to renewable sources, the upgrade of telecommunications networks (digitalisation)
and the electrification process. The Group may also rely on broad diversification by business and
geographical area, a solid financial structure, an efficient, flexible supply chain and a lean
organisation — all factors enabling the Group to face the emergency with confidence.
In light of the foregoing considerations, the Group confirms, with increased confidence, the
guidance announced in March 2021 calling for an Adjusted EBITDA within a range of Euro 870-
Euro 940 million in 2021. In addition, the Group expects to generate cash flows of approximately
Euro 300 million ± 20% (FCF before acquisitions and disposals) in 2021. These projections are
based on the absence of significant changes in the evolution of the health emergency and of
possible further discontinuities and slowdowns in the global economic activities. In addition,
these forecasts are based on the Company’s current business scope and do not include antitrust-
related impacts on cash flow. In 2021 as well, the translation effect resulting from the conversion
of the subsidiaries’ results into the reporting currency used in the consolidated accounts is
expected to generate a negative impact on the Group’s operating income of approximately Euro
20-25 million. The (expected) cumulative amount of the negative impact of exchange rates in
the two-year period 2020-2021 is estimated at around Euro 55 million.
PRYSMIAN GROUP | DIRECTORS' REPORT
42
FORESEEABLE RISKS IN 20211
Prysmian Group is exposed in the normal conduct of its business to a number of financial and
non-financial risk factors which, if they should occur, could also have a material impact on its
results of operations and financial condition. The Group has always acted to maximise value for
its shareholders by putting in place all necessary measures to prevent or mitigate the risks
inherent in the Group's business, which is why it adopts specific procedures to manage the risk
factors that could influence its business results. Given operating performance in the first three
months of the year and the specific macroeconomic context, the principal risk factors currently
foreseeable for subsequent quarters of 2021 are described below according to their nature.
STRATEGIC RISKS
Risks associated with the competitive environment
Many of the products offered by Prysmian Group, primarily in the Trade & Installers and Power
Distribution businesses, are made in conformity with specific industrial standards and so are
interchangeable with those offered by major competitors. Price is therefore a key factor in
customer choice of supplier. The entry into mature markets (e.g. Europe) of non-traditional
competitors, meaning small to medium manufacturing companies with low production costs, and
the need to saturate production capacity, together with the possible occurrence of a contraction
in market demand, translate into strong competitive pressure on prices, with possible
consequences for the Group's expected margins.
In addition, high value-added segments - like High Voltage underground cables, Optical Cables
and Submarine cables - are seeing an escalation in competition from both existing operators and
new market entrants with leaner more flexible organisation models, with potentially negative
impacts on both sales volumes and selling prices. With particular reference to the Submarine
cables business, the high barriers to entry, linked to difficult-to-replicate ownership of
technology, know-how and track record, are driving large market players to compete not so
much on the product as on the related services.
The strategy of rationalising production facilities currently in progress, the consequent
optimisation of cost structure, the policy of geographical diversification and, last but not least,
the ongoing pursuit of innovative technological solutions, all help the Group to address the
potential effects arising from the competitive environment.
1 The risks described in this section are those that, at the date of the present document, the Group believes, if they were
to occur, could have a material adverse near-term impact on its business, financial condition, earnings and future
prospects.
PRYSMIAN GROUP | DIRECTORS' REPORT
43
Risks associated with changes in macroeconomic conditions and demand
Factors such as trends in GDP and interest rates, the ease of getting credit, the cost of raw
materials, and the general level of energy consumption, significantly affect the energy demand
of countries which, in the face of persistent economic difficulties, then reduce investments that
would otherwise develop the market. Government incentives for alternative energy sources and
for developing telecom networks also face reduction for the same reason. Prysmian Group's
transmission business (high voltage submarine cables) and Power Distribution and Telecom
businesses, all highly concentrated in the European market, are being affected by shifting
contractions of demand within this market, caused by the region's prolonged economic
downturn.
To counter this risk, the Group is pursuing, on the one hand, a policy of geographical
diversification in non-European countries and, on the other, a strategy to reduce costs by
rationalising its manufacturing footprint around the world in order to mitigate possible negative
effects on the Group's performance in terms of lower sales and shrinking margins.
In addition, the Group constantly monitors developments in the global geopolitical environment
which, as a result - for example - of the introduction of specific industrial policies by individual
countries, could require it to revise existing business strategies and/or adopt mechanisms to
safeguard the Group's competitive position.
Key customer dependence risks
The many and diverse types of customers (power transmission and telecom systems operators,
distributors, installers, etc.) and their distribution across an equally wide number of different
countries mitigate customer dependence risk at a group level.
Risk of instability in the Group's countries of operation
Prysmian Group operates and has production facilities and/or companies in Asia, Latin America,
the Middle East, Africa and Eastern Europe. The Group's operations in these countries are
exposed to different risks linked to local regulatory and legal systems, the imposition of tariffs
or taxes, exchange rate volatility, and political and economic instability affecting the ability of
business and financial partners to meet their obligations.
Significant changes in the macroeconomic, political, tax or legislative environment of such
countries could have an adverse impact on the Group's business, results of operations and
financial condition; consequently, as already mentioned in an earlier paragraph, the Group
constantly monitors developments in the global geopolitical environment which could require it
to revise existing business strategies and/or adopt mechanisms to safeguard its competitive
position.
PRYSMIAN GROUP | DIRECTORS' REPORT
44
Risk of market contraction or softer demand due to Covid-19
The global macroeconomic situation deteriorated over the course of 2020 due to the spread of
the Covid-19 pandemic.
In response to this health emergency, governments in most countries have adopted containment
measures, including travel bans, quarantines and other public emergency measures, with serious
repercussions for economic activity and the entire production system. The program of
extraordinary measures, swiftly deployed by the Group since the onset of the Covid-19
pandemic, has proved effective and put people first. Accordingly, in order to preserve the
permanent employment of its resources, steps have been taken to safeguard the health of
employees, including through the ongoing performance of tests and provision of hygiene
materials and personal protective equipment. The Group has also implemented a series of
measures intended to mitigate risks arising from the Covid-19 pandemic with the purpose of
defending its cash generating capability, through rigorous working capital management and
effective cost monitoring designed to reduce both fixed and variable expenditure. A much more
rigorous investment policy has also been adopted, while preserving a strategic allocation of
resources.
The situation caused by the Covid-19 pandemic is expected to improve in the coming months,
mainly thanks to the roll-out of vaccinations. However, it is not possible to rule out the risk of
recurrent impacts on demand or the economy as a whole in the course of 2021.
FINANCIAL RISKS
Prysmian Group's risk management strategy focuses on the unpredictability of markets and aims
to minimise the potentially negative impact on the Group's financial performance. Some types
of risk are mitigated by using financial instruments (including derivatives).
Financial risk management is centralised with the Group Finance department which identifies,
assesses and hedges financial risks in close cooperation with the Group's operating companies.
The Group Finance, Administration and Control department provides guidelines on risk
management, with particular attention to exchange rate risk, interest rate risk, credit risk, the
use of derivative and non-derivative instruments, and on how to invest excess liquidity. Such
financial instruments are used solely to hedge risks and not for speculative purposes.
Risks associated with availability of financial resources and their cost
The volatility of the international banking and financial system could be a potential risk factor in
terms of obtaining finance and its associated cost. In addition, non-compliance with the financial
and non-financial covenants contained in the Group's credit agreements could restrict its ability
to increase its net indebtedness, other conditions remaining equal. In fact, should it fail to satisfy
one of these covenants, this would trigger a default event which, unless resolved under the
PRYSMIAN GROUP | DIRECTORS' REPORT
45
terms of the respective agreements, could lead to their termination and/or early repayment of
any credit drawn down. In such an eventuality, the Group might be unable to repay the amounts
demanded early, in turn giving rise to a liquidity risk.
Given the current amount of financial resources and undrawn committed credit lines, totalling in
excess of Euro 2 billion at 31 March 2021, and six-monthly monitoring1 of financial covenant
compliance (fully satisfied at 31 December 2020), the Group is of the opinion that this risk is
significantly mitigated and that it is capable of raising sufficient financial resources at a
competitive cost.
Exchange rate volatility
Prysmian Group operates internationally and is therefore exposed to exchange rate risk on the
currencies of the different countries in which it operates. Exchange rate risk occurs when future
transactions or assets and liabilities recognised in the statement of financial position are
denominated in a currency other than the functional currency of the company which undertakes
the transaction.
To manage exchange rate risk arising from future trade transactions and from the recognition
of foreign currency assets and liabilities, most Prysmian Group companies use forward contracts
arranged by Group Treasury, which manages the various positions in each currency. However,
since Prysmian prepares its consolidated financial statements in Euro, fluctuations in the
exchange rates used to translate the financial statements of subsidiaries, originally expressed in
a foreign currency, could affect the Group's results of operations and financial condition.
Exchange rate volatility is monitored both locally and centrally, by the Group Finance
department, also using specific indicators designed to intercept potential risk situations which,
when thought to exceed the defined tolerance limits, will trigger immediate mitigating actions.
A more detailed analysis of the risk in question can be found in the 2020 Annual Financial Report.
Interest rate volatility
Changes in interest rates affect the market value of Prysmian Group's financial assets and
liabilities as well as its net finance costs. The interest rate risk to which the Group is exposed is
mainly on long-term financial liabilities, carrying both fixed and variable rates. Fixed rate debt
exposes the Group to a fair value risk. The Group does not operate any particular hedging policies
in relation to the risk arising from such contracts since it considers this risk to be immaterial.
Variable rate debt exposes the Group to a rate volatility risk (cash flow risk). The Group is able
to use interest rate swaps (IRS) to hedge this risk, which transform variable rates into fixed
ones, thus reducing the rate volatility risk. IRS contracts make it possible to exchange on
1 The financial covenants are measured at the half-year reporting date of 30 June and at the full-year reporting date of
31 December.
PRYSMIAN GROUP | DIRECTORS' REPORT
46
specified dates the difference between contracted fixed rates and the variable rate calculated
with reference to the loan's notional value. A potential rise in interest rates, from the record lows
reached in recent years, could represent a risk factor in coming quarters.
A more detailed analysis of the risk in question can be found in the 2020 Annual Financial Report.
Credit risk
Credit risk is represented by Prysmian Group's exposure to potential losses arising from the
failure of business or financial partners to discharge their obligations. This risk is monitored
centrally by the Group Finance department, while customer-related credit risk is managed
operationally by the individual subsidiaries. The Group does not have any excessive
concentrations of credit risk, but given the economic and social difficulties faced by some
countries in which it operates, the exposure could undergo a deterioration that would require
closer monitoring. Accordingly, the Group has procedures in place to ensure that its business
partners are of proven reliability and that its financial partners have high credit ratings. In
addition, in mitigation of credit risk, the Group has a global trade credit insurance program
covering almost all its operating companies; this is managed centrally by the Risk Management
department, which monitors, with the assistance of the Group's Credit Management function,
the level of exposure to risk and intervenes when tolerance limits are exceeded due to possible
difficulty in finding coverage on the market.
A more detailed analysis of the risk in question can be found in the 2020 Annual Financial Report.
Liquidity risk
Liquidity risk indicates the sufficiency of an entity's financial resources to meet its obligations to
business or financial partners on the agreed due dates.
With regard to Prysmian Group's working capital cash requirements, these increase significantly
during the first half of the year when it commences production in anticipation of order intake,
with a consequent temporary increase in net financial debt.
Prudent management of liquidity risk involves the maintenance of adequate levels of cash, cash
equivalents and short-term securities, the availability of sufficient committed credit lines, and
timely renegotiation of loans before their maturity. Given the dynamic nature of the business in
which Prysmian Group operates, the Group Finance department prefers flexible forms of funding
in the form of committed credit lines.
As at 31 March 2021, the Group's total financial resources and undrawn committed credit lines
are in excess of Euro 2 billion.
A more detailed analysis of the risk in question can be found in the 2020 Annual Financial Report.
PRYSMIAN GROUP | DIRECTORS' REPORT
47
Commodity price volatility risk
The main commodities purchased by Prysmian Group are copper, aluminium and lead,
accounting for more than 50% of the total raw materials used to manufacture its products. The
Group neutralises the impact of possible variations in the price of copper and aluminium and,
although less significant, of lead through hedging activities and automatic sales price adjustment
mechanisms. Hedging activities are based on sales contracts or sales forecasts, which if not met,
could expose the Group to the risk of price volatility in the underlying assets.
A dedicated team within the Group Purchasing department monitors and coordinates centrally
those sales transactions requiring the purchase of metals and the related hedging activities
carried out by each subsidiary, ensuring that the level of exposure to risk is kept within defined
tolerance limits.
A more detailed analysis of the risk in question can be found in the 2020 Annual Financial Report.
OPERATIONAL RISKS
Liability for product quality/defects
Possible defects in the design and manufacture of Prysmian Group's products could give rise to
civil or criminal liability towards its customers or third parties. Therefore, the Group, like other
companies in the industry, is exposed to the risk of legal action for product liability in the
countries where it operates. In line with the practice followed by many industry operators, the
Group has taken out insurance which it considers provides adequate protection against the risks
arising from such liability. Should such insurance coverage prove insufficient, the Group's results
of operations and financial condition could be adversely affected.
In addition, the Group's involvement in this kind of legal action and any resulting liability could
expose it to reputational damage, with potential further adverse consequences for its results of
operations and financial condition.
Risks associated with non-compliance with the contractual terms of turnkey projects
Projects for high/medium voltage submarine or underground power cables are characterised by
contractual forms entailing a "turnkey" or end-to-end type of project management that therefore
demands compliance with deadlines and quality standards, guaranteed by penalties calculated
as an agreed percentage of the contract value and that can even result in contract termination.
The application of such penalties, the obligation to pay damages as well as indirect effects on
the supply chain in the event of late delivery or manufacturing problems, could significantly
affect project performance and hence the Group's margins. Possible damage to market
reputation cannot be ruled out.
PRYSMIAN GROUP | DIRECTORS' REPORT
48
Given the complexity of "turnkey" projects, Prysmian has implemented a quality management
process involving a wide range of tests on cables and accessories before delivery and installation,
as well as specific ad hoc insurance coverage, often through insurance syndicates, able to
mitigate exposure to risks running from the manufacturing stage through to delivery.
In addition, the ERM assessments for this particular risk have led the Risk Management
department, with the support of the Sales department, to implement a systematic process of
Project Risk Assessment for all "turnkey" projects, involving the assignment of a Project Risk
Manager, right from the bidding stage, with the aim of identifying, assessing and monitoring
over time the Group's exposure to specific risks and of foreseeing the necessary mitigation
actions. The decision to present a bid proposal to a customer will therefore also depend on the
results of risk assessment.
Management periodically carries out risk assessment for completed and ongoing contracts and
analyses the risks involved. The Group has set aside specific provisions for such risks that
represent the best estimate of the related liabilities based on available information.
Business interruption risk due to dependence on key assets
The submarine cables business is heavily dependent on certain key assets, such as the Arco
Felice plant in Italy for the production of a particular type of cable and one of the cable-laying
vessels owned by the Group (the "Giulio Verne"), some of whose technical capabilities are hard
to find on the market. The loss of one of these assets due to unforeseen natural disasters (e.g.
earthquakes, storms, etc.) or other incidents (e.g. fire, terrorist attacks, etc.) and the
consequent prolonged business interruption could have a critical economic impact on the Group's
performance.
Work began in 2018 on building the "Leonardo da Vinci", a new cable-laying vessel with a best-
in-class specification. The new vessel will enter into service in the second quarter of 2021, as a
result of which the risk of dependence on the "Giulio Verne" will be significantly reduced.
Prysmian addresses asset dependency risk by having:
- a systematic Loss Prevention program, managed centrally by the Risk Management
department, which, through periodic on-site inspections, allows the adequacy of existing
systems of protection to be assessed and any necessary remedial actions decided to
mitigate the estimated residual risk. As at 31 December 2020, the Group's operating
plants were sufficiently protected and there were no significant exposures to risk. All the
plants have been classified as "Excellent Highly Protected Rated (HPR)", "Good HPR" or
"Good not HPR", in accordance with the methodology defined by internationally
recognised best practices in the field of Risk Engineering & Loss Prevention;
- specific disaster recovery & business continuity plans which allow appropriate
countermeasures to be activated as soon as possible in order to minimise the impact of
a catastrophic event and to manage any consequent crisis;
PRYSMIAN GROUP | DIRECTORS' REPORT
49
- specific insurance schemes covering damage to assets and loss of associated contribution
margin due to business interruption, such as to minimise the financial impact of this risk
on cash flow.
Environmental risks
The Group's production activities are subject to specific environmental regulations, amongst
which those concerning the management of raw materials, energy resources and hazardous
substances, water discharges, air emissions and waste, including pollution prevention and
minimisation of impacts on environmental factors (soil, subsoil, water resources, atmosphere).
The evolution of such regulations is towards an ever stricter compliance burden on businesses,
often implying adaption of technologies (Best Available Techniques) and risk prevention systems,
with the associated costs.
Considering the Group's large number of plants, the probability of an accident, with
consequences not only for the environment but also for the continuity of production, cannot be
ignored or the resulting economic and reputational impact, which could be significant.
In order to prevent and mitigate environmental risks, the Group has adopted an ISO14000
certified environmental management system at most of its production sites.
Environmental issues are managed centrally by the HQ Health Safety & Environment (HSE)
department which, by coordinating local HSE departments, is responsible for adopting systems
to ensure strict compliance with legislation in accordance with best practice, for collecting and
analysing environmental data via a centralised platform, for monitoring risk exposure using
specific indicators, for organising specific training activities and carrying out audits at production
sites.
Cyber security risks
The growing spread of web-based technologies and business models allowing the transfer and
sharing of sensitive information through virtual spaces (i.e. social media, cloud computing, etc.)
carries computing vulnerability risks which Prysmian Group cannot ignore in the conduct of its
business. Exposure to potential cyberattacks could be due to several factors such as the
necessary distribution of IT systems around the world, and the possession of high value-added
information such as patents, technology innovation projects, as well as financial projections and
strategic plans not yet disclosed to the market, unauthorised access to which could damage a
company's results, financial situation and image. In partnership with the Risk Management
department, the Group's IT Security function periodically performs specific assessments to
identify any vulnerabilities in IT systems locally and centrally that could compromise business
continuity.
Furthermore, since 2016 Prysmian Group has started to implement a structured and integrated
process for managing cyber security risks which, under the leadership of the Group IT Security
PRYSMIAN GROUP | DIRECTORS' REPORT
50
function, in partnership with the Risk Management department, aims to strengthen the Group's
IT systems and platforms and introduce robust mechanisms to prevent and control any
cyberattacks. A clear Information Security strategy has been defined in this regard setting out
the governance structure adopted by the Group and the guidelines for managing cyber risk within
IT architectures and business processes. A special Information Security Committee, consisting
of the key figures involved in managing cyber risk1, has been appointed with the mission of
defining the strategic and operational Cyber Security objectives, of coordinating the main
initiatives undertaken, and of examining and approving policies, operating procedures and
instructions. The Committee is convened on a periodic basis (twice a year) and in any case upon
the occurrence of any significant events or crises. Lastly, specific e-learning training sessions
have been provided to all the Group's IT staff with the aim of raising their awareness of this
issue.
Risk of lack or loss of key resources
The Group is exposed to the risk of lack or loss of key resources with strategic operational roles.
Such persons can be identified by their managerial responsibilities and/or specific know-how,
necessary for the implementation of corporate strategies, and are hard to replace quickly.
In order to ensure business continuity in line with its strategic objectives, the Group has
established the following:
• "Job Band Program" to define the classification of personnel through a due job weighting with
respect to responsibility, problem solving and know-how, in line with company strategies,
using a common, global organisational language;
• "Group Academy" to train and develop the following skills within the Group: Leadership
(Management School), Technical (Professional School) and E-Learning (Digital School);
• "Make it", "Sell it", "Sum it" recruitment programs for professionals in the production, quality,
procurement, logistics, sales and finance functions;
• "People Performance Program" to manage career paths;
• "Talent Management Program" to accelerate development of our talents;
• "Long-Term Incentive Program" to motivate and retain the Group's key managers;
• "Graduate Program" aimed at attracting and recruiting talented, high-potential personnel to
ensure successful future staff replacements internally;
1 The following sit, as permanent members, on the Information Security Committee: the Chief Operating Officer, the
Vicepresident HR&Organization, the Chief Security Officer, the Chief Information Officer, the Chief Risk Officer, the Chief
Audit & Compliance Officer and the Group's IT Security Manager.
PRYSMIAN GROUP | DIRECTORS' REPORT
51
• "Non-compete agreements" formalised for those employees who possess technical process
and product innovation know-how representing strategic value added for the business in its
particular competitive sector.
Finally, Internal Job Posting was launched at a regional level in 2020, with the aim of making it
global at a later date, to facilitate the development of people's cross-functional skills and
continue to build a global corporate culture.
Key supplier dependence risks
In carrying out its operations, Prysmian Group relies on many suppliers of goods and services,
some of which are important suppliers of raw materials like, for example, certain metals (copper,
aluminium and lead) and some polymer compounds, especially in the high voltage and
submarine cables business.
Dependence on key suppliers obviously constitutes a risk in the event of delivery problems,
quality issues or price rises, and, in the case of certain raw material suppliers, Prysmian is
potentially exposed to their industrial risk (fire, explosion, flood, etc.).
With the objective of preventing and mitigating these risks, the Group has a well-established
qualification system for selecting and working with reliable suppliers of goods and services and,
where possible, identifying possible alternatives to therefore avoid single-source situations.
The mitigation strategy is therefore based on partnerships with a number of key suppliers aimed
at reducing the Group's exposure to supply shortages, on close monitoring of their performance
and on projects and investments in R&D to develop alternative technical solutions.
LEGAL AND COMPLIANCE RISKS
Risks of non-compliance with Code of Ethics, Policies and Procedures
Non-compliance risk generically represents the possibility of incurring legal or administrative
sanctions, material financial losses or reputational damage as a result of violations of prevailing
laws and regulations. Prysmian Group deploys a series of organisational procedures designed to
define the principles of legality, transparency, fairness and honesty through which it operates.
In particular, since its inception, the Group has adopted a Code of Ethics, a document which
contains the ethical standards and the behavioural guidelines that all those engaged in activities
on behalf of Prysmian or its subsidiaries (including managers, officers, employees, agents,
representatives, contractors, suppliers and consultants) are required to observe. Through its
Internal Audit & Compliance department, the Group undertakes to constantly monitor
compliance with and effective application of these rules, not tolerating any kind of violation.
However, despite this ongoing endeavour, strict vigilance and periodic information campaigns,
it is not possible to rule out future episodes of misconduct in breach of policies, procedures or
PRYSMIAN GROUP | DIRECTORS' REPORT
52
the Code of Ethics, and hence of current legislation and regulations, by persons carrying out
activities on Prysmian's behalf, which could result in legal sanctions, fines or reputational
damage, even on a material scale.
Risks of non-compliance with Data Protection (Privacy) legislation
In today's increasingly globalised business environment, with a proliferation of channels and
ways to access information, as well as growth in the volume and types of data managed,
Prysmian is addressing the various data management issues, ranging from compliance with
recent legislation to defence against potential threats to confidentiality, integrity and availability
of information.
Accordingly, it is fundamental to have an overall vision when managing sensitive information,
not only with respect to regulatory compliance but also with respect to security and business
priorities.
Furthermore, Europe's General Data Protection Regulation (GDPR), which came into force in May
2018, has now become one of the main reference points for a renewed commitment to data
protection, particularly personal data.
The personal data protection program adopted by Prysmian is based on the following key
elements, involving the entire corporate structure:
o Implementation of a data-based model, through mapping the personal data processed
by company departments and keeping a record of processing activities;
o Definition of a governance model, intended to comply with the requirements of the GDPR
and other emerging data protection regulations, featuring:
an organisational structure under which the Data Protection Officer (DPO) serves in an advisory
and monitoring capacity where personal data management is concerned, with the duties and
related responsibilities delegated to those materially engaged in data processing activities;
o A set of policies and documents supporting the model (company policies, disclosure
statements, internal appointments, clauses applicable to suppliers, etc.);
o Evaluation and adoption of appropriate technical and organisational measures to ensure
a level of security appropriate to the risk, also with the help of new tools such as Data Protection
Impact Assessment introduced by the GDPR;
o Definition of communication and training material specifically for those parties identified
within the data protection organisational model, so that all the parties involved are aware of the
revised regulatory requirements and take steps to fulfil them;
o Review of video surveillance systems, with particular reference to the new European
guidelines and the regulations applicable in Italy.
Monitoring and support have been provided to Prysmian's many European legal entities,
including the most recent ones acquired from General Cable, in applying the model to ensure its
PRYSMIAN GROUP | DIRECTORS' REPORT
53
consistent application and the establishment of an internationally shared corporate culture in
this regard.
The activities to comply with the recent European legislation are capitalised on as much as
possible in the compliance activities required by other national regulations, including the "Ley
General de Proteccion de Datos", now applicable in Brazil and inspired by the same principles.
Risks of non-compliance with anti-bribery legislation
In recent years, legislators and regulators have devoted much attention to the fight against
bribery and corruption, with a growing tendency to extend responsibility to legal entities as well
as to natural persons. With growing internationalisation, organisations more and more often find
themselves operating in contexts exposed to the risk of bribery and having to comply with a
variety of relevant legislation, such as Italian Legislative Decree 231/2001, Italy's Anti-bribery
Law (Law 190/2012), the Foreign Corrupt Practices Act, the UK Bribery Act etc., all with a
common objective: to fight and repress corruption.
The Group's business model, with a global presence in over 50 countries and a multitude of
product applications, brings it into constant contact with numerous third parties (suppliers,
intermediaries, agents and customers). In particular, the management of large international
projects in the Energy (submarine and high voltage) and Oil & Gas businesses involves having
business relationships, often through local commercial agents and public officials, in countries
at potential risk of corruption (as per the Corruption Perception Index1).
Prysmian Group has therefore implemented a series of actions designed to manage bribery and
corruption on a preventive basis; foremost amongst these is the adoption of an Anti-Bribery
Policy which prohibits the bribery of both public officials and private individuals and requires
employees to abide by it and to observe and comply with all anti-bribery legislation in the
countries in which they are employed or active, if this is more restrictive. In addition, specific e-
learning activities (training and testing) for all Group personnel are periodically conducted to
raise awareness about compliance with this legislation.
In 2019, carrying on from the previous year, Prysmian Group continued the activities defined in
its Anti-Bribery Compliance Program, inspired by the ISO 37001 guidelines for Anti-bribery
management systems, published on 15 October 2016, and intended to strengthen its monitoring
of and focus on compliance issues. This program, in addition to providing greater control over
the management of bribery risk, also aims to minimise the risk of punishment if crimes of
corruption are committed by employees or third parties. The core of the ISO 37001 standard is
the control of third parties (suppliers, intermediaries, agents and customers) through a due
1 The Corruption Perception Index (CPI) is an indicator published annually by Transparency International, used to
measure the perception of public sector corruption in various countries around the world.
PRYSMIAN GROUP | DIRECTORS' REPORT
54
diligence system designed to reveal any critical issues or negative events that undermine the
reputation of third parties with whom Prysmian Group deals.
In this regard, it is noted that in 2019 the Group implemented a "Third Party Program", a new
Group Policy aimed at preventing and managing the risk of corruption arising from relationships
with third parties (such as distributor agents, and certain categories of suppliers). In particular,
prior to establishing any business relationship with third parties, it is mandatory to perform -
through a dedicated online platform - due diligence checks on the third party. As a result, each
third party receives a risk rating (high, medium, low) and is consequently submitted to an
approval process, differing according to the level of risk. This program, introduced in 2019,
continued to run.
Following the acquisition of General Cable, Prysmian Group's Anti-Bribery Compliance Program
has been updated and expanded to include the additional activities in this area envisaged by the
General Cable Compliance Program.
In addition, during 2019, General Cable and Prysmian's compliance policies were revised,
updated and merged in order to have single documents valid for the entire Group.
With specific reference to the Anti-Bribery Compliance Program, during 2020 the related Policy
was revised, along with the Policy on Gifts and Entertainment Expenses.
Lastly, in line with the Group's ongoing commitment to ensure that the financial and personal
interests of its employees and consultants do not conflict with the ability to perform their duties
in a professional, ethical and transparent manner, a new Conflict of Interest policy was issued
in 2019.
In accordance with this policy, in 2020 all employees and consultants were required to disclose
all potential conflicts of interest, which were then duly analysed and evaluated. With the
assistance of the Human Resources department, the necessary corrective actions were then
taken to mitigate or eliminate any potential conflicts.
Risks of non-compliance with antitrust law
Competition rules on restrictive agreements and abuse of dominant position now play a central
role in governing business activities in all sectors of economic life. Its extensive international
presence in more than 50 countries means the Group is subject to antitrust law in Europe and
every other country in the world in which it operates, each with more or less strict rules on the
civil, administrative and criminal liability of parties that violate the applicable legislation. In the
last decade, local Antitrust Authorities have paid increasing attention to commercial activities by
market players, also involving a tendency for international collaboration between authorities
themselves. Prysmian aspires to operate on the market in compliance with the competition rules.
In keeping with the priorities identified by the ERM process, the Board of Directors has adopted
an Antitrust Code of Conduct that all Group employees, Directors and managers are required to
know and abide by in the conduct of their duties and in their dealings with third parties.
PRYSMIAN GROUP | DIRECTORS' REPORT
55
Like with other Policies, following the acquisition of General Cable, the Antitrust Code of Conduct
has also been updated in order to have a single document, valid for the entire Prysmian Group
and designed to provide an overview of the problems associated with applying antitrust law and
the consequent standards of conduct to follow.
More detailed documents on the antitrust regulations in force in the European Union, North
America, China and Australia have also been adopted.
The Antitrust Code of Conduct is an integral part of the training program and is intended to
provide an overview of the issues concerning application of EU and Italian competition law on
collusive practices and abuse of dominant positions, within which specific situations are assessed
on a case-by-case basis. These activities represent a further step in establishing an "antitrust
culture" within the Group by promoting knowledge and raising the accountability of individuals
for their professional duties under antitrust legislation. Training in this area continued to be
pursued in 2020. In particular, due to the Covid-19 emergency, classroom lessons were replaced
by specific online training delivered via the Microsoft Skype/Teams platforms for certain
functions, including Sales, Finance and Procurement. In addition, e-learning modules are
available on the company intranet to support and raise awareness of and attention to this issue
on an ongoing basis.
With regard to the antitrust investigations still in progress, details of which can be found in the
note on Provisions for risks and charges in the Explanatory Notes to the Consolidated Financial
Statements, the Group has a specific provision for risks and charges amounting to approximately
Euro 122 million as at 31 March 2021. Despite the uncertainty of the outcome of the
investigations and legal actions in progress, the amount of this provision is considered to
represent the best estimate of the liability based on the information available at the date of the
current report.
Risks arising from export restrictions
Many countries regulate international trade transactions and enforce laws and regulations
governing trade in products, software, technology and services, including financial transactions
and brokering.
Export control regimes, governed by laws of the United States, the EU (article 215 of the Treaty
on the Functioning of the EU) and the United Nations (Chapter VII of the UN Charter), identify
the parties (natural or legal persons) to whom the application of targeted restrictions (e.g. arms
embargoes, travel bans, financial or diplomatic sanctions, etc.) is mandatory.
Failure to comply may result in the imposition of fines and criminal and/or civil penalties,
including imprisonment.
In order to prevent and mitigate this risk, Prysmian Group has adopted a policy to manage and
control its exports that involves among other things:

PRYSMIAN GROUP | DIRECTORS' REPORT
56
• Monitoring of countries and parties subject to restrictions, as well as the level of restrictions
in force;
• Due Diligence on restricted persons, in order to avoid transactions with prohibited parties,
including screening of Prysmian Group employees and visitors;
• Product classification to determine the applicable export compliance regulations.
Classification allows the Group to understand where and to whom products may be
exported and whether a licence or other permit is required;
• Basic training for all employees on export controls and specific training for staff in functions
responsible for international trade transactions and export controls;
• Requirement for an end-user declaration certifying that the buyer or end-user of
goods/technology complies with applicable export regulations.
PLANNING AND REPORTING RISKS
Planning and reporting risks are related to the adverse effects that irrelevant, untimely or
incorrect information might have on the Group's strategic, operational and financial decisions.
At present, in view of the reliability and effectiveness of internal procedures for reporting and
planning, the Group does not consider these risks to be relevant.
In addition, the risks related to climate change are reproduced below from the Consolidated Non-
Financial Statement (Sustainability Report 2020), in which further details can be found.
Risks related to climate change
Risks related to the availability of water
Prysmian's plants primarily consume water for industrial purposes, in particular for certain
cooling phases of their processes.
Prysmian has analysed water stress, defined as the ratio of demand for water to the amount
available, assuming a time horizon until 2040 and a scenario of high CO2 emissions, to assess
the geographical location of the Group's plants exposed to the risk of reduced water availability.
Most of the plants for which a potential risk was identified adopt production processes that
involve water recirculation designed to reduce consumption. Risk mitigation measures also
include further improvement in the water recirculation percentage and/or the opportunity to
install new recirculation systems to optimise water consumption, where necessary or cost
effective, thus resulting in a low exposure to risk.
PRYSMIAN GROUP | DIRECTORS' REPORT
57
Risks associated with rising sea levels, involving potential damage to production
facilities
The Group has been monitoring the risk of climate change since 2017 and, in particular of rising
sea levels, with the aim of assessing potential impacts on its production facilities.
The results confirm that in the time horizon considered, extending to 2080, in a scenario of high
CO2 emissions, no direct impacts on the Group's production facilities are expected. It should be
noted, however, that the rise in sea level could change with an increased exposure to the risk of
coastal flooding in the wake of severe weather conditions; this scenario, nonetheless, applies to
a very limited number of production facilities and will be monitored to anticipate developments
and introduce additional systems of control where necessary.
Risks related to greater severity of extreme weather events, involving potential
damage to production facilities
The Group constantly monitors the exposure of its production sites to weather events like storms,
floods, hailstorms, etc. and has also assessed its exposure with a time horizon running to 2035,
in a scenario of high CO2 emissions; this assessment has confirmed a low overall exposure to
risks arising from changes in summer and winter rainfall and from rising temperatures, with the
exception of a very small number of facilities in areas with a maximum expected temperature
rise of +1.5°. A sensitivity analysis carried out for the period 2020-2035, assuming an additional
increase in the severity and frequency of extreme weather events, also based on weather events
that have impacted the Group's assets in the last 20 years, has confirmed a low exposure.
Risk of increased production costs due to increased prices for greenhouse gas
emissions (Carbon Tax or Emission Trading Scheme)
This risk relates to a potential increase in production costs due to a wider application of laws and
regulations on GHG emissions, both in the form of taxes (carbon tax) and as an emissions market
(Emission Trading Scheme). In order to mitigate the consequences, the Group constantly
monitors the evolution of laws and regulations on GHG emissions around the world, especially
in countries where it has production sites, and has drawn up a strategic plan with quantitative
targets for the reduction of GHG emissions, monitored using specific indicators.
In addition, in 2020 the Group initiated a process to set medium- and long-term targets for the
reduction of Scope 1 and 2 emissions and to quantify and manage Scope 3 emissions. These
targets will be set on a scientific basis in accordance with the Science-Based Target Initiative
and taking into account expected temperature rise scenarios.
Risk of non-compliance with environmental regulations and those concerning energy
efficiency and management of greenhouse gas emissions, including more stringent
reporting requirements
PRYSMIAN GROUP | DIRECTORS' REPORT
58
Prysmian conducts its business in compliance with national and international environmental
norms and regulations, paying particular attention to the risk of failure to comply or to comply
swiftly with changes in regulations that may occur in its business context. In particular, the
Group has analysed the potential risk of non-compliance with any changes in local legislation
transposing the Energy Efficiency Directive 2012/27/EU (EED) on end-use energy efficiency. In
order to manage this risk, several measures have been deployed, including Energy Audit Plans
at plants, energy efficiency projects, specific training sessions, and adoption of specific indicators
to monitor risk exposure and take prompt action to reduce the risk below the tolerance
thresholds.
In addition, in 2020 the Group initiated a process to set medium- and long-term targets for the
reduction of Scope 1 and 2 emissions and to quantify and manage Scope 3 emissions. These
targets will be set on a scientific basis in accordance with the Science-Based Target Initiative
and taking into account expected temperature rise scenarios.
PRYSMIAN GROUP | DIRECTORS' REPORT
59
RELATED PARTY TRANSACTIONS
Related party transactions do not qualify as either atypical or unusual but form part of the normal
course of business by Group companies. Such transactions take place under market terms and
conditions, according to the type of goods and services provided.
Information about related party transactions, including that required by the Consob
Communication dated 28 July 2006, is presented in Note 20 of the Explanatory Notes.
Milan, 13 May 2021
ON BEHALF OF THE BOARD OF DIRECTORS
THE CHAIRMAN
Claudio De Conto

PRYSMIAN GROUP | CONSOLIDATED FINANCIAL STATEMENTS AND EXPLANATORY NOTES
60
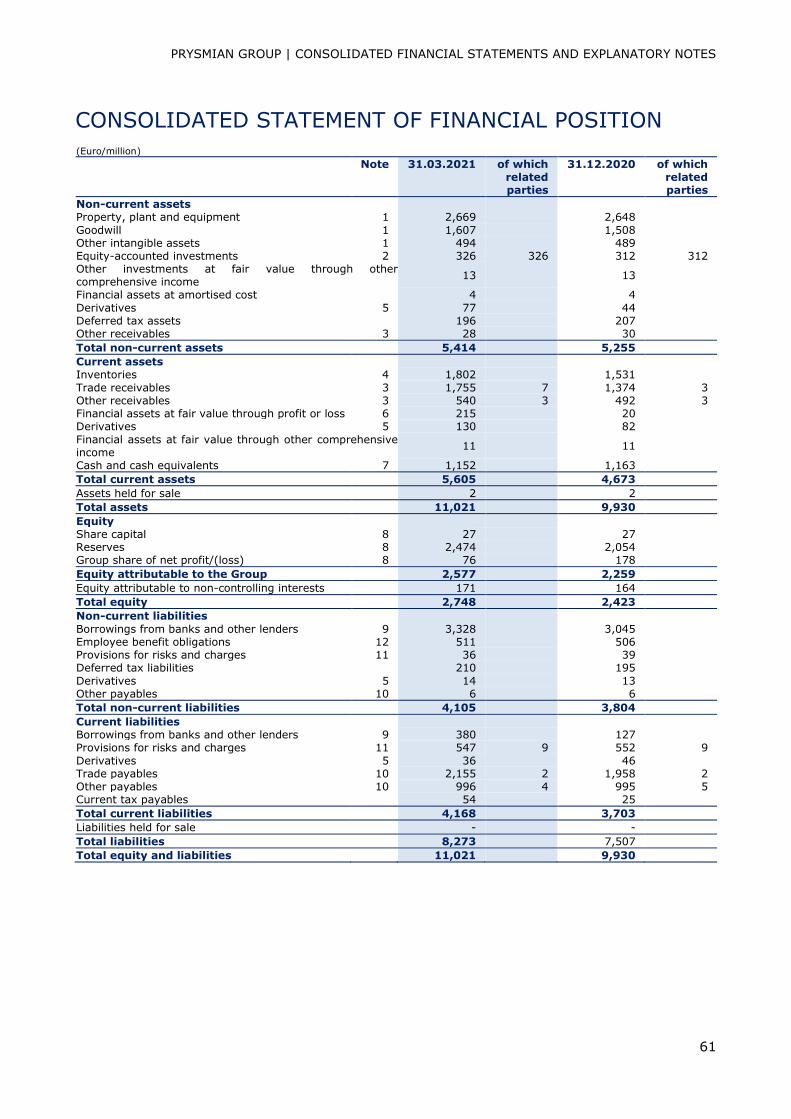
PRYSMIAN GROUP | CONSOLIDATED FINANCIAL STATEMENTS AND EXPLANATORY NOTES
61
CONSOLIDATED STATEMENT OF FINANCIAL POSITION
(Euro/million)
Note 31.03.2021 of which
related parties
31.12.2020 of which related parties
Non-current assets
Property, plant and equipment 1 2,669 2,648
Goodwill 1 1,607 1,508
Other intangible assets 1 494 489
Equity-accounted investments 2 326 326 312 312 Other investments at fair value through other comprehensive income
13 13
Financial assets at amortised cost 4 4
Derivatives 5 77 44
Deferred tax assets 196 207
Other receivables 3 28 30
Total non-current assets 5,414 5,255
Current assets
Inventories 4 1,802 1,531
Trade receivables 3 1,755 7 1,374 3 Other receivables 3 540 3 492 3 Financial assets at fair value through profit or loss 6 215 20
Derivatives 5 130 82
Financial assets at fair value through other comprehensive income
11 11
Cash and cash equivalents 7 1,152 1,163
Total current assets 5,605 4,673
Assets held for sale 2 2
Total assets 11,021 9,930
Equity
Share capital 8 27 27
Reserves 8 2,474 2,054
Group share of net profit/(loss) 8 76 178
Equity attributable to the Group 2,577 2,259
Equity attributable to non-controlling interests 171 164
Total equity 2,748 2,423
Non-current liabilities
Borrowings from banks and other lenders 9 3,328 3,045
Employee benefit obligations 12 511 506
Provisions for risks and charges 11 36 39
Deferred tax liabilities 210 195
Derivatives 5 14 13
Other payables 10 6 6
Total non-current liabilities 4,105 3,804
Current liabilities
Borrowings from banks and other lenders 9 380 127
Provisions for risks and charges 11 547 9 552 9
Derivatives 5 36 46
Trade payables 10 2,155 2 1,958 2 Other payables 10 996 4 995 5 Current tax payables 54 25
Total current liabilities 4,168 3,703
Liabilities held for sale - -
Total liabilities 8,273 7,507
Total equity and liabilities 11,021 9,930
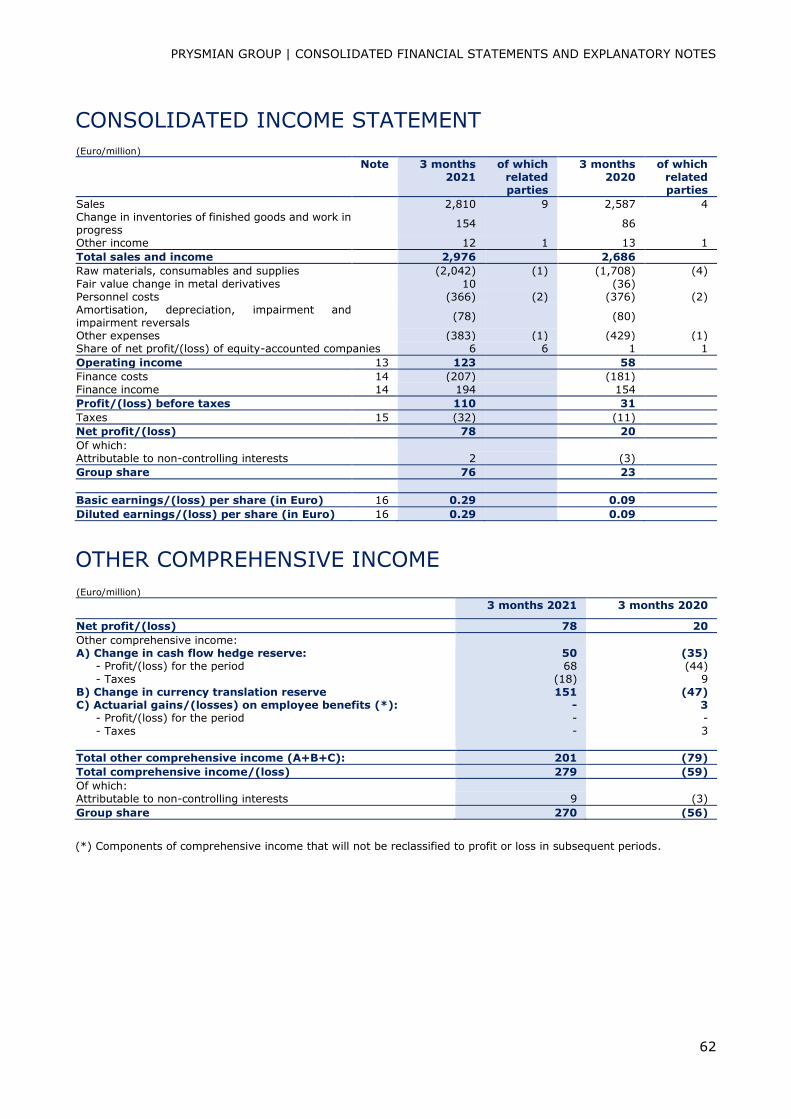
PRYSMIAN GROUP | CONSOLIDATED FINANCIAL STATEMENTS AND EXPLANATORY NOTES
62
CONSOLIDATED INCOME STATEMENT
(Euro/million)
Note 3 months
2021 of which
related parties
3 months 2020
of which related parties
Sales 2,810 9 2,587 4 Change in inventories of finished goods and work in progress
154 86
Other income 12 1 13 1
Total sales and income 2,976 2,686
Raw materials, consumables and supplies (2,042) (1) (1,708) (4)
Fair value change in metal derivatives 10 (36)
Personnel costs (366) (2) (376) (2) Amortisation, depreciation, impairment and impairment reversals
(78) (80)
Other expenses (383) (1) (429) (1) Share of net profit/(loss) of equity-accounted companies 6 6 1 1
Operating income 13 123 58
Finance costs 14 (207) (181)
Finance income 14 194 154
Profit/(loss) before taxes 110 31
Taxes 15 (32) (11)
Net profit/(loss) 78 20
Of which:
Attributable to non-controlling interests 2 (3)
Group share 76 23
Basic earnings/(loss) per share (in Euro) 16 0.29 0.09
Diluted earnings/(loss) per share (in Euro) 16 0.29 0.09
OTHER COMPREHENSIVE INCOME
(Euro/million) 3 months 2021 3 months 2020
Net profit/(loss) 78 20
Other comprehensive income:
A) Change in cash flow hedge reserve: 50 (35) - Profit/(loss) for the period 68 (44)
- Taxes (18) 9
B) Change in currency translation reserve 151 (47) C) Actuarial gains/(losses) on employee benefits (*): - 3
- Profit/(loss) for the period - -
- Taxes - 3
Total other comprehensive income (A+B+C): 201 (79)
Total comprehensive income/(loss) 279 (59)
Of which:
Attributable to non-controlling interests 9 (3)
Group share 270 (56)
(*) Components of comprehensive income that will not be reclassified to profit or loss in subsequent periods.
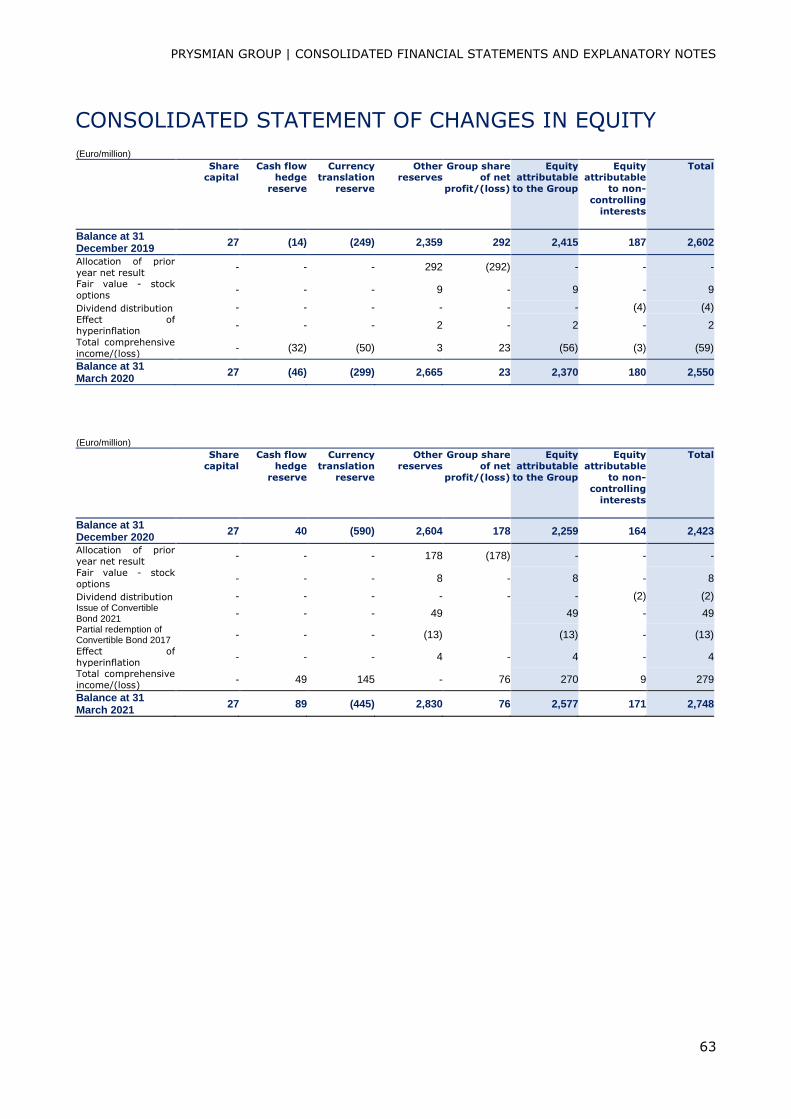
PRYSMIAN GROUP | CONSOLIDATED FINANCIAL STATEMENTS AND EXPLANATORY NOTES
63
CONSOLIDATED STATEMENT OF CHANGES IN EQUITY
(Euro/million)
Share capital
Cash flow hedge
reserve
Currency translation
reserve
Other reserves
Group share of net
profit/(loss)
Equity attributable
to the Group
Equity attributable
to non-
controlling
interests
Total
Balance at 31 December 2019
27 (14) (249) 2,359 292 2,415 187 2,602
Allocation of prior
year net result - - - 292 (292) - - -
Fair value - stock
options - - - 9 - 9 - 9
Dividend distribution - - - - - - (4) (4) Effect of
hyperinflation - - - 2 - 2 - 2
Total comprehensive
income/(loss) - (32) (50) 3 23 (56) (3) (59)
Balance at 31 March 2020
27 (46) (299) 2,665 23 2,370 180 2,550
(Euro/million)
Share
capital
Cash flow
hedge
reserve
Currency
translation
reserve
Other
reserves
Group share
of net
profit/(loss)
Equity
attributable
to the Group
Equity
attributable
to non-
controlling
interests
Total
Balance at 31 December 2020
27 40 (590) 2,604 178 2,259 164 2,423
Allocation of prior
year net result - - - 178 (178) - - -
Fair value - stock
options - - - 8 - 8 - 8
Dividend distribution - - - - - - (2) (2) Issue of Convertible Bond 2021
- - - 49 49 - 49
Partial redemption of Convertible Bond 2017
- - - (13) (13) - (13)
Effect of
hyperinflation - - - 4 - 4 - 4
Total comprehensive
income/(loss) - 49 145 - 76 270 9 279
Balance at 31 March 2021
27 89 (445) 2,830 76 2,577 171 2,748
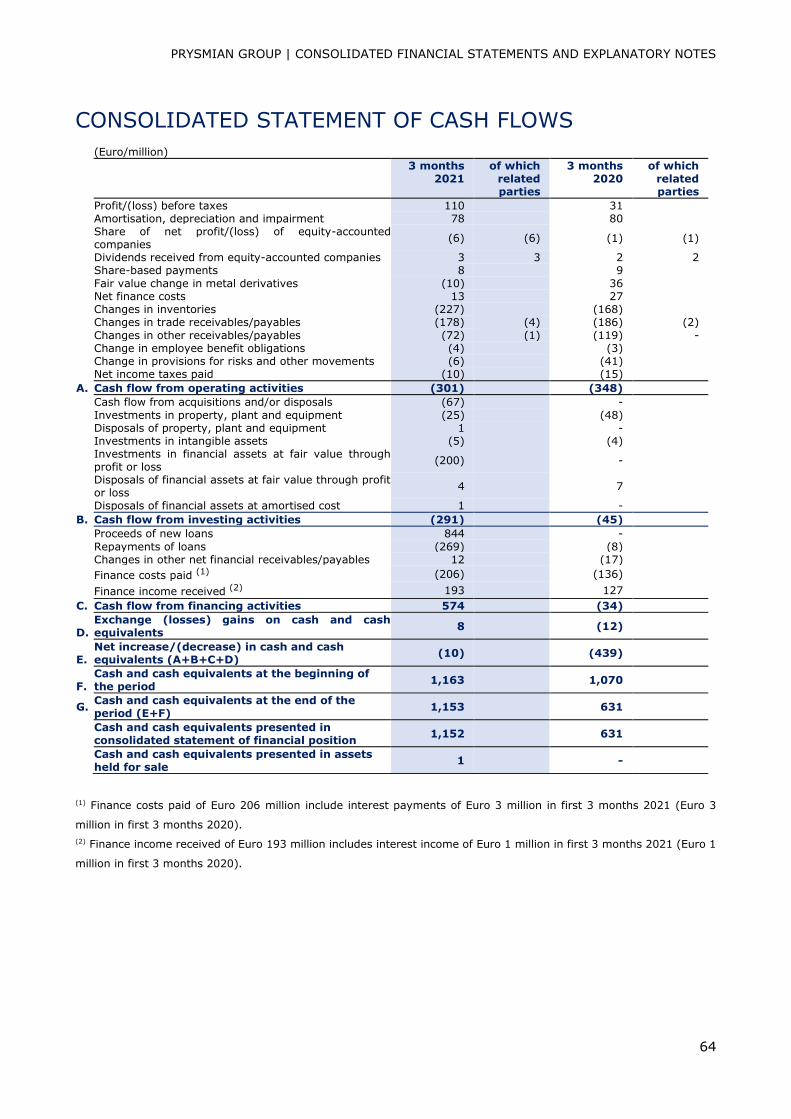
PRYSMIAN GROUP | CONSOLIDATED FINANCIAL STATEMENTS AND EXPLANATORY NOTES
64
CONSOLIDATED STATEMENT OF CASH FLOWS
(Euro/million)
3 months
2021 of which
related parties
3 months 2020
of which related parties
Profit/(loss) before taxes 110 31
Amortisation, depreciation and impairment 78 80
Share of net profit/(loss) of equity-accounted companies
(6) (6) (1) (1)
Dividends received from equity-accounted companies 3 3 2 2
Share-based payments 8 9
Fair value change in metal derivatives (10) 36
Net finance costs 13 27
Changes in inventories (227) (168)
Changes in trade receivables/payables (178) (4) (186) (2)
Changes in other receivables/payables (72) (1) (119) -
Change in employee benefit obligations (4) (3)
Change in provisions for risks and other movements (6) (41)
Net income taxes paid (10) (15)
A. Cash flow from operating activities (301) (348)
Cash flow from acquisitions and/or disposals (67) -
Investments in property, plant and equipment (25) (48)
Disposals of property, plant and equipment 1 -
Investments in intangible assets (5) (4)
Investments in financial assets at fair value through profit or loss
(200) -
Disposals of financial assets at fair value through profit or loss
4 7
Disposals of financial assets at amortised cost 1 -
B. Cash flow from investing activities (291) (45)
Proceeds of new loans 844 -
Repayments of loans (269) (8)
Changes in other net financial receivables/payables 12 (17)
Finance costs paid (1) (206) (136)
Finance income received (2) 193 127
C. Cash flow from financing activities 574 (34)
D. Exchange (losses) gains on cash and cash equivalents
8 (12)
E. Net increase/(decrease) in cash and cash equivalents (A+B+C+D)
(10) (439)
F. Cash and cash equivalents at the beginning of the period
1,163 1,070
G. Cash and cash equivalents at the end of the period (E+F)
1,153 631
Cash and cash equivalents presented in consolidated statement of financial position
1,152 631
Cash and cash equivalents presented in assets held for sale
1 -
(1) Finance costs paid of Euro 206 million include interest payments of Euro 3 million in first 3 months 2021 (Euro 3
million in first 3 months 2020). (2) Finance income received of Euro 193 million includes interest income of Euro 1 million in first 3 months 2021 (Euro 1
million in first 3 months 2020).
PRYSMIAN GROUP | CONSOLIDATED FINANCIAL STATEMENTS AND EXPLANATORY NOTES
65
EXPLANATORY NOTES
A. GENERAL INFORMATION
Prysmian S.p.A. ("the Company") is a company incorporated and domiciled in Italy and organised
under the laws of the Republic of Italy. The Company has its registered office in Via Chiese 6,
Milan (Italy).
Prysmian S.p.A. was floated on the Italian Stock Exchange on 3 May 2007 and since September
2007 has been included in the FTSE MIB index, comprising the top 40 Italian companies by
capitalisation and stock liquidity.
The Company and its subsidiaries (together "the Group" or "Prysmian Group") produce cables
and systems and related accessories for the energy and telecommunications industries, and
distribute and sell them around the globe.
The present Quarterly Financial Report was approved by the Board of Directors of Prysmian
S.p.A. on 13 May 2021 and is not subject to limited review by the auditors.
A.1 SIGNIFICANT EVENTS IN 2021
Prysmian Group completes the acquisition of EHC Global
On 8 January 2021, the Group announced it had completed the acquisition of EHC Global, a
leading manufacturer of strategic components and integrated solutions for the vertical
transportation industry. Established in 1977, EHC Global is a manufacturer and supplier of
escalator handrails, rollers, elevator belts, strategic components and integrated solutions for the
vertical transportation industry. EHC Global also offers a comprehensive range of technical and
installation services for escalators and moving walkways.
The acquisition of EHC Global is in line with Prysmian Group's strategy to develop and strengthen
its value-added businesses. EHC Global is a complementary add-on to the Draka Elevator
business, broadening its product portfolio to include a wide range of escalator products and
services.
Following the acquisition, the Group has consolidated EHC Global with effect from 1 January
2021 as more fully explained in the section on "Business Combinations" to which reference
should be made.
Placement of a Euro 750 million equity-linked bond
On 26 January 2021, the Group announced the successful placement (the "Placement") of an
equity-linked bond (the "Bonds") for an amount of Euro 750 million.
The Bonds, with a 5-year maturity from 2 February 2021 and minimum denomination of Euro
100,000 each, are zero coupon. The issue price is Euro 102.50, representing a yield to maturity
PRYSMIAN GROUP | CONSOLIDATED FINANCIAL STATEMENTS AND EXPLANATORY NOTES
66
of minus 0.49% per annum. The initial price for the conversion of the Bonds into the Company's
ordinary shares is Euro 40.2355, representing a 47.50% premium on the weighted average price
by volume of Prysmian ordinary shares on the Milan Stock Exchange between the start and end
of the book-building process.
The Shareholders' Meeting held on 28 April 2021 authorised the convertibility of the equity-
linked bond and approved the proposal for a share capital increase pursuant to art. 2420-bis,
par. 2, of the Italian Civil Code, in one or more tranches, with the exclusion of pre-emptive rights
under art. 2441, par. 5, of the Italian Civil Code, serving the conversion of the convertible bond
for a maximum nominal amount of Euro 1,864,025.50 through the issue of up to 18,640,255
ordinary shares with nominal value Euro 0.10 each.
The Group has the option to redeem all - but not only some - of the Bonds at their principal
amount from 12 February 2024, should the value of the new and/or existing ordinary shares
exceed 130% of the conversion price for a specified period of time.
Repurchase of the 2017 Bonds
On 26 January 2021, the Group announced a partial repurchase of the Company's outstanding
Euro 500 million zero-coupon equity-linked bonds due in 2022 and issued on 17 January 2017
(the "2017 Bonds").
The total principal of the 2017 Bonds which the Company agreed to repurchase on 2 February
was equal to Euro 250,000,000 representing 50% of the 2017 Bonds initially issued, at a
repurchase price ("Repurchase Price") of Euro 104,250 for each 2017 Bond of face value Euro
100,000.
CDP Loan
On 28 January 2021, a new loan for Euro 75 million over 4.5 years was agreed with Cassa
Depositi e Prestiti S.p.A. (CDP), for the purpose of financing part of the Group's expenditure to
purchase the "Leonardo Da Vinci" cable-laying vessel.
This loan was drawn down in its entirety on 9 February 2021, with a bullet repayment envisaged
at maturity on 28 July 2025.
Interest Rate Swaps (IRS) to hedge the CDP Loan
On 4 February 2021, Prysmian S.p.A. negotiated two IRSs, effective from 9 February 2021, to
hedge the new Euro 75 million loan.
New organisational structure
On 3 February 2021, the Group announced that it had adopted a new organisational structure,
in line with international best practices, with the aim of reinforcing its focus on the strategic
PRYSMIAN GROUP | CONSOLIDATED FINANCIAL STATEMENTS AND EXPLANATORY NOTES
67
opportunities offered by the global transition to low-carbon energy and digitalisation-based
economies.
The introduction of this new structure marks the successful completion of the integration with
General Cable, which has significantly enlarged the Group and broadened its geographical
diversification.
Under the leadership of the CEO, the new organisation will pivot around the following key roles:
- Chief Operating Officer
- Business Divisions
- Group Functions
Under the new organisation, the CEO will further intensify the Group's focus on its organic and
non-organic growth strategy, as well as on accelerating major innovation projects. The two
global megatrends of transition to low-carbon energy and development of telecommunications
networks to support digitalisation are among the major growth opportunities on which the Group
will be focusing to ensure sustainable growth. In order to leverage the Group's wide geographic
presence and customer proximity, while delivering business synergies at the same time, the new
role of Chief Operating Officer (COO) will oversee the Group's operational strategy and
performance and results of the Regions, in conjunction with the Group's three Business Divisions.
The Business Divisions, which report directly to the CEO, are focused on the strategic
development of their different segments, with P&L responsibility for the global Business Units,
in conjunction with the COO. In addition, they drive key decisions on product technology,
production allocation and the most important projects. The Group Functions, reporting directly
to the CEO, guide the governance and harmonisation of the main corporate processes, providing
operational support to all Group entities. With the aim of strengthening the focus on ESG
objectives, a Group Chief Sustainability Officer and a Chief Innovation Officer have been
appointed.
Construction of new fibre-optic Telecom link in Brazil
On 24 February 2021, the Group announced that it will supply 770 km of MINISUB submarine
optical fibre telecom cables to link the city of Macapá to Santarém and Alenquer, located in the
north of the Amazon region, as part of the Norte Conectado project awarded by RNP, Rede
Nacional de Ensino and Pesquisa, a Brazilian internet provider. The MINISUB solution is one of
the most widely used technologies in the world. The cables will be produced at Prysmian's state-
of-the-art manufacturing facility in Nordenham (Germany) and will be delivered in the second
half of 2021.
PRYSMIAN GROUP | CONSOLIDATED FINANCIAL STATEMENTS AND EXPLANATORY NOTES
68
Finalisation of contract worth over Euro 200 million with RWE for Sofia offshore wind
farm
On 29 March 2021, the Group announced the finalisation of a contract with RWE Renewables,
one of the world's largest offshore wind farm developers, for the construction of a turnkey high
voltage submarine and onshore cable system worth over Euro 200 million for the 1.4 gigawatt
(GW) Sofia offshore wind farm. The Group had already announced a preferred bidder agreement
in November 2020.
Prysmian Group will be responsible for the design, supply, installation and commissioning of an
HVDC symmetrical single-core cable system that will connect the wind farm's offshore substation
to the onshore converter station in Teesside. The project requires over 440 km of ±320 kV XLPE-
insulated submarine cables and 15 km of ±320 kV P-Laser-insulated underground cables.
Offshore installation operations will be carried out using the Leonardo da Vinci, Prysmian's new
state-of-the-art cable-laying vessel, the most high performance ship on the market offering
enhanced versatility in project implementation. Project commissioning is expected towards the
end of 2026.
Other significant events
Ravin Cables Limited
In January 2010, Prysmian Group acquired a 51% interest in the Indian company Ravin Cables
Limited (the "Company"), with the remaining 49% held by other shareholders directly or
indirectly associated with the Karia family (the "Local Shareholders"). Under the agreements
signed with the Local Shareholders, after a limited transition period, management of the
Company would be transferred to a Chief Executive Officer appointed by Prysmian. However,
this failed to occur and, in breach of the agreements, the Company's management remained in
the hands of the Local Shareholders and their representatives. Consequently, having now lost
control, Prysmian Group ceased to consolidate the Company and its subsidiary Power Plus Cable
Co. LLC. with effect from 1 April 2012. In February 2012, Prysmian was thus forced to initiate
arbitration proceedings before the London Court of International Arbitration (LCIA), requesting
that the Local Shareholders be declared in breach of contract and ordered to sell the shares
representing 49% of the Company's share capital to Prysmian. In a ruling handed down in April
2017, the LCIA upheld Prysmian's claims and ordered the Local Shareholders to sell the shares
representing 49% of the Company's share capital to Prysmian. However, the Local Shareholders
did not voluntarily enforce the arbitration award and so Prysmian had to initiate proceedings in
the Indian courts in order to have the arbitration award recognised in India. Having gone through
two levels of the court system, these proceedings were finally concluded on 13 February 2020
with the pronouncement of a ruling by the Indian Supreme Court under which the latter
definitively declared the arbitration award enforceable in India. In view of the continuing failure

PRYSMIAN GROUP | CONSOLIDATED FINANCIAL STATEMENTS AND EXPLANATORY NOTES
69
of the Local Shareholders to comply voluntarily, Prysmian has requested the Mumbai court to
enforce the arbitration award so as to purchase the shares representing 49% of the Company's
share capital as soon as possible. This case is currently still pending, slowed down by the ongoing
Covid-19 emergency that has also affected India, and so control of the company is considered
to have not yet been acquired.
PRYSMIAN GROUP | CONSOLIDATED FINANCIAL STATEMENTS AND EXPLANATORY NOTES
70
B. FORM AND CONTENT
The present Quarterly Financial Report has been prepared on a going concern basis, since the
Directors have assessed that there are no financial, operating or other kind of indicators that
might provide evidence of the Group's inability to meet its obligations in the foreseeable future
and particularly in the next 12 months.
The information contained in these Explanatory Notes must be read in conjunction with the
Directors' Report, an integral part of the Quarterly Financial Report, and the annual IFRS
Consolidated Financial Statements at 31 December 2020.
All the amounts shown in the Group's financial statements are expressed in millions of Euro,
unless otherwise stated.
B.1 FINANCIAL STATEMENTS AND DISCLOSURES
The Group has elected to present its income statement according to the nature of expenses,
whereas assets and liabilities in the statement of financial position are classified as current or
non-current. The statement of cash flows has been prepared using the indirect method.
Further to Legislative Decree 25/2016, which came into force on 18 March 2016 and has
eliminated the requirement for quarterly reporting, the Group has prepared the present
Quarterly Financial Report at 31 March 2021 on a voluntary basis and in continuity with its past
reporting format.
When preparing the Quarterly Financial Report, management has made judgements, estimates
and assumptions that affect the value of revenues, costs, assets and liabilities and the
disclosures relating to contingent assets and liabilities at the reporting date. As estimates, these
may differ from the actual results attained in the future. Certain valuation processes, particularly
more complex ones, such as the determination of any fixed asset impairment, are only fully
carried out during the preparation of the year-end consolidated financial statements when all
the necessary information is available.
B.2 ACCOUNTING STANDARDS
Accounting standards used to prepare the Quarterly Financial Report
The basis of consolidation, the methods used to translate financial statements into the
presentation currency, the accounting standards, estimates and policies adopted are the same
as those used for the consolidated financial statements at 31 December 2020, to which reference
should be made for more details, except for income taxes, which are recognised using the best
estimate of the Group's weighted average tax rate expected for the full year.
PRYSMIAN GROUP | CONSOLIDATED FINANCIAL STATEMENTS AND EXPLANATORY NOTES
71
B.3 CHANGES IN THE SCOPE OF CONSOLIDATION
The Group's scope of consolidation includes the financial statements of Prysmian S.p.A. (the
Parent Company) and the companies over which it exercises direct or indirect control, which are
consolidated from the date when control is obtained until the date when such control ceases.
The changes in the scope of consolidation at 31 March 2021, compared with 31 December 2020,
are listed below.
Acquisitions
Acquired companies Nation Date
EHC Brazil Ltda. Brazil 8 January 2021 EHC Global Inc. Canada 8 January 2021
EHC Canada Inc. Canada 8 January 2021 Elator Inc. Canada 8 January 2021 EHC Management Company Inc. Canada 8 January 2021 EHC Escalator Handrail (Shanghai) Co. Ltd. China 8 January 2021
EHC Engineered Polymer (Shanghai) Co. Ltd. China 8 January 2021 EHC Lift Components (Shanghai) Co. Ltd. China 8 January 2021 EHC Technology Development (Shanghai) Co. Ltd. China 8 January 2021 EHC France s.a.r.l. France 8 January 2021
EHC Germany GmbH Germany 8 January 2021 EHC Japan K.K. Japan 8 January 2021 Escalator Handrail (UK) Ltd. United Kingdom 8 January 2021 EHC Spain and Portugal, S.L. Spain 8 January 2021
EHC USA Inc. United States 8 January 2021 EHC Turkey Asansör ve Yürüyen Merdiven Sanayi Limited Şirketi Turkey 8 January 2021
Liquidations
Liquidated companies Nation Date
Draka UK Group Ltd. United Kingdom 23 March 2021
Name changes
For the sake of better understanding the scope of consolidation, the name changes occurring in
the period are as follows:
Name New name Nation Date
Eurelectric Tunisie S.A. Prysmian Cables and Systems Tunisia S.A. Tunisia 22 March 2021
Appendix A to these notes contains a list of the companies included in the scope of consolidation
at 31 March 2021.
C. FINANCIAL RISK MANAGEMENT
The Group's activities are exposed to various forms of risk: market risk (including exchange rate,
interest rate and price risks), credit risk and liquidity risk.
The current Quarterly Financial Report does not contain all the information about financial risks
presented in the Annual Financial Report at 31 December 2020, which should be consulted for a
more detailed analysis.
PRYSMIAN GROUP | CONSOLIDATED FINANCIAL STATEMENTS AND EXPLANATORY NOTES
72
With reference to the risks described in the Annual Financial Report at 31 December 2020, there
have been no material changes in the types of risks to which the Group is exposed or in its
policies for managing such risks.
(a) Fair value measurement
IFRS 13 requires assets and liabilities recognised in the statement of financial position at fair
value to be classified according to a hierarchy that reflects the significance of the inputs used in
measuring fair value.
Financial instruments are classified according to the following fair value measurement hierarchy:
Level 1: Fair value is determined with reference to quoted prices (unadjusted) in active markets
for identical financial instruments;
Level 2: Fair value is determined using valuation techniques where the input is based on
observable market data;
Level 3: Fair value is determined using valuation techniques where the input is not based on
observable market data.

PRYSMIAN GROUP | CONSOLIDATED FINANCIAL STATEMENTS AND EXPLANATORY NOTES
73
(Euro/million)
31.03.2021 Level 1 Level 2 Level 3 Total
Assets Financial assets at fair value: Derivatives through profit or loss - 49 - 49 Hedging derivatives - 158 - 158
Financial assets at amortised cost - 4 - 4 Financial assets at fair value through profit or loss 215 - - 215 Financial assets at fair value through other comprehensive income 11 - - 11 Other investments at fair value through other comprehensive income 13 13
Total assets 226 211 13 450
Liabilities Financial liabilities at fair value: Derivatives through profit or loss - 15 - 15 Hedging derivatives - 35 - 35
Total liabilities - 50 - 50
Financial assets classified in fair value Level 3 have reported no significant movements in the
period.
Given the short-term nature of trade receivables and trade payables, their carrying amounts,
net of any allowances for impairment, are treated as a good approximation of fair value.
Financial assets at fair value through profit or loss, classified in fair value Level 1 and amounting
to Euro 215 million, include Euro 200 million in money market funds in which the Parent
Company has invested its liquidity, with the remainder referring to funds in which the Brazilian
and Argentine subsidiaries have temporarily invested their liquidity.
Financial assets at fair value through other comprehensive income of Euro 11 million, classified
in fair value Level 1, refer to Italian government securities.
During the first three months of 2021 there were no transfers of financial assets and liabilities
between the different levels of the fair value hierarchy.
(b) Valuation techniques
Level 1: The fair value of financial instruments quoted in an active market is based on market
price at the reporting date. The market price used for derivatives is the bid price, while for
financial liabilities the ask price is used.
Level 2: Derivative financial instruments classified in this category include interest rate swaps,
forward currency contracts and metal derivative contracts that are not quoted in active markets.
Fair value is determined as follows:
- for interest rate swaps, it is calculated on the basis of the present value of forecast future
cash flows;
- for forward currency contracts, it is determined using the forward exchange rate at the
reporting date, appropriately discounted;
- for metal derivative contracts, it is determined using the prices of such metals at the
reporting date, appropriately discounted.

PRYSMIAN GROUP | CONSOLIDATED FINANCIAL STATEMENTS AND EXPLANATORY NOTES
74
Level 3: The fair value of instruments not quoted in an active market is primarily determined
using valuation techniques based on estimated discounted cash flows.
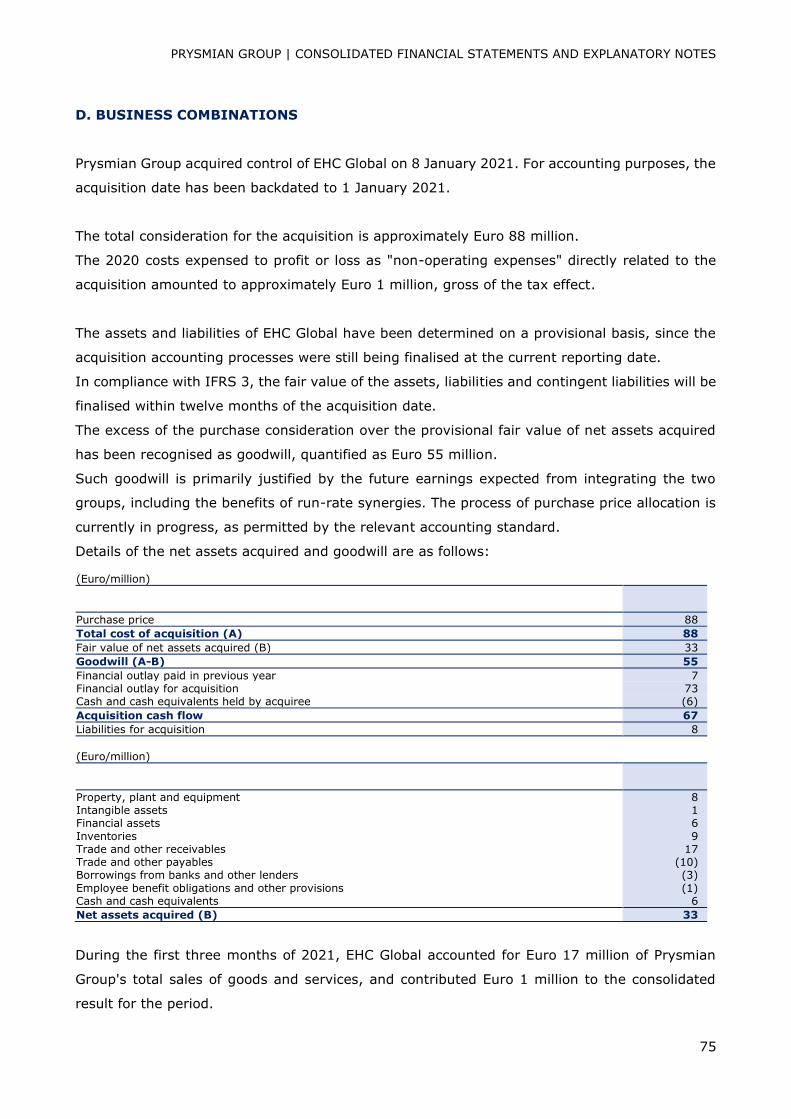
PRYSMIAN GROUP | CONSOLIDATED FINANCIAL STATEMENTS AND EXPLANATORY NOTES
75
D. BUSINESS COMBINATIONS
Prysmian Group acquired control of EHC Global on 8 January 2021. For accounting purposes, the
acquisition date has been backdated to 1 January 2021.
The total consideration for the acquisition is approximately Euro 88 million.
The 2020 costs expensed to profit or loss as "non-operating expenses" directly related to the
acquisition amounted to approximately Euro 1 million, gross of the tax effect.
The assets and liabilities of EHC Global have been determined on a provisional basis, since the
acquisition accounting processes were still being finalised at the current reporting date.
In compliance with IFRS 3, the fair value of the assets, liabilities and contingent liabilities will be
finalised within twelve months of the acquisition date.
The excess of the purchase consideration over the provisional fair value of net assets acquired
has been recognised as goodwill, quantified as Euro 55 million.
Such goodwill is primarily justified by the future earnings expected from integrating the two
groups, including the benefits of run-rate synergies. The process of purchase price allocation is
currently in progress, as permitted by the relevant accounting standard.
Details of the net assets acquired and goodwill are as follows:
(Euro/million)
Purchase price 88
Total cost of acquisition (A) 88
Fair value of net assets acquired (B) 33
Goodwill (A-B) 55
Financial outlay paid in previous year 7 Financial outlay for acquisition 73 Cash and cash equivalents held by acquiree (6)
Acquisition cash flow 67
Liabilities for acquisition 8
(Euro/million)
Property, plant and equipment 8 Intangible assets 1 Financial assets 6
Inventories 9 Trade and other receivables 17 Trade and other payables (10) Borrowings from banks and other lenders (3)
Employee benefit obligations and other provisions (1) Cash and cash equivalents 6
Net assets acquired (B) 33
During the first three months of 2021, EHC Global accounted for Euro 17 million of Prysmian
Group's total sales of goods and services, and contributed Euro 1 million to the consolidated
result for the period.
PRYSMIAN GROUP | CONSOLIDATED FINANCIAL STATEMENTS AND EXPLANATORY NOTES
76
E. SEGMENT INFORMATION
The Group's operating segments are:
- Energy, whose smallest identifiable CGU is given by Regions/Countries depending on the
specific organisation;
- Projects, whose smallest identifiable CGUs are the High Voltage, Submarine Power,
Submarine Telecom and Offshore Specialties businesses;
- Telecom, whose smallest CGU is the operating segment itself.
Segment information is structured in the same way as the report periodically prepared for the
purpose of reviewing business performance. This report presents operating performance by
macro type of business (Energy, Projects and Telecom) and the results of operating segments
primarily on the basis of Adjusted EBITDA, defined as earnings (loss) for the period before non-
recurring items, the fair value change in metal price derivatives and in other fair value items,
amortisation, depreciation and impairment, finance costs and income and taxes.
This report also provides information about the statement of financial position for the Group as
a whole but not by operating segment.
In order to provide users of the financial statements with clearer information, certain economic
data is also reported by sales channels and business areas within the individual operating
segments:
A) Projects operating segment: encompassing the following high-tech and high value-added
businesses whose focus is on projects and their execution, as well as on product customisation:
High Voltage, Submarine Power, Submarine Telecom and Offshore Specialties.
B) Energy operating segment: encompassing the businesses offering a complete and innovative
product portfolio designed to meet the various and many needs of the market, namely:
- Energy & Infrastructure (E&I): this includes Trade and Installers, Power Distribution and
Overhead lines;
- Industrial & Network Components: this comprises Specialties and OEM, Elevators,
Automotive, Network Components, core Oil & Gas and DHT;
- Other: occasional sales of residual products.
C) Telecom operating segment: producing cable systems and connectivity products used in
telecommunication networks. This segment is organised in the following lines of business: optical
fibre, optical cables, connectivity components and accessories, OPGW (Optical Ground Wire) and
copper cables.
All Corporate fixed costs are allocated to the Projects, Energy and Telecom operating segments.
Revenues and costs are allocated to each operating segment by identifying all revenues and
costs directly attributable to that segment and by allocating indirect costs on the basis of
Corporate resources (personnel, space used, etc.) absorbed by the operating segments.
PRYSMIAN GROUP | CONSOLIDATED FINANCIAL STATEMENTS AND EXPLANATORY NOTES
77
Group operating activities are organised and managed separately according to the nature of the
products and services provided: each segment offers different products and services to different
markets. Sales of goods and services are analysed geographically on the basis of the location of
the registered office of the company that issues the invoices, regardless of the geographic
destination of the products sold. This type of presentation does not produce significantly different
results from analysing sales of goods and services by destination of the products sold. All transfer
prices are set using the same conditions applied to other transactions between Group companies
and are generally determined by applying a mark-up to production costs.
Assets and liabilities by operating segment are not included in the data reviewed by management
and so, as permitted by IFRS 8, this information is not presented in the current report.
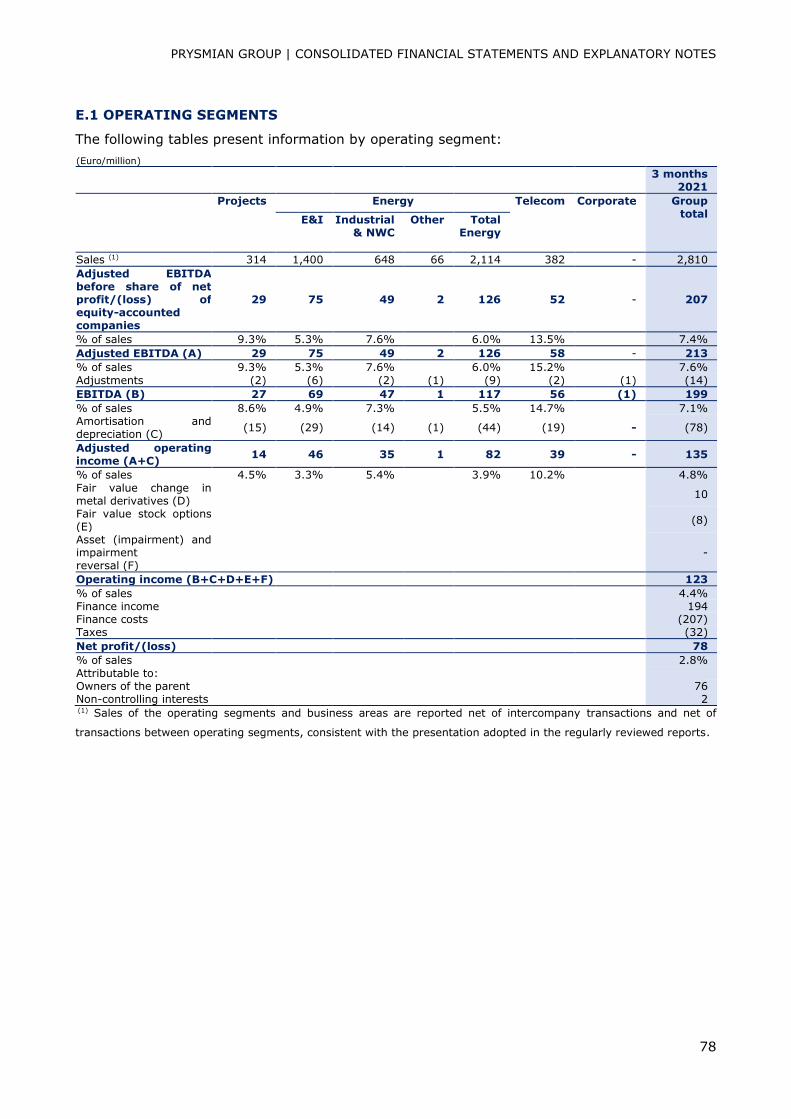
PRYSMIAN GROUP | CONSOLIDATED FINANCIAL STATEMENTS AND EXPLANATORY NOTES
78
E.1 OPERATING SEGMENTS
The following tables present information by operating segment:
(Euro/million)
3 months
2021
Projects Energy Telecom Corporate Group
total
E&I Industrial & NWC
Other Total Energy
Sales (1) 314 1,400 648 66 2,114 382 - 2,810
Adjusted EBITDA before share of net profit/(loss) of equity-accounted companies
29 75 49 2 126 52 - 207
% of sales 9.3% 5.3% 7.6% 6.0% 13.5% 7.4%
Adjusted EBITDA (A) 29 75 49 2 126 58 - 213
% of sales 9.3% 5.3% 7.6% 6.0% 15.2% 7.6%
Adjustments (2) (6) (2) (1) (9) (2) (1) (14)
EBITDA (B) 27 69 47 1 117 56 (1) 199
% of sales 8.6% 4.9% 7.3% 5.5% 14.7% 7.1% Amortisation and depreciation (C)
(15) (29) (14) (1) (44) (19) - (78)
Adjusted operating income (A+C)
14 46 35 1 82 39 - 135
% of sales 4.5% 3.3% 5.4% 3.9% 10.2% 4.8%
Fair value change in metal derivatives (D)
10
Fair value stock options (E)
(8)
Asset (impairment) and impairment reversal (F)
-
Operating income (B+C+D+E+F) 123
% of sales 4.4% Finance income 194 Finance costs (207) Taxes (32)
Net profit/(loss) 78
% of sales 2.8%
Attributable to:
Owners of the parent 76 Non-controlling interests 2 (1) Sales of the operating segments and business areas are reported net of intercompany transactions and net of
transactions between operating segments, consistent with the presentation adopted in the regularly reviewed reports.
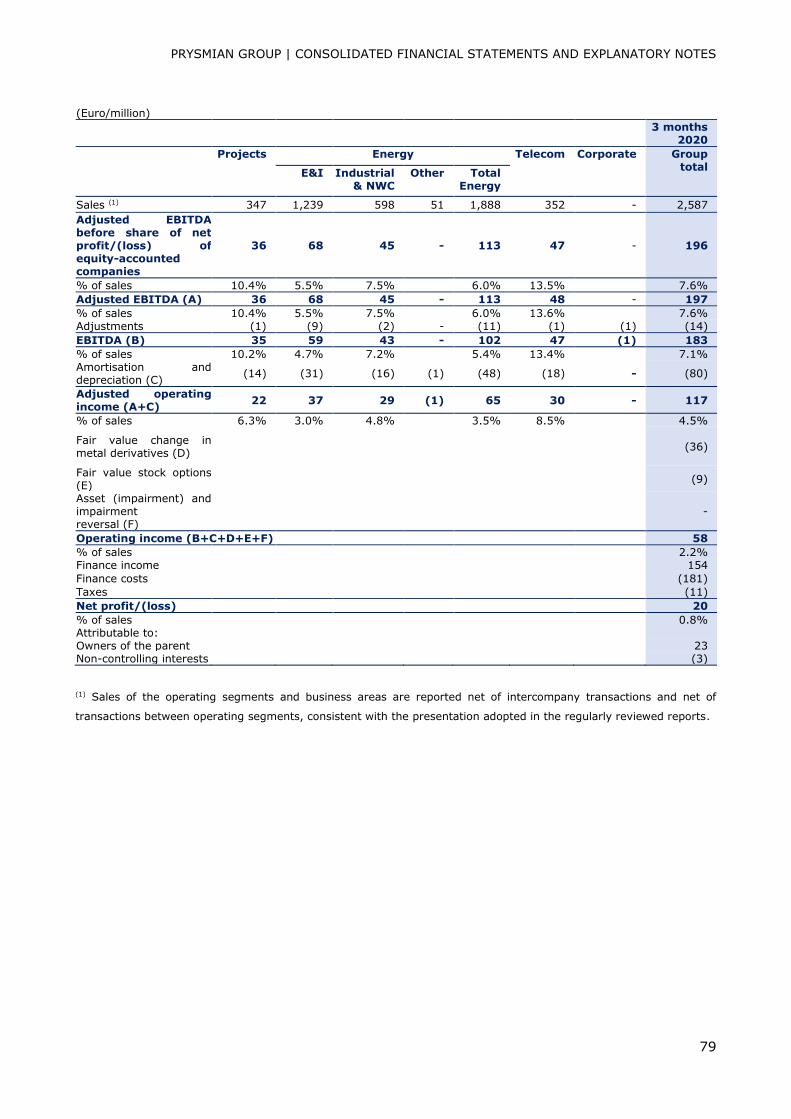
PRYSMIAN GROUP | CONSOLIDATED FINANCIAL STATEMENTS AND EXPLANATORY NOTES
79
(Euro/million)
3 months
2020
Projects Energy Telecom Corporate Group
total
E&I Industrial & NWC
Other Total Energy
Sales (1) 347 1,239 598 51 1,888 352 - 2,587
Adjusted EBITDA before share of net profit/(loss) of equity-accounted companies
36 68 45 - 113 47 - 196
% of sales 10.4% 5.5% 7.5% 6.0% 13.5% 7.6%
Adjusted EBITDA (A) 36 68 45 - 113 48 - 197
% of sales 10.4% 5.5% 7.5% 6.0% 13.6% 7.6% Adjustments (1) (9) (2) - (11) (1) (1) (14)
EBITDA (B) 35 59 43 - 102 47 (1) 183
% of sales 10.2% 4.7% 7.2% 5.4% 13.4% 7.1% Amortisation and depreciation (C)
(14) (31) (16) (1) (48) (18) - (80)
Adjusted operating income (A+C)
22 37 29 (1) 65 30 - 117
% of sales 6.3% 3.0% 4.8% 3.5% 8.5% 4.5%
Fair value change in metal derivatives (D)
(36)
Fair value stock options (E)
(9)
Asset (impairment) and impairment reversal (F)
-
Operating income (B+C+D+E+F) 58
% of sales 2.2% Finance income 154
Finance costs (181)
Taxes (11)
Net profit/(loss) 20
% of sales 0.8% Attributable to:
Owners of the parent 23 Non-controlling interests (3)
(1) Sales of the operating segments and business areas are reported net of intercompany transactions and net of
transactions between operating segments, consistent with the presentation adopted in the regularly reviewed reports.
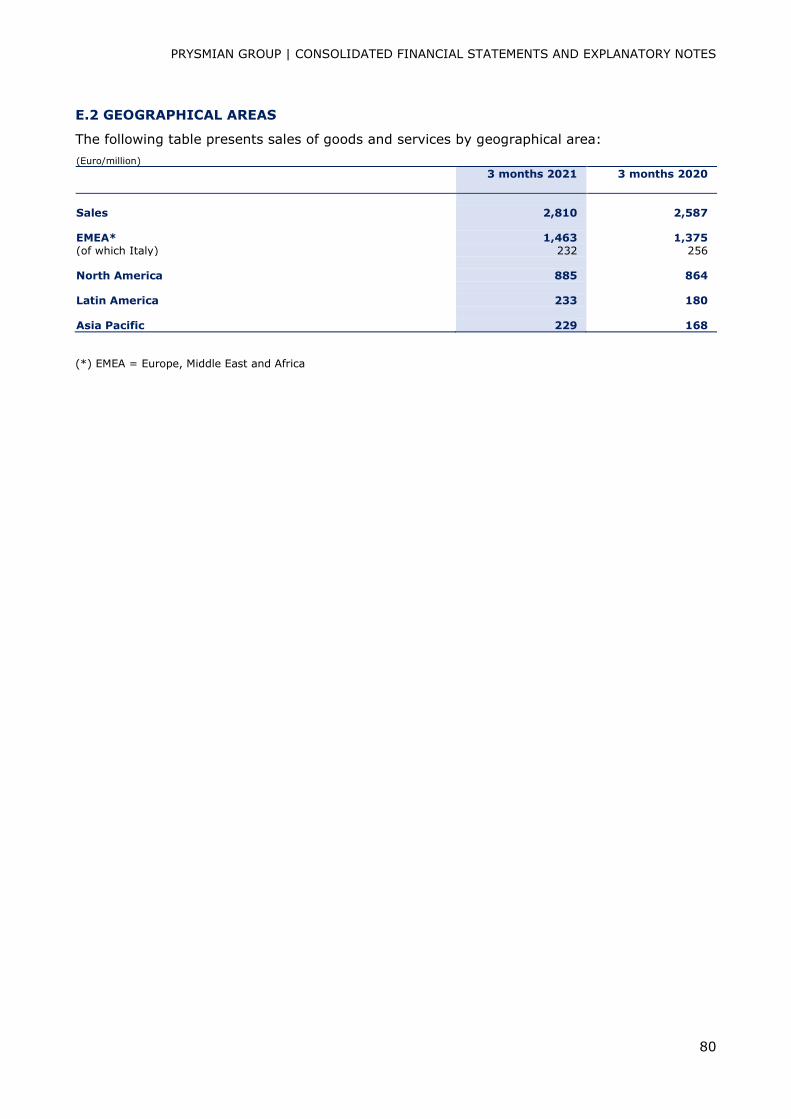
PRYSMIAN GROUP | CONSOLIDATED FINANCIAL STATEMENTS AND EXPLANATORY NOTES
80
E.2 GEOGRAPHICAL AREAS
The following table presents sales of goods and services by geographical area:
(Euro/million)
3 months 2021 3 months 2020
Sales 2,810 2,587
EMEA* 1,463 1,375 (of which Italy) 232 256
North America 885 864
Latin America 233 180
Asia Pacific 229 168
(*) EMEA = Europe, Middle East and Africa
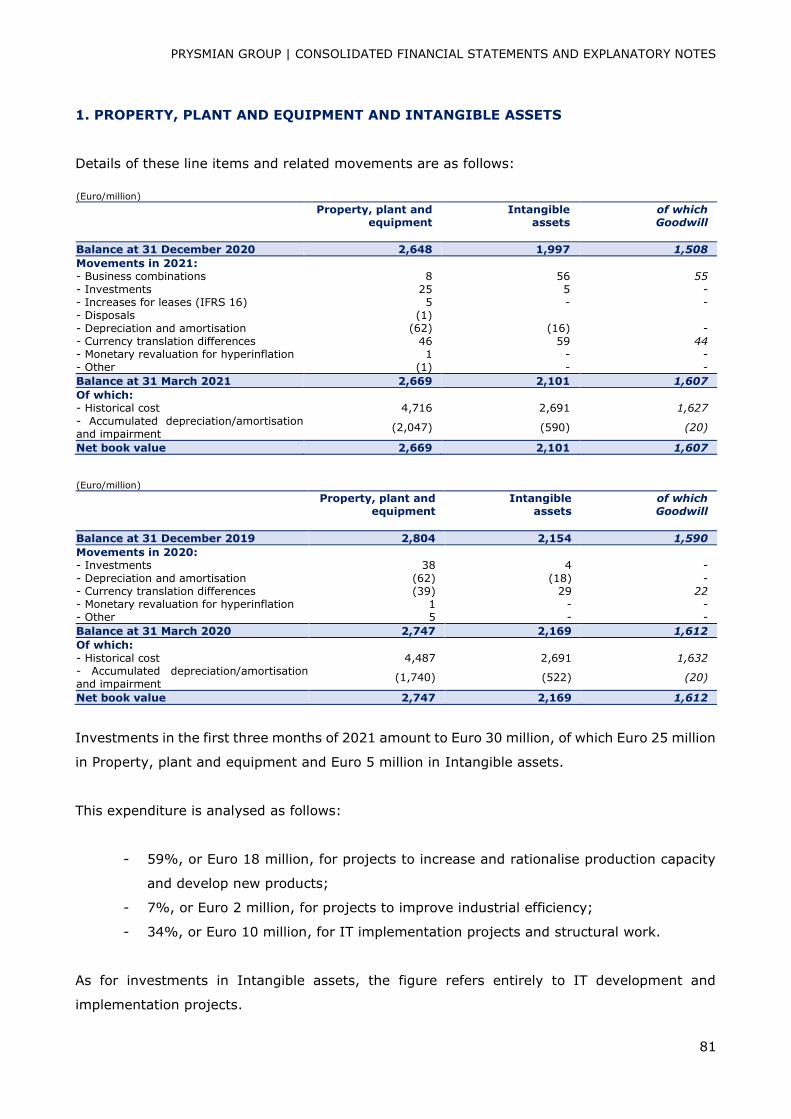
PRYSMIAN GROUP | CONSOLIDATED FINANCIAL STATEMENTS AND EXPLANATORY NOTES
81
1. PROPERTY, PLANT AND EQUIPMENT AND INTANGIBLE ASSETS
Details of these line items and related movements are as follows:
(Euro/million)
Property, plant and
equipment Intangible
assets of which Goodwill
Balance at 31 December 2020 2,648 1,997 1,508
Movements in 2021:
- Business combinations 8 56 55
- Investments 25 5 - - Increases for leases (IFRS 16) 5 - - - Disposals (1)
- Depreciation and amortisation (62) (16) -
- Currency translation differences 46 59 44 - Monetary revaluation for hyperinflation 1 - - - Other (1) - -
Balance at 31 March 2021 2,669 2,101 1,607
Of which:
- Historical cost 4,716 2,691 1,627
- Accumulated depreciation/amortisation and impairment
(2,047) (590) (20)
Net book value 2,669 2,101 1,607
(Euro/million)
Property, plant and
equipment Intangible
assets of which Goodwill
Balance at 31 December 2019 2,804 2,154 1,590
Movements in 2020:
- Investments 38 4 -
- Depreciation and amortisation (62) (18) - - Currency translation differences (39) 29 22 - Monetary revaluation for hyperinflation 1 - - - Other 5 - -
Balance at 31 March 2020 2,747 2,169 1,612
Of which:
- Historical cost 4,487 2,691 1,632 - Accumulated depreciation/amortisation and impairment
(1,740) (522) (20)
Net book value 2,747 2,169 1,612
Investments in the first three months of 2021 amount to Euro 30 million, of which Euro 25 million
in Property, plant and equipment and Euro 5 million in Intangible assets.
This expenditure is analysed as follows:
- 59%, or Euro 18 million, for projects to increase and rationalise production capacity
and develop new products;
- 7%, or Euro 2 million, for projects to improve industrial efficiency;
- 34%, or Euro 10 million, for IT implementation projects and structural work.
As for investments in Intangible assets, the figure refers entirely to IT development and
implementation projects.
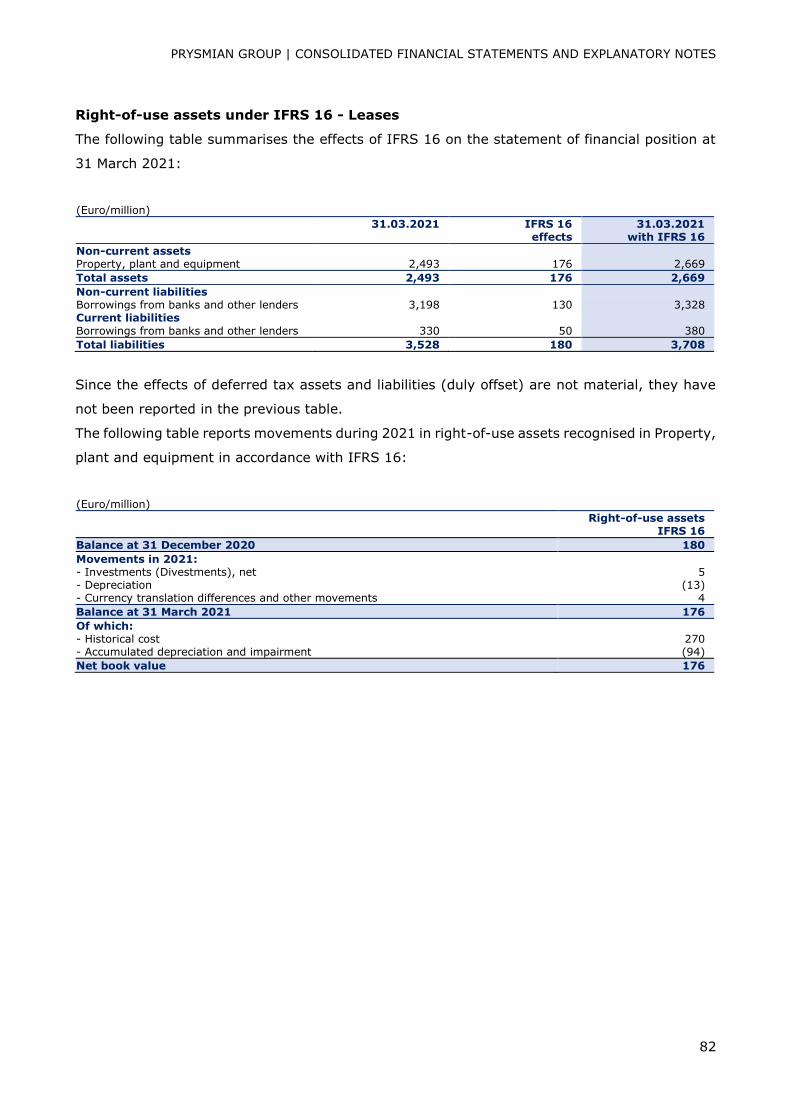
PRYSMIAN GROUP | CONSOLIDATED FINANCIAL STATEMENTS AND EXPLANATORY NOTES
82
Right-of-use assets under IFRS 16 - Leases
The following table summarises the effects of IFRS 16 on the statement of financial position at
31 March 2021:
(Euro/million)
31.03.2021 IFRS 16 effects
31.03.2021 with IFRS 16
Non-current assets
Property, plant and equipment 2,493 176 2,669
Total assets 2,493 176 2,669
Non-current liabilities
Borrowings from banks and other lenders 3,198 130 3,328 Current liabilities
Borrowings from banks and other lenders 330 50 380
Total liabilities 3,528 180 3,708
Since the effects of deferred tax assets and liabilities (duly offset) are not material, they have
not been reported in the previous table.
The following table reports movements during 2021 in right-of-use assets recognised in Property,
plant and equipment in accordance with IFRS 16:
(Euro/million)
Right-of-use assets
IFRS 16
Balance at 31 December 2020 180
Movements in 2021:
- Investments (Divestments), net 5 - Depreciation (13) - Currency translation differences and other movements 4
Balance at 31 March 2021 176
Of which:
- Historical cost 270 - Accumulated depreciation and impairment (94)
Net book value 176
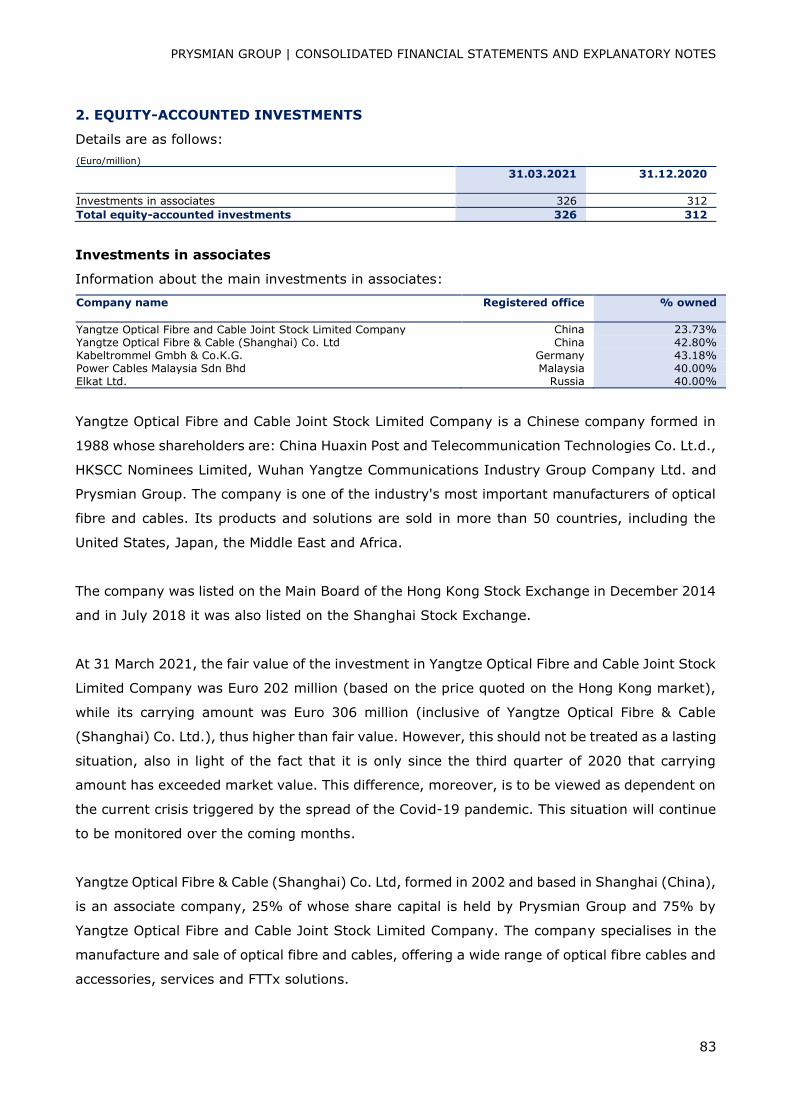
PRYSMIAN GROUP | CONSOLIDATED FINANCIAL STATEMENTS AND EXPLANATORY NOTES
83
2. EQUITY-ACCOUNTED INVESTMENTS
Details are as follows:
(Euro/million) 31.03.2021 31.12.2020
Investments in associates 326 312
Total equity-accounted investments 326 312
Investments in associates
Information about the main investments in associates:
Company name Registered office % owned
Yangtze Optical Fibre and Cable Joint Stock Limited Company China 23.73%
Yangtze Optical Fibre & Cable (Shanghai) Co. Ltd China 42.80% Kabeltrommel Gmbh & Co.K.G. Germany 43.18% Power Cables Malaysia Sdn Bhd Malaysia 40.00%
Elkat Ltd. Russia 40.00%
Yangtze Optical Fibre and Cable Joint Stock Limited Company is a Chinese company formed in
1988 whose shareholders are: China Huaxin Post and Telecommunication Technologies Co. Lt.d.,
HKSCC Nominees Limited, Wuhan Yangtze Communications Industry Group Company Ltd. and
Prysmian Group. The company is one of the industry's most important manufacturers of optical
fibre and cables. Its products and solutions are sold in more than 50 countries, including the
United States, Japan, the Middle East and Africa.
The company was listed on the Main Board of the Hong Kong Stock Exchange in December 2014
and in July 2018 it was also listed on the Shanghai Stock Exchange.
At 31 March 2021, the fair value of the investment in Yangtze Optical Fibre and Cable Joint Stock
Limited Company was Euro 202 million (based on the price quoted on the Hong Kong market),
while its carrying amount was Euro 306 million (inclusive of Yangtze Optical Fibre & Cable
(Shanghai) Co. Ltd.), thus higher than fair value. However, this should not be treated as a lasting
situation, also in light of the fact that it is only since the third quarter of 2020 that carrying
amount has exceeded market value. This difference, moreover, is to be viewed as dependent on
the current crisis triggered by the spread of the Covid-19 pandemic. This situation will continue
to be monitored over the coming months.
Yangtze Optical Fibre & Cable (Shanghai) Co. Ltd, formed in 2002 and based in Shanghai (China),
is an associate company, 25% of whose share capital is held by Prysmian Group and 75% by
Yangtze Optical Fibre and Cable Joint Stock Limited Company. The company specialises in the
manufacture and sale of optical fibre and cables, offering a wide range of optical fibre cables and
accessories, services and FTTx solutions.
PRYSMIAN GROUP | CONSOLIDATED FINANCIAL STATEMENTS AND EXPLANATORY NOTES
84
Kabeltrommel Gmbh & Co. K.G. is a German company that heads a consortium for the
production, procurement, management and sale of disposable and reusable cable carrying
devices (drums). The services offered by the company include both the sale of cable drums, and
the complete management of logistics services such as drum shipping, handling and subsequent
retrieval. The company operates primarily in the German market.
Power Cables Malaysia Sdn Bhd is based in Malaysia. The company, a leader in the local market,
manufactures and sells power cables and conductors.
Elkat Ltd. is based in Russia and manufactures and sells copper conductors; it is the only
company certified by the LME to test copper cathodes for the local market.
The change in Investments in associates during the period is not significant, with the Group's
share of profit or loss of associates having offset the dividends collected from them.
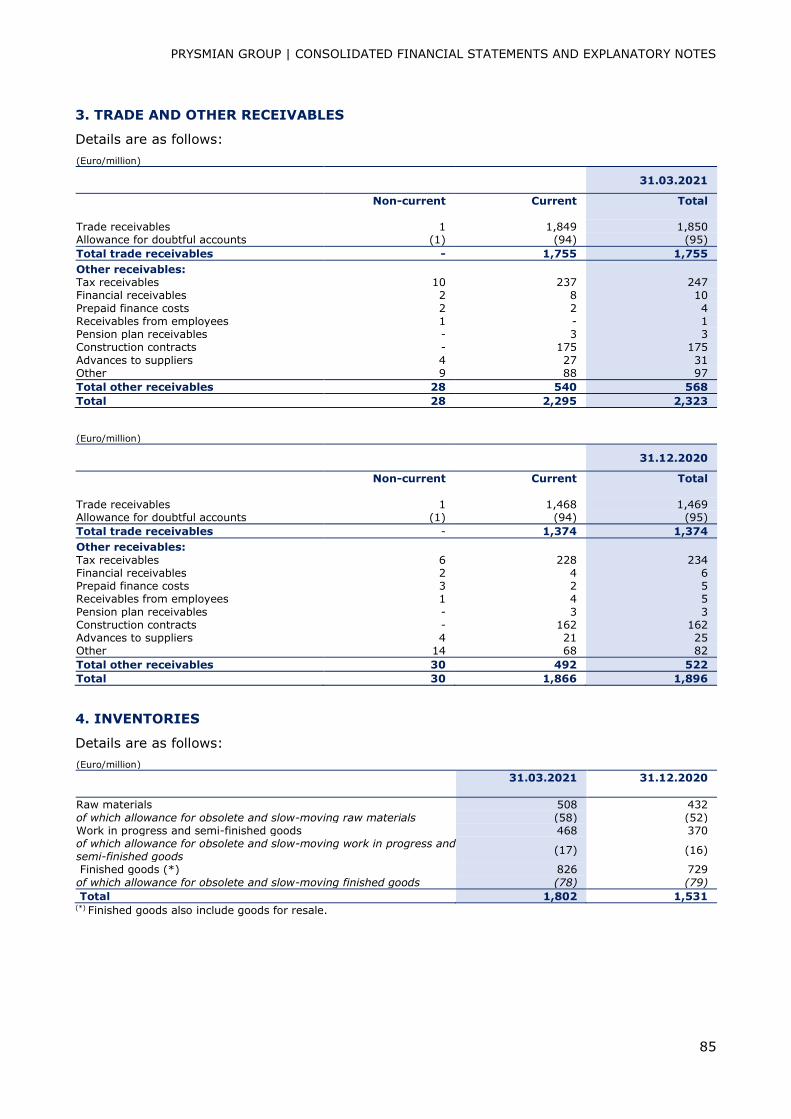
PRYSMIAN GROUP | CONSOLIDATED FINANCIAL STATEMENTS AND EXPLANATORY NOTES
85
3. TRADE AND OTHER RECEIVABLES
Details are as follows:
(Euro/million)
31.03.2021
Non-current Current Total
Trade receivables 1 1,849 1,850 Allowance for doubtful accounts (1) (94) (95)
Total trade receivables - 1,755 1,755 Other receivables:
Tax receivables 10 237 247 Financial receivables 2 8 10
Prepaid finance costs 2 2 4 Receivables from employees 1 - 1 Pension plan receivables - 3 3 Construction contracts - 175 175
Advances to suppliers 4 27 31 Other 9 88 97
Total other receivables 28 540 568
Total 28 2,295 2,323
(Euro/million)
31.12.2020
Non-current Current Total
Trade receivables 1 1,468 1,469 Allowance for doubtful accounts (1) (94) (95)
Total trade receivables - 1,374 1,374 Other receivables:
Tax receivables 6 228 234 Financial receivables 2 4 6 Prepaid finance costs 3 2 5 Receivables from employees 1 4 5
Pension plan receivables - 3 3 Construction contracts - 162 162 Advances to suppliers 4 21 25 Other 14 68 82
Total other receivables 30 492 522
Total 30 1,866 1,896
4. INVENTORIES
Details are as follows:
(Euro/million)
31.03.2021 31.12.2020
Raw materials 508 432
of which allowance for obsolete and slow-moving raw materials (58) (52) Work in progress and semi-finished goods 468 370 of which allowance for obsolete and slow-moving work in progress and semi-finished goods
(17) (16)
Finished goods (*) 826 729
of which allowance for obsolete and slow-moving finished goods (78) (79)
Total 1,802 1,531 (*) Finished goods also include goods for resale.
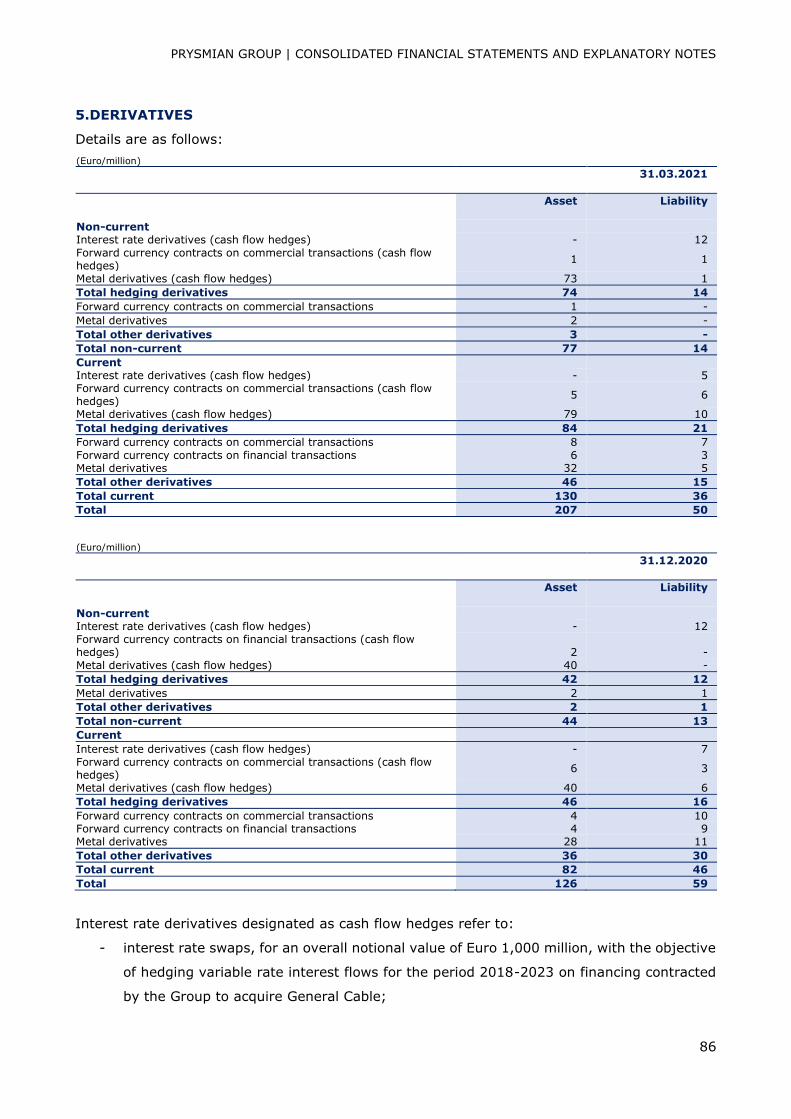
PRYSMIAN GROUP | CONSOLIDATED FINANCIAL STATEMENTS AND EXPLANATORY NOTES
86
5.DERIVATIVES
Details are as follows:
(Euro/million)
31.03.2021
Asset Liability
Non-current
Interest rate derivatives (cash flow hedges) - 12
Forward currency contracts on commercial transactions (cash flow hedges)
1 1
Metal derivatives (cash flow hedges) 73 1
Total hedging derivatives 74 14
Forward currency contracts on commercial transactions 1 -
Metal derivatives 2 -
Total other derivatives 3 -
Total non-current 77 14
Current
Interest rate derivatives (cash flow hedges) - 5 Forward currency contracts on commercial transactions (cash flow hedges)
5 6
Metal derivatives (cash flow hedges) 79 10
Total hedging derivatives 84 21
Forward currency contracts on commercial transactions 8 7
Forward currency contracts on financial transactions 6 3 Metal derivatives 32 5
Total other derivatives 46 15
Total current 130 36
Total 207 50
(Euro/million) 31.12.2020
Asset Liability
Non-current
Interest rate derivatives (cash flow hedges) - 12 Forward currency contracts on financial transactions (cash flow hedges) 2 -
Metal derivatives (cash flow hedges) 40 -
Total hedging derivatives 42 12
Metal derivatives 2 1
Total other derivatives 2 1
Total non-current 44 13
Current Interest rate derivatives (cash flow hedges) - 7 Forward currency contracts on commercial transactions (cash flow hedges)
6 3
Metal derivatives (cash flow hedges) 40 6
Total hedging derivatives 46 16
Forward currency contracts on commercial transactions 4 10 Forward currency contracts on financial transactions 4 9 Metal derivatives 28 11
Total other derivatives 36 30
Total current 82 46
Total 126 59
Interest rate derivatives designated as cash flow hedges refer to:
- interest rate swaps, for an overall notional value of Euro 1,000 million, with the objective
of hedging variable rate interest flows for the period 2018-2023 on financing contracted
by the Group to acquire General Cable;
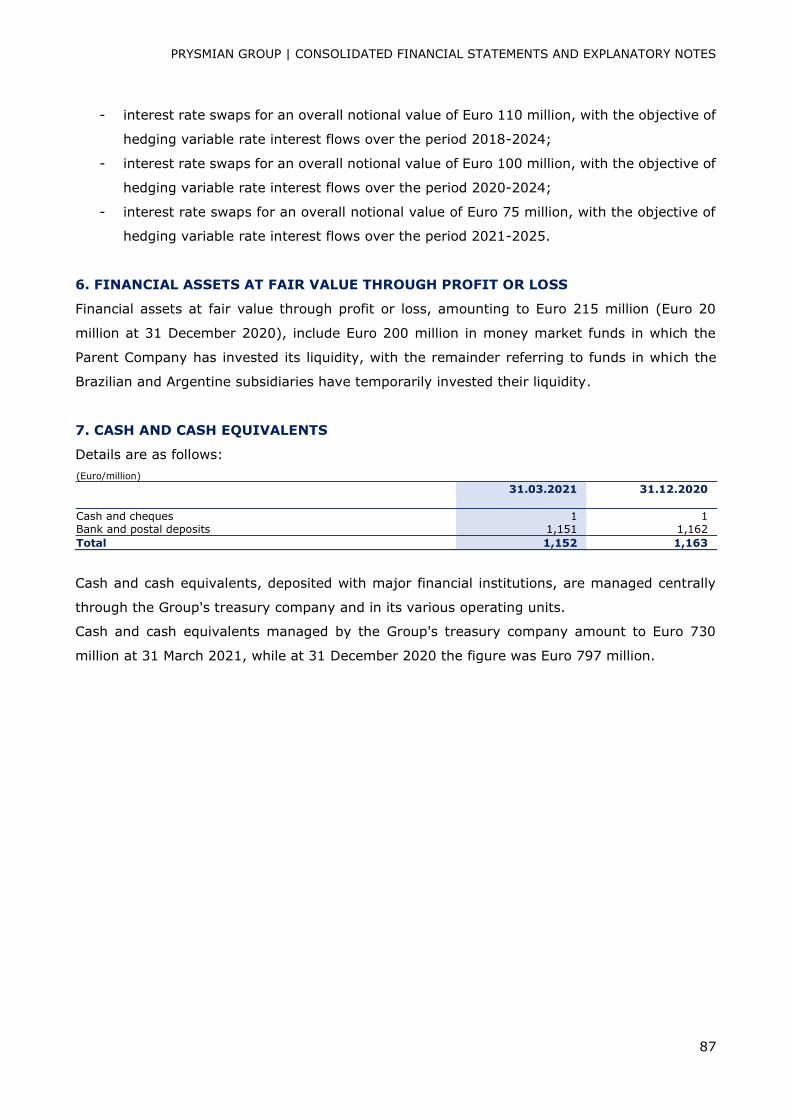
PRYSMIAN GROUP | CONSOLIDATED FINANCIAL STATEMENTS AND EXPLANATORY NOTES
87
- interest rate swaps for an overall notional value of Euro 110 million, with the objective of
hedging variable rate interest flows over the period 2018-2024;
- interest rate swaps for an overall notional value of Euro 100 million, with the objective of
hedging variable rate interest flows over the period 2020-2024;
- interest rate swaps for an overall notional value of Euro 75 million, with the objective of
hedging variable rate interest flows over the period 2021-2025.
6. FINANCIAL ASSETS AT FAIR VALUE THROUGH PROFIT OR LOSS
Financial assets at fair value through profit or loss, amounting to Euro 215 million (Euro 20
million at 31 December 2020), include Euro 200 million in money market funds in which the
Parent Company has invested its liquidity, with the remainder referring to funds in which the
Brazilian and Argentine subsidiaries have temporarily invested their liquidity.
7. CASH AND CASH EQUIVALENTS
Details are as follows:
(Euro/million) 31.03.2021 31.12.2020
Cash and cheques 1 1 Bank and postal deposits 1,151 1,162
Total 1,152 1,163
Cash and cash equivalents, deposited with major financial institutions, are managed centrally
through the Group's treasury company and in its various operating units.
Cash and cash equivalents managed by the Group's treasury company amount to Euro 730
million at 31 March 2021, while at 31 December 2020 the figure was Euro 797 million.
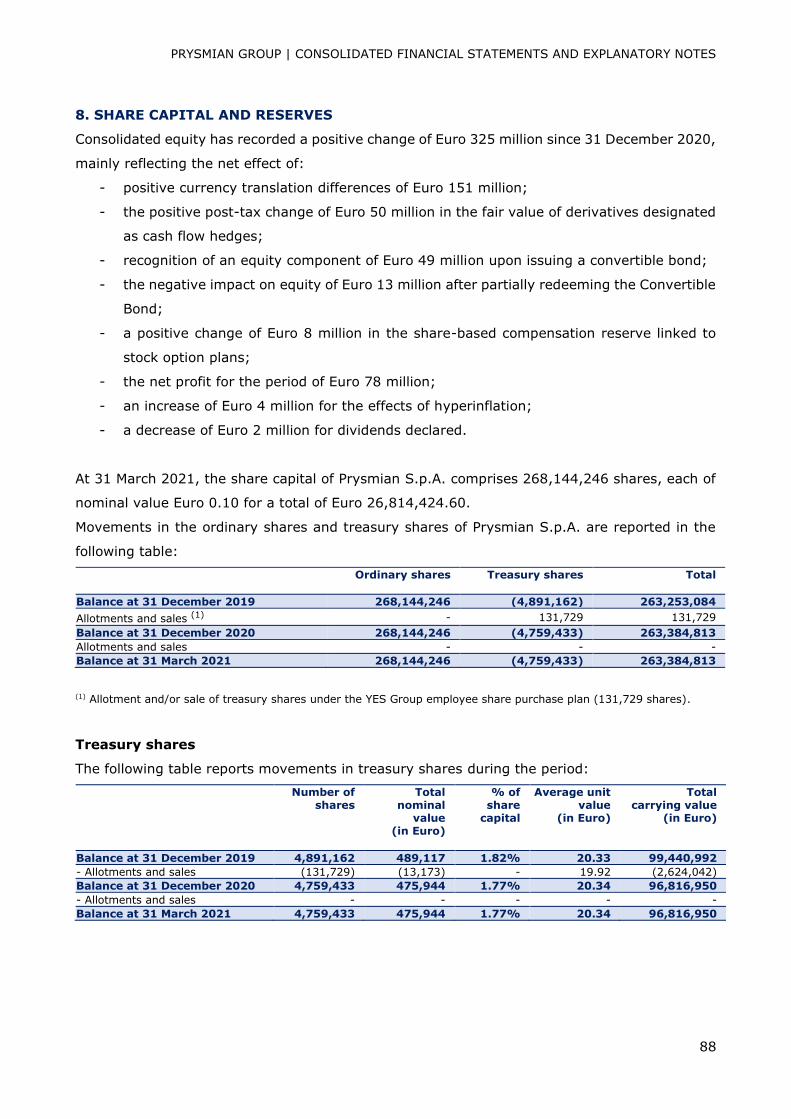
PRYSMIAN GROUP | CONSOLIDATED FINANCIAL STATEMENTS AND EXPLANATORY NOTES
88
8. SHARE CAPITAL AND RESERVES
Consolidated equity has recorded a positive change of Euro 325 million since 31 December 2020,
mainly reflecting the net effect of:
- positive currency translation differences of Euro 151 million;
- the positive post-tax change of Euro 50 million in the fair value of derivatives designated
as cash flow hedges;
- recognition of an equity component of Euro 49 million upon issuing a convertible bond;
- the negative impact on equity of Euro 13 million after partially redeeming the Convertible
Bond;
- a positive change of Euro 8 million in the share-based compensation reserve linked to
stock option plans;
- the net profit for the period of Euro 78 million;
- an increase of Euro 4 million for the effects of hyperinflation;
- a decrease of Euro 2 million for dividends declared.
At 31 March 2021, the share capital of Prysmian S.p.A. comprises 268,144,246 shares, each of
nominal value Euro 0.10 for a total of Euro 26,814,424.60.
Movements in the ordinary shares and treasury shares of Prysmian S.p.A. are reported in the
following table:
Ordinary shares Treasury shares Total
Balance at 31 December 2019 268,144,246 (4,891,162) 263,253,084
Allotments and sales (1) - 131,729 131,729
Balance at 31 December 2020 268,144,246 (4,759,433) 263,384,813
Allotments and sales - - -
Balance at 31 March 2021 268,144,246 (4,759,433) 263,384,813
(1) Allotment and/or sale of treasury shares under the YES Group employee share purchase plan (131,729 shares).
Treasury shares
The following table reports movements in treasury shares during the period:
Number of shares
Total nominal
value (in Euro)
% of share
capital
Average unit value
(in Euro)
Total carrying value
(in Euro)
Balance at 31 December 2019 4,891,162 489,117 1.82% 20.33 99,440,992
- Allotments and sales (131,729) (13,173) - 19.92 (2,624,042)
Balance at 31 December 2020 4,759,433 475,944 1.77% 20.34 96,816,950
- Allotments and sales - - - - -
Balance at 31 March 2021 4,759,433 475,944 1.77% 20.34 96,816,950
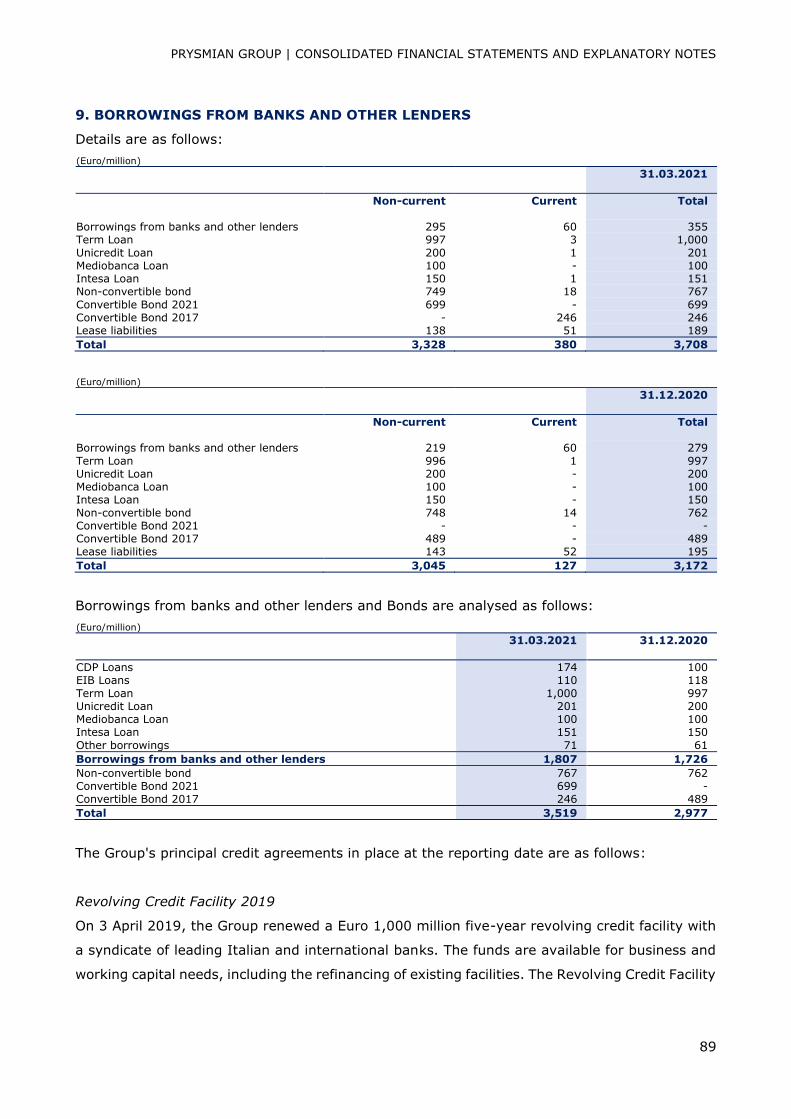
PRYSMIAN GROUP | CONSOLIDATED FINANCIAL STATEMENTS AND EXPLANATORY NOTES
89
9. BORROWINGS FROM BANKS AND OTHER LENDERS
Details are as follows:
(Euro/million)
31.03.2021
Non-current Current Total
Borrowings from banks and other lenders 295 60 355 Term Loan 997 3 1,000
Unicredit Loan 200 1 201 Mediobanca Loan 100 - 100 Intesa Loan 150 1 151 Non-convertible bond 749 18 767
Convertible Bond 2021 699 - 699 Convertible Bond 2017 - 246 246 Lease liabilities 138 51 189
Total 3,328 380 3,708
(Euro/million)
31.12.2020
Non-current Current Total
Borrowings from banks and other lenders 219 60 279
Term Loan 996 1 997 Unicredit Loan 200 - 200 Mediobanca Loan 100 - 100 Intesa Loan 150 - 150
Non-convertible bond 748 14 762 Convertible Bond 2021 - - - Convertible Bond 2017 489 - 489 Lease liabilities 143 52 195
Total 3,045 127 3,172
Borrowings from banks and other lenders and Bonds are analysed as follows:
(Euro/million)
31.03.2021 31.12.2020
CDP Loans 174 100 EIB Loans 110 118
Term Loan 1,000 997 Unicredit Loan 201 200 Mediobanca Loan 100 100 Intesa Loan 151 150
Other borrowings 71 61
Borrowings from banks and other lenders 1,807 1,726
Non-convertible bond 767 762 Convertible Bond 2021 699 - Convertible Bond 2017 246 489
Total 3,519 2,977
The Group's principal credit agreements in place at the reporting date are as follows:
Revolving Credit Facility 2019
On 3 April 2019, the Group renewed a Euro 1,000 million five-year revolving credit facility with
a syndicate of leading Italian and international banks. The funds are available for business and
working capital needs, including the refinancing of existing facilities. The Revolving Credit Facility

PRYSMIAN GROUP | CONSOLIDATED FINANCIAL STATEMENTS AND EXPLANATORY NOTES
90
2019 can also be used for the issue of guarantees. At 31 March 2021, this facility was not being
used.
CDP Loans
On 28 October 2019, the Group entered into an agreement with Cassa Depositi e Prestiti S.p.A.
(CDP) for a Euro 100 million long-term loan for 4 years and 6 months from the date of signing,
with a bullet repayment at maturity. The purpose of this loan is to finance part of the Group's
capital expenditure and expenditure on research, development and innovation in Italy and
Europe. Interest rate swaps have been arranged in respect of this loan, for an overall notional
value of Euro 100 million, with the objective of hedging variable rate interest flows over the
period 2020-2024.
On 28 January 2021, a second loan was agreed with CDP for Euro 75 million for a term of 4
years and 6 months, for the purpose of financing part of the Group's expenditure to purchase
the "Leonardo Da Vinci" cable-laying vessel.
This loan was drawn down in its entirety on 9 February 2021, with a bullet repayment envisaged
at maturity on 28 July 2025. Interest rate swaps have been arranged in respect of this loan, for
an overall notional value of Euro 75 million, with the objective of hedging variable rate interest
flows over the period 2021-2025.
At 31 March 2021, the fair value of the CDP Loans approximates their related carrying amount.
EIB Loans
On 18 December 2013, Prysmian S.p.A. entered into a first loan agreement with the European
Investment Bank (EIB) for Euro 100 million, to fund the Group's research & development (R&D)
programmes in Europe over the period 2013-2016.
The EIB Loan was particularly intended to support projects developed in the Group's R&D centres
in six countries (France, Great Britain, the Netherlands, Spain, Germany and Italy) and
represented about 50% of the Prysmian Group's investment expenditure in Europe during the
period concerned.
The EIB Loan, received on 5 February 2014, is repayable in 12 equal half-yearly instalments
commencing 5 August 2015 and ending 5 February 2021. This loan has therefore been repaid in
full as at 31 March 2021.
On 10 November 2017, Prysmian S.p.A. entered into a second loan agreement with the EIB for
Euro 110 million to support the Group's R&D programmes in Europe over the period 2017-2020.
The loan was received on 29 November 2017 and involves a bullet repayment at maturity on 29
November 2024. Interest rate swaps have been arranged in respect of this loan, for an overall
notional value of Euro 110 million, with the objective of hedging variable rate interest flows over
the period 2018-2024.
PRYSMIAN GROUP | CONSOLIDATED FINANCIAL STATEMENTS AND EXPLANATORY NOTES
91
At 31 March 2021, the fair value of the EIB Loan approximates its related carrying amount.
Term Loan
The Term Loan was drawn down by the Group in June 2018 for the purpose of having the
necessary financial resources to pay the General Cable purchase consideration, to refinance the
existing debt of General Cable and its subsidiaries and to finance acquisition-related fees,
commissions, costs and expenses. The Term Loan is for Euro 1 billion and is repayable on the
fifth anniversary of the acquisition closing date (6 June 2023).
The interest rates applied are indexed to 6M and 3M Euribor, as the company so chooses. The
line was drawn down in full upon acquiring General Cable.
At 31 March 2021, the fair value of the Term Loan approximates its carrying amount.
Interest rate swaps have been arranged in respect of this loan, for an overall notional value of
Euro 1,000 million, with the objective of hedging variable rate interest flows.
Unicredit Loan
On 15 November 2018, Prysmian S.p.A. entered into an agreement with Unicredit for a long-
term cash loan for a maximum amount of Euro 200 million for 5 years from the date of signing.
The loan was drawn down in full on 16 November 2018 and is repayable in a lump sum at
maturity. The interest rate applied is indexed to 6M and 3M Euribor, as the company so chooses.
At 31 March 2021, the fair value of this loan approximates its carrying amount.
Mediobanca Loan
On 20 February 2019, the Group entered into an agreement with Mediobanca for a Euro 100
million long-term loan for 5 years from the date of signing. The loan was drawn down in full on
22 February 2019 and is repayable in a lump sum at maturity. The interest rate applied is indexed
to 6M and 3M Euribor, as the company so chooses. The fair value of the loan approximates its
carrying amount.
Intesa Loan
On 11 October 2019, the Group entered into an agreement with Intesa Sanpaolo for a Euro 150
million long-term loan for 5 years from the date of signing. The loan was drawn down in full on
18 October 2019 and is repayable in a lump sum at maturity. The fair value of the loan
approximates its carrying amount.
The fair value of the loans has been determined using valuation techniques that refer to
observable market data (Level 2 of the fair value hierarchy).
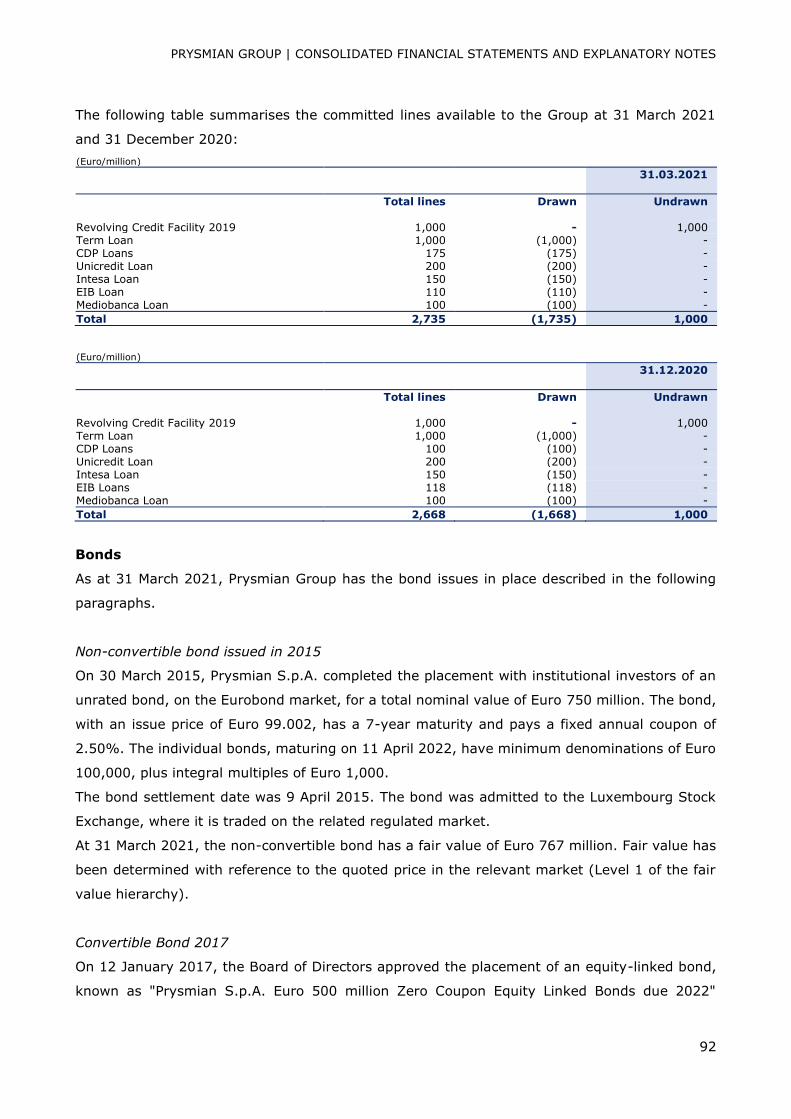
PRYSMIAN GROUP | CONSOLIDATED FINANCIAL STATEMENTS AND EXPLANATORY NOTES
92
The following table summarises the committed lines available to the Group at 31 March 2021
and 31 December 2020:
(Euro/million)
31.03.2021
Total lines Drawn Undrawn
Revolving Credit Facility 2019 1,000 - 1,000 Term Loan 1,000 (1,000) - CDP Loans 175 (175) - Unicredit Loan 200 (200) - Intesa Loan 150 (150) - EIB Loan 110 (110) - Mediobanca Loan 100 (100) -
Total 2,735 (1,735) 1,000
(Euro/million) 31.12.2020
Total lines Drawn Undrawn
Revolving Credit Facility 2019 1,000 - 1,000 Term Loan 1,000 (1,000) - CDP Loans 100 (100) - Unicredit Loan 200 (200) - Intesa Loan 150 (150) - EIB Loans 118 (118) - Mediobanca Loan 100 (100) -
Total 2,668 (1,668) 1,000
Bonds
As at 31 March 2021, Prysmian Group has the bond issues in place described in the following
paragraphs.
Non-convertible bond issued in 2015
On 30 March 2015, Prysmian S.p.A. completed the placement with institutional investors of an
unrated bond, on the Eurobond market, for a total nominal value of Euro 750 million. The bond,
with an issue price of Euro 99.002, has a 7-year maturity and pays a fixed annual coupon of
2.50%. The individual bonds, maturing on 11 April 2022, have minimum denominations of Euro
100,000, plus integral multiples of Euro 1,000.
The bond settlement date was 9 April 2015. The bond was admitted to the Luxembourg Stock
Exchange, where it is traded on the related regulated market.
At 31 March 2021, the non-convertible bond has a fair value of Euro 767 million. Fair value has
been determined with reference to the quoted price in the relevant market (Level 1 of the fair
value hierarchy).
Convertible Bond 2017
On 12 January 2017, the Board of Directors approved the placement of an equity-linked bond,
known as "Prysmian S.p.A. Euro 500 million Zero Coupon Equity Linked Bonds due 2022"
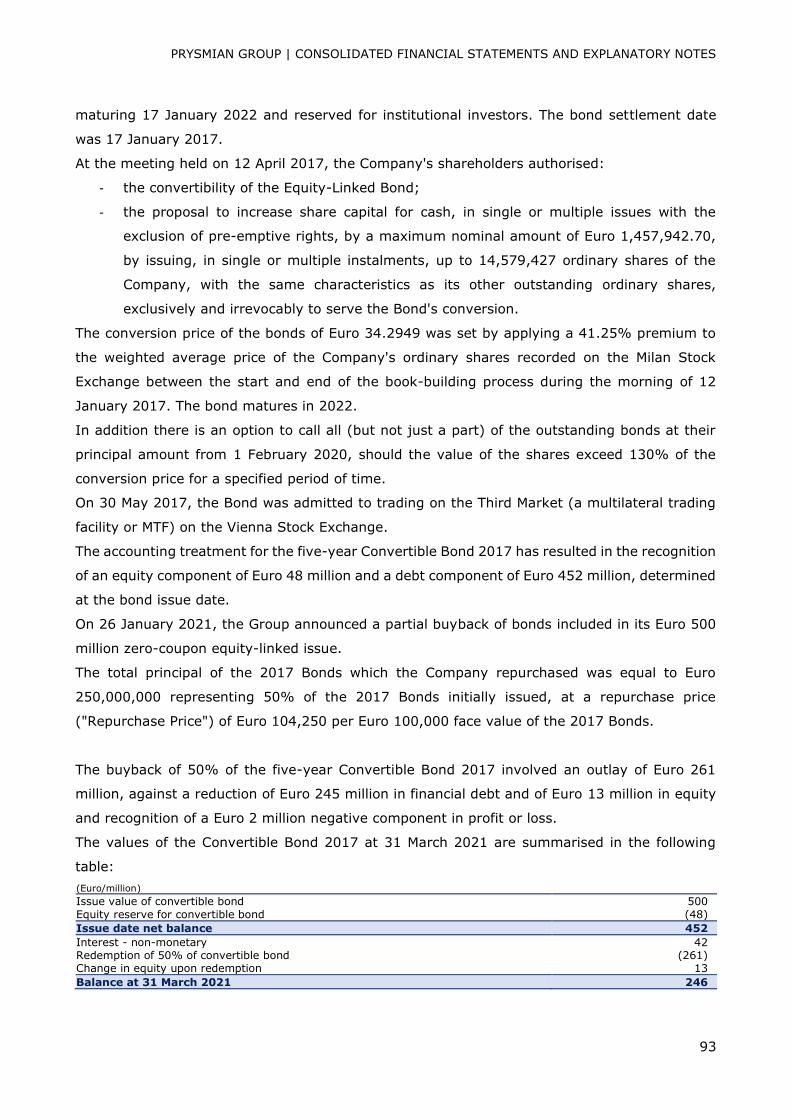
PRYSMIAN GROUP | CONSOLIDATED FINANCIAL STATEMENTS AND EXPLANATORY NOTES
93
maturing 17 January 2022 and reserved for institutional investors. The bond settlement date
was 17 January 2017.
At the meeting held on 12 April 2017, the Company's shareholders authorised:
- the convertibility of the Equity-Linked Bond;
- the proposal to increase share capital for cash, in single or multiple issues with the
exclusion of pre-emptive rights, by a maximum nominal amount of Euro 1,457,942.70,
by issuing, in single or multiple instalments, up to 14,579,427 ordinary shares of the
Company, with the same characteristics as its other outstanding ordinary shares,
exclusively and irrevocably to serve the Bond's conversion.
The conversion price of the bonds of Euro 34.2949 was set by applying a 41.25% premium to
the weighted average price of the Company's ordinary shares recorded on the Milan Stock
Exchange between the start and end of the book-building process during the morning of 12
January 2017. The bond matures in 2022.
In addition there is an option to call all (but not just a part) of the outstanding bonds at their
principal amount from 1 February 2020, should the value of the shares exceed 130% of the
conversion price for a specified period of time.
On 30 May 2017, the Bond was admitted to trading on the Third Market (a multilateral trading
facility or MTF) on the Vienna Stock Exchange.
The accounting treatment for the five-year Convertible Bond 2017 has resulted in the recognition
of an equity component of Euro 48 million and a debt component of Euro 452 million, determined
at the bond issue date.
On 26 January 2021, the Group announced a partial buyback of bonds included in its Euro 500
million zero-coupon equity-linked issue.
The total principal of the 2017 Bonds which the Company repurchased was equal to Euro
250,000,000 representing 50% of the 2017 Bonds initially issued, at a repurchase price
("Repurchase Price") of Euro 104,250 per Euro 100,000 face value of the 2017 Bonds.
The buyback of 50% of the five-year Convertible Bond 2017 involved an outlay of Euro 261
million, against a reduction of Euro 245 million in financial debt and of Euro 13 million in equity
and recognition of a Euro 2 million negative component in profit or loss.
The values of the Convertible Bond 2017 at 31 March 2021 are summarised in the following
table:
(Euro/million)
Issue value of convertible bond 500
Equity reserve for convertible bond (48)
Issue date net balance 452
Interest - non-monetary 42 Redemption of 50% of convertible bond (261) Change in equity upon redemption 13
Balance at 31 March 2021 246
PRYSMIAN GROUP | CONSOLIDATED FINANCIAL STATEMENTS AND EXPLANATORY NOTES
94
At 31 March 2021, the fair value of the Convertible Bond 2017 (equity component and debt
component) is Euro 252 million, almost all of which attributable to the debt component. In the
absence of trading on the relevant market, the fair value of the bond’s debt and equity
components has been determined using valuation techniques that refer to observable market
data (Level 2 of the fair value hierarchy).
General Cable bond
This convertible bond, originating from the acquisition of General Cable, was issued on 18
December 2009 for an amount of USD 429.5 million; it allowed bondholders the option, in the
event of an acquisition, to request repayment of the nominal value plus a premium. The Bond
was almost fully redeemed in the two months following the acquisition, with the remaining debt
at 31 March 2021 standing at USD 0.4 million.
Convertible Bond 2021
On 26 January 2021, the Group announced the successful placement (the "Placement") of an
equity-linked bond (the "Bonds") for an amount of Euro 750 million.
The Bonds, with a 5-year maturity from 2 February 2021 and minimum denomination of Euro
100,000 each, are zero coupon. The issue price is Euro 102.50, representing a yield to maturity
of minus 0.49% per annum. The initial price for the conversion of the Bonds into the Company's
ordinary shares is Euro 40.2355, representing a 47.50% premium on the weighted average price
by volume of Prysmian ordinary shares on the Milan Stock Exchange between the start and end
of the book-building process.
The Group will have the option to redeem all - but not only some - of the Bonds at their principal
amount from 12 February 2024, should the value of the new and/or existing ordinary shares
exceed 130% of the conversion price for a specified period of time.
On the issue date of 2 February 2021, an increase in cash and cash equivalents was recorded
for a total of Euro 768 million, against a corresponding increase in financial debt, of which Euro
703 million for the bond's debt component and Euro 65 million for the conversion option.
The change in the conversion option's fair value of Euro 16 million has been recognised in profit
and loss.
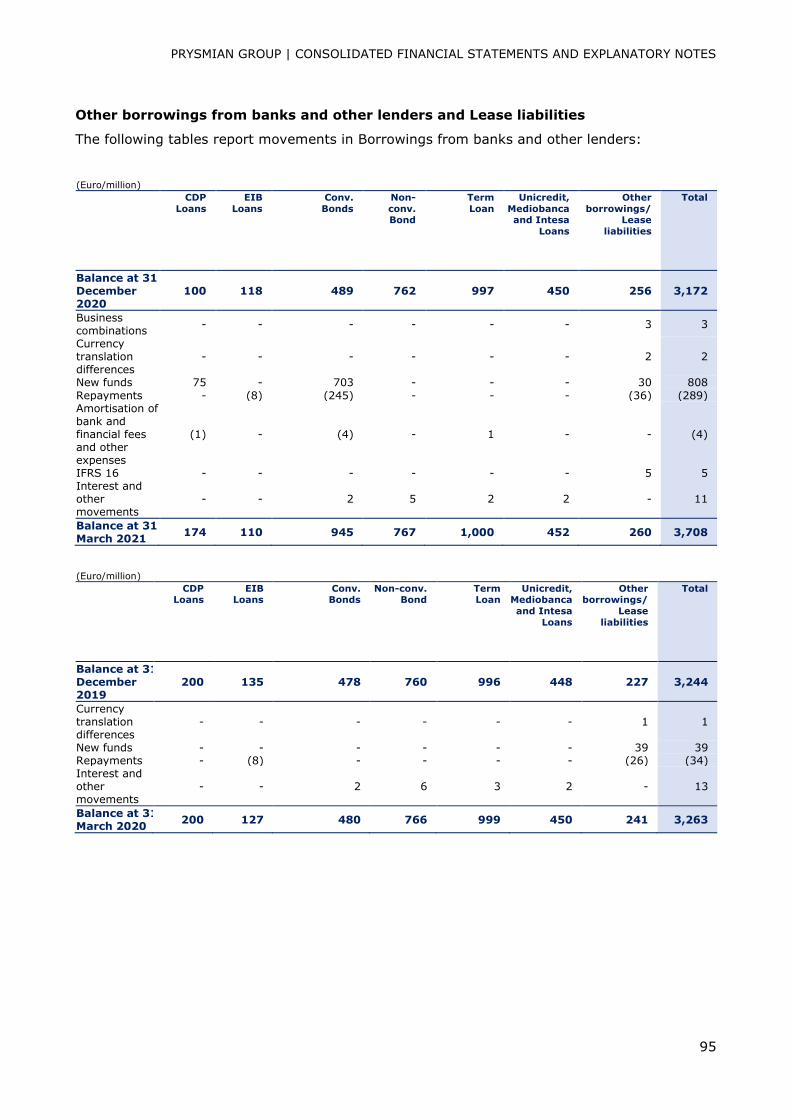
PRYSMIAN GROUP | CONSOLIDATED FINANCIAL STATEMENTS AND EXPLANATORY NOTES
95
Other borrowings from banks and other lenders and Lease liabilities
The following tables report movements in Borrowings from banks and other lenders:
(Euro/million) CDP
Loans
EIB
Loans
Conv.
Bonds
Non-
conv. Bond
Term
Loan
Unicredit,
Mediobanca and Intesa
Loans
Other
borrowings/ Lease
liabilities
Total
Balance at 31 December 2020
100 118 489 762 997 450 256 3,172
Business combinations
- - - - - - 3 3
Currency translation differences
- - - - - - 2 2
New funds 75 - 703 - - - 30 808
Repayments - (8) (245) - - - (36) (289) Amortisation of bank and financial fees and other expenses
(1) - (4) - 1 - - (4)
IFRS 16 - - - - - - 5 5 Interest and other movements
- - 2 5 2 2 - 11
Balance at 31 March 2021
174 110 945 767 1,000 452 260 3,708
(Euro/million) CDP
Loans EIB
Loans Conv. Bonds
Non-conv. Bond
Term Loan
Unicredit, Mediobanca
and Intesa
Loans
Other borrowings/
Lease
liabilities
Total
Balance at 31 December 2019
200 135 478 760 996 448 227 3,244
Currency translation differences
- - - - - - 1 1
New funds - - - - - - 39 39 Repayments - (8) - - - - (26) (34) Interest and other movements
- - 2 6 3 2 - 13
Balance at 31 March 2020
200 127 480 766 999 450 241 3,263

PRYSMIAN GROUP | CONSOLIDATED FINANCIAL STATEMENTS AND EXPLANATORY NOTES
96
NET FINANCIAL DEBT
(Euro/million)
Note 31.03.2021 31.12.2020
CDP Loans 9 174 100 EIB Loans 9 110 110 Non-convertible bond 9 749 748
Convertible Bond 2021 9 699 - Convertible Bond 2017 9 - 489 Term Loan 9 997 996 Unicredit Loan 9 200 200
Mediobanca Loan 9 100 100 Intesa Loan 9 150 150 Lease liabilities 9 138 143 Interest rate swaps 5 12 12
Other financial payables 9 11 9
Total long-term financial payables 3,340 3,057
EIB Loans 9 - 8 Non-convertible bond 9 18 14 Convertible Bond 2017 9 246 - Term Loan 9 3 1
Unicredit Loan 9 1 - Intesa Loan 9 1 - Lease liabilities 9 51 52 Interest rate swaps 5 5 7 Forward currency contracts on financial transactions
5 3 9
Other financial payables 9 60 52
Total short-term financial payables 388 143
Total financial liabilities 3,728 3,200
Long-term financial receivables 3 2 2 Long-term bank fees 3 2 3
Financial assets at amortised cost 4 4 Forward currency contracts on financial transactions (current)
5 6 4
Short-term financial receivables 3 8 4 Short-term bank fees 3 2 2 Financial assets at fair value through profit or loss
6 215 20
Financial assets at fair value through other comprehensive income 11 11
Financial assets held for sale - 1 1 Cash and cash equivalents 7 1,152 1,163
Total financial assets 1,403 1,214
Net financial debt 2,325 1,986
The following table presents a reconciliation of the Group's net financial debt to the amount that
must be reported in compliance with Consob notice n.5/21 of 29 April 2021 with regard of
“Guidelines on disclosure requirements pursuant to the Prospectus Regulation” published by
ESMA on 4 March 2021 with the document “ESAM32-383-1138”:
(Euro/million) Note 31.03.2021 31.12.2020
Net financial debt - as reported above 2,325 1,986
Long-term financial receivables and other assets 3 6 6 Long-term bank fees 3 2 3 Financial derivatives assets non current 5 - 2
Recalculated net financial debt 2,333 1,997
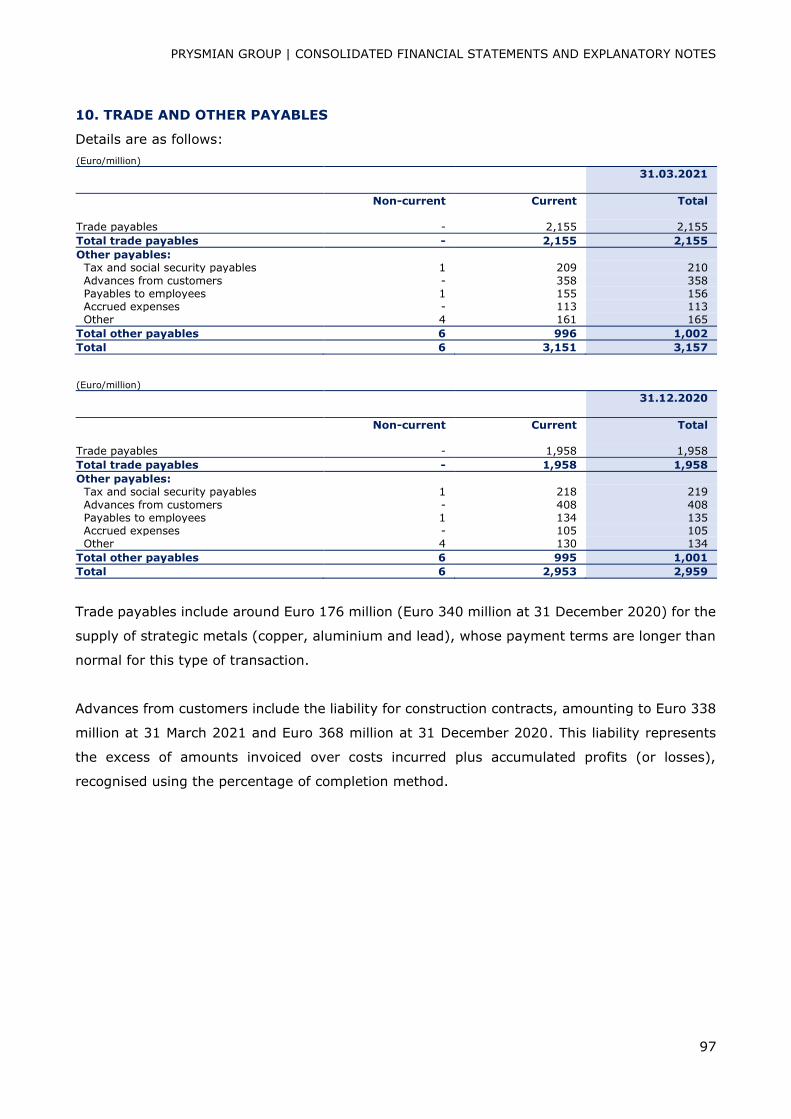
PRYSMIAN GROUP | CONSOLIDATED FINANCIAL STATEMENTS AND EXPLANATORY NOTES
97
10. TRADE AND OTHER PAYABLES
Details are as follows:
(Euro/million)
31.03.2021
Non-current Current Total
Trade payables - 2,155 2,155
Total trade payables - 2,155 2,155
Other payables:
Tax and social security payables 1 209 210
Advances from customers - 358 358 Payables to employees 1 155 156 Accrued expenses - 113 113 Other 4 161 165
Total other payables 6 996 1,002
Total 6 3,151 3,157
(Euro/million)
31.12.2020
Non-current Current Total
Trade payables - 1,958 1,958
Total trade payables - 1,958 1,958
Other payables:
Tax and social security payables 1 218 219
Advances from customers - 408 408 Payables to employees 1 134 135 Accrued expenses - 105 105 Other 4 130 134
Total other payables 6 995 1,001
Total 6 2,953 2,959
Trade payables include around Euro 176 million (Euro 340 million at 31 December 2020) for the
supply of strategic metals (copper, aluminium and lead), whose payment terms are longer than
normal for this type of transaction.
Advances from customers include the liability for construction contracts, amounting to Euro 338
million at 31 March 2021 and Euro 368 million at 31 December 2020. This liability represents
the excess of amounts invoiced over costs incurred plus accumulated profits (or losses),
recognised using the percentage of completion method.
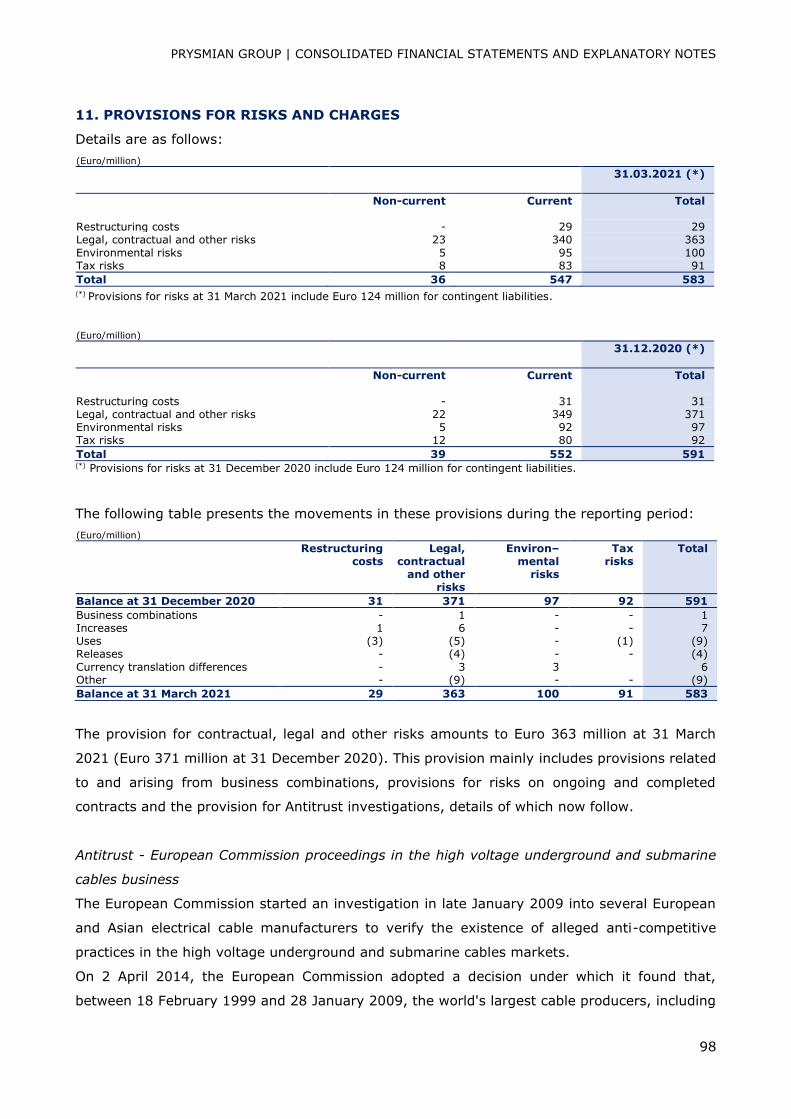
PRYSMIAN GROUP | CONSOLIDATED FINANCIAL STATEMENTS AND EXPLANATORY NOTES
98
11. PROVISIONS FOR RISKS AND CHARGES
Details are as follows:
(Euro/million)
31.03.2021 (*)
Non-current Current Total
Restructuring costs - 29 29 Legal, contractual and other risks 23 340 363
Environmental risks 5 95 100 Tax risks 8 83 91
Total 36 547 583 (*) Provisions for risks at 31 March 2021 include Euro 124 million for contingent liabilities.
(Euro/million)
31.12.2020 (*)
Non-current Current Total
Restructuring costs - 31 31 Legal, contractual and other risks 22 349 371 Environmental risks 5 92 97 Tax risks 12 80 92
Total 39 552 591 (*) Provisions for risks at 31 December 2020 include Euro 124 million for contingent liabilities.
The following table presents the movements in these provisions during the reporting period:
(Euro/million) Restructuring
costs Legal,
contractual and other
risks
Environ–mental
risks
Tax risks
Total
Balance at 31 December 2020 31 371 97 92 591
Business combinations - 1 - - 1 Increases 1 6 - - 7 Uses (3) (5) - (1) (9) Releases - (4) - - (4)
Currency translation differences - 3 3 6 Other - (9) - - (9)
Balance at 31 March 2021 29 363 100 91 583
The provision for contractual, legal and other risks amounts to Euro 363 million at 31 March
2021 (Euro 371 million at 31 December 2020). This provision mainly includes provisions related
to and arising from business combinations, provisions for risks on ongoing and completed
contracts and the provision for Antitrust investigations, details of which now follow.
Antitrust - European Commission proceedings in the high voltage underground and submarine
cables business
The European Commission started an investigation in late January 2009 into several European
and Asian electrical cable manufacturers to verify the existence of alleged anti-competitive
practices in the high voltage underground and submarine cables markets.
On 2 April 2014, the European Commission adopted a decision under which it found that,
between 18 February 1999 and 28 January 2009, the world's largest cable producers, including
PRYSMIAN GROUP | CONSOLIDATED FINANCIAL STATEMENTS AND EXPLANATORY NOTES
99
Prysmian Cavi e Sistemi S.r.l., had engaged in anti-competitive practices in the European market
for high voltage submarine and underground power cables. The European Commission held
Prysmian Cavi e Sistemi S.r.l. jointly liable with Pirelli & C. S.p.A. for the alleged infringement in
the period 18 February 1999 - 28 July 2005, ordering them to pay a fine of Euro 67.3 million,
and it held Prysmian Cavi e Sistemi S.r.l. jointly liable with Prysmian S.p.A. and The Goldman
Sachs Group Inc. for the alleged infringement in the period 29 July 2005 - 28 January 2009,
ordering them to pay a fine of Euro 37.3 million. Prysmian filed an appeal against this decision
with the General Court of the European Union along with an application to intervene in the
appeals respectively lodged by Pirelli & C. S.p.A. and The Goldman Sachs Group Inc. against the
same decision. Both Pirelli & C. S.p.A. and The Goldman Sachs Group Inc. in turn submitted
applications to intervene in the appeal brought by Prysmian against the European Commission's
decision. The applications to intervene presented by Prysmian, Pirelli and The Goldman Sachs
Group Inc. were accepted by the General Court of the European Union. Prysmian did not incur
any financial outlay as a result of this decision having elected, pending the outcome of the
appeals, to provide bank guarantees as security against payment of 50% of the fine imposed by
the European Commission (amounting to approximately Euro 52 million) for the alleged
infringement in both periods. As far as Prysmian is aware, Pirelli & C. S.p.A. also provided the
European Commission with a bank guarantee for 50% of the value of the fine imposed for the
alleged infringement in the period 18 February 1999 - 28 July 2005.
On 12 July 2018, the General Court of the European Union handed down its rulings on the
appeals lodged by the Prysmian Group, including General Cable. These rulings dismissed the
appeals and confirmed the previously imposed fines. Prysmian Group, including General Cable,
disagreeing with the conclusions reached by the General Court of the European Union, presented
an appeal to the Court of Justice of the European Union. The appeal filed by Prysmian was heard
on 23 October 2019. In a ruling handed down on 14 November 2019, the Court of Justice of the
European Union dismissed General Cable's appeal, thus conclusively confirming the fine
previously imposed by the European Commission. As a result, the Group went ahead and paid a
fine for Euro 2 million.
In rulings handed down on 24 September 2020, 28 October 2020 and 27 January 2021
respectively, the Court of Justice dismissed the appeals brought by Prysmian, Pirelli & C. S.p.A.
and The Goldman Sachs Group Inc., thus upholding the liability and fine envisaged under the
European Commission's original decision. Further to the ruling dismissing Prysmian's appeal, the
European Commission requested Prysmian Group to pay the sum of approximately Euro 20
million, corresponding to half of the fine for the period from 29 July 2005 to 28 January 2009.
Following the ruling dismissing the Pirelli appeal, the European Commission requested the
Prysmian Group to pay the sum of approximately Euro 37 million, corresponding to half of the
fine for the period from 18 February 1999 to 28 July 2005. Using the provisions already set aside
in previous years, the Group made these payments within the required timeframe.
PRYSMIAN GROUP | CONSOLIDATED FINANCIAL STATEMENTS AND EXPLANATORY NOTES
100
Pirelli & C. S.p.A. has brought a civil action against Prysmian Cavi e Sistemi S.r.l. in the Milan
Courts, seeking to be held harmless for all claims made by the European Commission in
implementation of its decision and for any expenses related to such implementation. Prysmian
Cavi e Sistemi S.r.l. started legal proceedings in February 2015, requesting that the claims
brought by Pirelli & C. S.p.A. be dismissed in their entirety and that it should be Pirelli & C. S.p.A.
which holds harmless Prysmian Cavi e Sistemi S.r.l., with reference to the alleged infringement
in the period 18 February 1999 - 28 July 2005, for all claims made by the European Commission
in implementation of its decision and for any expenses related to such implementation. The
proceedings were then stayed by order of the court concerned in April 2015, pending the
outcome of the appeals made against the European Commission's decision by both Prysmian
and Pirelli in the European Courts. Pirelli challenged this decision before the Court of Cassation,
Italy's highest court of appeal, which confirmed the stay of execution ordered by the Milan
Courts. Following the conclusion of the appeal proceedings before the European Court of Justice,
Pirelli has resumed the legal action brought in the Court of Milan. This action has been recently
combined with that brought by Pirelli & C. S.p.A. in October 2019, also before the Court of Milan,
and which is discussed in the following paragraph on "Antitrust - Claims for damages resulting
from the European Commission's 2014 decision".
Antitrust - Other proceedings in the high voltage underground and submarine cables business in
jurisdictions other than the European Union
In Brazil, the local antitrust authority started an investigation into several manufacturers of high
voltage underground and submarine cables, amongst whom Prysmian, notified of this
investigation in 2011. Prysmian's preliminary defence was rejected by the local competition
authority in a statement issued in February 2015. On 3 January 2019, the authority informed
Prysmian that the pre-trial phase had been completed, in response to which Prysmian submitted
its brief on 18 January 2019. On 11 February 2019, as a result of its investigation the general
superintendence of the Brazilian antitrust authority (Administrative Council for Economic
Defense – "CADE") published a statement of objections (Technical Note) in the Brazilian Federal
Official Gazette.
On 15 April 2020, the CADE Tribunal issued the operative part of the decision under which it
held Prysmian liable for the contested infringement in the period from February 2001 to March
2004 and ordered it to pay a fine of BRL 10.2 million (approximately Euro 1.8 million). Prysmian
Group has filed an appeal against the CADE ruling.
Antitrust - Claims for damages resulting from the European Commission's 2014 decision
During 2015, National Grid and Scottish Power, two British operators, filed claims in the High
Court of London against certain cable manufacturers, including Prysmian Group companies, to
obtain compensation for damages purportedly suffered as a result of the alleged anti-competitive
PRYSMIAN GROUP | CONSOLIDATED FINANCIAL STATEMENTS AND EXPLANATORY NOTES
101
practices fined by the European Commission in the decision adopted in April 2014. On 29 July
2020, an agreement was finalised between Prysmian Group and Scottish Power to settle the
dispute out of court. On 10 November 2020, an agreement was also finalised between Prysmian
Group and National Grid to settle the dispute out of court. The pending legal actions have
therefore been abandoned and will no longer be pursued. In both cases, the provisions set aside
by the Group were sufficient to cover the amounts negotiated in settlement.
During the first few months of 2017, in addition to those mentioned in the preceding paragraph,
other operators belonging to the Vattenfall Group filed claims in the High Court of London against
certain cable manufacturers, including companies in the Prysmian Group, to obtain compensation
for damages purportedly suffered as a result of the alleged anti-competitive practices fined by
the European Commission.
During the month of June 2020, the Prysmian companies concerned presented their defence as
well as serving a summons on another party to whom the EU decision was addressed.
On 2 April 2019, a writ of summons was served, on behalf of Terna S.p.A., on Pirelli, Nexans
and companies in the Prysmian Group, demanding compensation for damages purportedly
suffered as a result of the alleged anti-competitive practices fined by the European Commission
in its April 2014 decision. This action has been brought before the Court of Milan. On 24 October
2019, the Prysmian Group companies concerned responded by presenting their preliminary
defence. By an order dated 3 February 2020, the Court upheld the points raised by the
defendants, giving Terna until 11 May 2020 to complete its writ of summons and scheduling a
hearing for 20 October 2020. Terna duly completed its summons, which was filed within the
required deadline.
In addition, on 4 April 2019, the Group learned that the following legal actions had been brought
in the Court of London, both of which involving claims for damages purportedly suffered as a
result of the alleged anti-competitive practices fined by the European Commission:
- action by Scottish and Southern Energy (SSE) Group companies against certain
Prysmian Group companies involving a series of onshore and submarine projects. On 5
September 2019, a writ of summons was served in which the plaintiffs substantiated
and quantified their claim for damages. On 5 November 2019, the Prysmian Group
companies concerned responded by presenting their preliminary defence.
- action by Greater Gabbard Offshore Winds Limited and SSE companies against certain
Group companies. On 5 September 2019, a writ of summons was served in which the
plaintiffs substantiated and quantified their claim for damages. On 5 November 2019,
the Prysmian Group companies concerned responded by presenting their preliminary
defence.
PRYSMIAN GROUP | CONSOLIDATED FINANCIAL STATEMENTS AND EXPLANATORY NOTES
102
On 23 April 2020, the initial hearing was held for both the above proceedings, which are being
dealt with jointly and are now in the pre-trial phase.
On 2 April 2019, a writ of summons was served, on behalf of Electricity & Water Authority of
Bahrain, GCC Interconnection Authority, Kuwait Ministry of Electricity and Water and Oman
Electricity Transmission Company, on certain cable manufacturers, including companies in the
Prysmian Group, on Pirelli & C. S.p.A. and The Goldman Sachs Group Inc. This action, brought
in the Court of Amsterdam, once again involved a claim for compensation for damages
purportedly suffered as a result of the alleged anti-competitive practices fined by the European
Commission. On 18 December 2019, the Prysmian Group companies concerned presented their
preliminary defence, the hearing of which took place on 8 September 2020, at the end of which
the judge reserved passing judgement. On 25 November 2020, the Court of Amsterdam handed
down a ruling under which it upheld the submissions made and declined jurisdiction over
defendants not based in the Netherlands, thus excluding them from the proceedings. On 19
February 2021, the plaintiffs announced that they had filed an appeal against this ruling.
In view of the circumstances described, the Directors, also assisted by their legal advisors, have
recognised a level of provisions deemed appropriate to cover the potential liabilities related to
the matters in question.
Prysmian S.p.A. and Prysmian Cavi e Sistemi S.r.l. were summoned by Nexans France SAS and
Nexans SA to appear before the Court of Dortmund (Germany) in notifications dated 24 and 25
May 2018 respectively. The plaintiffs have asked the Court concerned to ascertain the existence
of joint and several liability between Prysmian S.p.a. and Prysmian Cavi e Sistemi S.r.l., on the
one hand, and Nexans France SAS and Nexans SA, on the other, for any damages suffered by
third parties in Germany as a result of the alleged cartel in the market for high voltage
underground and submarine power cables condemned in the European Commission's decision.
The Court concerned issued a stay of execution dated 3 June 2019 pending the outcome of the
appeal against the European Commission's decision brought before the European Courts by both
Prysmian and Nexans. Following the conclusion of the appeal proceedings pending before the
European Court of Justice, Nexans has resumed the previously stayed legal action.
On 2 April 2019, certain Group companies received a letter sent on behalf of Tennet TSO BV
claiming compensation for damages purportedly suffered as a result of the alleged anti-
competitive practices fined by the European Commission. However, the letter does not include
any quantification of the damages and explicitly states that its purpose, among others, is to
avoid expiry of the statute of limitations.
PRYSMIAN GROUP | CONSOLIDATED FINANCIAL STATEMENTS AND EXPLANATORY NOTES
103
Even though a negative outcome is considered likely, the Directors have been unable to estimate
the amount to provide against this and the other actions listed above because the plaintiffs have
not quantified their claims.
Lastly, Prysmian Cavi e Sistemi S.r.l. and Prysmian S.p.A. were served with a writ of summons
on 24 October 2019 from Pirelli & C. S.p.A. in which the latter seeks to be released from any
third-party claim for damages relating to the practices forming the subject of the European
Commission's decision and to be compensated for the damages allegedly incurred and
quantified, which it has suffered through Prysmian having sought, in certain pending
proceedings, to attribute liability to Pirelli for the illegal practices determined by the European
Commission in the period from 1999 to 2005. In November 2020, the Group companies filed an
action requesting that the claims brought by Pirelli & C. S.p.A. be rejected in their entirety and
that it be Pirelli & C. S.p.A. which should hold the Group companies harmless from any third-
party claim for damages relating to the practices forming the subject of the European
Commission's decision. This action has been recently combined with that brought by Pirelli & C.
S.p.A. in November 2014, also before the Court of Milan, and which is discussed in the earlier
paragraph on "Antitrust - European Commission proceedings in the high voltage underground
and submarine cables business".
Based on the information currently available, and believing this potential liability unlikely to
crystallise, the Directors are of the opinion not to make any provision.
Antitrust - Other claims for damages
On 22 March 2019, National Grid communicated that it had brought a new action in the High
Court of London against certain Group companies in which it claims compensation for damages
purportedly suffered through alleged anti-competitive practices employed over a period running
from the 1970s until 1997. On 10 November 2020, the parties reached an agreement under
which the dispute was settled out of court. The pending legal action has therefore been
abandoned and will no longer be pursued.
Antitrust - Other investigations
At the end of February 2016, the Spanish antitrust authorities initiated proceedings to verify the
existence of anti-competitive practices by local low voltage cable manufacturers and distributors,
including the Group's local subsidiaries. The Spanish competition authority then sent a statement
of objections to some of the Group's local subsidiaries in January 2017.
On 24 November 2017, the local competition authority notified the Group's Spanish subsidiaries
of a decision under which they were held liable for the alleged infringements in the period from
June 2002 to June 2015 and were jointly and severally ordered to pay a fine of Euro 15.6 million.

PRYSMIAN GROUP | CONSOLIDATED FINANCIAL STATEMENTS AND EXPLANATORY NOTES
104
The Group's Spanish subsidiaries have appealed against this decision. The appeal decision is still
pending.
The decision of 24 November 2017 also held the Spanish subsidiaries of General Cable liable for
breach of local antitrust law. However, they have obtained immunity from paying the related
fine (quantified at about Euro 12.6 million) having filed for leniency and collaborated with the
local competition authority in its investigations. The Spanish subsidiaries of General Cable have
also appealed against the decision of the local competition authority; the appeal decision is still
pending.
As at the date of writing the present report, the Chilean Antitrust Authority is conducting an
investigation into the Chilean subsidiary Colada Continua Chilena S.A..
In view of the circumstances described, the Directors, also assisted by their legal advisors and
in consistency with the accounting policies, have adjusted the related provisions for risks to a
level deemed appropriate to cover the potential liabilities for the matters in question.
Antitrust - Claims for damages ensuing from other investigations
In February 2020, a writ of summons was served on a number of cable manufacturers, including
Prysmian Group's Spanish subsidiaries, under which companies belonging to the Iberdrola Group
have claimed compensation for damages supposedly suffered as a result of the alleged anti-
competitive practices condemned by the Spanish competition authority in its decision of 24
November 2017. The case is pending before the Court of Barcelona.
In July 2020, a writ of summons was served on a number of cable manufacturers, including
Prysmian Group's Spanish subsidiaries, under which companies belonging to the Endesa Group
have claimed compensation for damages supposedly suffered as a result of the alleged anti-
competitive practices condemned by the Spanish competition authority in its decision of 24
November 2017. The case is pending before the Court of Barcelona.
Based on the information currently available, and believing these potential liabilities unlikely to
crystallise, the Directors are of the opinion not to make any provision.
As at 31 March 2021, the provision for the above Antitrust matters amounts to approximately
Euro 122 million.
Despite the uncertainty of the outcome of the investigations and legal actions in progress, the
amount of this provision is considered to represent the best estimate of the liability based on
the information now available.
PRYSMIAN GROUP | CONSOLIDATED FINANCIAL STATEMENTS AND EXPLANATORY NOTES
105
Warranty provisions
Provisions for legal, contractual and other risks include those for warranties against completed
projects, among which the most significant is the warranty provision for the Western Link
contract. In light of the agreement reached with the customer in January 2021, which revised
the terms of the original contract and helped reduce the Group's risk exposure in this regard,
potential liabilities arising from events that could occur during the warranty period are considered
to be adequately covered by the provisions already set aside.
12. EMPLOYEE BENEFIT OBLIGATIONS
Details are as follows:
(Euro/million) 31.03.2021 31.12.2020
Pension plans 423 419 Italian statutory severance benefit 15 15
Medical benefit plans 31 30 Termination and other benefits 42 42
Total 511 506
Movements in employee benefit obligations have had an overall impact of Euro 4 million on the
period's income statement, of which Euro 3 million classified in Personnel costs and Euro 1 million
in Finance costs.
The period average headcount and period-end closing headcount are shown below:
3 months 2021 3 months 2020
Average number 28,879 28,640
31.03.2021 31.12.2020
Closing number 29,398 28,321
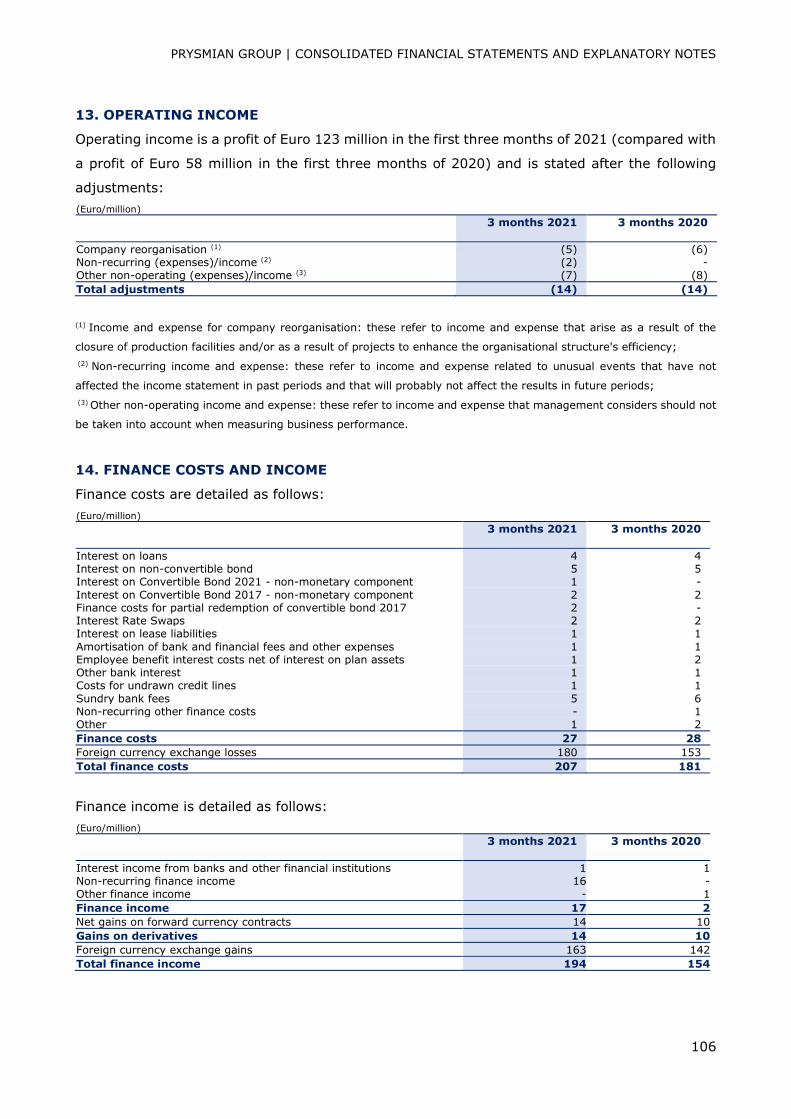
PRYSMIAN GROUP | CONSOLIDATED FINANCIAL STATEMENTS AND EXPLANATORY NOTES
106
13. OPERATING INCOME
Operating income is a profit of Euro 123 million in the first three months of 2021 (compared with
a profit of Euro 58 million in the first three months of 2020) and is stated after the following
adjustments:
(Euro/million) 3 months 2021 3 months 2020
Company reorganisation (1) (5) (6) Non-recurring (expenses)/income (2) (2) - Other non-operating (expenses)/income (3) (7) (8)
Total adjustments (14) (14)
(1) Income and expense for company reorganisation: these refer to income and expense that arise as a result of the
closure of production facilities and/or as a result of projects to enhance the organisational structure's efficiency;
(2) Non-recurring income and expense: these refer to income and expense related to unusual events that have not
affected the income statement in past periods and that will probably not affect the results in future periods;
(3) Other non-operating income and expense: these refer to income and expense that management considers should not
be taken into account when measuring business performance.
14. FINANCE COSTS AND INCOME
Finance costs are detailed as follows:
(Euro/million)
3 months 2021 3 months 2020
Interest on loans 4 4 Interest on non-convertible bond 5 5 Interest on Convertible Bond 2021 - non-monetary component 1 -
Interest on Convertible Bond 2017 - non-monetary component 2 2 Finance costs for partial redemption of convertible bond 2017 2 - Interest Rate Swaps 2 2 Interest on lease liabilities 1 1
Amortisation of bank and financial fees and other expenses 1 1 Employee benefit interest costs net of interest on plan assets 1 2 Other bank interest 1 1 Costs for undrawn credit lines 1 1
Sundry bank fees 5 6 Non-recurring other finance costs - 1 Other 1 2
Finance costs 27 28
Foreign currency exchange losses 180 153
Total finance costs 207 181
Finance income is detailed as follows:
(Euro/million)
3 months 2021 3 months 2020
Interest income from banks and other financial institutions 1 1 Non-recurring finance income 16 - Other finance income - 1
Finance income 17 2
Net gains on forward currency contracts 14 10
Gains on derivatives 14 10
Foreign currency exchange gains 163 142
Total finance income 194 154
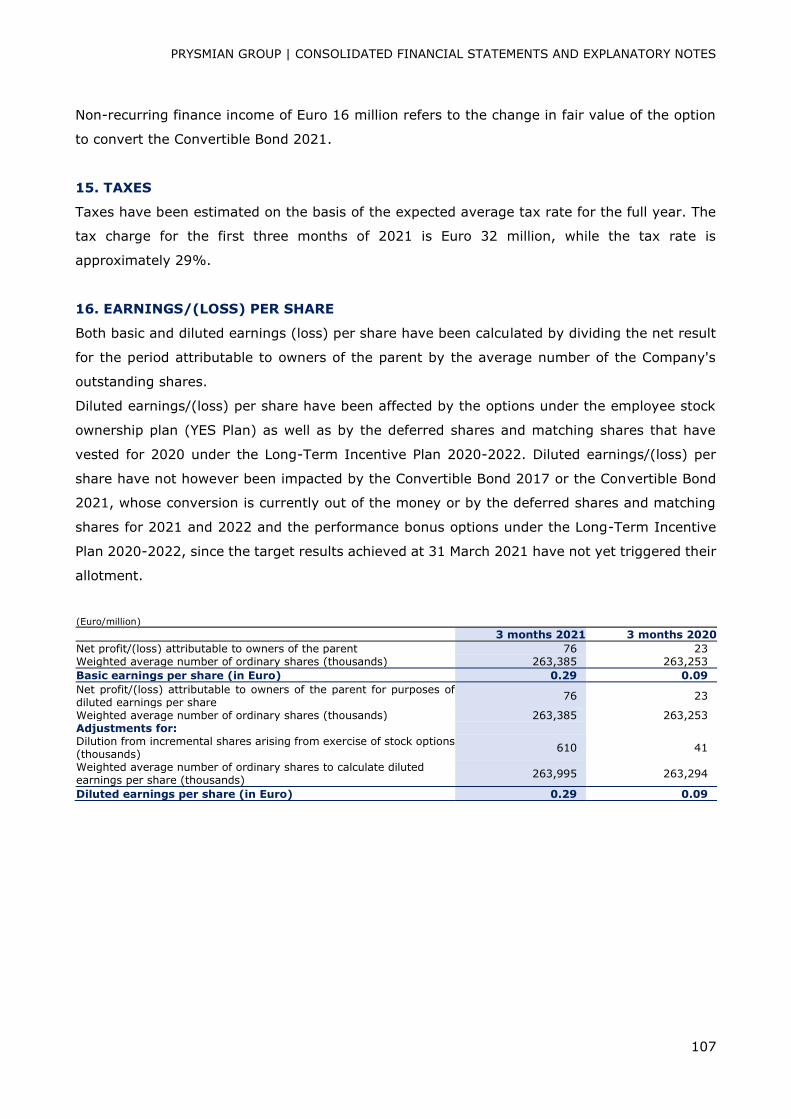
PRYSMIAN GROUP | CONSOLIDATED FINANCIAL STATEMENTS AND EXPLANATORY NOTES
107
Non-recurring finance income of Euro 16 million refers to the change in fair value of the option
to convert the Convertible Bond 2021.
15. TAXES
Taxes have been estimated on the basis of the expected average tax rate for the full year. The
tax charge for the first three months of 2021 is Euro 32 million, while the tax rate is
approximately 29%.
16. EARNINGS/(LOSS) PER SHARE
Both basic and diluted earnings (loss) per share have been calculated by dividing the net result
for the period attributable to owners of the parent by the average number of the Company's
outstanding shares.
Diluted earnings/(loss) per share have been affected by the options under the employee stock
ownership plan (YES Plan) as well as by the deferred shares and matching shares that have
vested for 2020 under the Long-Term Incentive Plan 2020-2022. Diluted earnings/(loss) per
share have not however been impacted by the Convertible Bond 2017 or the Convertible Bond
2021, whose conversion is currently out of the money or by the deferred shares and matching
shares for 2021 and 2022 and the performance bonus options under the Long-Term Incentive
Plan 2020-2022, since the target results achieved at 31 March 2021 have not yet triggered their
allotment.
(Euro/million)
3 months 2021 3 months 2020
Net profit/(loss) attributable to owners of the parent 76 23 Weighted average number of ordinary shares (thousands) 263,385 263,253
Basic earnings per share (in Euro) 0.29 0.09
Net profit/(loss) attributable to owners of the parent for purposes of diluted earnings per share
76 23
Weighted average number of ordinary shares (thousands) 263,385 263,253 Adjustments for:
Dilution from incremental shares arising from exercise of stock options (thousands)
610 41
Weighted average number of ordinary shares to calculate diluted earnings per share (thousands)
263,995 263,294
Diluted earnings per share (in Euro) 0.29 0.09
PRYSMIAN GROUP | CONSOLIDATED FINANCIAL STATEMENTS AND EXPLANATORY NOTES
108
17. CONTINGENT LIABILITIES
As a global operator, the Group is exposed to legal risks primarily, by way of example, in the
areas of product liability and environmental, antitrust and tax rules and regulations. The outcome
of legal disputes and proceedings currently in progress cannot be predicted with certainty. An
adverse outcome in one or more of these proceedings could result in the payment of costs that
are not covered, or not fully covered, by insurance, which would therefore have a direct effect
on the Group's financial position and results.
18. RECEIVABLES FACTORING
The Group has factored some of its trade receivables on a without-recourse basis. The amount
of receivables factored but not yet paid by customers was Euro 262 million at 31 March 2021
(Euro 256 million at 31 December 2020).
19. SEASONALITY
The Group's business features a certain degree of seasonality in its revenues, which are usually
higher in the second and third quarters. This is due to the fact that utilities projects in the
northern hemisphere are mostly concentrated in the warmer months of the year. The Group's
level of debt is generally higher in the period May-September, with funds being absorbed by the
growth in working capital.
20. RELATED PARTY TRANSACTIONS
Transactions between Prysmian S.p.A. and its subsidiaries with associates mainly refer to:
- trade relations involving purchases and sales of raw materials and finished goods;
- services (technical, organisational and general) provided by head office for the benefit of
Group companies;
- recharge of royalties for the use of trademarks, patents and technological know-how by
Group companies.
All the above transactions form part of the Group's continuing operations.
The following tables provide a summary of related party transactions in the three months ended
31 March 2021:

PRYSMIAN GROUP | CONSOLIDATED FINANCIAL STATEMENTS AND EXPLANATORY NOTES
109
(Euro/million)
31.03.2021 Equity-
accounted companies
Compensation
of directors, statutory
auditors and key
management personnel
Total
related parties
Total
reported amount
Related
party % of total
Equity-accounted investments 326 - 326 326 100.0% Trade receivables 7 - 7 1,755 0.4% Other receivables 3 - 3 568 0.5%
Trade payables 2 - 2 2,155 0.1% Other payables 2 2 4 1,002 0.4% Provisions for risks and charges - 9 9 583 1.5%
(Euro/million)
31.12.2020 Equity-
accounted companies
Compensation of directors,
statutory auditors and
key management
personnel
Total related parties
Total reported amount
Related party
% of total
Equity-accounted investments 312 - 312 312 100.0% Trade receivables 3 - 3 1,374 0.2%
Other receivables 3 - 3 522 0.6% Trade payables 2 - 2 1,958 0.1% Other payables - 5 5 1,001 0.5% Provisions for risks and charges - 9 9 591 1.5%
(Euro/million)
3 months 2021
Equity-accounted companies
Compensation of directors, statutory
auditors and key management
personnel
Total related parties
Total reported amount
Related party
% of total
Sales 9 - 9 2,810 0.3% Other income 1 - 1 12 8.3% Raw materials. consumables and supplies (1) - (1) (2,042) 0.0% Personnel costs - (2) (2) (366) 0.5%
Other expenses (1) - (1) (383) 0.4% Share of net profit/(loss) of equity-accounted companies
6 - 6 6 100.0%
(Euro/million)
3 months 2020
Equity-accounted companies
Compensation of directors, statutory
auditors and key management
personnel
Total related parties
Total reported amount
Related party
% of total
Sales 4 - 4 2,587 0.2% Other income 1 - 1 13 7.7%
Raw materials. consumables and supplies (4) - (4) (1,708) 0.2% Personnel costs - (2) (2) (376) 0.5% Other expenses (1) - (1) (429) 0.3% Share of net profit/(loss) of equity-accounted companies
1 - 1 1 100.0%
PRYSMIAN GROUP | CONSOLIDATED FINANCIAL STATEMENTS AND EXPLANATORY NOTES
110
Transactions with associates
Trade and other payables refer to goods and services provided in the ordinary course of the
Group's business. Trade and other receivables refer to transactions carried out in the ordinary
course of the Group's business.
Compensation of Directors, Statutory Auditors and Key Management Personnel
The compensation of the Directors, Statutory Auditors and Key Management Personnel totals
Euro 2 million at 31 March 2021 (Euro 3 million in the first three months of 2020).
21. ATYPICAL AND/OR UNUSUAL TRANSACTIONS
In accordance with the disclosures required by Consob Communication DEM/6064293 dated 28
July 2006, it is reported that no atypical and/or unusual transactions were carried out during the
first three months of 2021.
22. COMMITMENTS
Contractual commitments, already given to third parties at 31 March 2021 and not yet reflected
in the financial statements, amount to Euro 150 million for Property, plant and equipment and
Euro 3 million for Intangible assets.
As at 31 March 2021, there are no outstanding loans or guarantees by the Parent Company or
its subsidiaries to any of the directors, senior managers or statutory auditors.
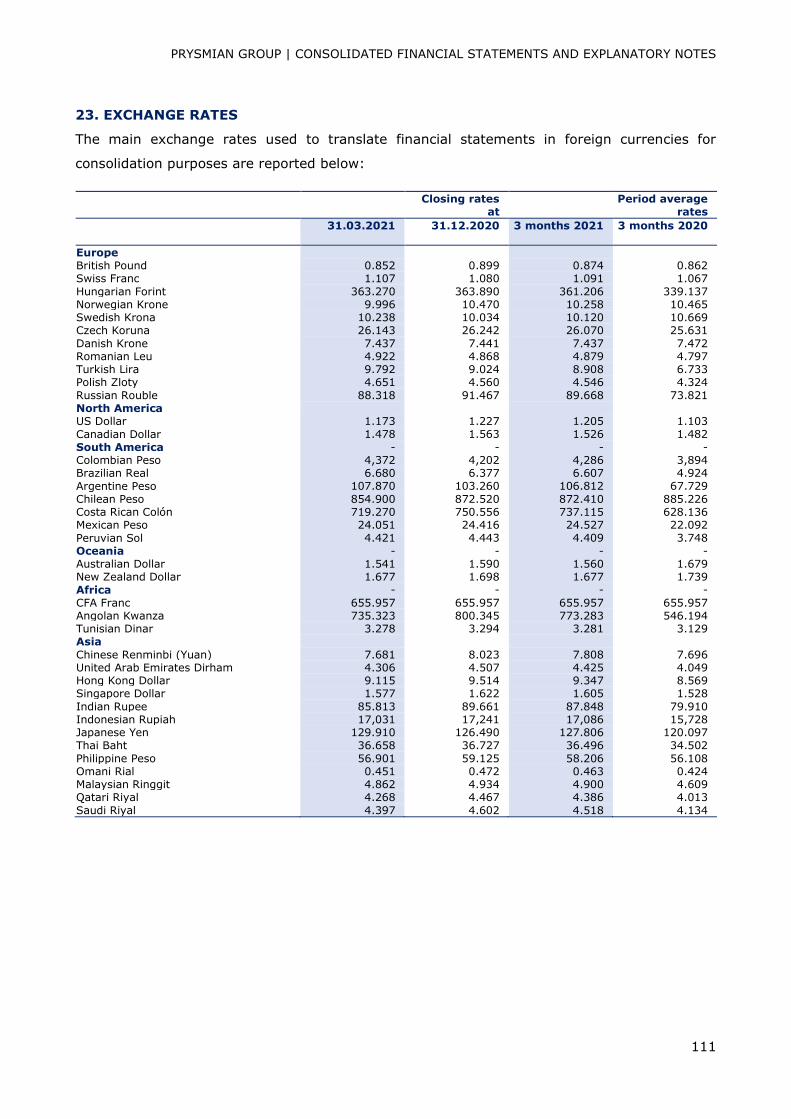
PRYSMIAN GROUP | CONSOLIDATED FINANCIAL STATEMENTS AND EXPLANATORY NOTES
111
23. EXCHANGE RATES
The main exchange rates used to translate financial statements in foreign currencies for
consolidation purposes are reported below:
Closing rates at
Period average
rates 31.03.2021 31.12.2020 3 months 2021 3 months 2020
Europe
British Pound 0.852 0.899 0.874 0.862 Swiss Franc 1.107 1.080 1.091 1.067
Hungarian Forint 363.270 363.890 361.206 339.137 Norwegian Krone 9.996 10.470 10.258 10.465 Swedish Krona 10.238 10.034 10.120 10.669 Czech Koruna 26.143 26.242 26.070 25.631
Danish Krone 7.437 7.441 7.437 7.472 Romanian Leu 4.922 4.868 4.879 4.797 Turkish Lira 9.792 9.024 8.908 6.733 Polish Zloty 4.651 4.560 4.546 4.324
Russian Rouble 88.318 91.467 89.668 73.821 North America
US Dollar 1.173 1.227 1.205 1.103
Canadian Dollar 1.478 1.563 1.526 1.482
South America - - - - Colombian Peso 4,372 4,202 4,286 3,894 Brazilian Real 6.680 6.377 6.607 4.924
Argentine Peso 107.870 103.260 106.812 67.729
Chilean Peso 854.900 872.520 872.410 885.226 Costa Rican Colón 719.270 750.556 737.115 628.136 Mexican Peso 24.051 24.416 24.527 22.092
Peruvian Sol 4.421 4.443 4.409 3.748
Oceania - - - - Australian Dollar 1.541 1.590 1.560 1.679 New Zealand Dollar 1.677 1.698 1.677 1.739
Africa - - - -
CFA Franc 655.957 655.957 655.957 655.957 Angolan Kwanza 735.323 800.345 773.283 546.194 Tunisian Dinar 3.278 3.294 3.281 3.129 Asia
Chinese Renminbi (Yuan) 7.681 8.023 7.808 7.696 United Arab Emirates Dirham 4.306 4.507 4.425 4.049 Hong Kong Dollar 9.115 9.514 9.347 8.569 Singapore Dollar 1.577 1.622 1.605 1.528
Indian Rupee 85.813 89.661 87.848 79.910 Indonesian Rupiah 17,031 17,241 17,086 15,728 Japanese Yen 129.910 126.490 127.806 120.097 Thai Baht 36.658 36.727 36.496 34.502
Philippine Peso 56.901 59.125 58.206 56.108 Omani Rial 0.451 0.472 0.463 0.424 Malaysian Ringgit 4.862 4.934 4.900 4.609 Qatari Riyal 4.268 4.467 4.386 4.013
Saudi Riyal 4.397 4.602 4.518 4.134
PRYSMIAN GROUP | CONSOLIDATED FINANCIAL STATEMENTS AND EXPLANATORY NOTES
112
24. EVENTS AFTER THE REPORTING PERIOD
Successful completion of the first ever submarine interconnection between the island
of Crete and mainland Greece
On 1 April 2021, the Group and Independent Power Transmission Operator (IPTO) announced
the completion of the submarine interconnection between the island of Crete and mainland
Greece (Peloponnese region), a record-breaking project in many respects, including in terms of
length, depth and innovative HVAC cable technology. Prysmian Group has designed, supplied,
and installed an HVAC cable system involving 135 km of 150 kV tri-core XLPE insulated double-
armoured cables. This is a record-breaking project because Prysmian Group has installed its
innovative cable technology, based on a synthetic armour 30% lighter than steel, at a maximum
depth of approximately 1,000 metres for the very first time. The project, worth a total of Euro
125 million, was awarded to the Group in 2018 by IPTO, operator of the electricity grid
transmission system in Greece. The first interconnection between Crete and mainland Greece is
expected to become operational in the next few months, ensuring reliable, cost-effective and
sustainable power transmission.
Approval of the Annual Financial Statements at 31 December 2020, distribution of
dividends and appointment of the Prysmian S.p.A. Board of Directors
On 28 April 2021, the shareholders of Prysmian S.p.A. approved the financial statements for
2020 and the distribution of a gross dividend of Euro 0.50 per share, for a total of some Euro
132 million. The dividend will be paid out from 26 May 2021, with record date 25 May 2021 and
ex-dividend date 24 May 2021. The same Shareholders' Meeting also appointed the new
members of the Prysmian S.p.A. Board of Directors.
Authorisation to buy back and dispose of treasury share
On 28 April 2021, the shareholders of Prysmian S.p.A. authorised the Board of Directors to buy
back and dispose of treasury shares. This authorisation provides the opportunity to buy back,
on one or more occasions, a maximum number of shares whose total must not exceed, at any
one time, 10% of share capital. Purchases may not exceed the amount of retained earnings and
unrestricted reserves reported in the most recently approved annual financial statements. The
authorisation to buy back treasury shares will last for 18 months commencing from the date of
the Shareholders' Meeting, while the authorisation to dispose of treasury shares has no time
limit. The authorisation to purchase and dispose of treasury shares is required in order to enable
the Group:
- to have a portfolio of treasury shares (a so-called "stock of shares") that can be used in any
extraordinary transactions (e.g. mergers, demergers, spin-offs, acquisition of equity
investments) and to implement the remuneration policies approved by the Company's
shareholders and applied to Prysmian Group;
PRYSMIAN GROUP | CONSOLIDATED FINANCIAL STATEMENTS AND EXPLANATORY NOTES
113
- to use the treasury shares purchased to service the exercise of rights arising from convertible
debt instruments or instruments exchangeable with financial instruments issued by the
Company, its subsidiaries or third parties (e.g. in takeovers bids and/or stock swaps);
- to use the treasury shares to satisfy share-based incentive plans or share ownership plans
reserved for Prysmian Group directors and/or employees;
- to manage the Company's capital effectively, by creating an investment opportunity, including
for its available liquidity.
Treasury shares may be bought back and disposed of in accordance with applicable laws and
regulations:
(i) at a minimum price no more than 10% below the stock's official price reported in the trading
session on the day before carrying out each individual transaction;
(ii) at a maximum price no more than 10% above the stock's official price reported in the trading
session on the day before carrying out each individual transaction.
Your Employee Shares (YES) Plan
On 28 April 2021, the shareholders of Prysmian S.p.A. approved the extension of the share
ownership plan for Prysmian Group employees, previously approved by the shareholders'
resolution dated 13 April 2016.
The Plan provides the opportunity to purchase Prysmian's ordinary shares on preferential terms,
with a maximum discount of 25% on the stock price, given in the form of treasury shares. The
shares purchased will be subject to a retention period, during which they cannot be sold. The
extension has added new purchase windows in the years 2022, 2023 and 2024.
Beneficiaries of the Plan also include the executive directors of Prysmian S.p.A. as well as key
management personnel, for whom the discount will be 1%.
Authorisation of the convertibility of the Equity-linked Bond 2021
The Shareholders' Meeting held on 28 April 2021 authorised the convertibility of the Euro 750
million equity-linked bond, approved by the Board of Directors on 26 January 2021 and reserved
for institutional investors.
The same meeting also approved the proposal for a share capital increase pursuant to art. 2420-
bis, par. 2, of the Italian Civil Code, in one or more tranches, with the exclusion of pre-emptive
rights under art. 2441, par. 5, of the Italian Civil Code, serving the conversion of the
aforementioned convertible bond for a maximum nominal amount of Euro 1,864,025.50 by
issuing up to 18,640,255 of the Company's ordinary shares with a nominal value of Euro 0.10
each, and thus amending art. 6 of its By-laws accordingly.
PRYSMIAN GROUP | CONSOLIDATED FINANCIAL STATEMENTS AND EXPLANATORY NOTES
114
Climate Change
With the intention of further accelerating its pursuit of sustainability, the Group has decided to
adopt the UN Global Compact. Prysmian has launched an ambitious climate change strategy by
adopting Science-Based targets to reduce its CO2 emissions, in line with the COP 21 Paris
Agreement, and by supporting the Business Ambition for 1.5°C campaign.
The target of zero net emissions is expected to be achieved between 2035 and 2040 for
emissions generated by the Group's operations (Scope 1 and 2) and by 2050 for emissions
generated by its value chain (Scope 3).
"ECO CABLE": the cable industry's first certifiable green product label in support of
energy transition
On 4 May 2021, the Group announced the launch of its ECO CABLE label, the first proprietary
label in the cable industry to help utilities and distributors make their supply chains and value
propositions even greener.
The ECO CABLE label can be easily compared and combined with other sustainability certification
protocols like the EPD (Environmental Product Declaration) and the EU Ecolabel (the
environmental label of excellence for products and services that meet high environmental
standards throughout their life cycle). Award of the ECO CABLE label is based on an automatic
calculation system developed specifically for cable products, which applies recognised and
measurable criteria from EU Ecolabel Regulation 66/2010, and in line with the main regulatory
frameworks and requirements: Carbon Footprint, Absence of Substances of Very High Concern,
Recyclability/Circularity, Recycling input rate, Environmental benefits and Cable transmission
efficiency.
Prysmian Group has committed to apply the ECO CABLE rating system to 20% of all its products
by 2022,in line with the Group's Sustainability Scorecard goals. ECO CABLE labelled products for
the Energy business will be available in Italy starting from early May and will be available in the
third quarter in France, Spain, Germany and by year end in the Nordics region. ECO CABLE is
just one of the steps being taken by Prysmian Group in its race to net-zero CO2 emissions thanks
to its capabilities in innovation and is part of a broader project to adopt a fully automated design-
to-sustainability approach that will enable the Group to carry out Carbon Footprint assessments
for 85% of all cable product families by 2022. Among the main innovative initiatives guiding the
Group on its path towards sustainability are: Alesea, the IoT solution for smarter and simpler
cable inventory management, enabling our partners to improve their performance in terms of
operational efficiency and sustainability; P-Laser, the 100% recyclable and eco-sustainable cable
used in HVDC applications for low-carbon projects; and PRY-CAM, a revolutionary solution for
monitoring the operation and efficiency of electrical systems.

PRYSMIAN GROUP | CONSOLIDATED FINANCIAL STATEMENTS AND EXPLANATORY NOTES
115
***********
Milan, 13 May 2021
ON BEHALF OF THE BOARD OF DIRECTORS
THE CHAIRMAN
Claudio De Conto
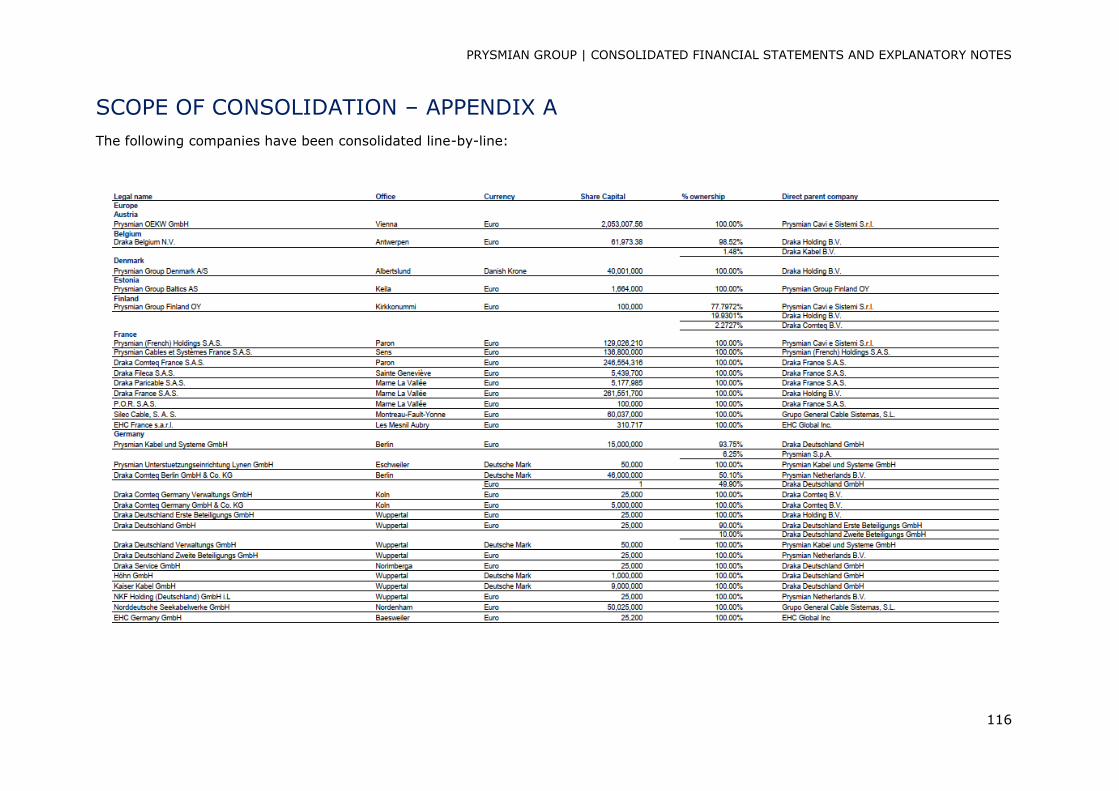
PRYSMIAN GROUP | CONSOLIDATED FINANCIAL STATEMENTS AND EXPLANATORY NOTES
116
SCOPE OF CONSOLIDATION – APPENDIX A
The following companies have been consolidated line-by-line:
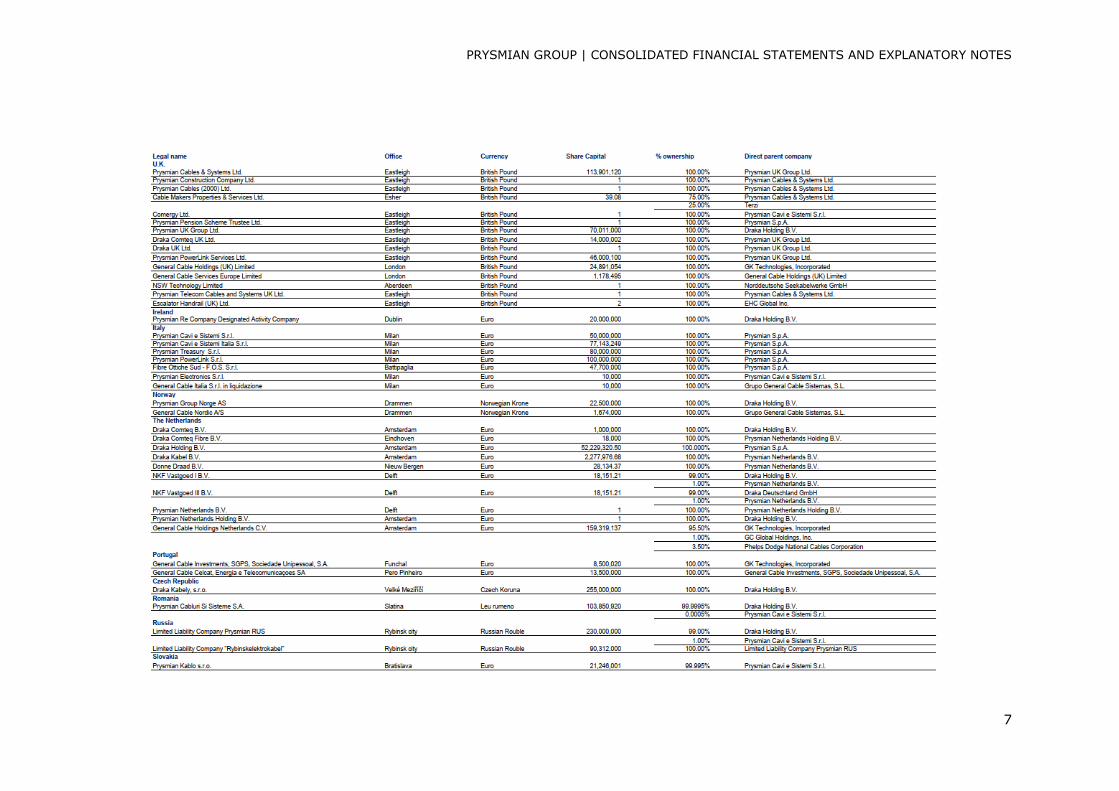
PRYSMIAN GROUP | CONSOLIDATED FINANCIAL STATEMENTS AND EXPLANATORY NOTES
117
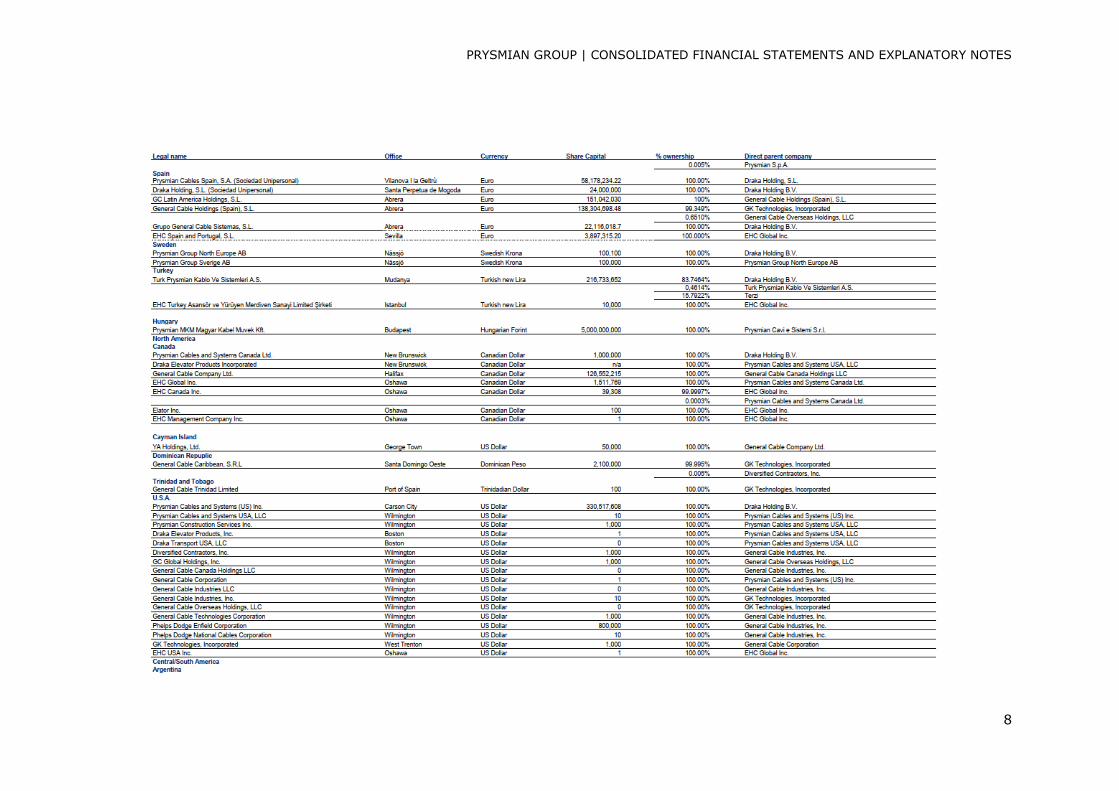
PRYSMIAN GROUP | CONSOLIDATED FINANCIAL STATEMENTS AND EXPLANATORY NOTES
118
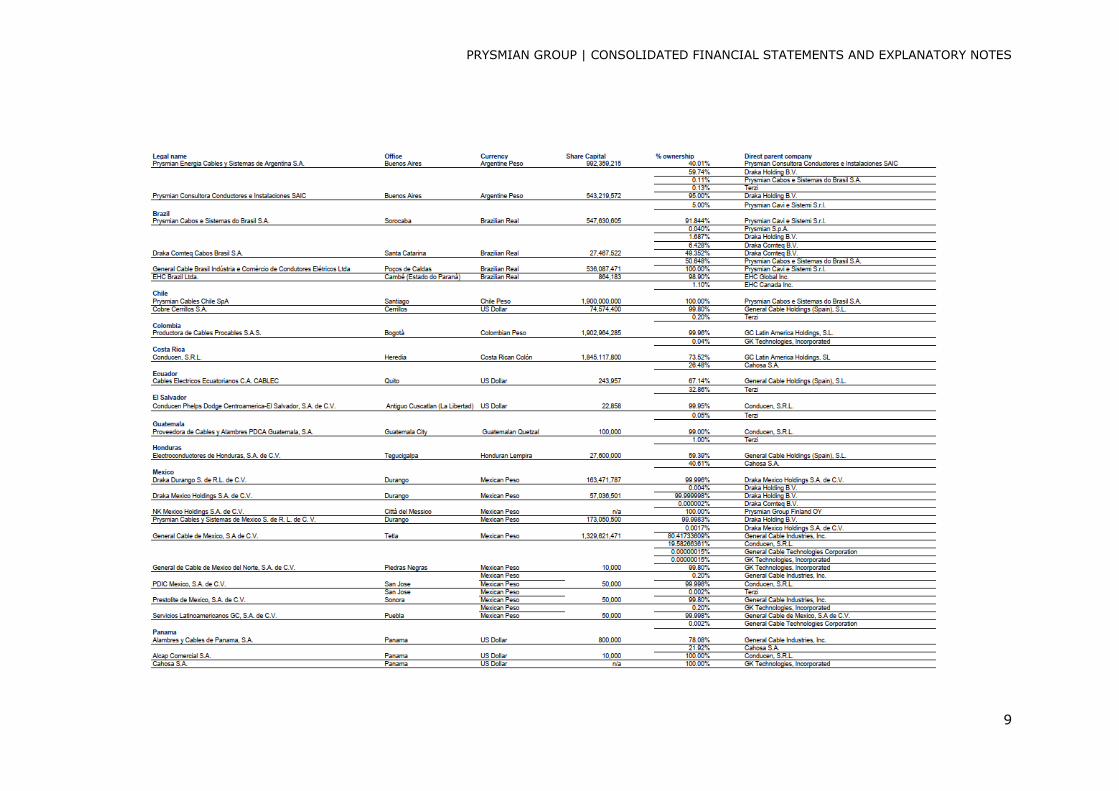
PRYSMIAN GROUP | CONSOLIDATED FINANCIAL STATEMENTS AND EXPLANATORY NOTES
119
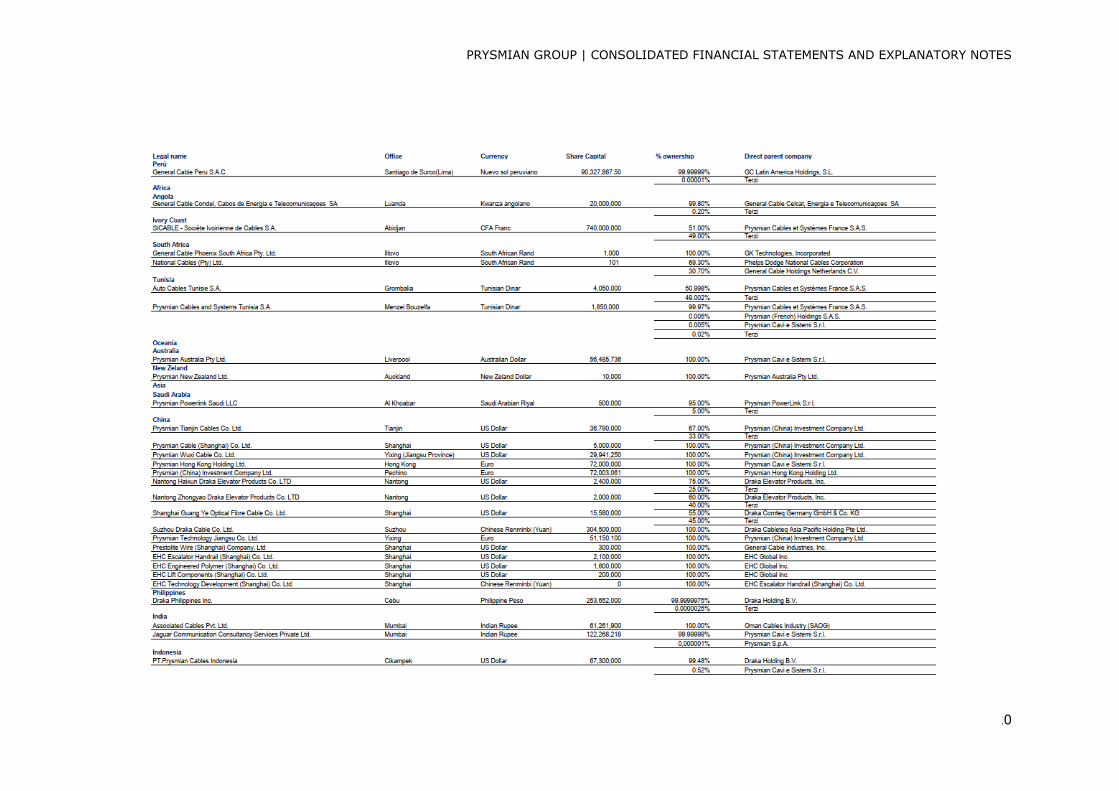
PRYSMIAN GROUP | CONSOLIDATED FINANCIAL STATEMENTS AND EXPLANATORY NOTES
120
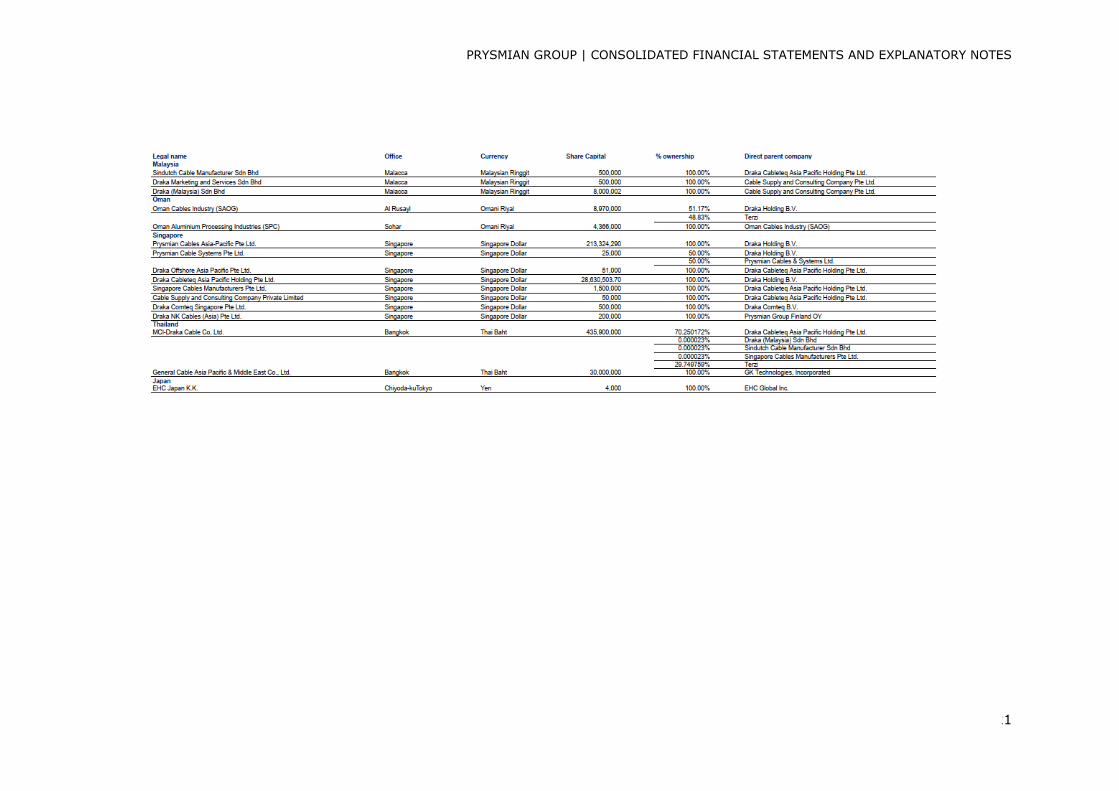
PRYSMIAN GROUP | CONSOLIDATED FINANCIAL STATEMENTS AND EXPLANATORY NOTES
121
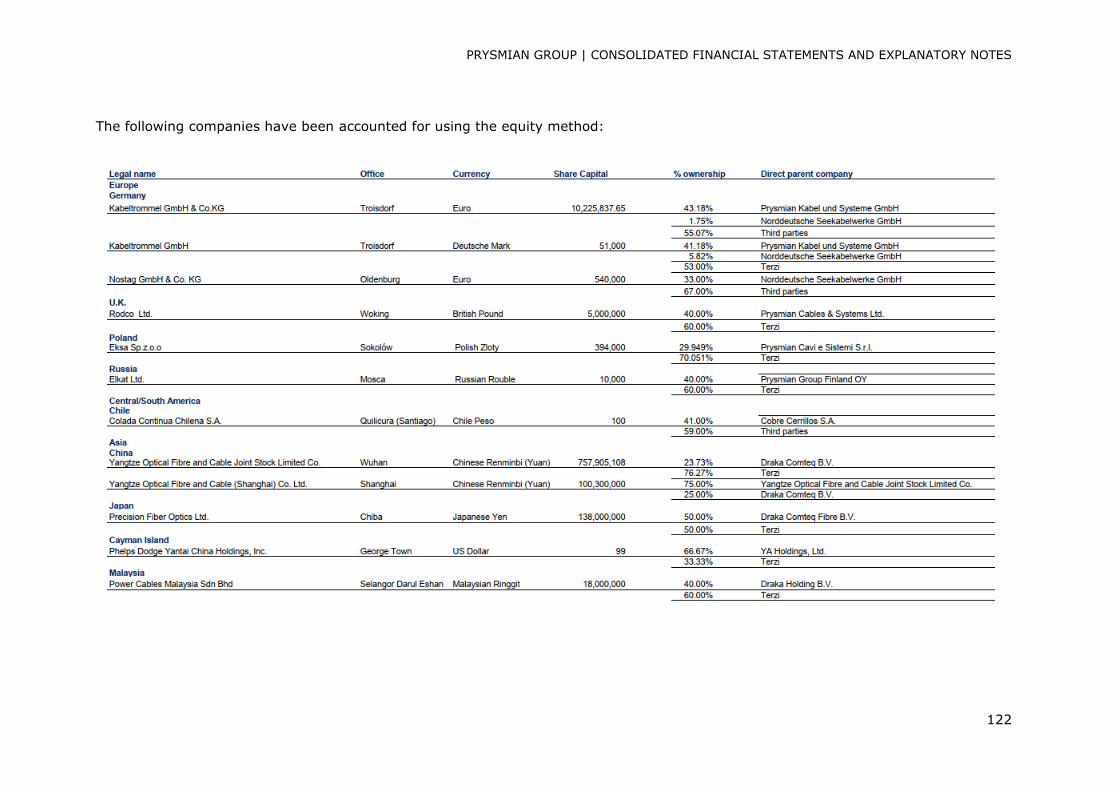
PRYSMIAN GROUP | CONSOLIDATED FINANCIAL STATEMENTS AND EXPLANATORY NOTES
122
The following companies have been accounted for using the equity method:
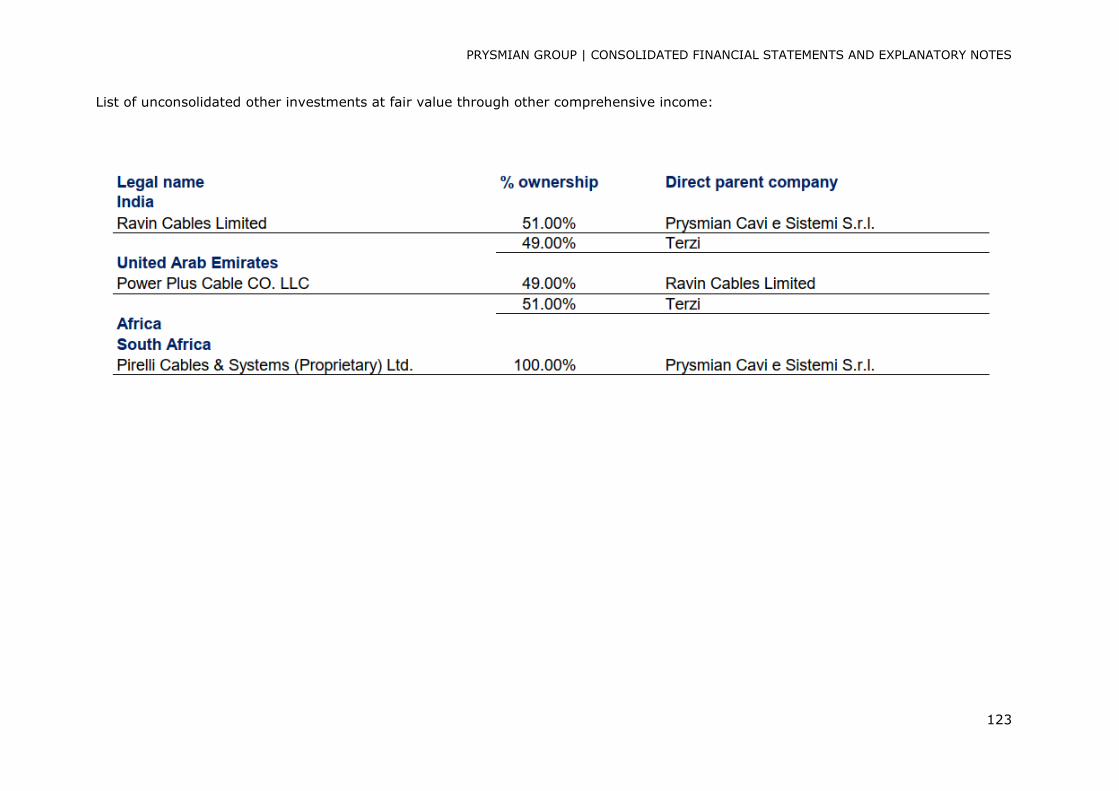
PRYSMIAN GROUP | CONSOLIDATED FINANCIAL STATEMENTS AND EXPLANATORY NOTES
123
List of unconsolidated other investments at fair value through other comprehensive income:

PRYSMIAN GROUP | CONSOLIDATED FINANCIAL STATEMENTS AND EXPLANATORY NOTES
124