this document is an excerpt of reports 18575‐34 and 18541 ... · bc hydro and power authority 333...
TRANSCRIPT


BC Hydro and Power Authority 333 Dunsmuir Street, Vancouver B.C. V6B 5R3
This document is an excerpt of reports 18575‐34 and 18541‐27 produced by Powertech Labs Inc. for BC Hydro
1‐Dec‐2011 Page 3 of 63
TABLE OF CONTENTS
1.0 Introduction ....................................................................................................................................................6 2.0 Mechanical Tests ............................................................................................................................................9 2.1 Set up of the test frame and crossarm assembly .......................................................................................9 2.2 Test set up for vertical load tests ............................................................................................................ 11 2.3 Test setup for longitudinal load tests ...................................................................................................... 12 2.4 Vertical load test of the TI 287 kV FRP crossarm assembly ..................................................................... 14 2.5 Longitudinal load test of the TI 287 kV FRP crossarm assembly ............................................................. 16 2.6 Vertical load test of the TI 230 kV FRP crossarm assembly ..................................................................... 19 2.7 Longitudinal load test of the TI 230 kV FRP crossarm assembly ............................................................. 21 2.8 Vertical load tests of timber crossarm (old and new) assemblies........................................................... 24 2.9 Longitudinal load tests of timber crossarm (old and new) assembly...................................................... 27
3.0 Materials Tests ............................................................................................................................................ 29 3.1 Aging tests of FRP specimens .................................................................................................................. 29 3.2 Tensile tests of FRP specimens ................................................................................................................ 40
4.0 Electrical Tests ............................................................................................................................................. 44 4.1 Objectives of the electrical tests ............................................................................................................. 44 4.2 Electrical tests conducted ........................................................................................................................ 45 4.3 Test Procedures ....................................................................................................................................... 45 4.4 Test Results .............................................................................................................................................. 46 4.5 Test Results Summary ............................................................................................................................. 51 4.6 Summary .................................................................................................................................................. 52
5.0 Discussions and Analysis .............................................................................................................................. 53 5.1 Comparison of nominal material and cross‐sectional properties ........................................................... 53 5.2 Calculation of crossarm vertical deflection ............................................................................................. 55 5.3 Comparison of vertical and longitudinal deflections of 230 kV crossarms ............................................. 56 5.4 Comparison of load carrying capacities................................................................................................... 58 5.6 Increase of torsional stiffness by using additional tie plates .................................................................. 59
6.0 Summary and Conclusions .......................................................................................................................... 61 7.0 References ................................................................................................................................................... 63

BC Hydro and Power Authority 333 Dunsmuir Street, Vancouver B.C. V6B 5R3
This document is an excerpt of reports 18575‐34 and 18541‐27 produced by Powertech Labs Inc. for BC Hydro
1‐Dec‐2011 Page 4 of 63
LIST OF FIGURES
Figure 1: Fibreglass (FRP) Reinforced Composite Cross Arms ....................................................................................7 Figure 2: New Wooden Cross Arms ............................................................................................................................8 Figure 3: Old Wooden Cross Arms..............................................................................................................................8 Figure 4: Test frame and set up ............................................................................................................................... 10 Figure 5: Top view of the I‐beam and wood support column ................................................................................. 10 Figure 6: Details of crossarm, gain, wood and steel column connection ................................................................ 11 Figure 7: A typical setup for vertical load test (schematic) ..................................................................................... 11 Figure 8: Actual vertical load test setup and data acquisition system .................................................................... 12 Figure 9: A typical setup for longitudinal load test (schematic) .............................................................................. 13 Figure 10: Data acquisition system for longitudinal load test ................................................................................. 13 Figure 11: Loading history – TI 287 kV vertical load test ......................................................................................... 15 Figure 12: Load vs displacement (Vertical direction) –TI 287 kV ............................................................................ 15 Figure 13: Slippage of tie plates – TI 287 kV ............................................................................................................ 16 Figure 14: Deformed crossarms under vertical load – TI 287 kV ............................................................................ 16 Figure 15: Loading history – TI 287 kV..................................................................................................................... 18 Figure 16: Load vs displacement (Longitudinal direction) – TI 287 kV .................................................................... 18 Figure 17: Deformed crossarm assembly under combined longitudinal and vertical loads ................................... 19 Figure 18: Loading history – TI 230 kV vertical load test ......................................................................................... 20 Figure 19: Load vs displacement (Vertical direction) – TI 230 kV ........................................................................... 20 Figure 20: Loading history – TI 230 kV longitudinal load test ................................................................................. 22 Figure 21: Load vs displacement (Longitudinal direction) – TI 230 kV (no additional tie plates) ........................... 22 Figure 22: Load vs displacement (Longitudinal direction) – TI 230 kV (with additional tie plates) ........................ 23 Figure 23: Installation of a pair of additional tie plates .......................................................................................... 23 Figure 24: Typical timber crossarm set up .............................................................................................................. 25 Figure 25: Typical timber crossarm failure modes .................................................................................................. 26 Figure 26: Load vs displacement (Vertical direction) –Typical timber test ............................................................. 27 Figure 27: Load vs displacement (Longitudinal direction) –Typical timber test ..................................................... 29 Figure 28: Example of peeling coating on TI FRP sample ........................................................................................ 31 Figure 29: Gloss and Mat finish side TI samples post 1000 hours ASTM G‐154 ..................................................... 33 Figure 30: Holes (sealed & unsealed) and scribed TI samples post 500 hours ASTM G‐154 exposure .................. 33 Figure 31: TI freeze thaw samples post 480 hours cyclic testing ............................................................................ 35 Figure 32: TI sealed (left) and unsealed (right) edge samples post 240 hours 400C exposure .............................. 37 Figure 33: Samples under specified bending stress ................................................................................................ 38 Figure 34: TI stressed samples mounted in test jigs L = longitudinal sample & T = transverse sample .................. 39 Figure 35: Setup employed for tensile testing of FRP coupons .............................................................................. 43 Figure 36: Setup employed for flexural testing ....................................................................................................... 43 Figure 37: Tensile test specimens post‐test ........................................................................................................... 44 Figure 38: Flexural test specimens post‐test. ......................................................................................................... 44 Figure 39: Damage from Lightning Flashovers to the Surface ................................................................................ 49 Figure 40: Damage from Lightning Flashovers across the Surface .......................................................................... 50 Figure 41: Damage from Lightning Flashovers across the Surface .......................................................................... 50 Figure 42: Typical cross sections of the crossarms .................................................................................................. 53 Figure 43 : Bending moment diagram for deflection calculation ............................................................................ 55 Figure 44: Comparison of vertical deflection (vertical stiffness) ............................................................................. 57

BC Hydro and Power Authority 333 Dunsmuir Street, Vancouver B.C. V6B 5R3
This document is an excerpt of reports 18575‐34 and 18541‐27 produced by Powertech Labs Inc. for BC Hydro
1‐Dec‐2011 Page 5 of 63
Figure 45: Comparison of longitudinal deflection (longitudinal stiffness): Comparison of longitudinal deflection (longitudinal stiffness) ............................................................................................................................................. 57 Figure 46: Free‐body diagram of crossarm and tie plate ........................................................................................ 59 Figure 48: Measurement of vertical displacement of the reference points ........................................................... 60 Figure 49: Calculation of angle of rotation .............................................................................................................. 61
LIST OF TABLES
Table 1: Design loads for 287kV/230kV H‐frame wood pole structures ....................................................................7 Table 2: Summary of vertical load tests of timber crossarms ................................................................................. 25 Table 3: Summary of longitudinal load tests of timber crossarms .......................................................................... 28 Table 4: Color* values – Figure 26 ........................................................................................................................... 31 Table 5: Gloss* values– Figure 26............................................................................................................................ 32 Table 6: Dimensional measurements – unsealed holes: Figure 27 ......................................................................... 32 Table 7: Dimensional measurements – unsealed edges Figures: 40 & 41 .............................................................. 35 Table 8: Dimensional measurements ...................................................................................................................... 36 Table 9: Weight pre and post exposure .................................................................................................................. 37 Table 10: Dimensional measurements at stress point ............................................................................................ 39 Table 11: As Is Tensile Test Results (ASTM D3039) ................................................................................................. 41 Table 12: Immersed in 40ºC Distilled Water for 240 Hours Tensile Test Results (D3039) ...................................... 41 Table 13: As Is Flexural Test (ASTM D790) .............................................................................................................. 42 Table 14: Immersed in 40ºC Distilled Water for 240 Hours as flexural Coupon’s Tensile Test Results (D790) ...... 42 Table 15: FRP Partial Discharge Test with no electrical bonding ............................................................................ 46 Table 16: FRP Partial Discharge Test with Metal Parts Bonded Together ............................................................... 46 Table 17: New Wooden Crossarms Partial Discharge Test with no electrical bonding........................................... 47 Table 18: New Wooden Crossarms Partial Discharge Test with Metal Parts Bonded Together ............................. 47 Table 19: Old Wooden Crossarms Partial Discharge Test with no electrical bonding ............................................ 48 Table 20: Old Wooden Crossarms Partial Discharge Test with Metal Parts Bonded Together .............................. 48 Table 21: Partial Discharge Summary ...................................................................................................................... 51 Table 22: Tests Results Summary ............................................................................................................................ 51 Table 23: Material and cross‐sectional properties of different crossarms ............................................................. 54 Table 24:Predicted vertical load deflections (mm) (230 kV) under various load levels .......................................... 55 Table 25: Comparison of vertical deflections of 230 kV crossarms ........................................................................ 56 Table 26: Comparison of longitudinal deflections of 230 kV crossarms ................................................................. 56 Table 27: Comparison of the ultimate/proof loads achieved for 230 kV crossarms............................................... 58 Table 28: Angular displacement (rotational angle) at the end of crossarm assembly ............................................ 60 Table 29: Comparison of mechanical and materials performance ......................................................................... 62 Table 30: Comparison of electrical performance .................................................................................................... 63

BC Hydro and Power Authority 333 Dunsmuir Street, Vancouver B.C. V6B 5R3
This document is an excerpt of reports 18575‐34 and 18541‐27 produced by Powertech Labs Inc. for BC Hydro
1‐Dec‐2011 Page 6 of 63
1.0 INTRODUCTION Douglas fir wood has been the primary material of choice for BC Hydro H‐frame wood poles, crossarms, and cross braces. There is a concern that BC Hydro may not be able to acquire sufficient quantities of structurally sound and durable crossarm timbers to meet its demand in the near future. To address the concern, BC Hydro Transmission and Distribution R&D and Asset Program Definition are in the process of examining several alternative crossarm prototypes to determine if they can perform as satisfactorily as their wood counterparts have done over the years. A new crossarm prototypes being considered is a Glass Fiber Reinforced Polymer (FRP) composite crossarm made by TI (Transmission Innovations Inc.).
Powertech Labs was requested by BC Hydro to carry out full‐scale tests for evaluating the performance of the new crossarm prototypes, new timber crossarms and in service (aged) timber crossarms removed from the field. In addition, aging tests on TI FRP crossarms were also requested for evaluating the materials (longevity) performance. The scope of the work includes:
1. evaluate mechanical performance under respective design requirements (Table 1), 2. assess electrical performance under design, 3. evaluate materials (longevity) performance of the FRP crossarm materials through aging and tensile
tests, 4. compare different types of crossarms in terms of mechanical, electrical and materials (longevity)
performance, 5. make conclusions and recommendations
The respective test protocols of full‐scale mechanical tests, electrical tests and materials tests were submitted to BC Hydro in August 2008 and after several revisions and concept refinements they were approved in December 2008.
The following tests were performed at Powertech Labs:
Mechanical Tests:
Vertical load test of a TI 287 kV FRP crossarm assembly Longitudinal load test of a TI 287 kV FRP crossarm assembly Vertical load test of a TI 230 kV FRP crossarm assembly Longitudinal load test of a TI 230 kV FRP crossarm assembly Vertical load tests of eight 230 kV timber crossarm assemblies Longitudinal load test of four 230 kV timber crossarm assemblies
Materials/Longevity Tests:
Aging and tensile tests of TI FRP crossarm specimens

BC Hydro and Power Authority 333 Dunsmuir Street, Vancouver B.C. V6B 5R3
This document is an excerpt of reports 18575‐34 and 18541‐27 produced by Powertech Labs Inc. for BC Hydro
1‐Dec‐2011 Page 7 of 63
Electrical Assessment Tests:
Electrical assessment tests on TI FRP crossarms Electrical assessment tests on old timber Electrical assessment tests on new timber
Table 1: Design loads for 287kV/230kV H‐frame wood pole structures
230 kV 287 kV Vertical 11 kN 18.4 kN Transverse 7.4 kN 5.0 kN Longitudinal *5.0 kN 5.0 kN
* no longitudinal loading available from BC Hydro, 5.0 kN correlates to a conservative option
Figure 1: Fibreglass (FRP) Reinforced Composite Cross Arms

BC Hydro and Power Authority 333 Dunsmuir Street, Vancouver B.C. V6B 5R3
This document is an excerpt of reports 18575‐34 and 18541‐27 produced by Powertech Labs Inc. for BC Hydro
1‐Dec‐2011 Page 8 of 63
Figure 2: New Wooden Cross Arms
Figure 3: Old Wooden Cross Arms

BC Hydro and Power Authority 333 Dunsmuir Street, Vancouver B.C. V6B 5R3
This document is an excerpt of reports 18575‐34 and 18541‐27 produced by Powertech Labs Inc. for BC Hydro
1‐Dec‐2011 Page 9 of 63
2.0 MECHANICAL TESTS
2.1 Set up of the test frame and crossarm assembly
A test frame was built in the Mechanical lab at Powertech Labs in accordance with the BC Hydro 287 kV and 230 kV H‐frame design specifications. Two 12” 12” 0.5” steel I‐beams were used to support crossarm samples. The spacing between the two columns can be adjusted to meet the two different design configurations, 22 ft and 18 ft respectively for 287 kV and 230 kV H‐frame wood pole structures. One of the two steel columns (South side) was anchored using an exiting anchor pad and another column (North side) was anchored using an anchor system specially built for anchoring the column (Figure 1). The anchoring system comprised of three 12” 12” 0.5” I‐ beams connected to other anchor pads for longitudinal and transverse constrains and three concrete blocks each weighing 4300 lbs (20 kN) were placed on the anchoring system to provide vertical restraint to the North column.

BC Hydro and Power Authority 333 Dunsmuir Street, Vancouver B.C. V6B 5R3
This document is an excerpt of reports 18575‐34 and 18541‐27 produced by Powertech Labs Inc. for BC Hydro
1‐Dec‐2011 Page 10 of 63
Figure 4: Test frame and set up
To represent the actual connection between crossarms and wood poles a new wood pole was selected from BC Hydro’s pole yard and sectioned into columns with semi‐elliptical cross section. The sectioned wood columns were placed and fastened between the two flanges of the I‐beam so that proper spiked gains could be used to mount crossarms to the wood as per the 287 kV and 230 kV design specification (Figures 2 and 3).
Figure 5: Top view of the I‐beam and wood support column
Wood pole section I-beam
Pole diameter 10.25”-14.5”
Through bolt
North column
South column North column

BC Hydro and Power Authority 333 Dunsmuir Street, Vancouver B.C. V6B 5R3
This document is an excerpt of reports 18575‐34 and 18541‐27 produced by Powertech Labs Inc. for BC Hydro
1‐Dec‐2011 Page 11 of 63
Figure 6: Details of crossarm, gain, wood and steel column connection
2.2 Test set up for vertical load tests
For vertical load tests, a typical setup is shown in Figures 4 and 5. Combined vertical and transverse load P is applied to the South end using a 10‐tonne crane through a pulley attached to an anchor pad. If there is a need to maximize the vertical displacement at the South end, a concrete block of 20 kN (equivalent to the design vertical load of 287 kV H‐frame wood pole structure) is to be attached to the North end. A load cell, a displacement transducer (LVDT) and a data acquisition system are used to record the history of load, vertical displacement and strain gauge readings (Figure5).
Figure 7: A typical setup for vertical load test (schematic)
P
22’ or 18’ 12’ or 9’ 12’or 9’
20kN
South North

BC Hydro and Power Authority 333 Dunsmuir Street, Vancouver B.C. V6B 5R3
This document is an excerpt of reports 18575‐34 and 18541‐27 produced by Powertech Labs Inc. for BC Hydro
1‐Dec‐2011 Page 12 of 63
Figure 8: Actual vertical load test setup and data acquisition system
2.3 Test setup for longitudinal load tests
For longitudinal load tests, a typical setup is shown in Figures 6 and 7. A combined longitudinal and vertical load P is applied to the South end using a 10‐tonne crane through a pulley attached to an anchor pad. The North end and middle phase can be loaded using a concrete block of 20 kN, the design vertical load of the 287 kV structure if there is a need. A load cell, two displacement transducers (LVDT) one for vertical displacement and another for longitudinal displacement and a data acquisition system are used to record the history of load, vertical displacement and strains (Figure 7). The recorded data from two LVDTs can be used to determine the instantaneous longitudinal and vertical load components and the corresponding displacements.
Load cell
LVDT

BC Hydro and Power Authority 333 Dunsmuir Street, Vancouver B.C. V6B 5R3
This document is an excerpt of reports 18575‐34 and 18541‐27 produced by Powertech Labs Inc. for BC Hydro
1‐Dec‐2011 Page 13 of 63
Figure 9: A typical setup for longitudinal load test (schematic)
Figure 10: Data acquisition system for longitudinal load test
X
Y
Z
P
20 kN
20 kN
LVDT
LVDT
Load cell
East crossarm
West crossarm
BC Hydro and Power Authority 333 Dunsmuir Street, Vancouver B.C. V6B 5R3
This document is an excerpt of reports 18575‐34 and 18541‐27 produced by Powertech Labs Inc. for BC Hydro
1‐Dec‐2011 Page 14 of 63
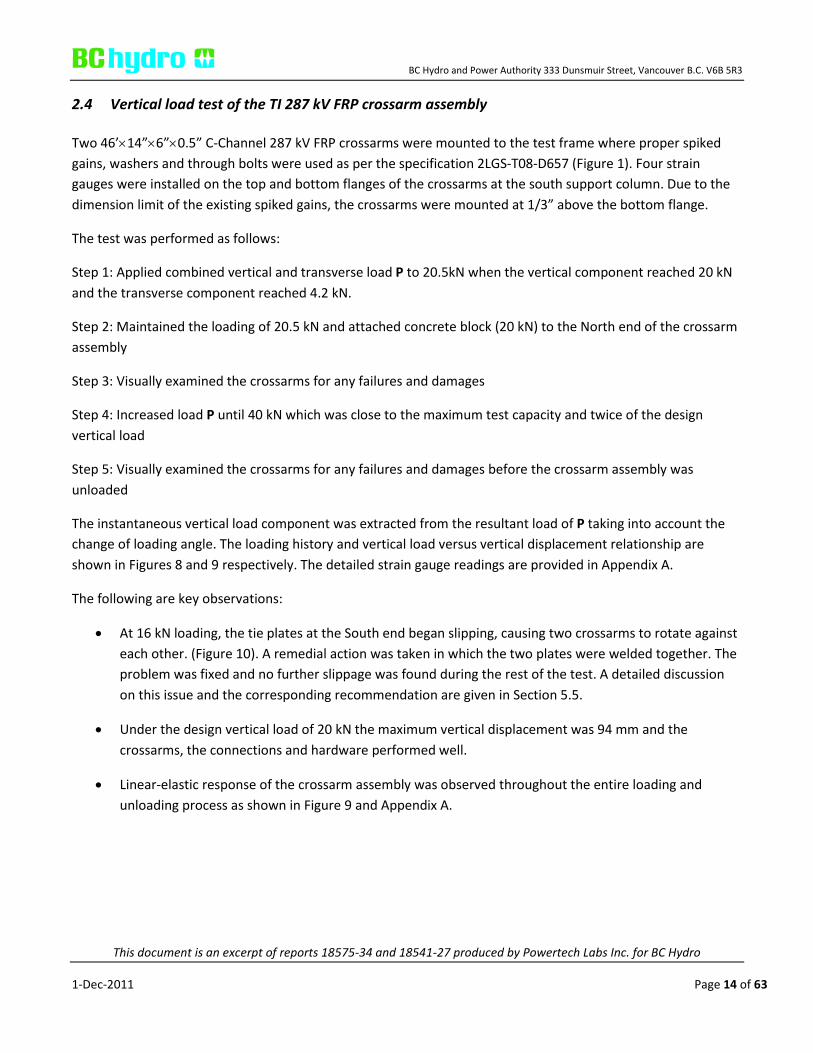
2.4 Vertical load test of the TI 287 kV FRP crossarm assembly
Two 46’14”6”0.5” C‐Channel 287 kV FRP crossarms were mounted to the test frame where proper spiked gains, washers and through bolts were used as per the specification 2LGS‐T08‐D657 (Figure 1). Four strain gauges were installed on the top and bottom flanges of the crossarms at the south support column. Due to the dimension limit of the existing spiked gains, the crossarms were mounted at 1/3” above the bottom flange.
The test was performed as follows:
Step 1: Applied combined vertical and transverse load P to 20.5kN when the vertical component reached 20 kN and the transverse component reached 4.2 kN.
Step 2: Maintained the loading of 20.5 kN and attached concrete block (20 kN) to the North end of the crossarm assembly
Step 3: Visually examined the crossarms for any failures and damages
Step 4: Increased load P until 40 kN which was close to the maximum test capacity and twice of the design vertical load
Step 5: Visually examined the crossarms for any failures and damages before the crossarm assembly was unloaded
The instantaneous vertical load component was extracted from the resultant load of P taking into account the change of loading angle. The loading history and vertical load versus vertical displacement relationship are shown in Figures 8 and 9 respectively. The detailed strain gauge readings are provided in Appendix A.
The following are key observations:
At 16 kN loading, the tie plates at the South end began slipping, causing two crossarms to rotate against each other. (Figure 10). A remedial action was taken in which the two plates were welded together. The problem was fixed and no further slippage was found during the rest of the test. A detailed discussion on this issue and the corresponding recommendation are given in Section 5.5.
Under the design vertical load of 20 kN the maximum vertical displacement was 94 mm and the crossarms, the connections and hardware performed well.
Linear‐elastic response of the crossarm assembly was observed throughout the entire loading and unloading process as shown in Figure 9 and Appendix A.

BC Hydro and Power Authority 333 Dunsmuir Street, Vancouver B.C. V6B 5R3
This document is an excerpt of reports 18575‐34 and 18541‐27 produced by Powertech Labs Inc. for BC Hydro
1‐Dec‐2011 Page 15 of 63
Figure 11: Loading history – TI 287 kV vertical load test
Figure 12: Load vs displacement (Vertical direction) –TI 287 kV
Add concrete block causing a reduction of load

BC Hydro and Power Authority 333 Dunsmuir Street, Vancouver B.C. V6B 5R3
This document is an excerpt of reports 18575‐34 and 18541‐27 produced by Powertech Labs Inc. for BC Hydro
1‐Dec‐2011 Page 16 of 63
Figure 13: Slippage of tie plates – TI 287 kV
Figure 14: Deformed crossarms under vertical load – TI 287 kV
2.5 Longitudinal load test of the TI 287 kV FRP crossarm assembly
After the vertical load test was completed, another two 287 kV FRP crossarms were mounted to the test frame for longitudinal load test. Wood columns at the north column were replaced to ensure that new construction was simulated. Four strain gauges were installed on the edge of the top and bottom flanges at the south support column.

BC Hydro and Power Authority 333 Dunsmuir Street, Vancouver B.C. V6B 5R3
This document is an excerpt of reports 18575‐34 and 18541‐27 produced by Powertech Labs Inc. for BC Hydro
1‐Dec‐2011 Page 17 of 63
The test was performed as follows:
Step 1: Applied combined longitudinal and vertical load P to the south end to 7.5 kN when the longitudinal component reached 6.2 kN which was above the design longitudinal load of 5 kN.
Step 2: Maintained the loading of 7.5 kN and attached two concrete blocks (each weighing 20 kN) to the North end and the middle phase of the crossarm assembly respectively.
Step 3: Visually examined the crossarms for any failures and damages
Step 4: Increased the load P until 15 kN when the longitudinal load component reached twice of the design longitudinal load.
Step 5: Visually examined the crossarms for any failures and damages before unloading the crossarm assembly
The instantaneous longitudinal load component was extracted from the resultant load P taking into account the change of two loading angles. The loading history and longitudinal load versus longitudinal displacement relationship are shown in Figures 12 and 13 respectively. The detailed strain readings are provided in Appendix A.
The following are key observations:
Under the design longitudinal load of 5 kN the corresponding longitudinal displacement was 161 mm and the crossarms, the connections and hardware performed well.
Linear‐elastic response of the crossarm assembly was observed throughout the entire loading and unloading process as shown in Figure 13 and Appendix A. After the crossarms were unloaded, no residual deformation on the crossarms was found. It was believed that the residual displacement (Figure 13) was due to the permanent deformation at the wood‐crossarm connection (compression deformation of wood at through bolt hole).
Significant torsional (angular) displacement was observed (Figure 14) under the combined longitudinal and vertical load P, however no residual torsional deformation was found after the assembly was unloaded.

BC Hydro and Power Authority 333 Dunsmuir Street, Vancouver B.C. V6B 5R3
This document is an excerpt of reports 18575‐34 and 18541‐27 produced by Powertech Labs Inc. for BC Hydro
1‐Dec‐2011 Page 18 of 63
Figure 15: Loading history – TI 287 kV
Figure 16: Load vs displacement (Longitudinal direction) – TI 287 kV

BC Hydro and Power Authority 333 Dunsmuir Street, Vancouver B.C. V6B 5R3
This document is an excerpt of reports 18575‐34 and 18541‐27 produced by Powertech Labs Inc. for BC Hydro
1‐Dec‐2011 Page 19 of 63
Figure 17: Deformed crossarm assembly under combined longitudinal and vertical loads
2.6 Vertical load test of the TI 230 kV FRP crossarm assembly
Similar to TI 287 kV crossarm tests two 38’14”6”0.5” C‐channel TI 230 kV FRP crossarms were mounted to the test frame for the vertical load test.
The test was performed as follows:
Step 1: Applied combined vertical and transverse load P to 12 kN when the vertical component reached 11 kN, the design vertical load of 230 kV structure
Step 2: Visually examined the crossarms for any failures and damages
Step 3: Increased the load P to 24 kN when the vertical component reached 22 kN, which is double of the design vertical load
Step 4: Visually examined the crossarms for any failures and damages before unloading the crossarms
The instantaneous vertical load component was extracted from the resultant load of P taking into account the change of loading angle. The loading history and vertical load versus vertical displacement relationship are shown in Figures 15 and 16 respectively.

BC Hydro and Power Authority 333 Dunsmuir Street, Vancouver B.C. V6B 5R3
This document is an excerpt of reports 18575‐34 and 18541‐27 produced by Powertech Labs Inc. for BC Hydro
1‐Dec‐2011 Page 20 of 63
Figure 18: Loading history – TI 230 kV vertical load test
Figure 19: Load vs displacement (Vertical direction) – TI 230 kV
0
5000
10000
15000
20000
25000
30000
0 100 200 300 400 500 600
Time (secs.)
Load
(New
ton)
Load south end to 12.5 kN to achieve vertical load of 11 kN
Continue loading to 24 kN to achieve vertical load of 22 kN
0.00
5.00
10.00
15.00
20.00
25.00
0.00 10.00 20.00 30.00 40.00 50.00 60.00 70.00
Vertical displacement (mm)
Verti
cal l
oad
(kN)

BC Hydro and Power Authority 333 Dunsmuir Street, Vancouver B.C. V6B 5R3
This document is an excerpt of reports 18575‐34 and 18541‐27 produced by Powertech Labs Inc. for BC Hydro
1‐Dec‐2011 Page 21 of 63
Key observations:
Under the design vertical load of 11 kN the maximum vertical displacement was 26 mm and the crossarms, the connections and hardware performed well.
Under the vertical load of 22 kN which is the double of the design load, the maximum vertical displacement was 58 mm and no damage and failure were found.
Linear‐elastic response of the crossarm assembly was observed throughout the entire loading and unloading process as shown in Figure 16 and Appendix A.
2.7 Longitudinal load test of the TI 230 kV FRP crossarm assembly
As the crossarms under the vertical load test were not damaged the same crossarms were used for the combined vertical and longitudinal load test.
The test was performed as follows:
Step 1: Applied combined longitudinal and vertical load P to the south end to 6.5 kN when the design longitudinal load of 5 kN was reached.
Step 2: Visually examined the crossarms for any failures and damages and manually measured the angle of rotation at the south end of the crossarm assembly
Step 3: Increase the load P to 14 kN when the longitudinal component reached 10 kN, which is double of the design load
Step 4: Visually examined the crossarms for any failures and damages and manually measured the angle of rotation.
Step 5: Unload the crossarm assembly
As per BC Hydro’s request, the longitudinal load test was repeated after a pair of additional tie plates was installed at the middle of the arm section which is between loading point and the south support column to increase the torsional stiffness of the assembly (Figure 20). During the test, the angle of rotation at the end of the arm was measured manually as detailed in Section 5.6.

BC Hydro and Power Authority 333 Dunsmuir Street, Vancouver B.C. V6B 5R3
This document is an excerpt of reports 18575‐34 and 18541‐27 produced by Powertech Labs Inc. for BC Hydro
1‐Dec‐2011 Page 22 of 63
Figure 20: Loading history – TI 230 kV longitudinal load test
Figure 21: Load vs displacement (Longitudinal direction) – TI 230 kV (no additional tie plates)
0
2000
4000
6000
8000
10000
12000
14000
16000
0 200 400 600 800 1000 1200
Time (secs.)
Load
(New
tons
)
Load south end to 6.5 kN to achieve longitudinal load of 5 kN
Continue loading to 14 kN to achieve longitudinal load of 10 kN
0.00
2.00
4.00
6.00
8.00
10.00
12.00
14.00
0.00 50.00 100.00 150.00 200.00 250.00
Longitudinal displacement (mm)
Long
itudi
nal l
oad
(kN
)

BC Hydro and Power Authority 333 Dunsmuir Street, Vancouver B.C. V6B 5R3
This document is an excerpt of reports 18575‐34 and 18541‐27 produced by Powertech Labs Inc. for BC Hydro
1‐Dec‐2011 Page 23 of 63
Figure 22: Load vs displacement (Longitudinal direction) – TI 230 kV (with additional tie plates)
Figure 23: Installation of a pair of additional tie plates
0.00
2.00
4.00
6.00
8.00
10.00
12.00
14.00
0.00 50.00 100.00 150.00 200.00 250.00
Longitudinal displacement (mm)
Long
itudi
nal l
oad
(kN)

BC Hydro and Power Authority 333 Dunsmuir Street, Vancouver B.C. V6B 5R3
This document is an excerpt of reports 18575‐34 and 18541‐27 produced by Powertech Labs Inc. for BC Hydro
1‐Dec‐2011 Page 24 of 63
Key observations:
Under the design longitudinal load of 5 kN the corresponding longitudinal displacement was 85 mm and the crossarms, the connections and hardware performed well.
Under the longitudinal load of 10 kN the corresponding longitudinal displacement was 177 mm and the crossarms, the connections and hardware performed well.
Linear‐elastic responses of the crossarm assembly were observed throughout the entire loading and unloading process as shown in Figures 18, 19 and Appendix A.
Significant torsional (angular) displacement was observed under the combined longitudinal and vertical load P, however no residual torsional deformation was found after the assembly was unloaded.
The additional tie plates did not significantly increase the torsional stiffness (details are provided in Section 5.7).
2.8 Vertical load tests of timber crossarm (old and new) assemblies
In‐service timber crossarms removed from the field as well as new timber crossarms were tested. The detailed list of the timber crossarms are shown in Table 2.
The crossarms were mounted to the test frame where proper gains, washers and through bolts were used as per the specification 2LGS‐T08‐D659 (Figure 32).
For each of the vertical load tests, a combined vertical and transverse load P was applied until the ultimate strength was reached. The instantaneous vertical load component was extracted from the resultant load P taking into account the change of loading angle. The detailed results of the vertical load tests are provided in Table 2.

BC Hydro and Power Authority 333 Dunsmuir Street, Vancouver B.C. V6B 5R3
This document is an excerpt of reports 18575‐34 and 18541‐27 produced by Powertech Labs Inc. for BC Hydro
1‐Dec‐2011 Page 25 of 63
Table 2: Summary of vertical load tests of timber crossarms
Timber test ID
Age Actual depth (mm)
Actual width (mm)
Ultimate/ proof vertical load
capacity at end phase (kN)
Deflection at design
vertical load of 11 kN (mm)
Ultimate bending strength at failure location (MPa)
V1 55 290 92 17 52 2.4E+01
V2 5 295 100 34 47 3.2E+01
V3 35 295 100 31 38 3.0E+01
V4 28 240 85 24 62 3.9E+01
V5 35 330 85 47 37 > 4.1E+01
V6 35 325 85 25 60 1.5E+01
V7 46 230 95 13 106 2.1E+01
V8 0 350 105 29 36 > 1.8E+01
Figure 24: Typical timber crossarm set up
The following are key observations:
8 timber crossarm assemblies were tested and 6 failed at the ultimate load ranging from 13 kN to 34 kN. Two timber crossarm assemblies survived respectively under proof vertical loads of 47 kN and 29 kN.

BC Hydro and Power Authority 333 Dunsmuir Street, Vancouver B.C. V6B 5R3
This document is an excerpt of reports 18575‐34 and 18541‐27 produced by Powertech Labs Inc. for BC Hydro
1‐Dec‐2011 Page 26 of 63
The cross‐sectional dimension of the timber crossarms varies from 85 cm to 105 cm in width and 230 cm to 350 cm in depth. As expected the failure location was either at the connection where crossarm assembly was subject to the maximum bending moment or where a severe external surface rot or wood node was present (Figure 33).
It was found that the ultimate bending strength of a 5 year old timber crossarms is lower than that of some of the aged timber crossarms.
Linear‐elastic responses of the crossarm assemblies were observed throughout the entire loading and unloading process as shown Figure 34.
Under design vertical load of 11 kN the corresponding average vertical deflection is 54.8 mm
Figure 25: Typical timber crossarm failure modes

BC Hydro and Power Authority 333 Dunsmuir Street, Vancouver B.C. V6B 5R3
This document is an excerpt of reports 18575‐34 and 18541‐27 produced by Powertech Labs Inc. for BC Hydro
1‐Dec‐2011 Page 27 of 63
Figure 26: Load vs displacement (Vertical direction) –Typical timber test
2.9 Longitudinal load tests of timber crossarm (old and new) assembly Three pairs of in‐service timber crossarms and a new pair of timber crossarms were tested under combined longitudinal and vertical loads.
Similar to the vertical load test, the crossarms were mounted to the test frame where proper gains, washers and through bolts were used as per the specification 2LGS‐T08‐D659.
For each of the longitudinal load tests, a combined vertical and longitudinal load P was applied until the longitudinal load component reached or exceeded two pre‐determined proof loads of 5 kN (the design longitudinal load) and 10 kN (the double of the design load). The instantaneous longitudinal load component was extracted from the resultant load P taking into account the change of loading angle. The relationships of longitudinal load and displacement are shown in Appendix B. The detailed results of the longitudinal load tests are provided in Table 3.
0.0
5.0
10.0
15.0
20.0
25.0
30.0
35.0
40.0
0 20 40 60 80 100 120 140 160 180
Vertical displacement (mm)
Verti
cal l
oad
(kN)

BC Hydro and Power Authority 333 Dunsmuir Street, Vancouver B.C. V6B 5R3
This document is an excerpt of reports 18575‐34 and 18541‐27 produced by Powertech Labs Inc. for BC Hydro
1‐Dec‐2011 Page 28 of 63
Table 3: Summary of longitudinal load tests of timber crossarms
Timber test ID
Age Actual depth (mm)
Actual width (mm)
Proof Longitudinal load at end phase (kN)
Deflection at design
longitudinal load of 5 kN (mm)
L1 35 330 85 15 194
L2 35 325 85 6 235
L3 33 230 95 15 149
L4 0 350 105 12 113
The following are key observations:
All timber crossarm assemblies survived under the proof longitudinal loads ranging from 6 kN to 15 kN.
Linear‐elastic responses of the crossarm assemblies were observed throughout the entire loading and unloading process as shown in Figure 35.
No significant torsional (angular) displacement was observed under the combined longitudinal and vertical load P.
Under the design longitudinal load of 5 kN the average longitudinal deflection is 173 mm.

BC Hydro and Power Authority 333 Dunsmuir Street, Vancouver B.C. V6B 5R3
This document is an excerpt of reports 18575‐34 and 18541‐27 produced by Powertech Labs Inc. for BC Hydro
1‐Dec‐2011 Page 29 of 63
Figure 27: Load vs displacement (Longitudinal direction) –Typical timber test
3.0 MATERIALS TESTS This section details the results of accelerated aging and tensile/flexural tests performed on composite crossarm specimens machined from TI FRP crossarms.
3.1 Aging tests of FRP specimens The objective of accelerated aging testing is to simulate the effects of a specific service condition or an environment on specimen/specimens by concentrating the exposure conditions to evaluate the performance of a product. The potential service life correlation relationship between accelerated aging testing to actual real world service conditions is very difficult to establish since the conditions simulated in the laboratory may or may not really exist in the real world.
The benefits of accelerated aging testing is to allow for a reduced timeline in determining if a product will perform as specified, by either the client and/or the supplier, to establish industry performance guidelines or as per the manufacturer’s published data. Accelerated aging is most beneficial when comparing a product of known performance to new products.
In the evaluation of the composite crossarm material, the following four accelerated tests were performed:
0.00
2.00
4.00
6.00
8.00
10.00
12.00
14.00
16.00
18.00
0 100 200 300 400 500 600 700
Longitudinal displacement (mm)
Long
itudi
nal l
oad
(kN)

BC Hydro and Power Authority 333 Dunsmuir Street, Vancouver B.C. V6B 5R3
This document is an excerpt of reports 18575‐34 and 18541‐27 produced by Powertech Labs Inc. for BC Hydro
1‐Dec‐2011 Page 30 of 63
Test 1 ‐ UV/Condensation exposure as per ASTM G154 ‐ 06 Standard Practice for Operating Fluorescent Light Apparatus for UV Exposure of Nonmetallic Materials
This test covers the basic principles and operating procedures for using fluorescent UV light, and water apparatus intended to reproduce the weathering effects that occur when materials are exposed to sunlight and moisture as rain or dew in actual usage. This practice is limited to the procedures for obtaining, measuring, and controlling conditions of exposure.
The purpose of this testing was to determine if the material would be susceptible to UV and condensation breakdown resulting in a color or gloss change or other material degradation such as delamination.
Another purpose of this testing was to evaluate a spray applied sealing product recommended for exposed edges/damaged areas. For the TI FRP material, the manufacture recommended the use of Tech Shield EPDM Rubber Spray Coating distributed by Brooks Tech Inc. This material was supplied in a spray can and was easy to apply directly to the surface. There is an aromatic volatile solvent release during application but it was found to be minor in nature and dissipated quite quickly.
The purpose of the sealant material is to protect field‐drilled mounting holes and abrasion damage during installation by prevention of moisture ingress and UV degradation. Triplicate samples of the material were prepared and holes (to simulate normal construction practices) were drilled in the samples. One of the holes was then coated with the sealant while the other left unsealed and the samples were exposed to 500 hours of UVA 340 exposure with condensation (to simulate rain). In addition to the drilled holes, an “X” was scribed onto the surface of the panel to simulate abrasion damage.
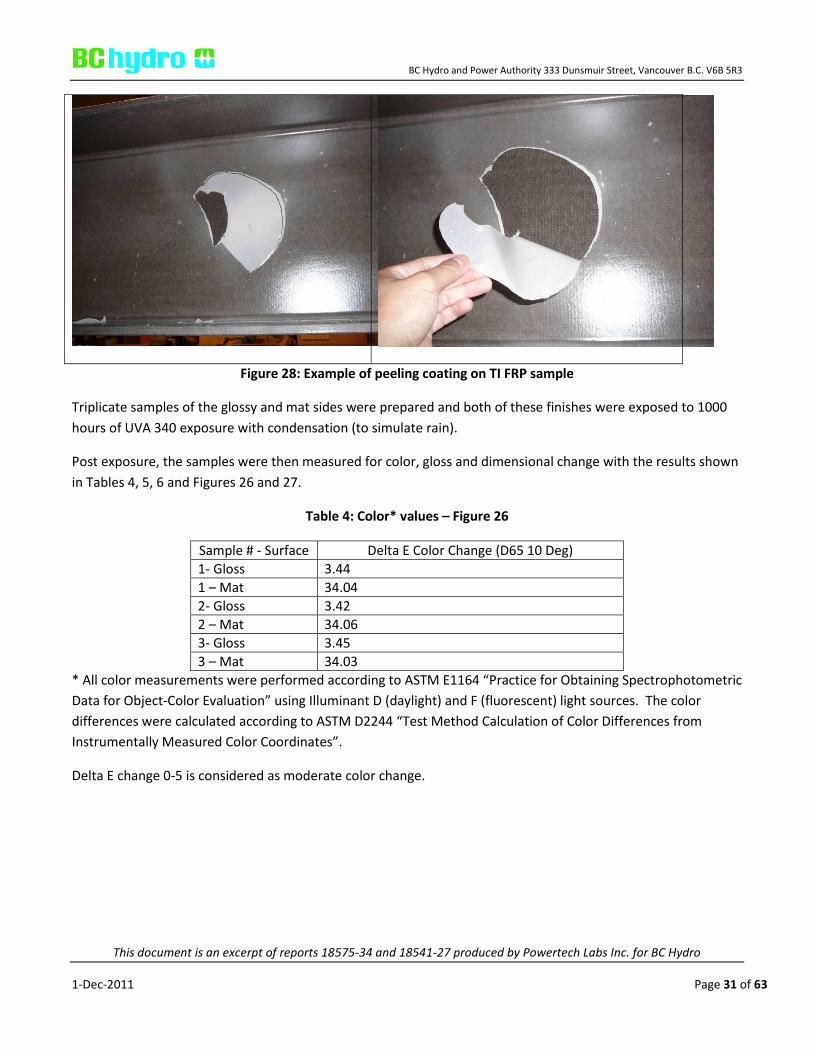
Visually, the TI FRP crossarm material shows a distinct finish difference as one sides appears to be “glossy” and the other side “mat” in appearance. The reason of the “mat” appearance is because a coating (up to approx. 7.5 mils thick) was applied to extend the UV resistance life of the FRP material according to the supplier. The coating was not applied by Powertech for the testing and was already on the samples as received. It was found later that where the coating is thick, it is very easily damaged/removable and when peeled, it becomes opaque – see Figure 25. Once this coating is removed, the underlying FRP is glossy in appearance. Where the coating has been applied thin, it appears to be well adhered though there is a noticed reduction in gloss. “Mat” appearance samples for the UV exposure had a thin layer of this coating.
BC Hydro and Power Authority 333 Dunsmuir Street, Vancouver B.C. V6B 5R3
This document is an excerpt of reports 18575‐34 and 18541‐27 produced by Powertech Labs Inc. for BC Hydro
1‐Dec‐2011 Page 31 of 63
Figure 28: Example of peeling coating on TI FRP sample
Triplicate samples of the glossy and mat sides were prepared and both of these finishes were exposed to 1000 hours of UVA 340 exposure with condensation (to simulate rain).
Post exposure, the samples were then measured for color, gloss and dimensional change with the results shown in Tables 4, 5, 6 and Figures 26 and 27.
Table 4: Color* values – Figure 26
Sample # ‐ Surface Delta E Color Change (D65 10 Deg) 1‐ Gloss 3.44 1 – Mat 34.04 2‐ Gloss 3.42 2 – Mat 34.06 3‐ Gloss 3.45 3 – Mat 34.03
* All color measurements were performed according to ASTM E1164 “Practice for Obtaining Spectrophotometric Data for Object‐Color Evaluation” using Illuminant D (daylight) and F (fluorescent) light sources. The color differences were calculated according to ASTM D2244 “Test Method Calculation of Color Differences from Instrumentally Measured Color Coordinates”.
Delta E change 0‐5 is considered as moderate color change.

BC Hydro and Power Authority 333 Dunsmuir Street, Vancouver B.C. V6B 5R3
This document is an excerpt of reports 18575‐34 and 18541‐27 produced by Powertech Labs Inc. for BC Hydro
1‐Dec‐2011 Page 32 of 63
Table 5: Gloss* values– Figure 26
Surface Pre‐exposure gloss
Post‐exposure gloss
Gloss change
1 ‐ Gloss 24.9 17.8 7.1
1 ‐ Mat ** ** **
2 ‐ Gloss 25.1 17.9 7.2
2 ‐ Mat ** ** **
3 ‐ Gloss 25.2 18.2 7.0
3 ‐ Mat ** ** **
* All gloss measurements were performed according to ASTM D523 “Standard Test Method for Specular Gloss” measurement were taken at 60 degree geometry
** Gloss value below instrument measuring capacity
Table 6: Dimensional measurements – unsealed holes: Figure 27
Sample Pre‐exposure thickness (inches)
Post‐exposure thickness (inches)
1 0.5036 0.5037 2 0.5065 0.5065 3 0.5055 0.5056

BC Hydro and Power Authority 333 Dunsmuir Street, Vancouver B.C. V6B 5R3
This document is an excerpt of reports 18575‐34 and 18541‐27 produced by Powertech Labs Inc. for BC Hydro
1‐Dec‐2011 Page 33 of 63
Figure 29: Gloss and Mat finish side TI samples post 1000 hours ASTM G‐154
Figure 30: Holes (sealed & unsealed) and scribed TI samples post 500 hours ASTM G‐154 exposure

BC Hydro and Power Authority 333 Dunsmuir Street, Vancouver B.C. V6B 5R3
This document is an excerpt of reports 18575‐34 and 18541‐27 produced by Powertech Labs Inc. for BC Hydro
1‐Dec‐2011 Page 34 of 63
Key observations:
There is a coating applied to the surface of the FRP that ranges up to 7.5 mils in thickness. Where the coating is thick, it is easily damaged by impact and can be peeled off very easily. Where the coating is thin, it appears to be well bonded.
Post 1000 hours of ASTM G‐154 exposure, the “glossy” side showed a slight change in both color (reading of 3.44) and gloss with a moderate darkening of the exposed area (reading of 7.1) ‐ overall this finish performed quite well.
Post 1000 hours of ASTM G‐154 exposure, the “mat” side showed a considerable change in the color (reading of 34.04) post the exposure. This is likely due to the breakdown of the applied thin layer of coating.
Post 500 hours of ASTM G‐154 exposure, the Tech Shield did not appear to be degraded and it could not be peeled or removed from the surface of the sample. There was no visible failure at the edges of the hole and the Tech Shield was easy use and to apply though it does remain tacky for up to an hour at room temperature (25C) – dependent on how much material is applied.
Post 500 hours of ASTM G‐154 exposure, the unsealed hole and “X” scribed area did not show any degradation or moisture ingress from the exposure.
Test 2‐ Freeze/Thaw exposure
The purpose of this testing was to determine if the material would be susceptible to moisture ingress and if this moisture would result in damage or swelling of the material if it was then subjected to freeze/thaw conditions.
Triplicate samples of the materials were prepared, holes drilled and a bolt installed to simulate a connection point. The samples were then subjected to a four‐hundred and eighty (480) hour cyclic exposure consisting of twenty‐four (24) hours of ambient temperature (220C) de‐ionized water submersion exposure followed immediately by twenty‐four (24) hours of negative fifteen (‐15) degree Celsius exposure ‐ see Table 7 and Figure 28.

BC Hydro and Power Authority 333 Dunsmuir Street, Vancouver B.C. V6B 5R3
This document is an excerpt of reports 18575‐34 and 18541‐27 produced by Powertech Labs Inc. for BC Hydro
1‐Dec‐2011 Page 35 of 63
Table 7: Dimensional measurements – unsealed edges Figures: 40 & 41
Sample #/ Side Pre‐exposure thickness (inches)
Post‐exposure thickness (inches)
1 Top Right Bottom Left
0.5061 0.5063 0.5061 0.5061
0.5062 0.5063 0.5062 0.5062
2 Top Right Bottom Left
0.5055 0.5056 0.5055 0.5056
0.5055 0.5057 0.5055 0.5056
3 Top Right Bottom Left
0.5054 0.5055 0.5056 0.5055
0.5055 0.5056 0.5056 0.5056
Figure 31: TI freeze thaw samples post 480 hours cyclic testing

BC Hydro and Power Authority 333 Dunsmuir Street, Vancouver B.C. V6B 5R3
This document is an excerpt of reports 18575‐34 and 18541‐27 produced by Powertech Labs Inc. for BC Hydro
1‐Dec‐2011 Page 36 of 63
It was observed that post the cyclic testing, there were no visible signs of damage or swelling at the bolted assembly, unsealed drill holes and unsealed edges of the samples.
Test 3‐ Elevated Temperature Water Immersion
The purpose of this testing was to determine if the material would be susceptible to moisture ingress and if the moisture would damage the material by swelling. The use of an elevated temperature is designed to simulate solar loading post rain exposure.
Triplicate samples of the material were prepared with unsealed cut edges and exposed to two‐hundred and forty (240) hours of de‐ionized (DI) water immersion at forty (40) degrees Celsius.
To evaluate the sealant material, triplicate samples of the material were also prepared and the cut edges were sealed. These samples were then also exposed to two‐hundred and forty (240) hours of de‐ionized (DI) water immersion at forty (40) degrees Celsius.
It can be seen from the results in Tables 8 & 9 and Figure 29 that post exposure, there was no noticeable change in dimensional thickness of the sealed and unsealed edges. The Tech Shield coating did not show any signs of degradation and was well bonded to the sample.
Table 8: Dimensional measurements
Sample/Surface (as viewed)
Pre‐exposure thickness (inches)
Post‐exposure thickness (inches)
1 – sealed edge: Top Right Bottom Left
0.5201 0.5255 0.5248 0.5235
0.5206 0.5257 0.5250 0.5236
2– sealed edge: Top Right Bottom Left
0.5220 0.5231 0.5233 0.5245
0.5221 0.5232 0.5234 0.5246
3 – sealed edge: Top Right Bottom Left
0.5311 0.5299 0.5264 0.5265
0.5312 0.5299 0.5269 0.5268
1 – unsealed edge: Top Right Bottom Left
0.5029 0.5031 0.5033 0.5028
0.5029 0.5032 0.5034 0.5028

BC Hydro and Power Authority 333 Dunsmuir Street, Vancouver B.C. V6B 5R3
This document is an excerpt of reports 18575‐34 and 18541‐27 produced by Powertech Labs Inc. for BC Hydro
1‐Dec‐2011 Page 37 of 63
Sample/Surface (as viewed)
Pre‐exposure thickness (inches)
Post‐exposure thickness (inches)
2 – unsealed edge: Top Right Bottom Left
0.5033 0.5035 0.5029 0.5029
0.5035 0.5036 0.5030 0.5029
3 – unsealed edge: Top Right Bottom Left
0.5029 0.5030 0.5033 0.5035
0.5030 0.5031 0.5034 0.5036
Table 9: Weight pre and post exposure
Sample/Surface Pre‐ exposure (g)
Post‐ exposure (g)
1 – sealed 562.47 563.49 2 – sealed 551.57 552.52 3 – sealed 556.39 556.37 1 – unsealed 468.55 469.81 2 – unsealed 466.07 467.05 3 – unsealed 472.46 473.18
Figure 32: TI sealed (left) and unsealed (right) edge samples post 240 hours 400C exposure

BC Hydro and Power Authority 333 Dunsmuir Street, Vancouver B.C. V6B 5R3
This document is an excerpt of reports 18575‐34 and 18541‐27 produced by Powertech Labs Inc. for BC Hydro
1‐Dec‐2011 Page 38 of 63
Test 4 ‐ Freeze/Thaw exposure Under Stress
The purpose of this testing was to determine if the material would be susceptible to moisture ingress and if the moisture would damage the material by swelling if the samples were exposed under both design load stress and freeze/thaw conditions.
Triplicate samples of the TI material were prepared in both longitudinal and transverse directions, mounted in a tensioning jig with unsealed cut edges. For each jig, six samples were clamped as cantilever beams (Figure 45) and stressed through a rigid bar to a pre‐determined deflection . The maximum stress level applied corresponds to the design vertical load of 11 kN for 230 kV structures.
The samples were then subjected to a four‐hundred and eighty (480) hour cyclic exposure consisting of twenty‐four (24) hours of ambient temperature (220C) de‐ionized water submersion exposure followed immediately by twenty‐four (24) hours of negative fifteen (‐15) degree Celsius exposure.
Figure 33: Samples under specified bending stress
It can be seen from the results in Table 10 and Figure 31 that post exposure, there was no noticeable change in dimensional thickness of either the longitudinal or transverse unsealed edges.
P

BC Hydro and Power Authority 333 Dunsmuir Street, Vancouver B.C. V6B 5R3
This document is an excerpt of reports 18575‐34 and 18541‐27 produced by Powertech Labs Inc. for BC Hydro
1‐Dec‐2011 Page 39 of 63
Table 10: Dimensional measurements at stress point
Surface/Sample (as viewed)
Pre‐exposure thickness (inches)
Post‐exposure thickness (inches)
Transverse 1 2 3 Control 1 2 Longitudinal 1 2 3 Control 1 2
0.5000 0.4990 0.4995 0.5005 0.5030 0.4990 0.4988 0.4990 0.5000 0.4985
0.5000 0.4990 0.4995 0.5005 0.5031 0.4990 0.4988 0.4991 0.5000 0.4986
Figure 34: TI stressed samples mounted in test jigs L = longitudinal sample & T = transverse sample
Summary of the aging tests:
The applied coating appears to be well adhered when a thin layer is present but when applied heavy, it is easily damaged by impact and peeled off.
ASTM D154 exposure of the “glossy” finished side indicated a moderate change in color and gloss;

BC Hydro and Power Authority 333 Dunsmuir Street, Vancouver B.C. V6B 5R3
This document is an excerpt of reports 18575‐34 and 18541‐27 produced by Powertech Labs Inc. for BC Hydro
1‐Dec‐2011 Page 40 of 63
ASTM D154 exposure of the “mat” finished side indicated a considerable change in color due to the applied coating;
ASTM D154 exposure of the sealant coating/sealed drilled hole, unsealed drill hole and “X” scribed area indicated no visible effects;
Cyclic freeze/thaw exposure of the samples indicated no degradation or dimensional changes;
Elevated temperature de‐ionized water immersion exposure of both edge sealed and unsealed samples indicated no (<1%) weight gain, dimensional changes or degradation of the sealant material.
Cyclic freeze/thaw stress exposure of the samples indicated no degradation or dimensional changes;
The Tech Shield edge sealant is very user friendly and was not damaged by the exposures.
3.2 Tensile tests of FRP specimens
The following tests were conducted on fiberglass reinforced polymer matrix C‐channel transmission crossarms manufactured by TI:
Tensile Testing, in accordance with ASTM D3039 “Standard Test Method for Tensile Properties of Polymer Matrix Composite Materials”
Flexural Testing, in accordance with ASTM D790 “Flexural Properties of Unreinforced and Reinforced Plastics and Electrical Insulating Materials”
Test procedures:
Rectangular tension test and flexural test coupons were machined from the webbing of the C‐channel shaped pultrusion profiles. Specimens were machined in both the longitudinal and transverse direction of the pultrusion profile (fiber orientation). For both tests and orientations two coupons were machined and tested as is, and two were immersed in 40ºC distilled water for 240 hours prior to testing.
The tensile test coupons had a reduced gauge section 50 mm in length, approximately 12.7 mm in width, and a thickness equal to that of the finished product. To ensure failure in the gauge section the grip sections of the coupons were 25 mm in width. An extensometer was affixed to the gauge section to monitor strain (Figure 47). The longitudinal strain range used for tensile modulus of elasticity calculations was 25 to 50% of the ultimate. The test coupons were monotonically loaded in tension at a loading rate of 5 mm/min. Failure mode and location was recorded using the standard descriptions specified in D3039.
The flexural test coupons were of constant cross section, with an approximate width of 12.7 mm and a thickness equal to that of the finished product. The specimens were loaded in a 3 point bend arrangement (Figure 48) with the span set to equal a 16:1 ratio with the thickness of the test coupon (202 mm). The rate of testing was also dependent on the thickness of the specimen as dictated by ASTM D790 (5.42 mm/min).

BC Hydro and Power Authority 333 Dunsmuir Street, Vancouver B.C. V6B 5R3
This document is an excerpt of reports 18575‐34 and 18541‐27 produced by Powertech Labs Inc. for BC Hydro
1‐Dec‐2011 Page 41 of 63
All testing was performed at an ambient lab temperature of 21ºC.
Test results:
A slight degradation in tensile properties was noted in the water immersion specimens. Similarly, some degradation in flexural properties was observed. Due to limited sample size the strength reductions cannot be quantified with statistical significance
Table 11: As Is Tensile Test Results (ASTM D3039)
Specimen ID Orientation of Fibers
Width (mm)
Thickness (mm)
Tensile Modulus of Elasticity (GPa)
Peak Load (N)
UTS (MPa)
Failure Mode / Location*
TI‐T1 Longitudinal 12.74 12.83 36.8 77,170 472 XGM TI‐T2 Longitudinal 12.88 12.74 24.6 63,689 388 XGB TI‐T3 Transverse 12.63 12.63 15.0 26,490 166 AGM TI‐T4 Transverse 12.86 12.74 15.9 30,154 184 AGM
Table 12: Immersed in 40ºC Distilled Water for 240 Hours Tensile Test Results (D3039)
Specimen ID Orientation of Fibers
Width (mm)
Thickness (mm)
Tensile Modulus of Elasticity (GPa)
Peak Load (N)
UTS (MPa)
Failure Mode / Location*
TI‐T5 Longitudinal 12.63 12.59 35.4 69,270 436 MGT TI‐T6 Longitudinal 12.64 12.80 40.5 60,740 375 MGT TI‐T7 Transverse 12.75 12.75 17.3 28,370 175 MGT TI‐T8 Transverse 12.61 12.73 19.2 27,722 173 MGM
Standard tensile failure mode and location descriptions as per ASTM D3039 are as follows:
XGM = explosive failure, Gage, Middle XGB = explosive failure, Gage, Bottom XGT = explosive failure, Gage, Top AGM = Angled, Gage, Middle MGM = Multi Mode, Gage, Middle
Editorial Note: The terminology “explosive” is used as defined in ASTM D3039; however in our opinion this word does not reflect the true nature of the failure. We believe the word “rapid” to better describe this failure.

BC Hydro and Power Authority 333 Dunsmuir Street, Vancouver B.C. V6B 5R3
This document is an excerpt of reports 18575‐34 and 18541‐27 produced by Powertech Labs Inc. for BC Hydro
1‐Dec‐2011 Page 42 of 63
The longitudinal fiber orientation samples predominantly failed by explosive failure, in samples in which multi‐mode failure is indicated the explosive fracture also occurred at an angle. The transverse fiber orientation samples predominantly failed by an angled fracture, in samples in which multi‐mode fracture is indicated longitudinal splitting also occurred. The varying failure modes of the samples are seen in Figure 34.
Table 13: As Is Flexural Test (ASTM D790)
Specimen ID Orientation of Fibers
Width (mm)
Thickness (mm)
Tangent Modulus of
Elasticity (GPa)
Peak Load (N)
Peak Stress (MPa)
TI‐F1 Longitudinal 13.70 12.67 18.6 3524.4 487 TI‐F2 Longitudinal 13.70 12.65 16.9 3190.7 442 TI‐F3 Transverse 13.75 12.64 14.5 2367.4 327 TI‐F4 Transverse 13.94 12.78 14.9 2144.9 286
Table 14: Immersed in 40ºC Distilled Water for 240 Hours as flexural Coupon’s Tensile Test Results (D790)
Specimen ID Orientation of Fibers
Width (mm)
Thickness (mm)
Tangent Modulus of Elasticity (GPa)
Peak Load (N)
Peak Stress (MPa)
TI‐F5 Longitudinal 13.54 12.75 16.2 2,815 393 TI‐F6 Longitudinal 13.23 12.63 19.2 3,025 434 TI‐F7 Transverse 13.65 12.70 17.1 1,862 259 TI‐F8 Transverse 13.67 12.69 17.4 1,860 253
For both orientations, failure occurred as fracture of the outer matrix layer on the tension side of the bend. Some minor longitudinal splitting was noted in several samples. Failure mode of the flexural samples can be seen in Figure 35.

BC Hydro and Power Authority 333 Dunsmuir Street, Vancouver B.C. V6B 5R3
This document is an excerpt of reports 18575‐34 and 18541‐27 produced by Powertech Labs Inc. for BC Hydro
1‐Dec‐2011 Page 43 of 63
Figure 35: Setup employed for tensile testing of FRP coupons
Figure 36: Setup employed for flexural testing

BC Hydro and Power Authority 333 Dunsmuir Street, Vancouver B.C. V6B 5R3
This document is an excerpt of reports 18575‐34 and 18541‐27 produced by Powertech Labs Inc. for BC Hydro
1‐Dec‐2011 Page 44 of 63
Figure 37: Tensile test specimens post‐test
Figure 38: Flexural test specimens post‐test.
4.0 ELECTRICAL TESTS The following gives a summary of the electrical tests conducted on the TI FRP crossarms, in‐service (old) timber and new timber crossarms at Powertech High Voltage Lab.
4.1 Objectives of the electrical tests Fibreglass reinforced (FRP) composite cross arms contain no metal. There is a concern as to what the impact of AC flashovers and lightning strikes would have on the cross arms. If this material were used as cross braces the same concerns would apply. Therefore, the objectives of the electrical tests are to:
Determine if there is damaging internal partial discharge (PD) on the cross arms under operating conditions.
Evaluate the effect of AC flashovers on the cross arms by initiating low energy flashovers to the cross arms and across the cross arms.
Evaluate the effect of lightning impulses applied to the cross arms and across the surface of the cross arms.

BC Hydro and Power Authority 333 Dunsmuir Street, Vancouver B.C. V6B 5R3
This document is an excerpt of reports 18575‐34 and 18541‐27 produced by Powertech Labs Inc. for BC Hydro
1‐Dec‐2011 Page 45 of 63
4.2 Electrical tests conducted
The following three types of electrical tests were conducted on the crossarm samples:
AC Voltage Partial Discharge Tests AC Voltage Flashover Tests Lightning Impulse Voltage Flashover Tests
4.3 Test Procedures
All samples were tested with two 11.5m long cross arms mounted back‐to‐back on wooden 2x4’s to simulate the mounting arrangement on a 230 kV wood pole structure. A 230 kV insulator was suspended from the center of the cross arms to simulate the center phase of a 230 kV circuit. A conductor was suspended from this insulator at right angles to the cross arms. The completed assembly was suspended from insulators in the High Voltage Laboratory.
AC Voltage Partial Discharge Tests
For both test setups the conductor was energized to expose the cross arms to the electric field they would experience in‐service. The partial discharge (PD) was measured as a function of voltage applied.
The test with the cross brace test setup was done with and without the lower bolts that attached the lower end of the cross arms to the frame connected to the laboratory ground.
The cross arms were examined with an image intensifier during the tests for visible external discharge and with an acoustic ultrasonic detector for audible partial discharge. This was done to eliminate external corona as the source of any measured partial discharge.
AC Voltage Flashover Tests
AC flashovers were initiated from the energized AC conductors to the cross arms to obtain data on the effect of AC flashovers on the cross arms. AC flashovers were also initiated lengthwise over the surface of one of the cross arms over a distance of about 30 cm.
Note: The energy available from the AC test source is relatively low so it is expected that the flashovers would cause minimal damage.
Lightning Impulse Voltage Flashover Tests
The previously energized AC conductors were connected to the lightning impulse generator and lightning flashovers to the cross brace to obtain data on the effect of lightning on the cross arms. The test was done at voltages up to 1.6 MV. Twenty lightning impulse flashovers were also initiated lengthwise over the surface of

BC Hydro and Power Authority 333 Dunsmuir Street, Vancouver B.C. V6B 5R3
This document is an excerpt of reports 18575‐34 and 18541‐27 produced by Powertech Labs Inc. for BC Hydro
1‐Dec‐2011 Page 46 of 63
one of the cross arms over a distance of about 30 cm. This was done over the same surface used for the AC surface flashovers.
4.4 Test Results Partial Discharge Tests
Table 15: FRP Partial Discharge Test with no electrical bonding
Voltage (kV) Partial Discharge (pC) Comments 50 <5 100 <5 132.8 <5 Rated operating voltage 141.5 <5 Rated maximum operating voltage 159.3 <5 1.2x rated operating voltage 199.2 <5 1.5x rated operating voltage 212.2 11 1.5x rated maximum operating voltage 250 26 300 69 183 <5 Extinction voltage
Table 16: FRP Partial Discharge Test with Metal Parts Bonded Together
Voltage (kV) Partial Discharge (pC) Comments 50 <5 100 <5 132.8 <5 Rated operating voltage 141.5 <5 Rated maximum operating voltage 159.3 <5 1.2x rated operating voltage 169.7 10 1.2x rated maximum operating voltage 199.2 20 1.5x rated operating voltage 212.2 27 1.5x rated maximum operating voltage 250 80 300 130 144 <5 Extinction voltage
The FRP cross arms were examined with an image intensifier for visible external discharge in both test configurations. No external discharge was observed.
The FRP cross arms were also examined with an acoustic ultrasonic detector. Audible partial discharge was detected at a number of locations on the cross arms but only at 250 kV.

BC Hydro and Power Authority 333 Dunsmuir Street, Vancouver B.C. V6B 5R3
This document is an excerpt of reports 18575‐34 and 18541‐27 produced by Powertech Labs Inc. for BC Hydro
1‐Dec‐2011 Page 47 of 63
Table 17: New Wooden Crossarms Partial Discharge Test with no electrical bonding
Voltage (kV) Partial Discharge (pC) Comments 50 4 60 15 80 30 90 40‐100 100 >400 132.8 >1000 Rated operating voltage
Table 18: New Wooden Crossarms Partial Discharge Test with Metal Parts Bonded Together
Voltage (kV) Partial Discharge (pC) Comments 50 <5 100 <5 132.8 <5 Rated operating voltage 141.5 <5 Rated maximum operating voltage 159.3 <5 1.2x rated operating voltage 169.7 10 1.2x rated maximum operating voltage 199.2 20 1.5x rated operating voltage 212.2 27 1.5x rated maximum operating voltage 250 18 300 40 228 <5 Extinction voltage
The new wooden cross arms were examined with an image intensifier for visible external discharge in both test configurations. No external discharge was observed.
The new wooden cross arms were also examined with an acoustic ultrasonic detector. Audible partial discharge was detected on the end fittings at operating voltage when the metal parts were not bonded together.

BC Hydro and Power Authority 333 Dunsmuir Street, Vancouver B.C. V6B 5R3
This document is an excerpt of reports 18575‐34 and 18541‐27 produced by Powertech Labs Inc. for BC Hydro
1‐Dec‐2011 Page 48 of 63
Table 19: Old Wooden Crossarms Partial Discharge Test with no electrical bonding
Voltage (kV) Partial Discharge (pC) Comments 100 3.3 132.8 3.7 Rated operating voltage 141.5 3.6 Rated maximum operating voltage 159.3 3.7 1.2x rated operating voltage 169.7 3.8 1.2x rated maximum operating voltage 199.2 4.1 1.5x rated operating voltage 212.2 4.0 1.5x rated maximum operating voltage 250 4.3 300 4.1
Table 20: Old Wooden Crossarms Partial Discharge Test with Metal Parts Bonded Together
Voltage (kV) Partial Discharge (pC) Comments 100 4.8 132.8 4.7 Rated operating voltage 141.5 9.2 Rated maximum operating voltage 159.3 5.0 1.2x rated operating voltage 169.7 4.6 1.2x rated maximum operating voltage 199.2 4.9 1.5x rated operating voltage 212.2 6.1 1.5x rated maximum operating voltage 250 8.9 300 10 277 6.6 139 4.9 Extinction voltage
The old wooden cross arms were examined with an image intensifier for visible external discharge in both test configurations. No external discharge was observed.
The old wooden cross arms were also examined with an acoustic ultrasonic detector. No audible discharge was detected.
AC Voltage Flashover Tests
Fibreglass reinforced (FRP) Cross arms The flashover to the surface and the flashovers across the surface had no visible effect New wooden cross arms The flashover to the surface and the flashovers across the surface had no visible effect Old wooden cross arms The flashover to the surface and the flashovers across the surface had no visible effect.

BC Hydro and Power Authority 333 Dunsmuir Street, Vancouver B.C. V6B 5R3
This document is an excerpt of reports 18575‐34 and 18541‐27 produced by Powertech Labs Inc. for BC Hydro
1‐Dec‐2011 Page 49 of 63
Lightning Impulse Voltage Flashover Tests
Fibreglass reinforced (FRP) Cross arms The flashovers to the surface and the flashovers over the surface had no visible effect
New wooden cross arms The flashovers to the surface and the flashovers over the surface caused damage to the cross arms. The following figures show the effect of the flashovers.
Figure 39: Damage from Lightning Flashovers to the Surface

BC Hydro and Power Authority 333 Dunsmuir Street, Vancouver B.C. V6B 5R3
This document is an excerpt of reports 18575‐34 and 18541‐27 produced by Powertech Labs Inc. for BC Hydro
1‐Dec‐2011 Page 50 of 63
Figure 40: Damage from Lightning Flashovers across the Surface
Old wooden cross arms
The flashovers to the surface had no visible effect. The flashovers over the surface caused some damage. The following figure shows the damage.
Figure 41: Damage from Lightning Flashovers across the Surface

BC Hydro and Power Authority 333 Dunsmuir Street, Vancouver B.C. V6B 5R3
This document is an excerpt of reports 18575‐34 and 18541‐27 produced by Powertech Labs Inc. for BC Hydro
1‐Dec‐2011 Page 51 of 63
4.5 Test Results Summary
The partial discharge extinction voltages are summarized in Table 21. There is no specification for acceptable partial discharge in the cross arms but, based on normal requirements for other equipment, we would recommend that the internal partial discharge (extinction voltage) should be below 20 pC at 120 % of rated maximum operating voltage (1.2 141.45 kV =169.7 kV).
Table 21: Partial Discharge Summary
Cross Arm Type Test Configuration Pass/fail based on proposed criteria
Fibreglass reinforced (FRP) composite cross arms
No bonding Pass Metal parts bonded Pass
New wooden cross arms No bonding Fail1 Metal parts bonded Pass
Old wooden cross arms No bonding Pass Metal parts bonded Pass
Notes 1: High partial discharge was acoustically detected on the metal end fittings.
The Fibreglass reinforced (FRP) composite cross arms and the old wooden cross arms passed the test criteria in both test configurations. The new wooden cross arms failed when the metal parts were not bonded but passed when they were bonded.
The AC and lightning impulse flashovers caused no visible damage to the fibreglass reinforced (FRP) composite cross arms. The lightning impulse flashovers to the new wooden cross arms and across the surface of the new wooden cross arms caused some damage. The lightning impulse flashovers to the old wood cross arms did not cause any damage. The lightning flashovers across the old wood cross arms caused some damage.
Table 22: Tests Results Summary
Cross Arm Type Partial discharge test – Metal
bonded together
Partial Discharge – No bonding
AC Flashovers LI Flashovers
Fibreglass reinforced (FRP) composite cross arms
Pass Pass No damage No damage
New wooden cross arms Pass Fail Some damage Some damage Old wooden cross arms Pass Pass Some damage Some damage

BC Hydro and Power Authority 333 Dunsmuir Street, Vancouver B.C. V6B 5R3
This document is an excerpt of reports 18575‐34 and 18541‐27 produced by Powertech Labs Inc. for BC Hydro
1‐Dec‐2011 Page 52 of 63
4.6 Summary
Electrical tests were done on 11.5 m fibreglass reinforced (FRP) composite cross arms, new wood cross arms and old wood cross arms for 230 kV wood pole transmission lines.
The fibreglass reinforced (FRP) composite cross arms and the old wooden cross arms passed the test criteria in both test configurations. The new wooden cross arms failed the partial discharge test when the metal parts were not bonded but passed when they were bonded.
Dielectrically the fibreglass reinforced composite cross arms performed as well as the wooden cross arms when all metal parts were bonded and not bonded together.
The AC and lightning impulse flashovers caused no visible damage to the fibreglass reinforced (FRP) composite cross arms. The lightning impulse flashovers caused some damage to the new and old wooden cross arms.
There was high partial discharge measured on the new wood cross arms with no bonding but not on the old wood cross arms without bonding. The acoustic partial discharge test on the new wood cross arms with no bonding found high partial discharge activity on the end fittings. Bonding of the metal parts prevented the partial discharge. Techniques that do not require bonding (for example such as changing the shape of the hardware) could also be used to prevent this partial discharge activity.

BC Hydro and Power Authority 333 Dunsmuir Street, Vancouver B.C. V6B 5R3
This document is an excerpt of reports 18575‐34 and 18541‐27 produced by Powertech Labs Inc. for BC Hydro
1‐Dec‐2011 Page 53 of 63
5.0 DISCUSSIONS AND ANALYSIS
5.1 Comparison of nominal material and cross‐sectional properties The performance in terms of stiffness and strength of different crossarm alternatives can also be evaluated and compared based on their material and cross‐sectional properties. The properties of three typical crossarm shapes shown in Figure 42 are summarized in Table 23.
Figure 42: Typical cross sections of the crossarms
Shear center
`
d
t
t
w X
Y
Y
e x
b
d
b
Y
Y
d
b
X
Y
Y

BC Hydro and Power Authority 333 Dunsmuir Street, Vancouver B.C. V6B 5R3
This document is an excerpt of reports 18575‐34 and 18541‐27 produced by Powertech Labs Inc. for BC Hydro
1‐Dec‐2011 Page 54 of 63
Table 23: Material and cross‐sectional properties of different crossarms
Type C‐Channel Hollow Rectangular
FRP‐TI Steel HSS Timber b (mm) 152 102 102 d (mm) 356 152 305 w (mm) 12.7 ‐ ‐ t (mm) 12.7 4.8 ‐ e (mm) 45.9 ‐ ‐ x (mm) 39.7 ‐ ‐ Area (m2) 0.0081 0.00206 0.0311 Ixx (m4) 1.520E‐04 0.0666E‐4 2.412E‐04 Iyy (m4) 1.725E‐05 0.0356E‐4 2.697E‐05 J (m4) 4.33E‐7 7.41E‐6 8.55E‐05 MOE (MPa)** 29647 200000 13047 Shear Modulus G (MPa) 5171 79300 815 Weight (kg/m) * 15.5 17.9 16.5 Vertical Stiffness EIxx (KN/m2) 4508 1332 3146
Longitudinal Stiffness EIyy (kN/m2) 511 712 352
Torsional Stiffness (Nm2) GJ 2239 587613 69683
* Dry DF density assumed as 530 kg/m3 , actual measurement for TI,
** the values were obtained from either published source or suppliers [2], [3], [6]
*** for both FRP crossarm materials shear modulus were obtained from references [2] and [3]. For timber shear modulus was calculated as 1/16 of its MOE.
It can be seen that:
Based on the properties shown in Table 23, TI has the highest nominal vertical stiffness EI followed by timber, and steel HSS. This is supported by a detailed comparison of the actual stiffness obtained from the tests discussed in the following section.
Steel HSS has the highest nominal longitudinal stiffness followed by TI, and timber.. A detailed comparison is discussed in the following section. This is supported by a detailed comparison of the actual stiffness obtained from the tests discussed in the following section
Steel HSS has the highest nominal torsional stiffness followed by timber, and TI.
The unit weights of TI, Steel and Timber crossarm are comparable.

BC Hydro and Power Authority 333 Dunsmuir Street, Vancouver B.C. V6B 5R3
This document is an excerpt of reports 18575‐34 and 18541‐27 produced by Powertech Labs Inc. for BC Hydro
1‐Dec‐2011 Page 55 of 63
5.2 Calculation of crossarm vertical deflection
Linear structural responses of a crossarm assembly under the test load can be easily calculated by a structural analysis based given material properties and dimension of cross section. The results can be considered in preparing test procedure to ensure that no premature failure would occur as a result of testing equipment and hardware failure. Based on material and geometric properties discussed in Section 5.1, the vertical deflection under the vertical load can be calculated as shown in the following equation. Due to the lateral torsional effect, the prediction of longitudinal deflection of FRP crossarms is not comparable to the test results if using the following equation. Thus only the calculated vertical deflections are provided (Table 24).
Figure 43 : Bending moment diagram for deflection calculation
Vertical deflection at point A = (2.73 P + 2.72 5.5 P)/(3EI)
Where:
P: vertical load E: modulu of elasticity I: moment of inertial
Table 24:Predicted vertical load deflections (mm) (230 kV) under various load levels
Vertical load TI FRP (mm) Typical Timber HSS Steel
5 kN 0.011 0.016 0.037 10 kN 0.022 0.032 0.075 15 kN 0.033 0.047 0.112 20 kN 0.044 0.063 0.150
2.7P P
2.7 m 5.5 m
A

BC Hydro and Power Authority 333 Dunsmuir Street, Vancouver B.C. V6B 5R3
This document is an excerpt of reports 18575‐34 and 18541‐27 produced by Powertech Labs Inc. for BC Hydro
1‐Dec‐2011 Page 56 of 63
5.3 Comparison of vertical and longitudinal deflections of 230 kV crossarms The vertical and longitudinal deflections obtained from the full‐scale mechanical tests are compared in Tables 25 and 26 respectively. The comparison is also presented by Figures 44 and 45. As the properties of steel HSS are well‐established the calculated deflections of steel HSS crossarm are used in lieu of the actual test results.
It can be seen that:
The vertical stiffness of TI FRP is the superior compared to HSS steel and Timber crossarms.
The longitudinal stiffness of HSS steel is the highest compared to TI and Timber crossarms.
Table 25: Comparison of vertical deflections of 230 kV crossarms
Type Vertical deflection under vertical loads (mm) 5 kN 10 kN 15 kN 20 kN
FRP‐TI 9.8 23.5 38 52.5 Timber in average 22.7 49.3 67.3 91.4 HSS Steel* 37 75 112 150
Table 26: Comparison of longitudinal deflections of 230 kV crossarms
Type Longitudinal deflection under longitudinal loads (mm) 2 kN 3 kN 5 kN 10 kN
FRP‐TI 29.2 47.3 85.3 177 Timber in average 61.7 98.9 172.9 309.2 HSS Steel* 28 42 70 140
*calculated based on beam theory

BC Hydro and Power Authority 333 Dunsmuir Street, Vancouver B.C. V6B 5R3
This document is an excerpt of reports 18575‐34 and 18541‐27 produced by Powertech Labs Inc. for BC Hydro
1‐Dec‐2011 Page 57 of 63
0
20
40
60
80
100
120
140
160
FRP‐TI Timber in average HSS Steel
Longitu
dinal D
eflection (m
m)
5 kN
10 kN
15 kN
20 kN
Figure 44: Comparison of vertical deflection (vertical stiffness)
0
50
100
150
200
250
300
350
FRP‐TI Timber in average HSS Steel
Longitu
dinal D
eflection (m
m)
5 kN
10 kN
15 kN
20 kN
Figure 45: Comparison of longitudinal deflection (longitudinal stiffness): Comparison of longitudinal deflection (longitudinal stiffness)

BC Hydro and Power Authority 333 Dunsmuir Street, Vancouver B.C. V6B 5R3
This document is an excerpt of reports 18575‐34 and 18541‐27 produced by Powertech Labs Inc. for BC Hydro
1‐Dec‐2011 Page 58 of 63
5.4 Comparison of load carrying capacities
The ultimate loads achieved or proof load applied during the full‐scale mechanical tests are summarized in Table 27. It can be seen that:
The vertical load carrying capacities of the TI FRP prototype exceeded the design requirement of 11 kN with a large margin. Similarly the longitudinal load carrying capacities of the TI FRP prototype exceeded the design requirement of 5 kN with a large margin.
Table 27: Comparison of the ultimate/proof loads achieved for 230 kV crossarms
Crossarm Type Vertical Longitudinal
Load (kN) Failure mode Load (kN) Failure mode
FRP TI > 23 Not failed > 11 Not failed
Average old timber 26.2 Broken in bending
> 10.5 Not failed
Average new timber > 31.5 Broken in bending
>12 Not failed
5.5 Slippage of tie plates
The slippage of the tie plates during one of the vertical load tests was observed, which caused crossarms displaced in rotation. The following gives the theoretical explanation of the issue.
Theory:
If there is only one plate or two tie plates are welded together, the two crossarms will work together and there will be no torsional moment created under the vertical load, and the top and bottom of the plate will be under compression and tension respectively. If the two plates are not tied together enough, there will be room for the plates to move along the slots. The counter act force (constraint force) F is basically the frictional force between plates, which depends on the clamping force from bolts and the coefficient of friction between plates. Once the torsional moment M > Fmax d, the two crossarms will not work together and are free to rotate towards each other (until the end of slot is reached) as a results of torsional moment of M. The degree of rotation depends on the moment and torsional stiffness as well as the cantilever length. Since the C‐channel thin‐walled FRP crossarm is weak in torsional stiffness as a result the crossarms buckled in rotation. The slippage of tie plates could also occur to the double timber crossarm assembly as we observed from a tie plates removed from an aged timber crossarm assembly. As shown in the following figure the force applied on the tie plates can be easily calculated as F = M/d. For example, of the vertical load is 8 kN (half of the total vertical load of 16 kN) and

BC Hydro and Power Authority 333 Dunsmuir Street, Vancouver B.C. V6B 5R3
This document is an excerpt of reports 18575‐34 and 18541‐27 produced by Powertech Labs Inc. for BC Hydro
1‐Dec‐2011 Page 59 of 63
the distance of load to the shear center is 80 mm and d = 120 mm. The force F = 8000 0.08 /0.12 = 5.3 kN. If the friction between plates is less than 5.3 kN the slippage will happen.
Figure 46: Free‐body diagram of crossarm and tie plate
5.6 Increase of torsional stiffness by using additional tie plates
Under the combined vertical and longitudinal load, the crossarm assembly is subject to a torsional moment because of the distance between the load attachment point and the shear center of the assembly. Due to the lack of torsional stiffness, the rotationl angle could be substaneous as observed during the FRP crossarm tests. The effect of adding additional tie plates on the increase of torsional stiffness FRP crossarms was investigated during the longitudinal load test of TI 230 kV FRP crossarms. The following two tests as described in Section 2.7 were conducted:
Longitudinal load test without additional tie plates
Longitudinal load test with a pair of additional tie plated installed at the middle of the south arm.
During the above two tests, in addition to historical deflections and loads collected by the data acquisition system, the vertical displacements of the two reference points on each of the two crossarms were measured manually at the longitudinal loads of 5 kN and 10 kN respectively. The difference of the vertical displacement
P
e P
M = P e
e P
P
M = P e
F F
F F
d
d
Timber crossarm
FRP or Ductal cossarm
e: distance between applied load and shear center
d: distance between two bolts
F: constraint force from other half of the assembly

BC Hydro and Power Authority 333 Dunsmuir Street, Vancouver B.C. V6B 5R3
This document is an excerpt of reports 18575‐34 and 18541‐27 produced by Powertech Labs Inc. for BC Hydro
1‐Dec‐2011 Page 60 of 63
was used to calculate the angle of rotation as illustrated in Figure 48. Table 28 gives the measurement and calculation results.
Figure 47: Measurement of vertical displacement of the reference points
Table 28: Angular displacement (rotational angle) at the end of crossarm assembly
Combined load (kN)
Longitudinal load component (kN)
Without additional tie plates With additional tie plates
d1 (mm) d2 (mm) d1 (mm) d2 (mm)
0 0 914 923 1.32 914 923 1.32
6.5 5.5 kN 889 933 6.48 892 929 5.44
14 11 kN 860 930 10.34 864 929 9.61

BC Hydro and Power Authority 333 Dunsmuir Street, Vancouver B.C. V6B 5R3
This document is an excerpt of reports 18575‐34 and 18541‐27 produced by Powertech Labs Inc. for BC Hydro
1‐Dec‐2011 Page 61 of 63
S = 39 cm d1
d2
Figure 48: Calculation of angle of rotation
It can be seen from Table 28 that additional tie plates do increase the torsioinal stiffness or reduce the angular displacement 16% under the design longitudinal load of 5.0 kN (with combined load of 6.5 kN).
6.0 SUMMARY AND CONCLUSIONS
About two dozen full‐scale mechanical tests of the H‐frame wood pole structure crossarm assemblies were performed in the mechanical lab at Powertech Labs. The samples included TI FRP 287 kV, TI FRP 230 kV and in‐service and new timber crossarms. Videos and photographs were taken to document the process of the tests. The applied loads, displacements, and strain gauge readings were recorded through a data acquisition system.
As for the test setup a test frame was designed and built to accommodate the two different crossarm spaces (287kV and 230kV). To simulate the actual wood pole and crossarm connections, a steel column‐wood pole connection was developed and used so that the crossarms samples could be mounted to the test frame as per corresponding design drawings.
To evaluate the materials and longevity performance of FRP crossarm materials, aging tests were carried out, including UV/condensation exposure, elevated temperature water immersion, freeze and thaw (stressed and un‐stressed). Tensile/flexural tests were also performed on both as it specimens and those undergone the elevated temperature water immersion.

BC Hydro and Power Authority 333 Dunsmuir Street, Vancouver B.C. V6B 5R3
This document is an excerpt of reports 18575‐34 and 18541‐27 produced by Powertech Labs Inc. for BC Hydro
1‐Dec‐2011 Page 62 of 63
The mechanical/materials performance of different crossarm prototypes and timber crossarms, new, and in‐service removed from the field, were evaluated and compared based on test and analysis results. Issues observed from the tests were addressed and discussed. The corresponding remedial solutions were recommended. A high level comparison of mechanical/electrical/materials performance of two crossarm prototypes was made against design strength requirements and average timer crossarms as shown in Table 29.
Electrical tests were performed on the samples of TI FRP crossarms, in‐service and new timber crossarms. A comparison of the electrical performance is summarized in Table 30.
Table 29: Comparison of mechanical and materials performance
Type of crossarms TI FRP
Steel HSS*
Ultimate Bending Strength (vertical) ML ML Ultimate Bending Strength (longitudinal) ML ML Vertical stiffness SL W Longitudinal stiffness SL SL Torsional stiffness (Nm2) 2239 587613 Weight per unit length (kg/m) 15.5 17.9 UV/Condensation exposure MC N/A Freeze/Thaw exposure ND N/A Freeze/Thaw exposure Under Stress ND N/A Elevated Temperature Water Immersion ND N/A
* based on well‐established industrial data (no test was conducted)
ML‐ Meets the design load requirement with large margin over 50% MM‐Meets the design load requirement with moderate margin from 20% to 50% M – Meets the design load requirement with margin less than 20% NM – Does not meet the design load requirement SL – Stronger than average timber with larger margin over 50% SM – Stronger than average timber with moderate margin from 20% to 50% SS – Stronger than average timber with margin less than 20% W – Weaker than average timber MC – Moderate change in color and gloss ND – No visible signs of damage or swelling at unsealed drill holes or sealed and and no noticeable change in thickness dimension on sealed or unsealed edges

BC Hydro and Power Authority 333 Dunsmuir Street, Vancouver B.C. V6B 5R3
This document is an excerpt of reports 18575‐34 and 18541‐27 produced by Powertech Labs Inc. for BC Hydro
1‐Dec‐2011 Page 63 of 63
Table 30: Comparison of electrical performance
Type of crossarms – hardware bonded together TI FRP Timber
AC Voltage Partial Discharge Tests P P AC Voltage Partial Discharge Tests – Unbonded P F1
AC Voltage Flashover Tests P P Lightning Impulse Voltage Flashover Tests P P
1: High partial discharge was acoustically detected on the metal end fittings of the new timbers. The old timbers passed the test.
P‐ Passed the test
F‐ Failed the test
7.0 REFERENCES [1] Lana Gilpin‐Jackson, e‐mail communication on December 24, 2008
[2] Jeremy Mostoller, “H‐Frame Crossarm Finite Element Analysis Report” CAP 2008
[3] BC Hydro Engineering, “230 kV Wood Pole Drawing 2LGS‐T08‐D659”, “230 kV Wood Pole Drawing 2LGS‐T08‐00684”, “230 kV Wood Pole Drawing 2LGS‐T08‐D657
[4] BC Hydro, “Kitmat Prince Rupert 287 kV Transmission Line Type A‐1 Line Angle H‐Frame Suspension Wood Pole Structure” 28799‐T08‐C186, 1965
[5] Handbook of Steel Construction, Eighth Edition, Canadian Institute of Steel Construction, 2004
[6] CSA 0116‐1969, Power and Communication Sawn Wood Crossarms, reaffirmed in 2008