this document is the accepted version of a work c, (doi
TRANSCRIPT
This document is the Accepted Manuscript version of a Published Work
that appeared in final form in Journal of Physical Chemistry C, copyright ©
American Chemical Society after peer review and technical editing by the
publisher. To access the final edited and published work, see
http://pubs.acs.org/doi/abs/10.1021/acs.jpcc.5b00938 (DOI:
10.1021/acs.jpcc.5b00938)
This is the Accepted Manuscript version of a Published Work appeared in:
Journal of Physical Chemistry C, 2015, Volume 119, Pages 8191-8198
(DOI: 10.1021/acs.jpcc.5b00938)
Study of adenine and guanine oxidation
mechanism by Surface-Enhanced Raman
Spectroelectrochemistry.
D. Ibañez1, A. Santidrian2, A. Heras1, M. Kalbáč2, A. Colina1*.
1. Department of Chemistry, Universidad de Burgos, Pza. Misael Bañuelos s/n, E-
09001, Burgos, Spain.
2. J. Heyrovsky Institute of Physical Chemistry of the AS CR, v.v.i., Dolejskova
2155/3, CZ-182 23 Prague 8, Czech Republic
* Corresponding author: [email protected], Tel: +34-947258817, Fax: +34-947258831.
Abstract
Metal nanoparticles are systems largely employed in surface-enhanced Raman
spectroscopy (SERS). In particular, gold nanoparticles are one of the best substrates
used in this field. In this work, the optimal conditions for gold nanoparticles
electrodeposition on single-walled carbon nanotubes electrodes have been established to

obtain the best SERS response. Using this substrate and analyzing the changes of in-situ
Raman spectra obtained at different potentials, we have been able to explain
simultaneously the oxidation mechanism of purine bases, differentiating the oxidation
intermediates, and their orientation during the different oxidation steps. Adenine
orientation hardly changes during the whole oxidation; the molecule maintains a parallel
configuration and only shows a slightly tilted orientation after the first oxidation step.
On the other hand, guanine orientation changes completely during its oxidation.
Initially, guanine is perpendicular respect to gold nanoparticles, changing its orientation
after the first oxidation process when the molecule shows a slightly tilted orientation
and it finishes parallel respect to the electrode surface after the second oxidation step.
Keywords
Surface-enhanced Raman scattering (SERS); spectroelectrochemistry; gold
nanoparticles; adenine oxidation; guanine oxidation.
1. Introduction
Surface-enhanced Raman scattering (SERS) is a powerful analytical tool for
sensitive and selective detection of different molecules adsorbed on metal
nanostructured. Since this effect was observed in the 70s1–3 it has been used in many
fields4–8 to study different systems and processes. However, one of the most important
factors to take into account for SERS applications is the substrate. The development of
different methods and procedures has allowed the improvement of SERS substrates
from initially non-uniform substrates to the actual well-defined surface nanostructures
in size, shape and interparticle spacing. The main properties that SERS substrates
should show are high sensitivity, uniformity, good stability, surface purity and
reproducibility.9,10 Although it is quite complicated to obtain substrates with all these
properties, metal (Au, Ag, Pd, Pt,…) nanoparticles (NPs) are systems largely employed
in SERS.11–15 In particular, gold deposition by plating processes provides SERS
substrates with the long term stability and high enhanced factor.16,17 Gold nanoparticles
(AuNPs) are usually deposited onto different type of electrodes, making possible the
study of electrochemical processes because of the higher SERS signal intensity related
to the species involved in the electron transfer process.
Adenine and guanine are two important biologically active molecules, since they are
essential components of nucleic acids. A strong interest to characterize DNA bases has
grown during the last years, being particularly important for the study of the oxidation
mechanism of these bases. This process is crucial since the oxidation of these bases can
cause DNA damages and consequently cell damage or even death of cells. Purine and
pyrimidine bases can be electrochemically oxidized.18–21 In particular, adenine and
guanine are oxidized at much lower positive potentials than thymine and cytosine. The
analysis of Raman spectral data is very complex because of the presence of different

oxidation intermediates and due to the changes caused by the modification of the
molecule orientation during the oxidation process. Independent Components Analysis
(ICA), using the fast ICA algorithm, 22 has been used to facilitate the elucidation of the
reaction mechanism. ICA is a data analysis technique that extracts the underlying source
signals and their proportions from a set of mixed signals based on the assumption that
these source signals are statistically independent.22
In this work, we have electrodeposited AuNPs by chronoamperometry on a single-
walled carbon nanotubes (SWCNT) electrode. We have studied the SERS effect of
AuNPs synthesized at different applied potentials and diverse deposition times. Optimal
AuNPs have been used to study the adenine and guanine mechanism of oxidation. Thus,
the main objective of this work is to obtain by Raman spectroelectrochemistry suitable
information to explain simultaneously both, the oxidation mechanisms of purine bases,
and the orientation of the intermediates that interact with the AuNPs electrodeposited on
a press-transfer SWCNT electrode.
2. Material and methods
2.1. Reagents
SWCNT (Sigma-Aldrich), hydrogen tetrachloroaurate (III) hydrate, HAuCl4. H2O
(Sigma-Aldrich), hydrogen chloride, KCl (Sigma-Aldrich), adenine (Sigma-Aldrich),
guanine (Sigma-Aldrich) and potassium hydroxide, KOH (Lachema Neratovice) were
used as received. All chemicals were analytical grade.
Aqueous solutions were prepared using high-quality water (NANOpure Diamond,
Barnstead Nanopure, IMLAB).

2.2. Instrumentation
Electrochemical measurements were carried out at room temperature using a
µAutolab III potentiostat. Raman spectra were obtained using a LabRAM HR Raman
spectrometer (Horiba Jobin-Yvon). The samples were excited by He-Ne laser (633 nm)
with a spectral resolution of approximately 1 cm-1. A 50x objective was used and the
laser power was approximately 1mW.
SEM imaging was performed using a high resolution SEM S-4800 (Hitachi).
A standard three-electrode cell was used in all experiments, consisting of a press
transfer SWCNT electrode as working electrode, a Pt wire as auxiliary electrode and
Ag/AgCl reference electrode. SWCNT electrodes were previously prepared using a
methodology based on our previous work.23 Briefly, 0.5 mg of SWCNT were dispersed
in 100 mL of DCE, being the homogenization a fundamental step to obtain
homogeneous films. Then, 0.8 mL of the SWCNT dispersion was filtered under vacuum
using a hydrophilic teflon filter. Next the filtered film was dried at room temperature
and using a laboratory hydraulic press, SWCNT film on the filter was transferred by
pressure to a sheet of polyethylene terephthalate (PET) applying 25 ± 1 tons for 60 s.
The separation of the filter was performed slowly and carefully using tweezers. The
filter was pulled out with the tweezers so that the transfer of the SWCNT to the
polymeric support provides a very homogeneous film with an area of 3.14 cm2. The
electrical contacts were made using conductive silver paint, creating a small line from
the origin of the SWCNTs to the end of PET. Silver paint was dried in an oven and after
further cooling, conductive silver paint was electrically isolated using insulating paint.
Finally, the electrode was inserted into the oven at 75 °C for 120 minutes.

3. Results and Discussion
3.1. Optimization of AuNPs electrodeposition conditions.
AuNPs electrochemical deposition is usually performed by controlling either
current24 or potential.25–31 Different techniques have been used in the electrosynthesis at
controlled potential: linear voltammetry,25,26 square wave voltammetry, simple pulse
chronoamperometry,29,30 double pulse chronoamperometry,27,28 multi pulse
chronoamperometry,31 etc. In our case, chronoamperometry experiments have provided
satisfactory results to obtain electrodes with SERS effect.
AuNPs electrodeposition on a SWCNT electrode was performed in a 5 mM HAuCl4
and 0.5 M KCl solution to study the influence of potential and time. Once AuNPs were
synthesized on the electrode, the Raman response of 1 mM adenine and KCl 0.01 M
solution was analyzed. We considered adenine Raman spectrum recorded during 30 s as
a reference to find optimum electrodeposition conditions. In particular we have chosen
the most intense band of this molecule, the breathing Raman band (740 cm-1), as
response for this optimization. Fig.1.a shows the SERS effect of diverse substrates
obtained at different potential for 100 s. When nanoparticles were deposited at 0.00 V,
adenine bands were not observed, even breathing band was not present, indicating that
suitable AuNPs to obtain a SERS response were not formed. At negative potentials (-
0.75 V) breathing band began to evolve but the intensity was very weak. Maximum
SERS intensity was observed when AuNPs were electrodeposited applying -1.25 V. In
this case adenine breathing band was clearly differentiated and, therefore, it has been
used to study the oxidation process of this molecule.
In the same way, deposition time is another important parameter to control in order
to obtain the higher SERS effect. Fig.1.b shows an adenine Raman spectra applying -
1.25 V at different electrodeposition times (20 s, 40 s, 60 s, 80 s, 100 s, 120 s). AuNPs
formed using an electrodeposition time of 20 s did not show SERS effect and in the
Raman spectrum only the typical SWCNT bands were observed (Fig 1.b and Fig. S1).
For an electrodeposition time of 40 s, a very weak breathing band of adenine was
obtained. The signal improved significantly when the deposition time was increased to
60 s and a band centered at 740 cm-1 showed a much higher intensity than for shorter
times. Raman signal showed the best response for 80 s deposition time, not only
because the breathing band intensity was the highest but also because well-defined
characteristic bands of different vibrational modes of adenine were observed, as for
example 1380 and 1402 cm-1. For longer electrodeposition times, Raman bands
decreased their intensities and some bands disappeared. Therefore, from our
experimental results, AuNPs synthesized on press-transfer SWCNT electrodes by
applying -1.25 V for 80 s showed the best properties to obtain a good SERS effect for
adenine (Fig 1.b and Fig. S1). AuNPs obtained by this methodology show spherical
shape with a size around 40 nm (Fig. S2), but they tend to be agglomerated as is shown
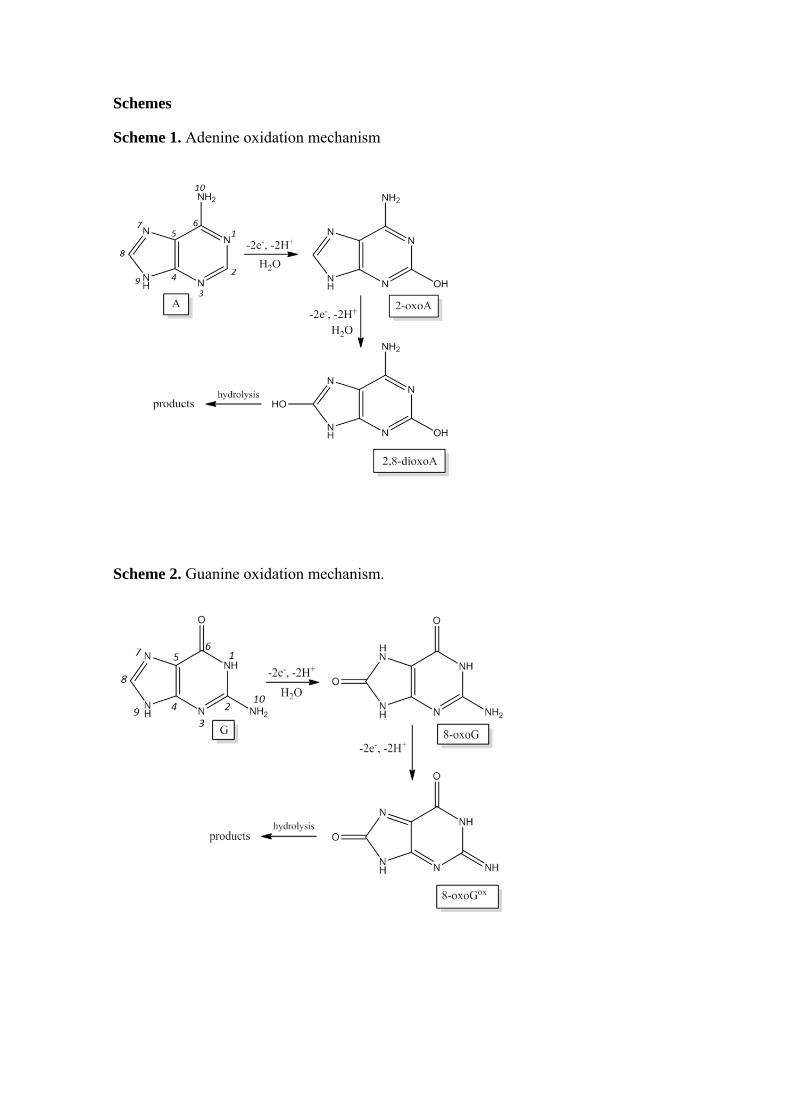
in Fig.2.
3.2. Adenine oxidation.
Different works have studied the orientation that adenine molecules adopt respect to
metal surfaces. These works describe that adenine interacts in different modes
depending on pH, concentration or metal (Au, Ag, Cu…) surface proposing three main
binding modes: flat interaction (parallel),32,33 end-on coordination (perpendicular)34,35
and via the external amine group.36 Raman spectroscopy is a very suitable technique to
find out the orientation of the molecules and the combination of this spectroscopic
technique with electrochemistry provides a whole view of the oxidation process.

Adenine oxidation was performed using a 1 mM adenine and 0.01 M KCl solution
(pH = 5.85) by applying constant potentials between 0.00 V and +0.90 V and sampling
each +0.10 V for 60 s to obtain each Raman spectrum.
ICA provides information of both the intermediates that are produced during the
oxidation (Fig. S3.a) and the spectra (Fig. S3.b) of the initial adenine and the two
different oxidation products. Adenine oxidation mechanism has been described in
previous works21,37,38. These works suggest that adenine (A) is oxidized to 2-oxoadenine
(2-oxoA) in the first oxidation step and 2,8-oxoadenine (2,8-dioxoA) is formed after the
second oxidation process (Scheme 1). Cyclic voltammogram (Fig. S4) obtained by
scanning the potential at 25 mV s-1 between 0.00 V and +0.90 V in a 1 mM adenine and
0.01 M KCl solution (pH = 5.85) does not show clear evidences of the two steps that
take place in the adenine oxidation mechanism because the anodic peaks related to these
processes are overlapped and only the second oxidation step is appreciated around
+0.70 V. However, Raman spectroscopy is a suitable technique that provides in-situ
spectroscopic information. In this case, although the electrochemical response does not
provide clear information about the redox process, the spectroscopic signal yields
molecular information that can be used to shed more light on the adenine oxidation
mechanism.
Experimental and theoretical assignments of A, 2-oxoA and 2,8-dioxoA Raman
bands has been proposed previously39–44 from data experimentally obtained and from
calculated data using density functional theory (DFT). The potential dependent SERS
spectra of adenine adsorbed on AuNPs/SWCNT electrode, shown in Fig. 3, and the
vibrational assignment, summarized in Table 1 are completely correlated to the adenine
oxidation mechanism. Raman bands can be assigned to the different products generated
during the adenine oxidation by combination of these experimental and theoretical data
with the ICA information.
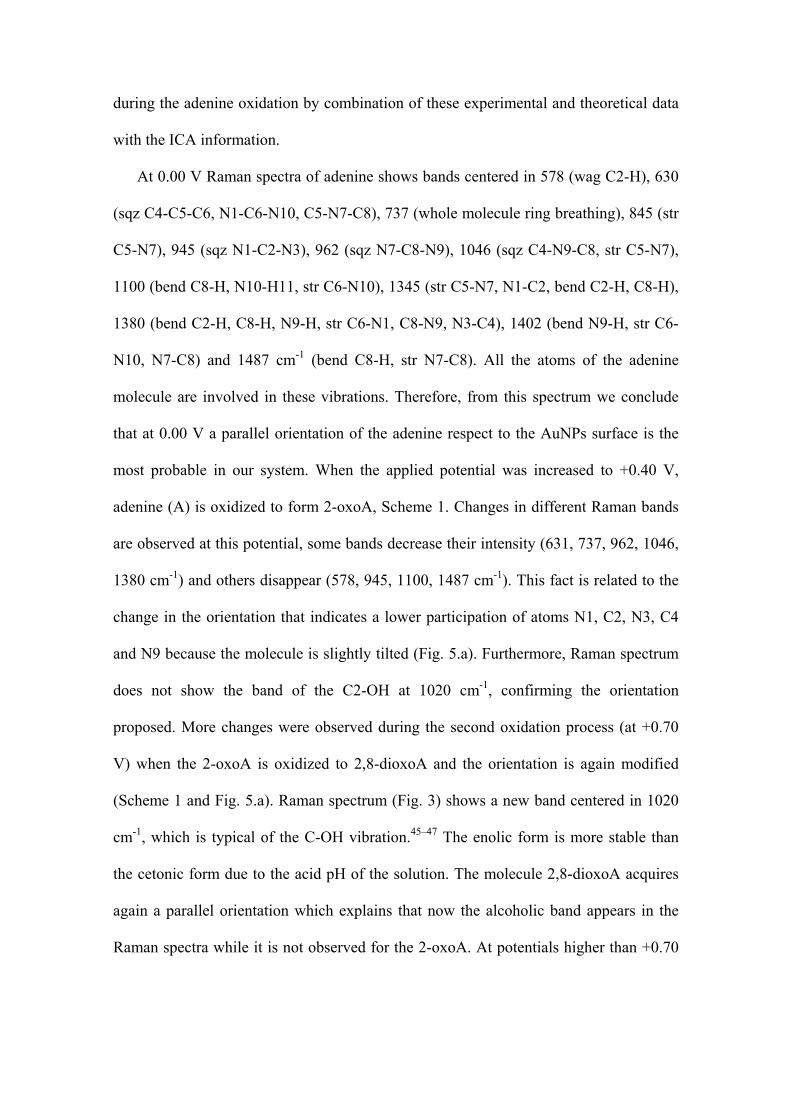
At 0.00 V Raman spectra of adenine shows bands centered in 578 (wag C2-H), 630
(sqz C4-C5-C6, N1-C6-N10, C5-N7-C8), 737 (whole molecule ring breathing), 845 (str
C5-N7), 945 (sqz N1-C2-N3), 962 (sqz N7-C8-N9), 1046 (sqz C4-N9-C8, str C5-N7),
1100 (bend C8-H, N10-H11, str C6-N10), 1345 (str C5-N7, N1-C2, bend C2-H, C8-H),
1380 (bend C2-H, C8-H, N9-H, str C6-N1, C8-N9, N3-C4), 1402 (bend N9-H, str C6-
N10, N7-C8) and 1487 cm-1 (bend C8-H, str N7-C8). All the atoms of the adenine
molecule are involved in these vibrations. Therefore, from this spectrum we conclude
that at 0.00 V a parallel orientation of the adenine respect to the AuNPs surface is the
most probable in our system. When the applied potential was increased to +0.40 V,
adenine (A) is oxidized to form 2-oxoA, Scheme 1. Changes in different Raman bands
are observed at this potential, some bands decrease their intensity (631, 737, 962, 1046,
1380 cm-1) and others disappear (578, 945, 1100, 1487 cm-1). This fact is related to the
change in the orientation that indicates a lower participation of atoms N1, C2, N3, C4
and N9 because the molecule is slightly tilted (Fig. 5.a). Furthermore, Raman spectrum
does not show the band of the C2-OH at 1020 cm-1, confirming the orientation
proposed. More changes were observed during the second oxidation process (at +0.70
V) when the 2-oxoA is oxidized to 2,8-dioxoA and the orientation is again modified
(Scheme 1 and Fig. 5.a). Raman spectrum (Fig. 3) shows a new band centered in 1020
cm-1, which is typical of the C-OH vibration.45–47 The enolic form is more stable than
the cetonic form due to the acid pH of the solution. The molecule 2,8-dioxoA acquires
again a parallel orientation which explains that now the alcoholic band appears in the
Raman spectra while it is not observed for the 2-oxoA. At potentials higher than +0.70

V the hydrolysis of 2,8-dioxoA takes place and Raman bands disappear, remaining only
the bands characteristic of the electrode (AuNPs, SWCNT and PET).
3.3. Guanine oxidation.
Guanine oxidation was performed using a 1 mM guanine and 0.01 M KOH solution
(pH = 13.1) by applying constant potentials between 0.00 V and +0.60 V and sampling
each +0.10 V during 60 s to obtain each Raman spectrum. In this case, it was not
necessary to reach as higher potentials as in the adenine oxidation because guanine
oxidation takes place at a lower potential.18
Again, ICA provides information about the intermediates produced (Fig. S5) during
the guanine oxidation process; there are two intermediates apart from the initial
guanine.
Guanine oxidation mechanism has been also described in previous works37,38,48. The
results presented in these works suggest that guanine (G) is oxidized to 8-oxoguanine
(8-oxoG) in the first oxidation process and 8-oxoG loses two electrons to produce 8-
oxoguanine oxidized (8-oxoGox) in the second oxidation step (Scheme 2). Cyclic
voltammogram (Fig. S6) obtained by scanning the potential at 25 mV s-1 between 0.00
V and +0.60 V in a 1 mM guanine and 0.01 M KOH solution (pH = 13.1) does not show
clearly the two anodic peaks related to the two oxidation steps that take place in the
guanine oxidation mechanism. The anodic peaks of these processes are overlapped
being appreciated a poor defined oxidation band around +0.30 V. As in the adenine
case, Raman spectroelectrochemistry provides very useful spectroscopic information for
a better understanding of the guanine oxidation mechanism.
Raman bands assignments of G, 8-oxoG and 8-oxoGox have been experimentally
and theoretically (DFT) proposed. 43,44,49,50 Potential dependent SERS spectra of

guanine adsorbed on AuNPs/SWCNT electrode, shown in Fig. 4, and vibrational
assignment, summarized in Table 2, are completely correlated to the guanine oxidation
mechanism. Raman bands can be assigned to the different products generated during the
guanine oxidation by combination of these experimental and theoretical data with the
ICA information.
At 0.00 V Raman spectrum of guanine (G) shows bands centered in 533 (sqz C6-
N1-C2, N3-C4-C5), 640 (whole molecule ring breathing), 738 (sqz N1-C2-N10, bend
C6-O), 849 (bend C2-N3-C4, N1-C2-N3), 1032 (str N1-C6), 1166 (sqz N3-C4-C5),
1262 (bend N1-H, str C2-N10), 1312 (bend N1-H, N10-H12, str C2-N10, N3-C4), 1382
(bend N1-C2-N3), 1420 (str N1-C2, bend N1-H, rock NH2) and 1718 cm-1 (str C6O-C5-
C6, bend N1-H, sciss NH2), these bands correspond to the vibrations in which atoms
N1, C2, N3, C6 and N10 are involved. From these bands we conclude that the guanine
orientation is perpendicular to the AuNPs surface at this potential, interacting through
this part of the molecule with the AuNPs51 as it is shown in Fig. 5.b. When guanine is
oxidized to 8-oxoG at +0.10 V, Scheme 2, several Raman bands modify their intensity
and position: bands centered in 533, 645, 738, 849, 1036, 1166, 1259, 1309, 1388, 1420
and 1718 cm-1 increase their intensity because more atoms (C4 and C5) are now
interacting with the AuNPs and also a new band appears at 792 cm-1 (wag C4-C5-C6).
The increment of these bands and, particularly, the evolution of the new band at 792 cm-
1 band (out-plane) promote changes in the orientation and 8-oxoG starts to be slightly
tilted (Fig. 5.b). At this orientation more atoms of the 8-oxoG are close to the AuNPs
surface, so there are more or stronger interactions with AuNPs than in a complete
perpendicular orientation: 533 (sqz N3-C4-C5), 849 (bend C5-N7-C8), 1166 (str C5-
N7, sqz N3-C4-C5), 1312 (str C5-N7), 1382 (str C5-N7, bend N9-C4), 1420 (str C4-
N9). However, the most important changes in Raman spectra are observed at +0.30 V.

During the second oxidation 8-oxoG loses two electrons to produce 8-oxoGox, Scheme
2. At this potential, 8-oxoGox changes completely the orientation respect to the 8-oxoG,
being more tilted and acquiring a horizontal orientation parallel to the AuNPs surface.
This change in the orientation is proved by the Raman spectra (Fig. 4): the evolution of
new bands peaked at 332 (sqz N7-C5-C6, bend C6-O, C8-O), 415 (bend C6-O, C8-O,
C2-N10), 493 (sqz C5-C6-N1, C2-N3-C4), 684 (bend C6-O, C8-O), 807 (bend C2-N3-
C4, C5-N7-C8), 828 (sqz C4-N9-C8, str C5-N7), 932 (bend N3-C4-N9, N7-C5-C6, C5-
N7-C8, str N7-C8) and 1130 cm-1 (str C5-N7, sqz N3-C4-C5) and the higher intensity
of other bands 790 (bend N9-H, str N7-C8), 1434 (str N7-C8) and 1718 cm-1 (N7-C8O-
N9) are related to all the atoms of 8-oxoGox that interact with the substrate, being the
bands associated with the carbonyl groups proof of that. The vibration modes of
carbonyl groups are observed in the Raman spectrum (332, 415, 684 and 1718 cm-1)
because the carbonyl group strongly interacts with the AuNPs and, in this parallel
orientation, C6-O and C8-O groups are close to the AuNPs surface. At potentials higher
than +0.40 V the 8-oxoGox hydrolysis takes places, the Raman bands related to the 8-
oxoGox disappear and, finally, only the electrode bands are observed.
4. Conclusions
In the present work, the optimum conditions to electrosynthesize AuNPs by
chronoamperometry with a strong SERS effect have been established. Different times
and potentials have been used, with the maximum SERS response being obtained when
a potential of -1.25 V was applied for 80 s. SEM characterization provided
morphological information about the AuNPs deposited on a SWCNT electrode during
the electrosynthesis process, showing that NPs tend to be agglomerated. The mechanism
of oxidation of adenine and guanine has been elucidated analyzing the change in the

intensity and the shifting of the Raman bands of these compounds. Adenine shows a
parallel orientation respect to the AuNPs surface at 0.00 V, when it is oxidized to 2-
oxoA the molecule acquires a slightly tilted orientation, but after the second oxidation
process to 2,8-dioxoA the molecule recovers the parallel orientation. In our conditions
(pH, adenine concentration and AuNPs) the adenine does not adopt a perpendicular
orientation, with a flat orientation being favoured. On the other hand, guanine
orientation is perpendicular respect to the AuNPs surface at 0.00 V, but after the first
oxidation at +0.10 V, 8-oxoG starts to be slightly tilted. The most important change in
orientation is produced when the 8-oxoG is oxidized to 8-oxoGoxo which acquires a
parallel orientation respect to the AuNPs surface. Surface-enhanced Raman scattering at
controlled potential has allowed us not only to characterize adenine and guanine
oxidations, but also it has provided suitable information about the orientation of each
intermediate.
Acknowledgments
The financial support made available by the Junta de Castilla y León (GR71, BU349-
U13) and Ministerio de Economía y Competitividad (CTQ2010-17127) is gratefully
acknowledged. D.I. thanks Ministerio de Economía y Competitividad for his
predoctoral FPI fellowship. A.S. and M.K. acknowledge the support from MSMT ERC-
CZ project: LL1301.
Supporting information
Further details of SEM images of AuNPs with the optimal electrodeposition conditions
as well as Independent Components Analysis graphical representations of adenine and
guanine oxidation mechanisms. This material is available free of charge via the Internet
at http://pubs.acs.org.
References
(1) Fleischmann, M.; Hendra, P. J.; McQuillan, A. J. Raman Spectra of Pyridine
Adsorbed at a Silver Electrode. Chem. Phys. Lett. 1974, 26, 163–166.
(2) Albrecht, M. G.; Creighton, J. A. Anomalously Intense Raman Spectra of
Pyridine at a Silver Electrode. J. Am. Chem. Soc. 1976, 99, 5215–5217.
(3) Jeanmaire, D. L.; Van Duyne, R. P. Surface Raman Electrochemistry. Part 1.
Heterocyclic, Aromatic and Aliphatic Amines Adsorbed on the Anodised Silver
Electrode. J. Electroanal. Chem. 1977, 84, 1–20.
(4) Chourpa, I.; Lei, F. H.; Dubois, P.; Manfait, M.; Sockalingum, G. D. Intracellular
Applications of Analytical SERS Spectroscopy and Multispectral Imaging.
Chem. Soc. Rev. 2008, 37, 993–1000.
(5) Bantz, K. C.; Meyer, A. F.; Wittenberg, N. J.; Im, H.; Kurtuluş, O.; Lee, S. H.;
Lindquist, N. C.; Oh, S.-H.; Haynes, C. L. Recent Progress in SERS Biosensing.
Phys. Chem. Chem. Phys. 2011, 13, 11551–11567.
(6) Álvarez-Puebla, R. A.; Liz-Marzán, L. M. Environmental Applications of
Plasmon Assisted Raman Scattering. Energy Environ. Sci. 2010, 3, 1011–1017.
(7) Tian, Z. Q.; Ren, B. Adsorption and Reaction at Electrochemical Interfaces as
Probed by Surface-Enhanced Raman Spectroscopy. Annu. Rev. Phys. Chem.
2004, 55, 197–229.
(8) Kim, H.; Kosuda, K. M.; Van Duyne, R. P.; Stair, P. C. Resonance Raman and
Surface- and Tip-Enhanced Raman Spectroscopy Methods to Study Solid
Catalysts and Heterogeneous Catalytic Reactions. Chem. Soc. Rev. 2010, 39,
4820–4844.

(9) Lin, X. M.; Cui, Y.; Xu, Y. H.; Ren, B.; Tian, Z. Q. Surface-Enhanced Raman
Spectroscopy: Substrate-Related Issues. Anal. Bioanal. Chem. 2009, 394, 1729–
1745.
(10) Natan, M. J. Concluding Remarks: Surface Enhanced Raman Scattering. Faraday
Discuss. 2006, 132, 321–328.
(11) Jana, N. R. Silver Coated Gold Nanoparticles as New Surface Enhanced Raman
Substrate at Low Analyte Concentration. Analyst 2003, 128, 954–956.
(12) Muniz-Miranda, M.; Pergolese, B.; Bigotto, A.; Giusti, A. Stable and Efficient
Silver Substrates for SERS Spectroscopy. J. Colloid Interface Sci. 2007, 314,
540–544.
(13) Guo, H.; Ding, L.; Mo, Y. Adsorption of 4-Mercaptopyridine onto Laser-Ablated
Gold, Silver and Copper Oxide Films: A Comparative Surface-Enhanced Raman
Scattering Investigation. J. Mol. Struct. 2011, 991, 103–107.
(14) Ibañez, D.; Fernandez-Blanco, C.; Heras, A.; Colina, A. Time-Resolved Study of
the Surface-Enhanced Raman Scattering Effect of Silver Nanoparticles
Generated in Voltammetry Experiments. J. Phys. Chem. C 2014, 118, 23426–
23433.
(15) Cejkova, J.; Prokopec, V.; Brazdova, S.; Kokaislova, A.; Matejka, P.; Stepanek,
F. Characterization of Copper SERS-Active Substrates Prepared by
Electrochemical Deposition. Appl. Surf. Sci. 2009, 255, 7864–7870.
(16) Gao, P.; Gosztola, D.; Leung, L.-W. H.; Weaver, M. J. Surface-Enhanced Raman
Scattering at Gold Electrodes : Dependence on Electrochemical Pretreatment

Conditions and Comparisons with Silver. J. Electroanal. Chem. 1987, 233, 211–
222.
(17) Zhu, X.; Yang, H.; Wang, N.; Zhang, R.; Song, W.; Sun, Y.; Duan, G.; Ding, W.;
Zhang, Z. A Facile Method for Preparation of Gold Nanoparticles with High
SERS Efficiency in the Presence of Inositol Hexaphosphate. J. Colloid Interface
Sci. 2010, 342, 571–574.
(18) Oliveira-Brett, A.; Piedade, J. A.; Silva, L.; Diculescu, V. Voltammetric
Determination of All DNA Nucleotides. Anal. Biochem. 2004, 332, 321–3299.
(19) Paleček, E.; Bartošík, M. Electrochemistry of Nucleic Acids. Chem. Rev. 2012,
112, 3427–3481.
(20) Dryhurst, G. Electrochemical Determination of Adenine and Adenosine. Talanta
1972, 19, 768–778.
(21) Dryhurst, G. Dicarbonium Ions as Products of Electrochemical Oxidation of
Biologically Important Purines at the Pyrolytic Graphite Electrode. J.
Electrochem. Soc. 1969, 116, 1411–1412.
(22) Hyvärinen, A.; Oja, E. Independent Component Analysis: Algorithms and
Applications. Neural Networks 2000, 13, 411–430.
(23) Garoz-Ruiz, J.; Palmero, S.; Ibañez, D.; Heras, A.; Colina, A. Press-Transfer
Optically Transparent Electrodes Fabricated from Commercial Single-Walled
Carbon Nanotubes. Electrochem. Commun. 2012, 25, 1–4.
(24) Reetz, M. T.; Helbig, W. Size-Selective Synthesis of Nanostructured Transition
Metal Clusters. J. Am. Chem. Soc. 1994, 116, 7401–7402.

(25) El-Cheick, F. M.; Rashwan, F. A.; Mahmoud, H. A.; El-Rouby, M. Gold
Nanoparticle-Modified Glassy Carbon Electrode for Electrochemical
Investigation of Aliphatic Di-Carboxylic Acids in Aqueous Media. Solid State
Electrochem. 2009, 14, 1425–1443.
(26) Huang, S.; Ma, H.; Zhang, X.; Yong, F.; Feng, X.; Pan, W.; Wang, X.; Wang, Y.;
Chen, S. Electrochemical Synthesis of Gold Nanocrystals and Their 1D and 2D
Organization. J. Phys. Chem. B 2005, 109, 19823–19830.
(27) Penner, R. M. Mesoscopic Metal Particles and Wires by Electrodeposition. J.
Phys. Chem. B 2002, 106, 3339–3353.
(28) Liu, H.; Favier, F.; Ng, K.; Zach, M.; Penner, R. Size-Selective Electrodeposition
of Meso-Scale Metal Particles: A General Method. Electrochim. Acta 2001, 47,
671–677.
(29) Wang, L.; Guo, S.; Hu, X.; Dong, S. Facile Electrochemical Approach to
Fabricate Hierarchical Flowerlike Gold Microstructures: Electrodeposited
Superhydrophobic Surface. Electrochem. Commun. 2008, 10, 95–99.
(30) Huang, C.; Jiang, J.; Lu, M.; Sun, L.; Meletis, E. I.; Hao, Y. Capturing
Electrochemically Evolved Nanobubbles by Electroless Deposition. A Facile
Route to the Synthesis of Hollow Nanoparticles. Nano Lett. 2009, 9, 4297–4301.
(31) Fernández-Blanco, C.; Colina, A.; Heras, A.; Ruiz, V.; López-Palacios, J.
Multipulse Strategies for the Electrosynthesis of Gold Nanoparticles Studied by
UV/Vis Spectroelectrochemistry. Electrochem. Commun. 2012, 18, 8–11.

(32) Suh, J. S.; Moskovits, M. Surface-Enhanced Raman Spectroscopy of Amino
Acids and Nucleotide Bases Adsorbed on Silver. J. Am. Chem. Soc. 1986, 108,
4711–4718.
(33) Yamada, T.; Shirasaka, K.; Takano, A.; Kawai, M. Adsorption of Cytosine,
Thymine, Guanine and Adenine on Cu(110) Studied by Infrared Reflection
Absorption Spectroscopy. Surf. Sci. 2004, 561, 233–247.
(34) Watanabe, T.; Kawanami, O.; Katoh, H.; Honda, K.; Nishimura, Y.; Tsuboi, M.
SERS Study of Molecular Adsorption: Some Nucleic Acid Bases on Ag
Electrodes. Surf. Sci. 1985, 158, 341–351.
(35) Kundu, J.; Neumann, O.; Janesko, B. G.; Zhang, D.; Lal, S.; Barhoumi, A.
Adenine and Adenosine Monophosphate (AMP) - Gold Binding Interactions
Studied by Surface-Enhanced Raman and Infrared Spectroscopies. J. Phys.
Chem. C 2009, 113, 14390–14397.
(36) Ostblom, M.; Liedberg, B.; Demers, L. M.; Mirkin, C. A. On the Structure and
Desorption Dynamics of DNA Bases Adsorbed on Gold: A Temperature-
Programmed Study. J. Phys. Chem. B 2005, 109, 15150–15160.
(37) Oliveira-Brett, A. M.; Diculescu, V.; Piedade, J. A. P. Electrochemical Oxidation
Mechanism of Guanine and Adenine Using a Glassy Carbon Microelectrode.
Bioelectrochemistry 2002, 55, 61–62.
(38) Brett, C. M. A.; Oliveira-Brett, A. M.; Serrano, S. H. P. On the Adsorption and
Electrochemical Oxidation of DNA at Glassy Carbon Electrodes. J. Electroanal.
Chem. 1994, 366, 225–231.

(39) Li, J.; Fang, Y. An Investigation of the Surface Enhanced Raman Scattering
(SERS) from a New Substrate of Silver-Modified Silver Electrode by Magnetron
Sputtering. Spectrochim. Acta. A. Mol. Biomol. Spectrosc. 2007, 66, 994–1000.
(40) Huang, R.; Yang, H.-T.; Cui, L.; Wu, D.-Y.; Ren, B.; Tian, Z.-Q. Structural and
Charge Sensitivity of Surface-Enhanced Raman Spectroscopy of Adenine on
Silver Surface: A Quantum Chemical Study. J. Phys. Chem. C 2013, 117, 23730–
23737.
(41) Giese, B.; McNaughton, D. Surface-Enhanced Raman Spectroscopic and Density
Functional Theory Study of Adenine Adsorption to Silver Surfaces. J. Phys.
Chem. B 2002, 106, 101–112.
(42) Lopes, R. P.; Valero, R.; Tomkinson, J.; Marques, M. P. M.; Batista de Carvalho,
L. A. E. Applying Vibrational Spectroscopy to the Study of Nucleobases –
Adenine as a Case-Study. New J. Chem. 2013, 37, 2691–2699.
(43) Castro, M.; Santamaria, R.; Charro, E.; Zacarias, A. Vibrational Spectra of
Nucleic Acid Bases and Their Watson-Crick. J. Comput. Chem. 1999, 20, 511–
530.
(44) D’Amico, F.; Cammisuli, F.; Addobbati, R.; Rizzardi, C.; Gessini, A.;
Masciovecchio, C.; Rossi, B.; Pascolo, L. Oxidative Damage in DNA Bases
Revealed by UV Resonant Raman Spectroscopy. Analyst 2015, 140, 1477–1485.
(45) Li, D.; Li, D.-W.; Fossey, J. S.; Long, Y.-T. Portable Surface-Enhanced Raman
Scattering Sensor for Rapid Detection of Aniline and Phenol Derivatives by on-
Site Electrostatic Preconcentration. Anal. Chem. 2010, 82, 9299–9305.

(46) P. Neelakantan. The Raman Spectrum of Cyclohexanol. Proc. Indian Acad. Sci.-
Sect. A 1963, 57, 94–102.
(47) Marley, N. A., Mann, C. K., Vickers, T. J. Determination of phenols in water
using Raman spectroscopy. Appl. Spectrosc., 1984, 38 , 540–543.
(48) Li, Q.; Batchelor-McAuley, C.; Compton, R. G. Electrochemical Oxidation of
Guanine: Electrode Reaction Mechanism and Tailoring Carbon Electrode
Surfaces to Switch between Adsorptive and Diffusional Responses. J. Phys.
Chem. B 2010, 114, 7423–7428.
(49) Lopes, R. P.; Marques, M. P. M.; Valero, R.; Tomkinson, J.; De Carvalho, L. A.
E. B. Guanine: A Combined Study Using Vibrational Spectroscopy and
Theoretical Methods. Spectrosc. An Int. J. 2012, 27, 273–292.
(50) Giese, B.; McNaughton, D. Density Functional Theoretical (DFT) and Surface-
Enhanced Raman Spectroscopic Study of Guanine and Its Alkylated Derivatives.
Part 1. Phys. Chem. Chem. Phys. 2002, 4, 5161–5170.
(51) Jang, N. H. The Coordination Chemistry of DNA Nucleosides on Gold
Nanoparticles as a Probe by SERS. Bull. Korean Chem. Soc. 2002, 23, 1790–
1800.
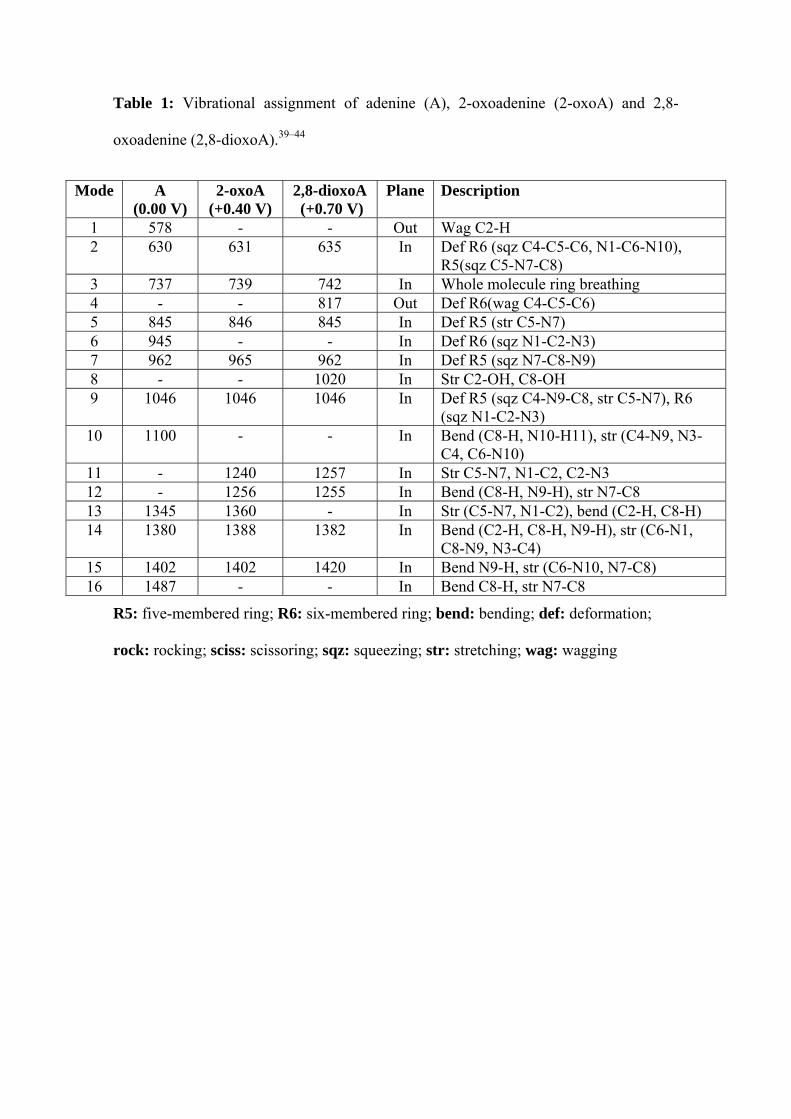
Table 1: Vibrational assignment of adenine (A), 2-oxoadenine (2-oxoA) and 2,8-
oxoadenine (2,8-dioxoA).39–44
Mode A (0.00 V)
2-oxoA (+0.40 V)
2,8-dioxoA (+0.70 V)
Plane Description
1 578 - - Out Wag C2-H 2 630 631 635 In Def R6 (sqz C4-C5-C6, N1-C6-N10),
R5(sqz C5-N7-C8) 3 737 739 742 In Whole molecule ring breathing 4 - - 817 Out Def R6(wag C4-C5-C6) 5 845 846 845 In Def R5 (str C5-N7) 6 945 - - In Def R6 (sqz N1-C2-N3) 7 962 965 962 In Def R5 (sqz N7-C8-N9) 8 - - 1020 In Str C2-OH, C8-OH 9 1046 1046 1046 In Def R5 (sqz C4-N9-C8, str C5-N7), R6
(sqz N1-C2-N3) 10 1100 - - In Bend (C8-H, N10-H11), str (C4-N9, N3-
C4, C6-N10) 11 - 1240 1257 In Str C5-N7, N1-C2, C2-N3 12 - 1256 1255 In Bend (C8-H, N9-H), str N7-C8 13 1345 1360 - In Str (C5-N7, N1-C2), bend (C2-H, C8-H) 14 1380 1388 1382 In Bend (C2-H, C8-H, N9-H), str (C6-N1,
C8-N9, N3-C4) 15 1402 1402 1420 In Bend N9-H, str (C6-N10, N7-C8) 16 1487 - - In Bend C8-H, str N7-C8
R5: five-membered ring; R6: six-membered ring; bend: bending; def: deformation;
rock: rocking; sciss: scissoring; sqz: squeezing; str: stretching; wag: wagging
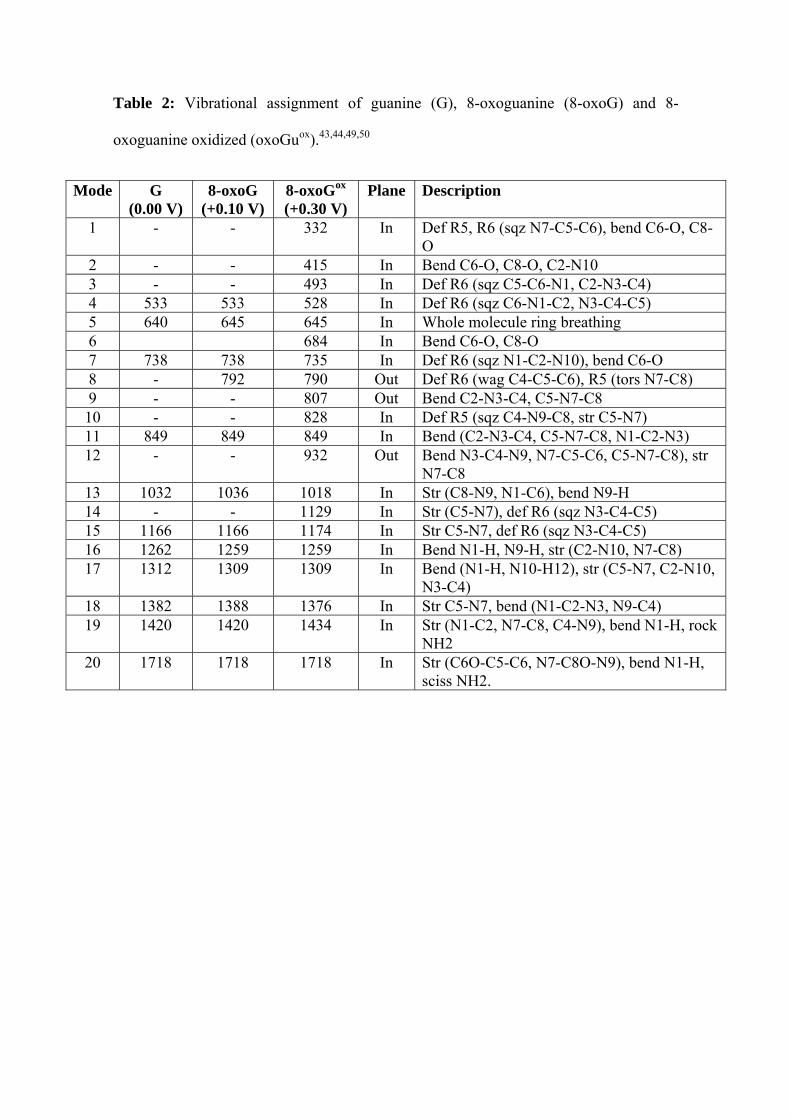
Table 2: Vibrational assignment of guanine (G), 8-oxoguanine (8-oxoG) and 8-
oxoguanine oxidized (oxoGuox).43,44,49,50
Mode G (0.00 V)
8-oxoG (+0.10 V)
8-oxoGox (+0.30 V)
Plane Description
1 - - 332 In Def R5, R6 (sqz N7-C5-C6), bend C6-O, C8-O
2 - - 415 In Bend C6-O, C8-O, C2-N10 3 - - 493 In Def R6 (sqz C5-C6-N1, C2-N3-C4) 4 533 533 528 In Def R6 (sqz C6-N1-C2, N3-C4-C5) 5 640 645 645 In Whole molecule ring breathing 6 684 In Bend C6-O, C8-O 7 738 738 735 In Def R6 (sqz N1-C2-N10), bend C6-O 8 - 792 790 Out Def R6 (wag C4-C5-C6), R5 (tors N7-C8) 9 - - 807 Out Bend C2-N3-C4, C5-N7-C8
10 - - 828 In Def R5 (sqz C4-N9-C8, str C5-N7) 11 849 849 849 In Bend (C2-N3-C4, C5-N7-C8, N1-C2-N3) 12 - - 932 Out Bend N3-C4-N9, N7-C5-C6, C5-N7-C8), str
N7-C8 13 1032 1036 1018 In Str (C8-N9, N1-C6), bend N9-H 14 - - 1129 In Str (C5-N7), def R6 (sqz N3-C4-C5) 15 1166 1166 1174 In Str C5-N7, def R6 (sqz N3-C4-C5) 16 1262 1259 1259 In Bend N1-H, N9-H, str (C2-N10, N7-C8) 17 1312 1309 1309 In Bend (N1-H, N10-H12), str (C5-N7, C2-N10,
N3-C4) 18 1382 1388 1376 In Str C5-N7, bend (N1-C2-N3, N9-C4) 19 1420 1420 1434 In Str (N1-C2, N7-C8, C4-N9), bend N1-H, rock
NH2 20 1718 1718 1718 In Str (C6O-C5-C6, N7-C8O-N9), bend N1-H,
sciss NH2.
Schemes
Scheme 1. Adenine oxidation mechanism
Scheme 2. Guanine oxidation mechanism.

Figures
Figure 1.a
Figure 1.b
Figure 1. Raman spectra of adenine at different potentials (a) and times (b) of AuNPs
electrodeposition.
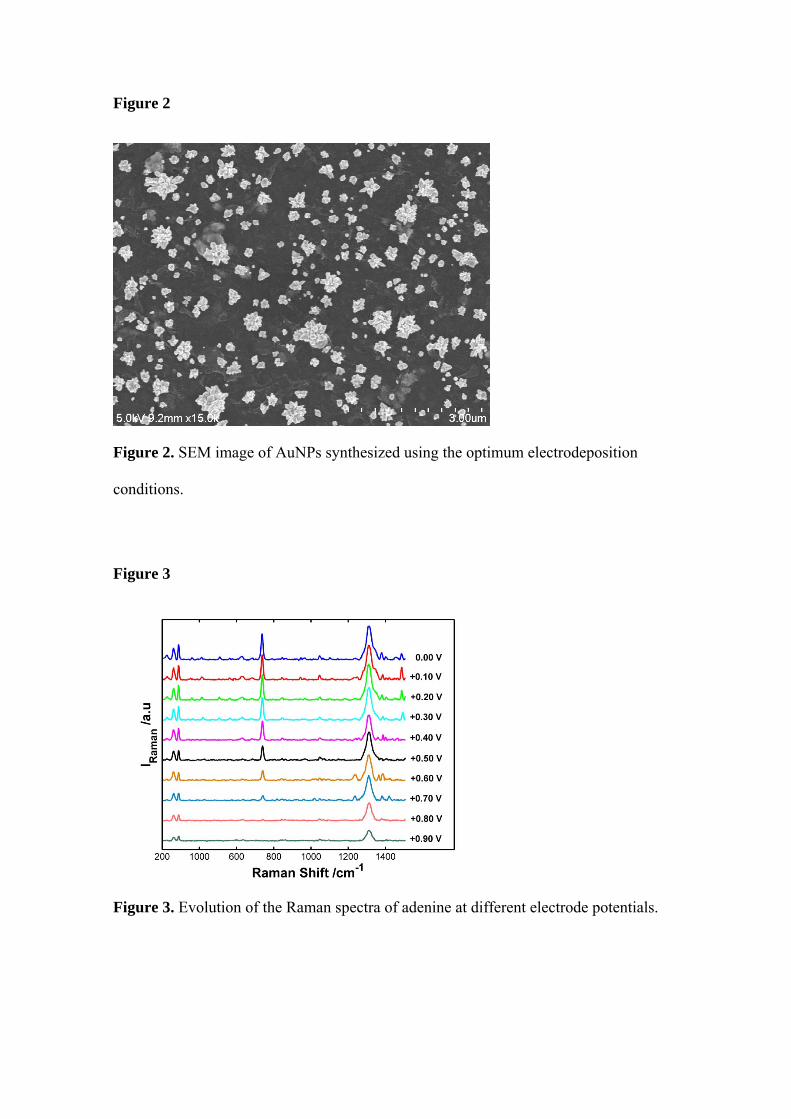
Figure 2
Figure 2. SEM image of AuNPs synthesized using the optimum electrodeposition
conditions.
Figure 3
Figure 3. Evolution of the Raman spectra of adenine at different electrode potentials.
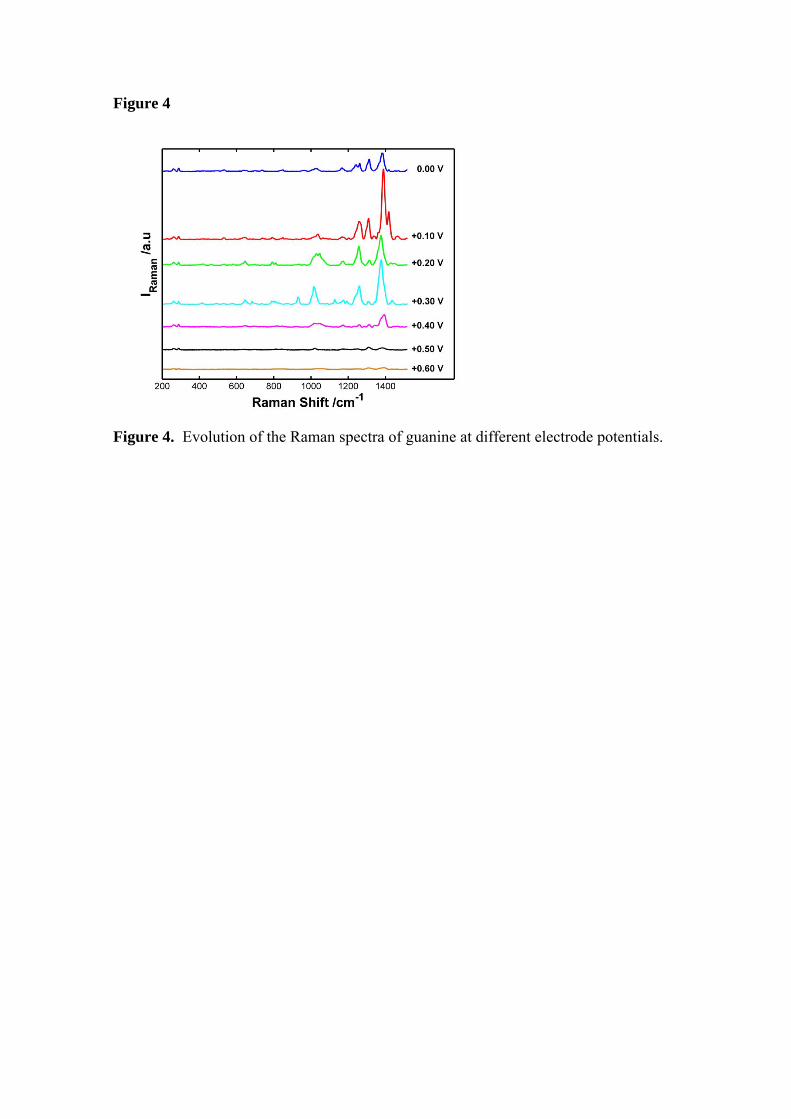
Figure 4
Figure 4. Evolution of the Raman spectra of guanine at different electrode potentials.

Figure 5
Figure 5.a
Figure 5.b
Figure 5. Schematic drawing of (a) A, 2-oxoA and 2,8-dioxoA orientation during the
oxidation and (b) G, 8-oxoG and 8-oxoGoxo oxidized orientation during the oxidation.

Table of contents (TOC)