this drawing may be used only for the … · level 4 65 gresham street ec2v 7nq ordinary...
TRANSCRIPT

")
_̂__
_̂__
_̂__
_̂__
_̂__
_̂__
_̂__ _̂__
_̂__
_̂___̂__
_̂__
_̂__
_̂__
_̂__
_̂__
_̂__
_̂__
_̂__
")
")
#*
#*#*
#*
#*#*
#*#*
#*
#*
#*
#*
#*
#*
!(
!(
!(
!(
!(
Kings_003Kings_002
Kings_008
Kings_011
Kings_012
Kings_010
Kings_007
Kings_001
Kings_006
Kings_004
Kings_009
Kings_005
E
D
B
C
A
THIS DRAWING MAY BE USED ONLY FORTHE PURPOSE INTENDED
Scale at A31:27,000
Approved byDate Drawn by
DRAFTFlood Depth
1 in 30yr, Fluvial Flow
FIGURE 21
Consultant
NORTH
Capita Level 465 Gresham StreetEC2V 7NQ
Ordinary Watercourse Flood Investigation
King's Lynn
0 0.10.20.30.40.5Kilometres
Legend
!( Structure Failure Location
Main and Ordinary Watercourse
Model Extent
CDC Boundary
Sewer- Surface and CombinedFlood Depth (m)
< 0.1m
0.1m to 0.25m
0.25m to 0.5m
0.5m to 1.0m
1.0m to 1.5m
> 1.5m
_̂__West Norfolk Fire and Rescue - Callouts for'Weather Related Flooding'
#* Anglian Water Flooding Records
Flooding Survey:!( Multiple!( Sewer!( Pluvial
!( Fluvial!( Tidal
EA Historic Surface Water Flooding Records:") Fluvial") Ground Water") Multiple
") Pluvial") Sewer
M. MamunJuly 2015 G. Athanasia
© Crown Copyright. All rights reserved Norfolk County Council. Licence No. 0100031673 (2014).Covers all data that has been supplied and distributed under license for the King's Lynn Ordinary Watercourse Flood Investigation project.
NotesStructure Failure Scenario:- Complete Failure of Bawsey Drain Syphon (A) under the Gaywood River and Gaywood River Culvert under the London Road (C).

")
_̂__
_̂__
_̂__
_̂__
_̂__
_̂__
_̂__ _̂__
_̂__
_̂___̂__
_̂__
_̂__
_̂__
_̂__
_̂__
_̂__
_̂__
_̂__
")
")
#*
#*#*
#*
#*#*
#*#*
#*
#*
#*
#*
#*
#*
!(
!(
!(
!(
!(
Kings_003Kings_002
Kings_008
Kings_011
Kings_012
Kings_010
Kings_007
Kings_001
Kings_006
Kings_004
Kings_009
Kings_005
E
D
B
C
A
THIS DRAWING MAY BE USED ONLY FORTHE PURPOSE INTENDED
Scale at A31:27,000
Approved byDate Drawn by
DRAFTFlood Depth
1 in 100yr, Fluvial Flow
FIGURE 22
Consultant
NORTH
Capita Level 465 Gresham StreetEC2V 7NQ
Ordinary Watercourse Flood Investigation
King's Lynn
0 0.10.20.30.40.5Kilometres
Legend
!( Structure Failure Location
Main and Ordinary Watercourse
Model Extent
CDC Boundary
Sewer- Surface and CombinedFlood Depth (m)
< 0.1m
0.1m to 0.25m
0.25m to 0.5m
0.5m to 1.0m
1.0m to 1.5m
> 1.5m
_̂__West Norfolk Fire and Rescue - Callouts for'Weather Related Flooding'
#* Anglian Water Flooding Records
Flooding Survey:!( Multiple!( Sewer!( Pluvial
!( Fluvial!( Tidal
EA Historic Surface Water Flooding Records:") Fluvial") Ground Water") Multiple
") Pluvial") Sewer
M. MamunJuly 2015 G. Athanasia
© Crown Copyright. All rights reserved Norfolk County Council. Licence No. 0100031673 (2014).Covers all data that has been supplied and distributed under license for the King's Lynn Ordinary Watercourse Flood Investigation project.
NotesStructure Failure Scenario:- Complete Failure of Bawsey Drain Syphon (A) under the Gaywood River and Gaywood River Culvert under the London Road (C).

Kings_002Kings_003
THIS DRAWING MAY BE USED ONLY FORTHE PURPOSE INTENDED
Scale at A31:4,500
Approved byDate Drawn by
DRAFTBaseline Flood Depth
1 in 100yr, 3.4hr duration
FIGURE 23
Consultant
Notes
NORTH
Capita Level 465 Gresham StreetEC2V 7NQ
King's Lynn
July 2015 M. Mamun
0 30 60 90 120 150Meters
© Crown Copyright. All rights reserved Norfolk County Council. Licence No. 0100031673 (2014).Covers all data that has been supplied and distributed under license for the King's Lynn Ordinary Watercourse Flood Investigation project.
LegendMain and Ordinary Watercourse
Sewer- Surface and Combined
Model Extent
Infitration Basin
Pond
CDC BoundaryFlood Depth (m)
< 0.1m
0.1m to 0.25m
0.25m to 0.5m
0.5m to 1.0m
1.0m to 1.5m
> 1.5m
Ordinary Watercourse Flood Investigation
G. Athanasia

Kings_003Kings_002
Kings_004
THIS DRAWING MAY BE USED ONLY FORTHE PURPOSE INTENDED
Scale at A31:4,500
Approved byDate Drawn by
DRAFTBaseline Flood Depth
1 in 100yr, 3.4hr duration
FIGURE 24
Consultant
Notes
NORTH
Capita Level 465 Gresham StreetEC2V 7NQ
King's Lynn
M. MamunJuly 2015 G. Athanasia
0 30 60 90 120 150Meters
© Crown Copyright. All rights reserved Norfolk County Council. Licence No. 0100031673 (2014).Covers all data that has been supplied and distributed under license for the King's Lynn Ordinary Watercourse Flood Investigation project.
LegendMain and Ordinary Watercourse
Sewer- Surface and Combined
Model Extent
Infitration Basin
CDC BoundaryFlood Depth (m)
< 0.1m
0.1m to 0.25m
0.25m to 0.5m
0.5m to 1.0m
1.0m to 1.5m
> 1.5m
Ordinary Watercourse Flood Investigation
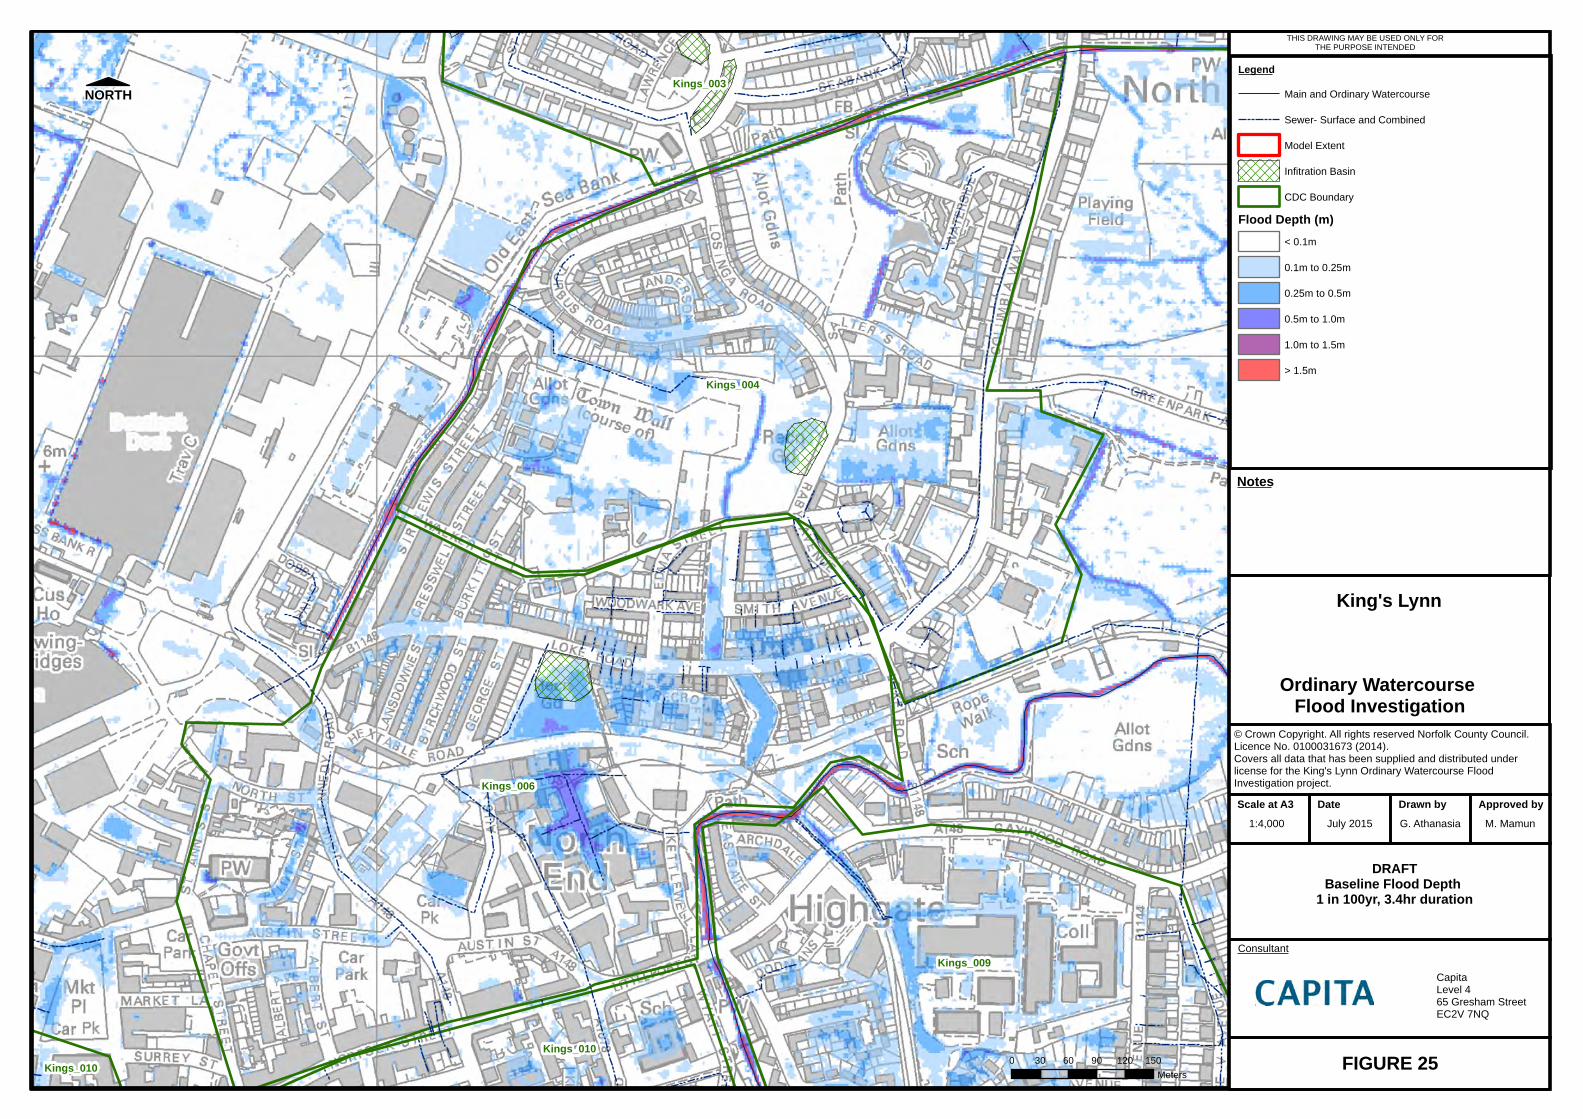
Kings_006
Kings_004
Kings_009
Kings_003
Kings_010Kings_010
THIS DRAWING MAY BE USED ONLY FORTHE PURPOSE INTENDED
Scale at A31:4,000
Approved byDate Drawn by
DRAFTBaseline Flood Depth
1 in 100yr, 3.4hr duration
FIGURE 25
Consultant
Notes
NORTH
Capita Level 465 Gresham StreetEC2V 7NQ
King's Lynn
M. MamunJuly 2015 G. Athanasia
0 30 60 90 120 150Meters
© Crown Copyright. All rights reserved Norfolk County Council. Licence No. 0100031673 (2014).Covers all data that has been supplied and distributed under license for the King's Lynn Ordinary Watercourse Flood Investigation project.
LegendMain and Ordinary Watercourse
Sewer- Surface and Combined
Model Extent
Infitration Basin
CDC BoundaryFlood Depth (m)
< 0.1m
0.1m to 0.25m
0.25m to 0.5m
0.5m to 1.0m
1.0m to 1.5m
> 1.5m
Ordinary Watercourse Flood Investigation

Kings_012
THIS DRAWING MAY BE USED ONLY FORTHE PURPOSE INTENDED
Scale at A31:3,500
Approved byDate Drawn by
DRAFTBaseline Flood Depth
1 in 100yr, 3.4hr duration
FIGURE 26
Consultant
Notes
NORTH
Capita Level 465 Gresham StreetEC2V 7NQ
King's Lynn
M. MamunJuly 2015 G. Athanasia
0 25 50 75 100 125Meters
© Crown Copyright. All rights reserved Norfolk County Council. Licence No. 0100031673 (2014).Covers all data that has been supplied and distributed under license for the King's Lynn Ordinary Watercourse Flood Investigation project.
LegendMain and Ordinary Watercourse
Sewer- Surface and Combined
Model Extent
Infitration Basin
CDC BoundaryFlood Depth (m)
< 0.1m
0.1m to 0.25m
0.25m to 0.5m
0.5m to 1.0m
1.0m to 1.5m
> 1.5m
Ordinary Watercourse Flood Investigation

Kings Lynn Ordinary Watercourses Study October 2015
Commercial in Confidence
35
Appendix E : Action Plan

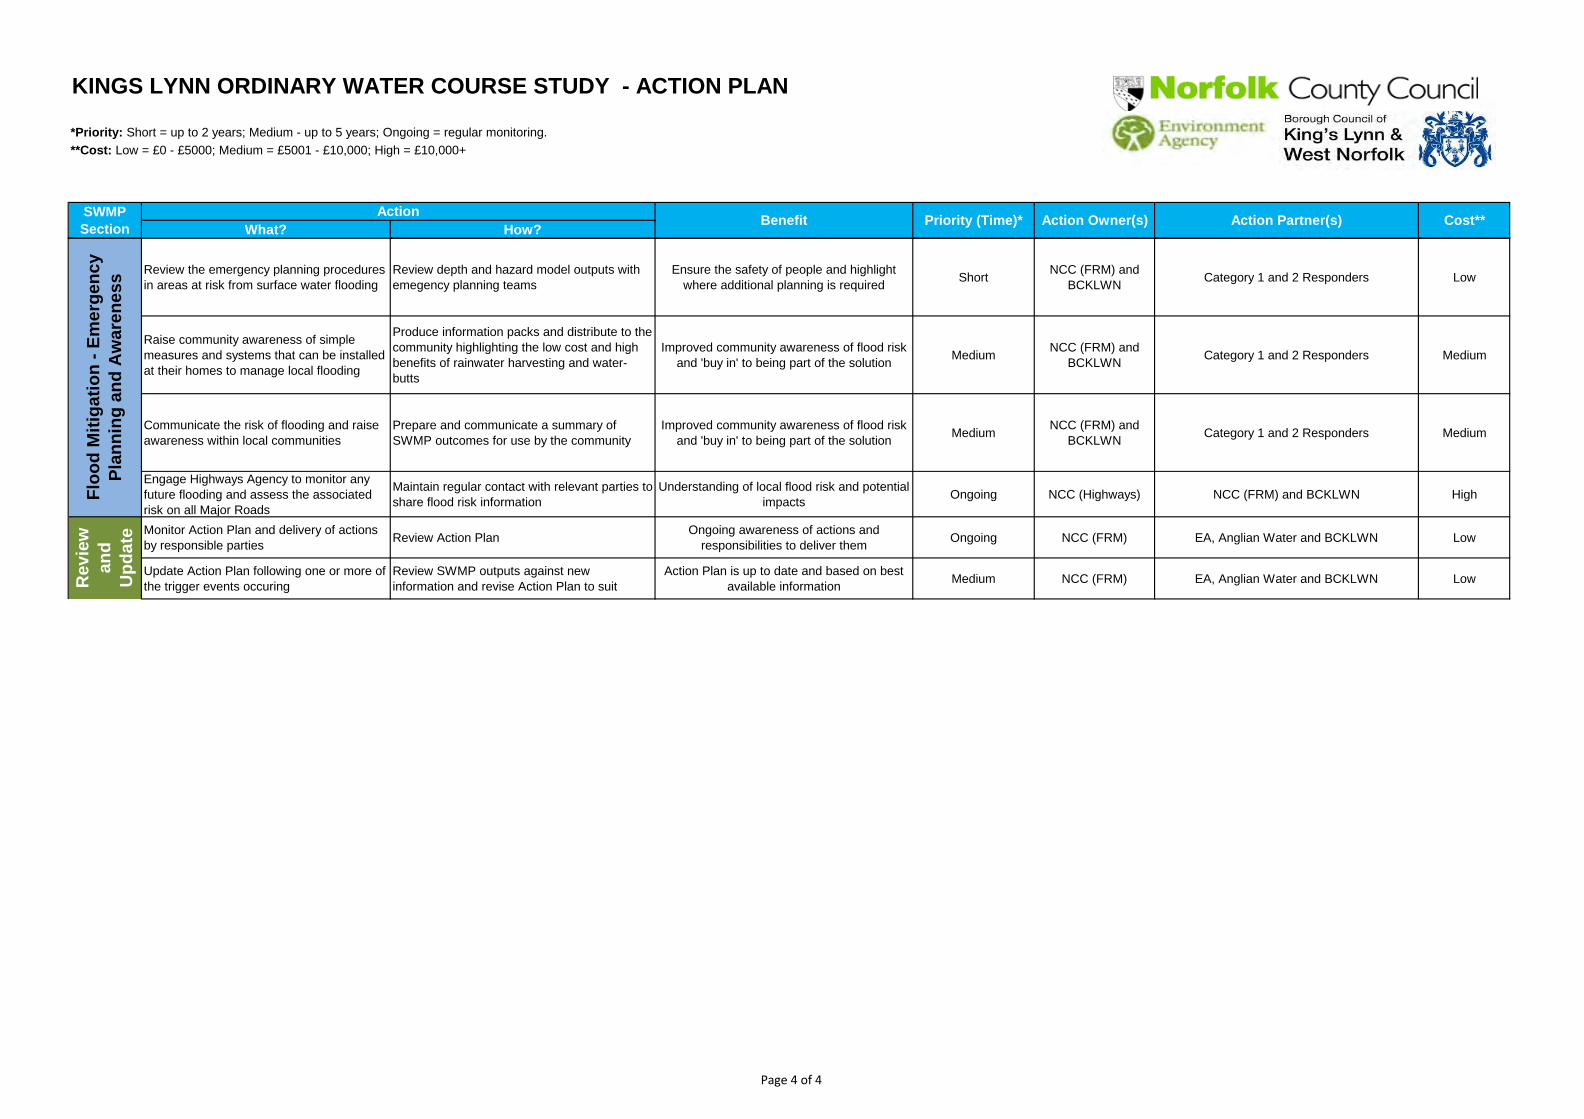
KINGS LYNN ORDINARY WATER COURSE STUDY - ACTION PLAN
*Priority: Short = up to 2 years; Medium - up to 5 years; Ongoing = regular monitoring.**Cost: Low = £0 - £5000; Medium = £5001 - £10,000; High = £10,000+
What? How?Look for opportunities to reduce flood risk to critical transport infrastructure whilst upgrading the existing drainage network in partnership with Anglian Water, Highways Agency, IDB and Network Rail
Discussion with relevant officers of NCC & BCKLWN
Refine understanding of risk to critical infrastructure. Prioritise localised drainage improvements Medium NCC Highways Agency and Anglian Water Medium
Installation of additional road gullies or alternative drainage systems to reduce standing water depth and duration
As part of highways improvement programme include additional construction task of installing additional gullies or alternative drainage systems where feasible and required. Consultation with Anglian Water and IDB's may be required.
Reduction in the probability of flooding
Medium NCC Anglian Water and NCC Highways Medium
Determine extent of I) residential use of at-risk basements [if any], ii) groundwater boreholes and iii) geological conditions, and decide if a risk from flooding exists.
No basements are identified in the EA NRD however this should be confirmed with local knowledge. If basements are identified then use predicted extent of 75year flood to enable determination.
Better understanding of scope of flooding impact, and improving identification of
solutions and fundingShort NCC and BCKLWN Local Residents, NCC Low
Determine whether services (e.g. power, telecommunications) are resilient to surface water flooding
Discuss the overall resilience of services with relevant companies Community resilience to flooding Medium NCC and BCKLWN Utilities/services companies Medium
Developments across the catchment to include source control SuDS measure(s), resulting in a net improvement in water quantity or quality discharging to sewer
Development control review and monitoring of policy implementation
Mid-long term reduction in flood risk and improvement in water quality Ongoing BCKLWN EA, NCC (FRM) Low
All developments across the catchment (excluding minor house extensions less than 50m2) which relate to a net increase in impermeable area are to include at least one 'at source' SuDS measure (e.g. water butt, rainwater harvesting tank, bioretention planter box etc). This is to assist in reducing the peak volume of runoff discharging from the site
Development control review and monitoring of policy implementation
Mid-long term reduction in the probability of flooding Ongoing BCKLWN EA, NCC (FWMT) Low
Proposed ‘brownfield’ redevelopments of more than one property or area greater than 0.1 hectare are required to reduce post-development runoff rates for events up to and including the 1 in 100 year return period event with an allowance for climate change (in line with NPPF and UKCIP guidance) to 50% of the existing site conditions. If this results in a discharge rate lower than the Greenfield conditions it is recommended that the Greenfield rates (calculated in accordance with IoH124 ) are used.
Development control review and monitoring of policy implementation
Mid-long term reduction in the probability of flooding Ongoing BCKLWN EA, NCC (FWMT) Low
Cost**Priority (Time)*BenefitAction Action Owner(s) Action Partner(s)SWMP Section
F
lood
Miti
gatio
n - A
rea
Wid
e Po
licy
Ris
k A
sses
smen
t
Page 1 of 4

KINGS LYNN ORDINARY WATER COURSE STUDY - ACTION PLAN
*Priority: Short = up to 2 years; Medium - up to 5 years; Ongoing = regular monitoring.**Cost: Low = £0 - £5000; Medium = £5001 - £10,000; High = £10,000+
What? How? Cost**Priority (Time)*BenefitAction Action Owner(s) Action Partner(s)SWMP Section
Developments located in CDCs and for redevelopments of more than one property or area greater than 0.1 hectare require a betterment to Greenfield runoff rates (calculated in accordance with IoH124). It is recommended that a SuDS treatment train is utilised to assist in this reduction.
Development control review and monitoring of policy implementation
Mid-long term reduction in the probability of flooding Ongoing BCKLWN EA, NCC (FRM) Low
Implement Policy relating to Best management practises in relation to Water Quality and a reduction in pollutant loads (investigate using the water quality computer software [MUSIC or similar])
Development control review and monitoring of policy implementation
Mid-long term reduction in the probability of flooding Ongoing BCKLWN EA, NCC (FRM) Low
Review Policy Areas and implement recommended controls for development within these.
Development control review and monitoring of policy implementation
Mid-long term reduction in the probability of flooding Ongoing BCKLWN EA, NCC (FRM), Anglian Water Low
Preferential overland flowpaths (Urban Blue Corridors): This concept aims to manage the conveyance of surface water across an area of the catchment through the long term redesign of the urban landscape to create specific pathways to convey surface water.
Development control review and monitoring of policy implementation
Mid-long term reduction in the probability of flooding Ongoing BCKLWN EA, NCC (FRM), Anglian Water Low
Use Anglian WaterMP maps to require developers In areas at risk of flooding to demonstrate compliance with NPPF to ensure development will remain safe and will not increase risk to others, where necessary supported by more detailed integrated hydraulic modelling.
Development Control Policy Mid-long term reduction in the consequences of flooding Ongoing
NCC and BCKLWN (Planning Strategy
Dpts)EA, Anglian Water Low
Ensure drainage systems are operating at capacity - maintenance of gullies
Review existing gully clearance/ maintenance schedules and if necessary revise/prioritise based on surface water flooding predictions in this document
Flooding is not exacerbated Ongoing NCC (Highways) and BCKLWN Anglian Water High
Gully Cleaning - Timing of Cleansing Rounds
Coordinate timing of gully cleansing rounds to ensure that they do not coincide with school opening and closing times and other peak times that would prevent gaining access to gullies.
Improved maintenance regimes Short NCC (Highways) BCKLWN Medium
Clear Blocked Gullies
Focus attention on the maintenance of gully pots in the OAs which are considered to be high risk and on those areas identified as being at risk from blocked gullies
Reduction in the probability of flooding Short NCC (Highways) BCKLWN Medium
Ensure drainage systems are operating at capacity - maintenance of Anglian Water sewers. Anglian Water to recommend SWMP findings to PPM programme, if flooding identified as drainage serviceability issue.
May require mapping of existing drainage infrastructure. Review existing maintenance schedules and if necessary revise/prioritise
Flooding is not exacerbated Ongoing Anglian Water NCC (Highways), BCKLWN High
Miti
gatio
n - M
aint
enan
ce
Page 2 of 4

KINGS LYNN ORDINARY WATER COURSE STUDY - ACTION PLAN
*Priority: Short = up to 2 years; Medium - up to 5 years; Ongoing = regular monitoring.**Cost: Low = £0 - £5000; Medium = £5001 - £10,000; High = £10,000+
What? How? Cost**Priority (Time)*BenefitAction Action Owner(s) Action Partner(s)SWMP Section
Maintain ditches and related infrastructure, proactively enforce maintenance of land drainage by riparian owners
Review existing maintenance schedules and if necessary revise/prioritise area of historic blockage (may require public consultation)
Flooding is not exacerbated Ongoing NCC, IBDs Anglian Water, EA High
Review all natural assets to ensure the environmental integrity of the area(s) are not compromised by surface water runoff and any changes from development or flow regime
Undertake monitoring of areas(water quality, debris, flora/ fauna, etc) Maintain environmental benefits Ongoing NCC (FRM) and
BCKLWN EA Medium
Investigate (confirm) whether flooding incidents have occurred in CDCs and other areas identified as being at risk of flooding
Review flooding reports, then conduct survey of local residents (e.g. mail drop, door knocking) to update database
Validate model outputs, resident 'buy in' Short BCKLWN NCC, Local Residents Medium
Monitor flood risk related problems and manage future development to minimise impact on flood risk
Development control policy and monitoring of flood risk incident register
Proactive management of potential flood risk in areas of higher risk probability Ongoing BCKLWN NCC (Highways & FRM) Low
Undertake further investigations to implement Small Scale SuDS (e.g., Green roofs, rain gardens, permeable paving, soakaways) and Property Level Protection (PLP) where predicted flood risk is confirmed through consultation or future significant rainfall events
Undertake detailed modelling, cost benefit analysis and submit funding applications for flood mitigation schemes
Reduction in the probability of flooding Ongoing NCC / BCKLWN EA / IDB High
Undertake further investigations as required where predicted flood risk is confirmed through consultation or future significant rainfall events
Undertake detailed modelling, cost benefit analysis and submit funding applications for flood mitigation schemes
Reduction in the probability of flooding Ongoing NCC / BCKLWN EA / Anglian Water High
Floo
d Fl
ood
Miti
gatio
n - O
ppor
tuni
ty
Are
as
Page 3 of 4
KINGS LYNN ORDINARY WATER COURSE STUDY - ACTION PLAN
*Priority: Short = up to 2 years; Medium - up to 5 years; Ongoing = regular monitoring.**Cost: Low = £0 - £5000; Medium = £5001 - £10,000; High = £10,000+
What? How? Cost**Priority (Time)*BenefitAction Action Owner(s) Action Partner(s)SWMP Section
Review the emergency planning procedures in areas at risk from surface water flooding
Review depth and hazard model outputs with emegency planning teams
Ensure the safety of people and highlight where additional planning is required Short NCC (FRM) and
BCKLWN Category 1 and 2 Responders Low
Raise community awareness of simple measures and systems that can be installed at their homes to manage local flooding
Produce information packs and distribute to the community highlighting the low cost and high benefits of rainwater harvesting and water-butts
Improved community awareness of flood risk and 'buy in' to being part of the solution Medium NCC (FRM) and
BCKLWN Category 1 and 2 Responders Medium
Communicate the risk of flooding and raise awareness within local communities
Prepare and communicate a summary of SWMP outcomes for use by the community
Improved community awareness of flood risk and 'buy in' to being part of the solution Medium NCC (FRM) and
BCKLWN Category 1 and 2 Responders Medium
Engage Highways Agency to monitor any future flooding and assess the associated risk on all Major Roads
Maintain regular contact with relevant parties to share flood risk information
Understanding of local flood risk and potential impacts Ongoing NCC (Highways) NCC (FRM) and BCKLWN High
Monitor Action Plan and delivery of actions by responsible parties Review Action Plan Ongoing awareness of actions and
responsibilities to deliver them Ongoing NCC (FRM) EA, Anglian Water and BCKLWN Low
Update Action Plan following one or more of the trigger events occuring
Review SWMP outputs against new information and revise Action Plan to suit
Action Plan is up to date and based on best available information Medium NCC (FRM) EA, Anglian Water and BCKLWN LowR
evie
w
and
Upd
ate
Floo
d M
itiga
tion
- Em
erge
ncy
Plan
ning
and
Aw
aren
ess
Page 4 of 4

Kings Lynn Ordinary Watercourses Study October 2015
Commercial in Confidence
36
Appendix F : Flood Estimation Proforma

Doc no. 197_08_SD01 Version 2 Last printed 13/08/2015 Page 1 of 17
Flood estimation calculation record
Introduction
This document is a supporting document to the Environment Agency’s flood estimation guidelines. It provides a record of the calculations and decisions made during flood estimation. It will often be complemented by more general hydrological information given in a project report. The information given here should enable the work to be reproduced in the future. This version of the record is for studies where flood estimates are needed at multiple locations. Contents
Page
1 METHOD STATEMENT -------------------------------------------------------------------------------------------- 3
2 LOCATIONS WHERE FLOOD ESTIMATES REQUIRED ------------------------------------------------- 7
3 STATISTICAL METHOD ------------------------------------------------------------------------------------------- 9
4 REVITALISED FLOOD HYDROGRAPH (REFH) METHOD -------------------------------------------- 12
5 FEH RAINFALL-RUNOFF METHOD ------------------------------------------------------------------------- 13
6 DISCUSSION AND SUMMARY OF RESULTS ------------------------------------------------------------ 15
7 ANNEX - SUPPORTING INFORMATION ------------------------------------------------------------------ 17
Approval
Signature Name and qualifications For Environment Agency
staff: Competence level (see below)
Calculations prepared by:
Georgia Athanasia/Anna Velkov
Calculations checked by:
Kerry Foster
Calculations approved by:
Environment Agency competence levels are covered in Section 2.1 of the flood estimation guidelines: Level 1 – Hydrologist with minimum approved experience in flood estimation Level 2 – Senior Hydrologist Level 3 – Senior Hydrologist with extensive experience of flood estimation

Doc no. 197_08_SD01 Version 2 Last printed 13/08/2015 Page 2 of 17
ABBREVIATIONS
AM Annual Maximum AREA Catchment area (km2) BFI Base Flow Index BFIHOST Base Flow Index derived using the HOST soil classification CFMP Catchment Flood Management Plan CPRE Council for the Protection of Rural England FARL FEH index of flood attenuation due to reservoirs and lakes FEH Flood Estimation Handbook FSR Flood Studies Report HOST Hydrology of Soil Types NRFA National River Flow Archive POT Peaks Over a Threshold QMED Median Annual Flood (with return period 2 years) ReFH Revitalised Flood Hydrograph method SAAR Standard Average Annual Rainfall (mm) SPR Standard percentage runoff SPRHOST Standard percentage runoff derived using the HOST soil classification Tp(0) Time to peak of the instantaneous unit hydrograph URBAN Flood Studies Report index of fractional urban extent URBEXT1990 FEH index of fractional urban extent URBEXT2000 Revised index of urban extent, measured differently from URBEXT1990 WINFAP-FEH Windows Frequency Analysis Package – used for FEH statistical method

Doc no. 197_08_SD01 Version 2 Last printed 13/08/2015 Page 3 of 17
1 Method statement
1.1 Overview of requirements for flood estimates
Item Comments Give an overview which includes: Purpose of study Approx. no. of flood
estimates required Peak flows or
hydrographs? Range of return
periods and locations Approx. time
available
The purpose of the King’s Lynn Ordinary Watercourse Study is to undertake a more detailed assessment of flood risk from ordinary watercourses within King’s Lynn and its interaction with surface water flooding. No hydrology report or ISIS inflow boundaries are available for the Pierrepoint Model and the previous study recommended to re-estimating flow boundaries using updated methods (since the FEH rainfall-runoff method has been superseded by the Revitalised FEH method) and data. Therefore, hydrological calculation will be done for the Pierrepoint and Middleton Stop Drains to derive inflows for the ISIS model. The inflows applied to the model will consist of a combination of point inflows applied to the watercourses and rainfall hyetographs applied to the entirety of the 2D model extent. The point inflows represent runoff from the upper parts of the catchment that are not explicitly modelled.
1.2
1.3 Overview of catchment
Item Comments Brief description of catchment, or reference to section in accompanying report
Refer to King’s Lynn Ordinary Watercourse Study: Technical Note
1.4
1.5 Source of flood peak data
Was the HiFlows UK dataset used? If so, which version? If not, why not? Record any changes made
No – not required
1.6 Gauging stations (flow or level)
(at the sites of flood estimates or nearby at potential donor sites) Water-course
Station name
Gauging authority number
NRFA number (used in
FEH)
Grid reference
Catch-ment area (km²)
Type (rated /
ultrasonic / level…)
Start and end of flow
record N/A

Doc no. 197_08_SD01 Version 2 Last printed 13/08/2015 Page 4 of 17
1.7 Data available at each flow gauging station
Station name
Start and end of data in
HiFlows-UK
Update for this study?
Suitable for
QMED?
Suitable for
pooling?
Data quality check
needed?
Other comments on station and flow data quality – e.g. information from HiFlows-UK, trends in flood peaks, outliers.
N/A Give link/reference to any further data quality checks carried out
1.8 Rating equations
Station name
Type of rating e.g. theoretical,
empirical; degree of extrapolation
Rating review
needed?
Reasons – e.g. availability of recent flow gaugings, amount of scatter in the rating.
N/A Give link/reference to any rating reviews carried out
1.9 Other data available and how it has been obtained
Type of data Data relevant to this study?
Data available
?
Source of data and licence
reference if from EA
Date obtained
Details
Check flow gaugings (if planned to review ratings)
Historic flood data – give link to historic review if carried out.
Flow data for events Rainfall data for events Potential evaporation data
Results from previous studies
Other data or information (e.g. groundwater, tides)
1.10 Initial choice of approach
Is FEH appropriate? (it may not be for very small, heavily urbanised or complex catchments) If not, describe other methods to

Doc no. 197_08_SD01 Version 2 Last printed 13/08/2015 Page 5 of 17
be used. Outline the conceptual model, addressing questions such as: Where are the main sites of interest? What is likely to cause flooding at those
locations? (peak flows, flood volumes, combinations of peaks, groundwater, snowmelt, tides…)
Might those locations flood from runoff generated on part of the catchment only, e.g. downstream of a reservoir?
Is there a need to consider temporary debris dams that could collapse?
Any unusual catchment features to take into account? e.g. highly permeable – avoid ReFH if
BFIHOST>0.65, consider permeable catchment adjustment for statistical method if SPRHOST<20%
highly urbanised – avoid standard ReFH if URBEXT1990>0.125; consider FEH Statistical or other alternatives; consider method that can account for differing sewer and topographic catchments
pumped watercourse – consider lowland catchment version of rainfall-runoff method
major reservoir influence (FARL<0.90) – consider flood routing
extensive floodplain storage – consider choice of method carefully
Initial choice of method(s) and reasons Will the catchment be split into subcatchments? If so, how?
The Middleton Stop Drain and the Pierrepoint drain ordinary water courses are located in a close proximity to the River Gaywood. The catchments are permeable and covered by similar soil type (see the soil map extract below). No gauging stations (flow or level) exist on the ordinary water courses and the nearest gauge is the Sugar Fen Gauging Station located on River Gaywood and used as a donor station for the River Gaywood flood estimation (River Gaywood Flood Modelling, PBA, 2014). Therefore a decision was made to use the same approach and method used in the Gaywood river Flood Modelling report: 2014 200117 Model Report Revision A (draft), (P:\environment\ZWET\CS072082_KingsLynnOrdinaryWatercourses\Data)

Doc no. 197_08_SD01 Version 2 Last printed 13/08/2015 Page 6 of 17
Software to be used (with version numbers)
FEH CD-ROM v3.01/ ISIS v3.7
1 FEH CD-ROM v3.0 © NERC (CEH). © Crown copyright. © AA. 2009. All rights reserved.

Doc no. 197_08_SD01 Version 2 Last printed 13/08/2015 Page 7 of 17
2 Locations where flood estimates required The table below lists the locations of subject sites. The site codes listed below are used in all subsequent tables to save space.
2.1 Summary of subject sites
Site code
Watercourse Site Easting Northing AREA on FEH CD-
ROM (km2)
Revised AREA if altered
MPS Middleton Stop Drain
Upstream model extent. 566850 317800 13.77
PP Pierrepoint drain
Upstream model extent. 565650 317600 1.58
Reasons for choosing above locations
Flood estimation points located at model extent
2.2 Important catchment descriptors at each subject site (incorporating any changes made) Site code
FARL PROPWET BFIHOST DPLBAR (km)
DPSBAR (m/km)
SAAR (mm)
SPRHOST URBEXT FPEXT
MPS 0.983 0.23 0.74 3.53 14.2 635 24.79 0.0165 0.24 PP 1 0.23 0.735 1.31 11.6 620 22.66 0.1016 0.23

Doc no. 197_08_SD01 Version 2 Last printed 13/08/2015 Page 8 of 17
2.3 Checking catchment descriptors
Record how catchment boundary was checked and describe any changes (refer to maps if needed)
The catchment boundaries were checked using LiDAR data and topographical survey and the FEH CD-ROM. For the Middleton Stop Drain the catchment boundaries from the different sources were matching. However the selection of the boundaries for the Pierrepoint drain catchment was a bit arbitrary. According to the FEH CD ROM the point where the drain starts in the TuFlow model is actually on a tributary to the Middleton Stop drain and the Pierrepoint drain starts a bit further to the west (the green point) with a very small catchment area contributing to the start of the drain. For the purpose of this assessment we have assumed that the FEH is out of date and that the Pierrepoint drain is artificially extended further east with a network of drains, as shown in the DRN. Therefore the inflow node location was selected as shown in the figure below (the red node) with delineated catchments area.
Record how other catchment descriptors (especially soils) were checked and describe any changes. Include before/after table if necessary.
Catchment descriptors for the flow nodes were sensibility checked against soils and geology maps and DTM data. No adjustments to the catchment descriptors were made.
Source of URBEXT URBEXT1990 / URBEXT2000 - FEH CD-ROM Method for updating of URBEXT
CPRE formula from FEH Volume 4 / CPRE formula from 2006 CEH report on URBEXT2000 – Technical Report FD1919/TR

Doc no. 197_08_SD01 Version 2 Last printed 13/08/2015 Page 9 of 17
3 Statistical method
3.1 Search for donor sites for QMED (if applicable)
Comment on potential donor sites Mention: Number of potential donor sites available Distances from subject site Similarity in terms of AREA, BFIHOST,
FARL and other catchment descriptors Quality of flood peak data Include a map if necessary. Note that donor catchments should usually be rural.
As stated in Section 1.8 above there do not appear to be any suitable local donors that could have been used for this study. The catchments for the Middleton Stop Drain and Pierrepoint Drain are relatively small and situated immediately to the south of the River Gaywood catchment. Therefore, for consistency with the rivers in the north of the catchment, the same approach which was applied for River Gaywood flow nodes has been used for Middleton Stop Drain and Pierrepoint Drain.
3.2 Donor sites chosen and QMED adjustment factors
NRFA no.
Reasons for choosing or rejecting
Method (AM or POT)
Adjust-ment for climatic variation?
QMED from flow data (A)
QMED from catchment descriptors (B)
Adjust-ment ratio (A/B)
33077 Sugar Fen GS used in Gaywood River flow derivation. In this case the estimates are presented for comparison purpose only.
0.71 1.36
Which version of the urban adjustment was used for QMED at donor sites, and why? Note: The guidelines recommend great caution in urban adjustment of QMED on catchments that are also highly permeable (BFIHOST>0.8).
WINFAP-FEH v3.0.003 / Kjeldsen (2010) / other (delete as applicable)
3.3 Overview of estimation of QMED at each subject site
Site code
Met
hod Initial
estimate of QMED
(m3/s)
Data transfer
Final estimate of
QMED (m3/s)
NRFA numbers
for donor sites used
(see 3.3)
Distance between centroids
dij (km)
Power term, a
Moderated QMED
adjustment factor, (A/B)a
If more than one
donor
Wei
ght
Wei
ghte
d av
erag
e ad
just
men
t fac
tor
MSP Statistical
0.71 0.71
PP Statistical
0.11 0.11
Are the values of QMED consistent, for example at successive points along the watercourse and at confluences?
Which version of the urban adjustment was used for QMED, and why?

Doc no. 197_08_SD01 Version 2 Last printed 13/08/2015 Page 10 of 17
Site code
Met
hod Initial
estimate of QMED
(m3/s)
Data transfer
Final estimate of
QMED (m3/s)
NRFA numbers
for donor sites used
(see 3.3)
Distance between centroids
dij (km)
Power term, a
Moderated QMED
adjustment factor, (A/B)a
If more than one
donor
Wei
ght
Wei
ghte
d av
erag
e ad
just
men
t fac
tor
Notes Methods: AM – Annual maxima; POT – Peaks over threshold; DT – Data transfer; CD – Catchment descriptors alone. When QMED is estimated from POT data, it should also be adjusted for climatic variation. Details should be added. When QMED is estimated from catchment descriptors, the revised 2008 equation from Science Report SC050050Error! Bookmark not defined. should be used. If the original FEH equation has been used, say so and give the reason why. The guidelines recommend great caution in urban adjustment of QMED on catchments that are also highly permeable (BFIHOST>0.8). The adjustment method used in WINFAP-FEH v3.0.003 is likely to overestimate adjustment factors for such catchments. In this case the only reliable flood estimates are likely to be derived from local flow data. The data transfer procedure is from Science Report SC050050. The QMED adjustment factor A/B for each donor site is given in Table 3.3. This is moderated using the power term, a, which is a function of the distance between the centroids of the subject catchment and the donor catchment. The final estimate of QMED is (A/B)a times the initial estimate from catchment descriptors. If more than one donor has been used, use multiple rows for the site and give the weights used in the averaging. Record the weighted average adjustment factor in the penultimate column.
3.4 Derivation of pooling groups
The composition of the pooling groups is given in the Annex. Several subject sites may use the same pooling group.
Name of group
Site code from whose descriptors group was
derived
Subject site
treated as gauged? (enhanced single site analysis)
Changes made to default pooling group, with reasons
Note also any sites that were investigated but retained in the group.
Weighted average L-
moments, L-CV and L-skew,
(before urban adjustment)
Notes Pooling groups were derived using the revised procedures from Science Report SC050050 (2008). Amend if not applicable. The weighted average L-moments, before urban adjustment, can be found at the bottom of the Pooling-group details window in WINFAP-FEH.
3.5 Derivation of flood growth curves at subject sites
Site code
Method (SS, P, ESS, J)
If P, ESS or J, name of pooling group (3.4)
Distribution used and reason
for choice
Note any urban
adjustment or permeable adjustment
Parameters of distribution
(location, scale and shape) after
adjustments
Growth factor for 100-year
return period

Doc no. 197_08_SD01 Version 2 Last printed 13/08/2015 Page 11 of 17
Site code
Method (SS, P, ESS, J)
If P, ESS or J, name of pooling group (3.4)
Distribution used and reason
for choice
Note any urban
adjustment or permeable adjustment
Parameters of distribution
(location, scale and shape) after
adjustments
Growth factor for 100-year
return period
Notes Methods: SS – Single site; P – Pooled; ESS – Enhanced single site; J – Joint analysis A pooling group (or ESS analysis) derived at one gauge can be applied to estimate growth curves at a number of ungauged sites. Each site may have a different urban adjustment, and therefore different growth curve parameters. Urban adjustments to growth curves should use the version 3 option in WINFAP-FEH: Kjeldsen (2010). Growth curves were derived using the revised procedures from Science Report SC050050 (2008). Amend if not applicable.
Any relevant frequency plots from WINFAP-FEH, particularly showing any comparisons between single-site and pooled growth curves (including flood peak data on the plot), should be shown here or in a project report.
3.6 Flood estimates from the statistical method
Site code
Flood peak (m3/s) for the following return periods (in years) 2

Doc no. 197_08_SD01 Version 2 Last printed 13/08/2015 Page 12 of 17
4 Revitalised flood hydrograph (ReFH) method
4.1 Parameters for ReFH model
Note: If parameters are estimated from catchment descriptors, they are easily reproducible so it is not essential to enter them in the table.
Site code
Method: OPT: Optimisation BR: Baseflow recession fitting CD: Catchment descriptors DT: Data transfer (give details)
Tp (hours) Time to peak
Cmax (mm) Maximum storage capacity
BL (hours) Baseflow lag
BR Baseflow recharge
Brief description of any flood event analysis carried out (further details should be given below or in a project report)
4.2 Design events for ReFH method
Site code
Urban or rural
Season of design event (summer or
winter)
Storm duration (hours)
Storm area for ARF (if not catchment area)
Are the storm durations likely to be changed in the next stage of the study, e.g. by optimisation within a hydraulic model?
4.3 Flood estimates from the ReFH method
Site code
Flood peak (m3/s) or volumes (m3) for the following return periods (in years) 2

Doc no. 197_08_SD01 Version 2 Last printed 13/08/2015 Page 13 of 17
5 FEH rainfall-runoff method
5.1 Parameters for FEH rainfall-runoff model Methods: FEA : Flood event analysis
LAG : Catchment lag DT : Catchment descriptors with data transfer from donor catchment CD : Catchment descriptors alone BFI : SPR derived from baseflow index calculated from flow data
Site code Rural (R) or urban
(U)
Tp(0): method
Tp(0): value
(hours)
SPR: method
SPR: value (%)
BF: method
BF: value (m3/s)
If DT, numbers of donor sites used
(see Section 5.2) and reasons
Note: The FEH rainfall-runoff method was used to generate hydrographs using catchment descriptors.
The same scaling factors used in the Gaywood River flow estimation (2014, PBA) were applied as follows: -Baseflow set to the estimated baseflow for 10 year event for each of the catchments. The base flow was estimated in the Gaywood study (Table A7, River Gaywood Flood Modelling report, PBA, 2014) and scaled to reflect the smaller catchments size of Middleton Stop and Pierrepoint catchments. -Quickflow scaled by 0.4, -Unit hydrograph TB scaled by 1.5 (derived iteratively in the Gaywood study, to give a longer falling limb similar to the observed data for Sugar Fan)
5.2 Donor sites for FEH rainfall-runoff parameters
No.
Watercourse Station Tp(0) from
data (A)
Tp(0) from
CDs (B)
Adjustment ratio for
Tp(0) (A/B)
SPR from data (C)
SPR from CDs (D)
Adjust-ment
ratio for SPR (C/D)
1 2
5.3 Inputs to and outputs from FEH rainfall-runoff model
Site code
Storm duration (hours)
Storm area for ARF (if
not catchment
area)
Flood peaks (m3/s) for the following return periods (in years)
100yr
MPS 3.5 CA 1.33
16 1.78
22.5 1.82
26 1.81
PP 3.5 CA 0.37
16 0.40
22.5 0.37
26 0.36

Doc no. 197_08_SD01 Version 2 Last printed 13/08/2015 Page 14 of 17
Site code
Storm duration (hours)
Storm area for ARF (if
not catchment
area)
Flood peaks (m3/s) for the following return periods (in years)
100yr
Are the storm durations likely to be changed in the next stage of the study, e.g. by optimisation within a hydraulic model?

Doc no. 197_08_SD01 Version 2 Last printed 13/08/2015 Page 15 of 17
6 Discussion and summary of results
6.1 Comparison of results from different methods
This table compares peak flows from various methods with those from the FEH Statistical method at example sites for two key return periods. Blank cells indicate that results for a particular site were not calculated using that method.
Site code
Ratio of peak flow to FEH Statistical peak Return period 2 years Return period 100 years
ReFH Other method
Other method ReFH Other
method Other
method
6.2 Final choice of method
Choice of method and reasons – include reference to type of study, nature of catchment and type of data available.
The FEH method has been chosen to provide the best estimate of peak flows and the generate hydrographs. This was the method applied for the flow estimation of River Gaywood and based on the close location and similarity of the catchments, and for consistency, the same method was applied for the flows generation of the Middleton Stop and Pierpont Drains. Tp and SPR remained unchanged from catchment descriptor values. BF has been altered based on the analysis carried out in the previous (River Gaywood) study. The calculations for the scaling factors are in the “Critical_Duration_FEH_ReFH.xls” (P:\environment\ZWET\CS072082_KingsLynnOrdinaryWatercourses\Hydrology). It is worth noting that the Gaywood River upstream catchment is permeable and the MSP and PD are less permeable with SPR values greater than 20%. A quick test as part of ths review identified that there is little difference in the final flows if a BF calculated by FEH catchment descriptors is used. Therefore is it reasonable to use the scaled BFs as these have been inferred from local data.
6.3 Assumptions, limitations and uncertainty
List the main assumptions made (specific to this study)
Usual FEH assumptions. The same factors for adjustment of the hydrograph shape as described in the Gaywood modelling report were applied. The adjustments are as follows: -Baseflow set to the estimated baseflow for 10 year event for each of the catchments. The base flow was estimated in the Gaywood study and we scaled it to reflect the smaller catchments size. -Quick flow scaled by 0.4, -Unit hydrograph TB scaled by 1.5 (derived iteratively in the Gaywood study, to give a longer falling limb similar to the observed data for Sugar Fan)
Discuss any particular limitations, e.g. applying methods outside the range of catchment types or return periods for which they were developed
No directly observed flow data or suitable donor station was available. Therefore the same approach and the scaling factors derived for the River Gaywood flow estimation were used.
Give what information you can on uncertainty in the results – e.g.
No data was available for flow calibration.

Doc no. 197_08_SD01 Version 2 Last printed 13/08/2015 Page 16 of 17
confidence limits for the QMED estimates using FEH 3 12.5 or the factorial standard error from Science Report SC050050 (2008).
Comment on the suitability of the results for future studies, e.g. at nearby locations or for different purposes.
Give any other comments on the study, for example suggestions for additional work.
6.4 Checks
Are the results consistent, for example at confluences?
What do the results imply regarding the return periods of floods during the period of record?
The 100yr return period flow appears reasonable for the respective catchments size.
What is the 100-year growth factor? Is this realistic? (The guidance suggests a typical range of 2.1 to 4.0)
If 1000-year flows have been derived, what is the range of ratios for 1000-year flow over 100-year flow?
What range of specific runoffs (l/s/ha) do the results equate to? Are there any inconsistencies?
How do the results compare with those of other studies? Explain any differences and conclude which results should be preferred.
Are the results compatible with the longer-term flood history?
Describe any other checks on the results
6.5 Final results
Site code
Flood peak (m3/s) for the following return periods (in years)
10 20 40 100 200
MS 1.05 1.28 1.52 1.88 2.22 PP 0.20 0.24 0.30 0.37 0.43
If flood hydrographs are needed for the next stage of the study, where are they provided? (e.g. give filename of spreadsheet, name of ISIS model, or reference to table below)
P:\environment\ZWET\CS072082_KingsLynnOrdinaryWatercourses\Hydrology\IED_South Catchment\FEH\MS\Other hydrographs; P:\environment\ZWET\CS072082_KingsLynnOrdinaryWatercourses\Hydrology\IED_South Catchment\FEH\PP\Other return periods

Doc no. 197_08_SD01 Version 2 Last printed 13/08/2015 Page 17 of 17
7 Annex - supporting information
7.1 Pooling group composition
7.2 Additional supporting information

Commercial in Confidence
Capita Property and Infrastructure Ltd www.capita.co.uk