this file is part of the following referenceresearchonline.jcu.edu.au/5138/2/02whole.pdf ·...
TRANSCRIPT

This file is part of the following reference:
Abell-Davis, Sandra (2008) Tropical hypogeous fungal sporocarp distribution in time and space. Implications for an endangered specialist, Mycophagous Marsupial, Bettongia
tropica. PhD thesis, James Cook University.
Access to this file is available from:
http://eprints.jcu.edu.au/5318

Tropical Hypogeous Fungal Sporocarp
Distribution in Time and Space.
Implications for an Endangered Specialist
Mycophagous Marsupial, Bettongia tropica.
Thesis submitted by
Sandra Eltheoan Abell-Davis B.Sc. (Hons) JCU Qld
in November 2008
For the degree of Doctor of Philosophy
in the School of Marine and Tropical Biology
James Cook University

i
STATEMENT OF ACCESS
I, the undersigned, author of this work, understand that James Cook University will make
this thesis available for use within the University Library and, via the Australian Digital
Theses network, for use elsewhere.
I understand that, as an unpublished work, a thesis has significant protection under the
Copyright Act and I do not wish to place any further restriction on access to this work.
................................... ....................................
Signature Date

ii
DECLARATION
I declare that this thesis is my own work and has not been submitted in any form for
another degree or diploma at any university or other institution of tertiary education.
Information derived from the published or unpublished work of others has been
acknowledged in the text and a list of references is given.
................................... ....................................
Signature Date

iii
ELECTRONIC COPY DECLARATION
I, the undersigned, the author of this work, declare that the electronic copy of this thesis
provided to the James Cook University Library is an accurate copy of the print thesis
submitted, within the limits of the technology available.
................................... ....................................
Signature Date

iv
ACKNOWLEDGEMENTS
I would first like to thank Earl Davis for his faithful trust in my ability to do
whatever I set my mind to. Everything that I have achieved would not have been possible
without this loyal support. Not to mention his efforts as THE champion truffler (yes you
still collected the most truffles in one patch!). Together we can get through anything that
life throws at us.
I am also very grateful to my family, Donny who we sadly miss, Vanessa and
Anthony, my Mum, Dad, brothers: Rodney, Mick and Quinten, sister Marianne, along
with their wonderful families, and also my friends Megan and Paul for the patient support
and encouragement over the years.
My PhD journey would not have been as rewarding without fellow students/
colleagues and the best of friends sharing every step of the way; Dr Anna Koetz, Romina
Rader, Kylie Brown, Jenni Paul, Kylie Anderson, Leanne Shillitoe, Dr Barbara Paulus,
Sue Mathams, Carol Devney, Dr Katie Irvine, Sarah Kerr (artist extraordinaire!), Dr
Petrina Johnson and Dr Luke Rapley. Thanks for the kind words of encouragement
during the difficult times and for being there to celebrate my successes.
I would like to thank Dr Will Edwards, Dr Peter Franks, Prof Chris Johnson and
Dr Darrell Kemp for their professional assistance with data analysis, general
encouragement and good advice. Thanks also to the SMTB undergraduate students that I
hope I have passed on my love of biology to, and also for reminding me of how far I
have traveled.

v
The home stretch to the completion of my thesis also would not have been nearly as
interesting without mentoring from my cheerleader (and conscience) Prof David Largent.
I have been fortunate to have the guidance of the perfect complement of
supervisors. Thanks to Dr Ceridwen Pearce for giving me the idea for the project, for
help with my pilot study field work (sorry I got you stung!) and for opening doors for me
within the amazing world of mycology. Dr Bradley Congdon’s ability to put everything
in perspective, focus my thinking and writing has been invaluable. I can only hope to be
a fraction of the incredible teacher and ecologist that he is. Prof Paul Gadek has been
supporting me from the first day I enquired about completing my undergraduate degree.
Thanks for believing in me and pushing me to continue with my studies further than I
ever imagined I could.
Special thanks for teaching me how to truffle and for the expert taxonomic
assistance and professional advice from Dr. Teresa Lebel of the Royal Botanic Gardens,
Melbourne, Australia. Thanks also for the extra guidance with my truffle identifications
from Prof James Trappe of the Department of Forest Science Oregon State University,
Corvallis, USA and for the hospitality of Judith Curnow and Heino Lepp during my stay
at the Australian National Herbarium.
This project was undertaken in collaboration with the Environmental Protection
Agency Threatened Species Unit and could not have been completed without assistance
from Mr Peter Latch, Dr John Winter and Dr Scott Burnett. Bettong group discussions
held with Peter Latch, Sue Mathams and Brooke Bateman were simply inspiring.

vi
Last but not least, the efforts of my many truffle hunting volunteers were greatly
appreciated; Earl Davis, Anna Koetz, Sue Mathams, Romina Rader, Patricia Voigt,
Zsuzsi Hegedus, Dan Murphy, Flo duc-Goninaz, Anne-marie Mckinnon, Asami
Sakamoto, Barbara Paulus, Carissa Fairweather, Jenni Paul, Layla Wenitong, Lisa Derby,
Lynne Jones, Silvana Spena, Zoe Baron, Sarah Walker, Bonnie Tilse, Greta Kading,
Margaret Barker, Sapphire McMullan-Fisher, Brooke Bateman, Kelly Kong, Nina
Babiuk, Martina Koch, Peter Siemsen, Amber Grimley, Sophia Carroll, Sue Foley,
Denise Maltomini and Pamela Ortega.
Funding was provided by the Rainforest Cooperative Research Centre,
Queensland Parks and Wildlife Service and the School of Marine and Tropical Biology,
James Cook University, Australia. Scientific Purposes and Collection permits
(WISP01562903; WITK01565603) were issued by the Environmental Protection Agency
and permission to collect (ATH 06/003; 05/005; 03/043) in State forest by the
Queensland Parks and Wildlife Service. This project complied with all Australian laws
and standards.

vii

viii
TABLE OF CONTENTS
STATEMENT OF ACCESS .............................................................................................................................. I DECLARATION.................................................................................................................................................II ELECTRONIC COPY DECLARATION..................................................................................................... III ACKNOWLEDGEMENTS............................................................................................................................. IV TABLE OF CONTENTS .............................................................................................................................. VIII LIST OF TABLES ..............................................................................................................................................X LIST OF FIGURES .......................................................................................................................................... XI LIST OF PUBLICATIONS............................................................................................................................XV THESIS ABSTRACT .................................................................................................................................... XVI CHAPTER ONE: THESIS RATIONALE.......................................................................................................1
1.1 ECOLOGICAL CONTEXT ..........................................................................................................................1 1.2 AIM AND STRUCTURE OF THE THESIS.....................................................................................................6
CHAPTER TWO: SEASONAL RESOURCE AVAILABILITY AND USE BY AN ENDANGERED TROPICAL MYCOPHAGOUS MARSUPIAL..............................................................................................8
2.1 INTRODUCTION ........................................................................................................................................8 2.2 METHODS ...............................................................................................................................................11
2.2.1 Study sites ......................................................................................................................................11 2.2.2 Rainfall data..................................................................................................................................12 2.2.3 Hypogeous fungi sampling ...........................................................................................................13 2.2.4 Cockatoo grass observations .......................................................................................................15 2.2.5 Data analysis.................................................................................................................................15
2.3 RESULTS.................................................................................................................................................16 2.3.1 Rainfall patterns............................................................................................................................16 2.3.2 Resource quantity .........................................................................................................................17 2.3.3 Resource biomass .........................................................................................................................18 2.3.4 Resource availability and use ......................................................................................................19
2.4 DISCUSSION............................................................................................................................................21 2.4.1 Seasonality of tropical hypogeous fungi .....................................................................................21 2.4.2 Substitutable resource ..................................................................................................................22 2.4.3 Habitat preference of B. tropica ..................................................................................................23
CHAPTER THREE: REPRODUCTIVE CUES AND STRATEGIES OF TROPICAL HYPOGEOUS FUNGI..................................................................................................................................................................26
3.1 INTRODUCTION ......................................................................................................................................26 3.2 METHODS ...............................................................................................................................................29
3.2.1 Sample Design...............................................................................................................................29 3.2.2 Environmental data ......................................................................................................................30 3.2.3 Assessment of fungal diversity .....................................................................................................30 3.2.4 Data Analysis ................................................................................................................................31
3.3 RESULTS.................................................................................................................................................34 3.3.1 Precipitation and abundance .......................................................................................................34 3.3.2 Precipitation and biomass............................................................................................................36 3.3.3 Precipitation and richness ...........................................................................................................37 3.3.4 Taxonomic assemblage.................................................................................................................38
3.4 DISCUSSION............................................................................................................................................43

ix
CHAPTER FOUR: NUTRIENT LEVELS DETERMINE THE SPATIAL DISTRIBUTION OF TROPICAL HYPOGEOUS FUNGAL SPOROCARPS .............................................................................48
4.1 INTRODUCTION ......................................................................................................................................48 4.2 METHODS ...............................................................................................................................................51
4.2.1 Sample Design...............................................................................................................................51 4.2.2 Assessment of fungal diversity .....................................................................................................53 4.2.3 Light/ Temperature .......................................................................................................................54 4.2.4 Soil analysis ..................................................................................................................................54 4.2.5 Data analysis.................................................................................................................................55
4.3 RESULTS................................................................................................................................................56 4.3.1 Fungal species richness................................................................................................................56 4.3.2 Fungal abundance and biomass ..................................................................................................58 4.3.3 Moisture.........................................................................................................................................60 4.3.4 Light/ Temperature .......................................................................................................................61 4.3.5 Nutrients ........................................................................................................................................61
4.4 DISCUSSION............................................................................................................................................61 CHAPTER FIVE: MICRO-SPATIAL DISTRIBUTION OF TROPICAL ECTOMYCORRHIZAL HYPOGEOUS FUNGI......................................................................................................................................68
5.1 INTRODUCTION ......................................................................................................................................68 5.2 METHODS ...............................................................................................................................................71
5.2.1 Data Analysis ................................................................................................................................72 5.3 RESULTS.................................................................................................................................................74
5.3.1 Soil phosphorous regressions ......................................................................................................74 5.3.2 Principal components interpretation...........................................................................................76 5.3.3 Statistical Modelling.....................................................................................................................77
5.4 DISCUSSION............................................................................................................................................82 CHAPTER SIX: THESIS SYNTHESIS.........................................................................................................86
6.1 DIVERSITY OF HYPOGEOUS FUNGI ........................................................................................................86 6.2 TEMPORAL DISTRIBUTION OF SPOROCARPS..........................................................................................87 6.3 SPATIAL DISTRIBUTION OF SPOROCARPS ..............................................................................................88 6.4 IMPLICATIONS AND RECOMMENDATIONS FOR B. TROPICA...................................................................90 6.5 FUTURE RESEARCH................................................................................................................................95
6.5.1 Hypogeous fungi and their plant hosts........................................................................................95 6.5.2 The bettongs ..................................................................................................................................96
REFERENCES...................................................................................................................................................97 APPENDIX ONE: KEY TO THE GENERA OF HYPOGEOUS FUNGI SURVEYED IN FAR NORTH QUEENSLAND, AUSTRALIA .....................................................................................................114 APPENDIX TWO: KEY TO THE SPECIES OF HYPOGEOUS FUNGI SURVEYED.....................118

x
LIST OF TABLES
Table 3-1: Diversity of hypogeous sporocarps in the dry (early and late pooled) and
wet (early and late pooled) seasons ........................................................ 38
Table 3-2: The total list of species surveyed, indicating the genera and species unique
(u) or shared (s) between the wet and dry seasons .................................. 39
Table 4-1: The total list of species that were surveyed in three vegetation types: wet
sclerophyll forest (WSF), Allocasuarina forest (AF) and Eucalyptus
Woodland (EW)..................................................................................... 55
Table 5-1: Principal component scores of the environmental variables measured at 18
sites over seven surveys (12 in one survey) ............................................ 75
Table 5-2: Plausible models generated to explain the distribution of hypogeous fungi
using the ITMC approach for a) number of genera and b) number of
species, based on 23 microhabitat variables that were summarised into five
principal component independent variables (PC1–5). ............................. 77

xi
LIST OF FIGURES
Figure 2-1: The monthly rainfall measured at Kairi weather station for two study periods,
black columns 2004 to 2005 (this study), white columns 1995 to 1996
(Vernes et al., 2001) superimposed with the expected () seasonal pattern of
rainfall (74-year monthly means) ............................................................... 13
Figure 2-2: The mean (± 2 S.E.) number of sporocarps sampled in the early dry, late dry,
early wet and late wet seasons 2004/5. ....................................................... 18
Figure 2-3: The mean dry weight (±1SE) of sporocarps for the three vegetation types; a)
wet sclerophyll, b) Allocasuarina forest and c) Eucalyptus woodland
sampled in the early and late wet, early and late dry seasons. ..................... 19
Figure 2-4: The number of sporocarps of hypogeous fungi (grey columns) and chewed
grass pellets of Alloteropsis semialata (♦) sampled per hectare in four
seasons, 2004/2005 .................................................................................... 20
Figure 3-1: The monthly rainfall (black columns) measured at Kairi weather station for
the study period (2004 – 2006), superimposed with the expected (◊) seasonal
pattern of rainfall (74-year monthly means) ............................................... 29

xii
Figure 3-2: The mean (±1SE) sporocarp abundance (white columns) and biomass (g)
(grey columns) surveyed in the Early-Wet, Late-Wet, Early-Dry and Late-
Dry seasons 2004 to 2006 .......................................................................... 34
Figure 3-3: The positive linear relationship between the mean sporocarp abundance and
precipitation two months prior to the survey with the May 2006 (empty
circle) outlier excluded from the regression................................................ 35
Figure 3-4: The positive logarithmic relationship between the mean sporocarp biomass
and precipitation two months prior............................................................. 36
Figure 3-5: The positive logarithmic relationship between the number of hypogeous
fungal species surveyed and precipitation two months prior ....................... 37
Figure 3-6: The change in biomass and abundance (±1SE) between normal and extreme
rainfall showing the significant centromeres; () represents eight species that
decreased in both abundance and biomass, () three species that increased
in abundance and biomass and () three species that were relatively stable
and increased only slightly in abundance and biomass ............................... 40
xiii
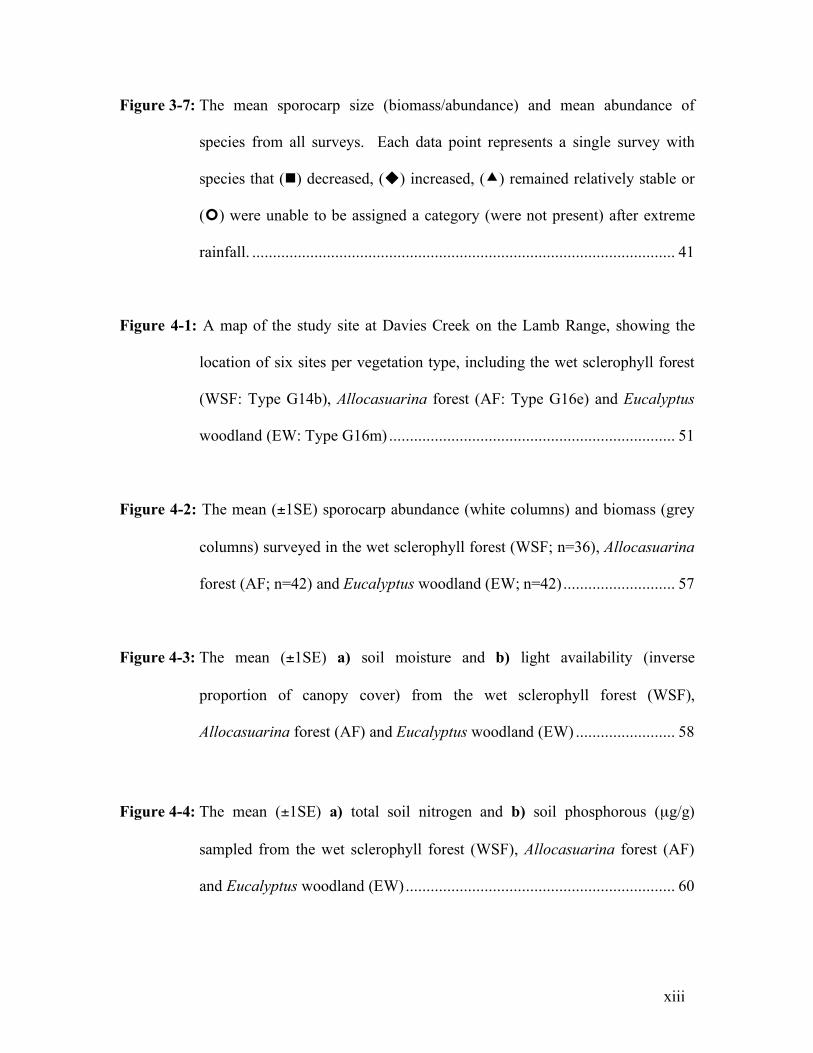
Figure 3-7: The mean sporocarp size (biomass/abundance) and mean abundance of
species from all surveys. Each data point represents a single survey with
species that () decreased, () increased, () remained relatively stable or
() were unable to be assigned a category (were not present) after extreme
rainfall. ...................................................................................................... 41
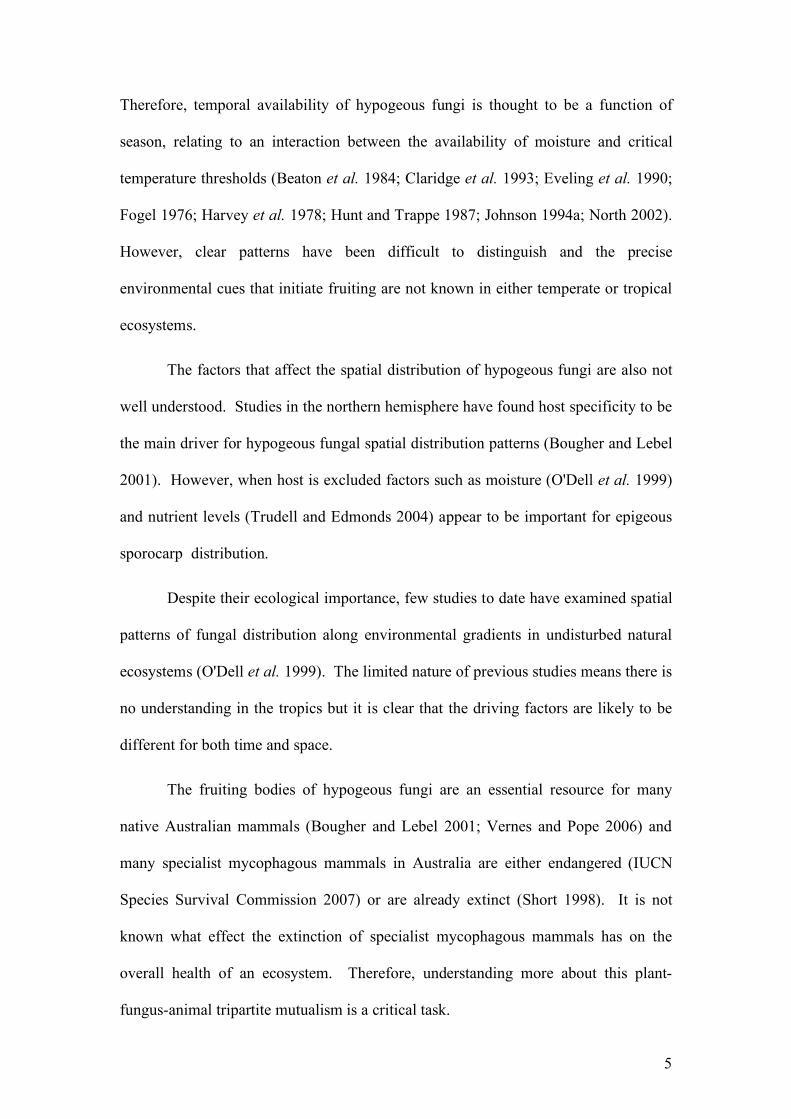
Figure 4-1: A map of the study site at Davies Creek on the Lamb Range, showing the
location of six sites per vegetation type, including the wet sclerophyll forest
(WSF: Type G14b), Allocasuarina forest (AF: Type G16e) and Eucalyptus
woodland (EW: Type G16m) ..................................................................... 51
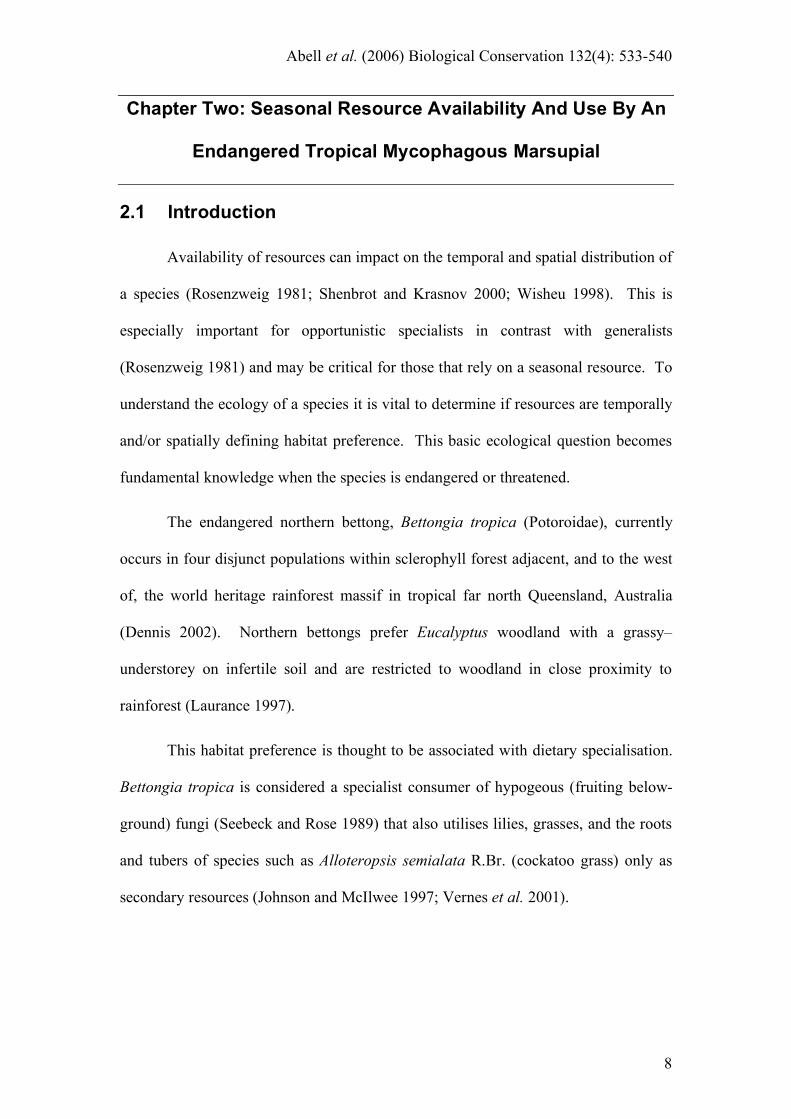
Figure 4-2: The mean (±1SE) sporocarp abundance (white columns) and biomass (grey
columns) surveyed in the wet sclerophyll forest (WSF; n=36), Allocasuarina
forest (AF; n=42) and Eucalyptus woodland (EW; n=42) ........................... 57
Figure 4-3: The mean (±1SE) a) soil moisture and b) light availability (inverse
proportion of canopy cover) from the wet sclerophyll forest (WSF),
Allocasuarina forest (AF) and Eucalyptus woodland (EW) ........................ 58
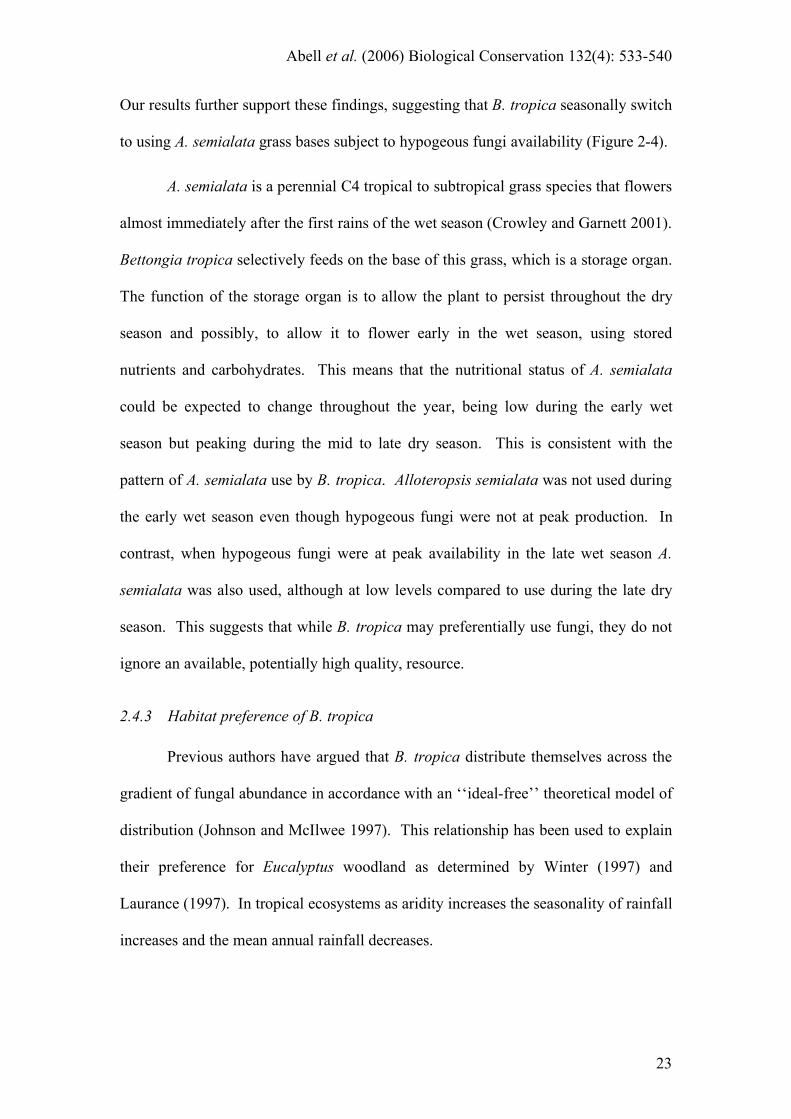
Figure 4-4: The mean (±1SE) a) total soil nitrogen and b) soil phosphorous (µg/g)
sampled from the wet sclerophyll forest (WSF), Allocasuarina forest (AF)
and Eucalyptus woodland (EW)................................................................. 60

xiv
Figure 5-1: Inverse exponential relationships between a) mean sporocarp abundance, b)
mean sporocarp biomass, c) mean number of genera and d) species with
mean soil phosphorous per site................................................................... 73
Figure 5-2: The positive correlation between vegetation type PC1 and the mean number
of genera. The number of genera increase with the number of Allocasuarina
and decrease with the number of Eucalyptus stems .................................... 78
Figure 5-3: The interactive effect of proximity to rainforest PC4 and vegetation type PC1
on the mean number of species. Mean number of species increases with the
number of Allocasuarina stems and an increase in altitude......................... 79

xv
LIST OF PUBLICATIONS
Thesis Chapter Two Abell, S. E., P. A. Gadek, C. A. Pearce, and B. C. Congdon. 2006. Seasonal resource
availability and use by an endangered tropical mycophagous marsupial. Biological Conservation 132:533-540.
Thesis Chapter Three Abell, S. E., P. A. Gadek, C. A. Pearce, and B. Congdon. 2008. Reproductive cues and
reproductive strategies of tropical hypogeous fungi. Oecologia (Berlin) in review. Thesis Chapter Four Abell, S. E., P. A. Gadek, C. A. Pearce, and B. Congdon. 2008. Nutrient levels determine
the spatial distribution of hypogeous fungal sporocarps. Ecosystems in review. Thesis Chapter Five Abell, S.E., Gadek, P.A., Congdon, B., Pearce, C.A., 2009. Micro-spatial distribution of
ectomycorrhizal fungi in tropical ecotonal sclerophyll forest. Mycologia. manuscript in final preparation.
Other publications in preparation Abell, S.E., Gadek, P.A., Trappe, J.M., Lebel, T., 2009. New hypogeous fungal species
descriptions and records. Aust. J. Bot. manuscripts in preparation. Barker, M., Gadek, P.A., Congdon, B. and Abell, S.E., 2009. Individual body condition
response to seasonal availability of resources by an endangered tropical fungivore. Wildlife Research. manuscript in final preparation.
Mathams, S., Abell, S.E., Latch, P. and Winter, J., 2009. Potential reintroduction sites for
the endangered northern bettong, Bettongia tropica, determined by fungal and plant resource availability. Wildlife Research. manuscript in final preparation.

xvi
THESIS ABSTRACT
This thesis examines the relative importance of abiotic and biotic factors in
determining the temporal and spatial distribution of tropical hypogeous fungal sporocarps
along an altitude gradient of ecotonal sclerophyll forest. The implications of the fungal
distribution on the habitat restriction within this ecotonal forest for an endangered
specialist mycophagous marsupial, Bettongia tropica Wakefield, were subsequently
investigated.
Fungal availability was quantified in the Early-Wet, Late-Wet, Early-Dry and
Late-dry seasons within known B. tropica habitat in seven surveys over a period of two
years. A total of eighteen sites within three vegetation types, including wet sclerophyll
forest, Allocasuarina forest and Eucalyptus woodland, were examined using the time
standardised raking method, in Far North Queensland, Australia.
Bettongia tropica is thought to be restricted to habitats where seasonal availability
of hypogeous fungi, their principal food resource, remains high. In the first year of
sampling a relationship was found between precipitation and fungal availability. The
abundance of hypogeous fungi was significantly lower in the late dry season. Fungal
availability correlated strongly with the seasonal rainfall pattern determined from 74-year
monthly means. Alloteropsis semialata R.Br. (cockatoo grass) use by bettongs increased
significantly during the period of low fungal availability. Bettongia tropica appear to be
restricted to habitats where seasonal availability of hypogeous fungi, in synchrony with
the availability of critical grass resources, remains high.

xvii
Temporal fruiting and availability of ectomycorrhizal hypogeous fungal species
has previously been linked with both temperature and moisture (season) in temperate
northern and southern hemisphere ecosystems. In contrast, the first year of data
suggested that precipitation may be the sole factor influencing fruiting and diversity in
tropical ecosystems. This hypothesis was tested using the data from all seven surveys.
Season or temperature did not appear to be associated with fruiting of tropical hypogeous
fungi. Instead, highly significant correlations between precipitation and abundance as
well as biomass of sporocarps were detected. Precipitation also correlated with species
richness and significantly influenced hypogeous fungal taxonomic assemblage.
Availability of moisture appears to be the sole factor influencing the temporal distribution
of fruiting and diversity of hypogeous fungi in this tropical ecosystem.
Spatial patterns of animal and plant diversity are used to infer mechanisms
underlying community composition. Species distributions, associated with latitude and
altitude gradients, are often positively correlated with moisture availability. Fungal
taxonomic assemblage did not differ between the three contiguous vegetation types.
Counter-intuitively, less fungal productivity occurred in one of the wettest forest types;
wet sclerophyll forest. Higher sporocarp abundance and biomass were found in the
Allocasuarina forest that had equivalent soil moisture levels. Fungal abundance and
biomass appeared to be reduced by high inorganic nitrogen and phosphorous in the wet
sclerophyll forest, while the effect of high nitrogen was counteracted by low phosphorous
in the Allocasuarina forest.

xviii
The effects of soil phosphorous as well as other environmental variables on
hypogeous fungal availability and richness were examined further at the micro-spatial
scale of site. As predicted, negative correlations between phosphorous and fungal
availability were also observed at this finer scale. However, phosphorous levels could
not entirely explain the spatial patterns of fungal richness observed. Positive correlations
were found for the mean number of Allocasuarina stems with the number of fungal
genera as well as species. The most plausible explanation for the mean number of fungal
species was an interactive effect between the number of Allocasuarina stems and a
positive correlation with altitude. As well as strengthening the evidence that phosphorous
levels affect the availability of hypogeous fungi, analysis at the micro-spatial scale
allowed new information about fungal richness to be uncovered. An increase in host
monodominance appears to increase fungal richness within this ecotonal sclerophyll
forest.
These findings help to explain the habitat restriction of B. tropica within wetter
sclerophyll habitats, increasing the temporal availability of their principal resource
hypogeous fungi. The spatial distribution of fungal, as well as other important food
resources, also explains B. tropica spatial habitat restriction within Allocasuarina forest
and Eucalyptus woodland. The habitat restriction of the endangered B. tropica within a
narrow band of ecotonal sclerophyll vegetation along the western margin of Wet Tropical
rainforests in North Queensland Australia, can be attributed to the availability of their
critical food resource hypogeous fungi, in both time and space.

1
Chapter One: Thesis Rationale
1.1 Ecological context
Mutualisms, cooperative interactions between species, are the rule rather than
the exception in nature (Herre et al. 1999). This is true from the cellular to the
ecosystem level (Herre et al. 1999). What we know of as a single organism cannot
exist without the complex interaction of many other species exploiting each other to
the net benefit of all species within the association (Doebeli and Knowlton 1998;
Leigh and Rowell 1995; Maynard Smith and Szathmary 1995; Nowak et al. 1994).
This is also what defines a healthy ecosystem; a complex interaction of many species
exploiting each other to the net benefit of all species.
Understanding how mutualists cooperate not only provides insight into
individual species ecology, but also clarifies how ecosystems function in general.
Unravelling mutualistic relationships is complex, especially when multiple species are
interacting, but being able to do so becomes vitally important when endangered
species are involved. This thesis examines the tripartite mutualism between an
endangered marsupial, Bettongia tropica Wakefield, the fungi that these small
mammals feed upon and the plant hosts of those fungi.
Northern bettongs, B. tropica, are principally mycophagous (fungus eating)
marsupials of the family Potoroidae (Seebeck and Rose 1989). They are listed as
endangered at the Australian State (Nature Conservation Wildlife Regulation 2006)
and Federal government levels (Commonwealth Environment Protection and
Biodiversity Conservation Act 1999).

2
Bettongia tropica also have an international endangered status under the following
IUCN criteria: extent of occurrence estimated to be less than 5000 km2, severely
fragmented or known to exist at no more than five locations, and a decline in area,
extent and/or quality of habitat (IUCN Species Survival Commission 2007).
Current populations of B. tropica persist in a narrow band (<10km) of wet to
moist sclerophyll forest on the western margin of Wet Tropics rainforest in Far North
Queensland, Australia (Vernes and Pope 2001). Disjunct populations occur on the
Lamb and Coane Ranges, as well as on the Mt Windsor and Carbine Tablelands.
Populations at Mt Spurgeon on the Carbine Tablelands (Grant and Naylor 1993), Mt
Windsor (Laurance 1997) and on the Coane Range are very small. A recent study in
2007 failed to trap even one B. tropica individual from the Coane Range population
(Brook Bateman, unpublished data). The Lamb Range is the last stronghold of B.
tropica (Vernes and Pope 2006) with one of the most stable populations on the Lamb
Range at Davies Creek (Vernes and Pope 2006); the location of this study. The
reasons for both historic and current population declines of B. tropica are currently
unknown.
Johnson and McIlwee (1997) studied northern bettongs along a wet to dry
sclerophyll gradient at Davies Creek. They showed that although there was little
difference in the abundance (trap success) of bettongs between wet to medium
sclerophyll forest types, there was a significant decline (50%) in abundance between
medium to dry sclerophyll sites (Johnson and McIlwee 1997). Body condition and
the number of juvenile bettongs within the population remained constant. This
suggests that the factor limiting bettong numbers and distribution is likely to be a
consumptive resource (eg. food), with each population along the wet to dry gradient
being at equilibrium with the availability of this resource (Caughley et al. 1988).

3
Because B. tropica is considered to be a fungal specialist (Seebeck and Rose 1989),
ectomycorrhizal hypogeous (below-ground) fruiting fungi have been assumed to be
this important food source (Johnson and McIlwee 1997).
Colonisation of the roots of plants by fungi results in the formation of
mycorrhiza, literally “fungus roots”. Under ideal environmental conditions this is an
obligate mutualism. The fungus provides the host plant with an otherwise unavailable
supply of nutrients, improves the uptake of water and provides protection from root
pathogens. In return the plant host supplies a rich carbohydrate resource for the
fungus. This mutualism may become a fungal parasitism in unfavourable
environmental conditions, particularly when high nutrients are available (Johnson et
al. 1997). Mycorrhizas are otherwise a relatively stable mutualism (Herre et al. 1999)
that have persisted for as long as plants have inhabited land (Wang and Qiu 2006).
There are different types of mycorrhiza, including arbuscular mycorrhiza
(AM) and ectomycorrhiza (ECM). Ectomycorrhiza appear to have evolved multiple
times (Wang and Qiu 2006) and are characterised as producing a fungal sheath
entirely surrounding the tips of the host root. Ectomycorrhizal fungi either produce
epigeous (above-ground, e.g. mushrooms) or hypogeous (below-ground, e.g. truffles)
macroscopic reproductive structures (sporocarps). While spores from epigeous
sporocarps are generally wind dispersed, hypogeous fungi are mutualistic with
mycophagous animals and so their spores are dispersed via these mammal vectors. A
food reward is provided in exchange for the dispersal of spores that otherwise would
remain enclosed within the sporocarp, buried below the surface of the ground or leaf
litter (Claridge and May 1994).

4
Fungal species that produce hypogeous sporocarps are generally
ectomycorrhizal (Luoma et al. 1991) and are polyphyletic, with representatives in
four out of the five fungal divisions including Zygomycota, Glomeromycota,
Ascomycota and Basidiomycota. Co-evolution of ectomycorrhizas has occurred in
multiple plant and fungal families under the selection of fluctuating environmental
conditions, including both water and nutrient availability (Wang and Qiu 2006).
Selection for ectomycorrhizas have been especially important in regions where
soil fertility has been declining due to extended time periods since renewable
disturbance events (Wang and Qiu 2006). These soil conditions are characteristic of
the ancient weathered soils on the arid Australian continent, where phosphorous
especially is limiting. Similarly, the primary selective pressure driving the evolution
from the epigeous to the hypogeous sporocarp morphology is thought to be the
conservation of water (Albee-Scott 2007; Binder and Bresinsky 2002; Bruns et al.
1989; Thiers 1984).
Worldwide there are an estimated 5400 species of ectomycorrhizal fungi,
including epigeous and hypogeous fruiting taxa (Molina 1992). As a potential
consequence of the arid and low nutrient environment, hypogeous ectomycorrhizal
fungal species are well represented in Australia. The estimated diversity is high (2000
species), as is endemicity (35% genera; 95% species) (Bougher and Lebel 2001).
Current data on what determines the distribution and abundance of hypogeous
fungi comes from northern and southern hemisphere temperate region studies. In
these regions seasonal peaks in production generally occur in both autumn and spring
and taxonomic assemblage may be distinct within seasons (Beaton et al. 1984;
Claridge et al. 1993; Eveling et al. 1990; Fogel 1976; Harvey et al. 1978; Hunt and
Trappe 1987; Johnson 1994a).
5
Therefore, temporal availability of hypogeous fungi is thought to be a function of
season, relating to an interaction between the availability of moisture and critical
temperature thresholds (Beaton et al. 1984; Claridge et al. 1993; Eveling et al. 1990;
Fogel 1976; Harvey et al. 1978; Hunt and Trappe 1987; Johnson 1994a; North 2002).
However, clear patterns have been difficult to distinguish and the precise
environmental cues that initiate fruiting are not known in either temperate or tropical
ecosystems.
The factors that affect the spatial distribution of hypogeous fungi are also not
well understood. Studies in the northern hemisphere have found host specificity to be
the main driver for hypogeous fungal spatial distribution patterns (Bougher and Lebel
2001). However, when host is excluded factors such as moisture (O'Dell et al. 1999)
and nutrient levels (Trudell and Edmonds 2004) appear to be important for epigeous
sporocarp distribution.
Despite their ecological importance, few studies to date have examined spatial
patterns of fungal distribution along environmental gradients in undisturbed natural
ecosystems (O'Dell et al. 1999). The limited nature of previous studies means there is
no understanding in the tropics but it is clear that the driving factors are likely to be
different for both time and space.
The fruiting bodies of hypogeous fungi are an essential resource for many
native Australian mammals (Bougher and Lebel 2001; Vernes and Pope 2006) and
many specialist mycophagous mammals in Australia are either endangered (IUCN
Species Survival Commission 2007) or are already extinct (Short 1998). It is not
known what effect the extinction of specialist mycophagous mammals has on the
overall health of an ecosystem. Therefore, understanding more about this plant-
fungus-animal tripartite mutualism is a critical task.

6
1.2 Aim and Structure of the Thesis
The aim of this thesis is to establish the relative importance of different biotic
and abiotic factors in determining both a) the temporal and b) spatial distribution of
tropical hypogeous fungal taxa. The implications of these findings for defining the
habitat restriction of an endangered specialist mycophagous marsupial, Bettongia
tropica, will subsequently be investigated.
Chapter one provides a general introduction to the thesis topic. Although the
same set of sites were used to collect the data relevant methodology are described in
each individual results chapter. As seasonality is considered a significant driver of
fungal fruiting in temperate zones, chapter two will investigate changes in sporocarp
abundance and biomass across four tropical seasons, Early-Dry, Late-Dry, Early-Wet
and Late-Wet, corresponding to the temperate region equivalents of winter, spring,
summer and autumn respectively. The availability of sporocarps within three forest
types, including wet sclerophyll, Allocasuarina forest and Eucalyptus woodland and
the implications of the potential seasonality of their main resource, hypogeous fungi,
for B. tropica habitat preference and use will be examined.
After gaining an insight into whether seasonality significantly influences
tropical fungal reproduction, chapter three will further explore the abiotic factors
driving sporocarp production across four tropical seasons surveyed seven times over a
period of two years. This chapter will examine the effect(s) of temperature,
precipitation, soil moisture and other available environmental variables on sporocarp
biomass, abundance, species richness and taxonomic assemblage at the temporal
scale.

7
Chapter four will explore the effect of biotic factors, specifically host
preference, and abiotic factors including moisture, temperature, light and nutrient
levels, at the forest-stand spatial scale, on the distribution of hypogeous fungi across
an ecotonal altitude gradient. The abundance, biomass, species richness and
taxonomic assemblage will be surveyed in known bettong habitat within three
vegetation types, wet sclerophyll forest, Allocasuarina forest and Eucalyptus
woodland.
Chapter five will examine the spatial distribution of hypogeous fungi at a finer
scale along the same environmental elevation gradient. Factors identified in chapter
four as well as multiple microhabitat variables that were measured at the micro-spatial
scale of site will be examined to determine the principal factors that drive the
availability and richness of hypogeous fungi within tropical ecotonal sclerophyll
forest. Chapter six will synthesise the findings of previous chapters, provide
recommendations for B. tropica management and suggest directions for future
research.
Abell et al. (2006) Biological Conservation 132(4): 533-540
8
Chapter Two: Seasonal Resource Availability And Use By An
Endangered Tropical Mycophagous Marsupial
2.1 Introduction
Availability of resources can impact on the temporal and spatial distribution of
a species (Rosenzweig 1981; Shenbrot and Krasnov 2000; Wisheu 1998). This is
especially important for opportunistic specialists in contrast with generalists
(Rosenzweig 1981) and may be critical for those that rely on a seasonal resource. To
understand the ecology of a species it is vital to determine if resources are temporally
and/or spatially defining habitat preference. This basic ecological question becomes
fundamental knowledge when the species is endangered or threatened.
The endangered northern bettong, Bettongia tropica (Potoroidae), currently
occurs in four disjunct populations within sclerophyll forest adjacent, and to the west
of, the world heritage rainforest massif in tropical far north Queensland, Australia
(Dennis 2002). Northern bettongs prefer Eucalyptus woodland with a grassy–
understorey on infertile soil and are restricted to woodland in close proximity to
rainforest (Laurance 1997).
This habitat preference is thought to be associated with dietary specialisation.
Bettongia tropica is considered a specialist consumer of hypogeous (fruiting below-
ground) fungi (Seebeck and Rose 1989) that also utilises lilies, grasses, and the roots
and tubers of species such as Alloteropsis semialata R.Br. (cockatoo grass) only as
secondary resources (Johnson and McIlwee 1997; Vernes et al. 2001).

Abell et al. (2006) Biological Conservation 132(4): 533-540
9
Consequently, B. tropica’s unusual and restricted distribution is attributed to a
requirement for areas of high mycorrhiza abundance that occur across the rainforest to
dry sclerophyll ecotone.
Endomycorrhizal fungi of rainforest trees generally produce small sporocarps
that bettongs cannot utilise (Johnson and McIlwee 1997). Ectomycorrhizal
Eucalyptus and Allocasuarina species produce larger sporocarps of both epigeous and
hypogeous fungi that mycophagous mammals including B. tropica are known to
consume (Johnson and McIlwee 1997; Maser et al. 1978). While dietary
specialisation is consistent with the absence of B. tropica in rainforest margins, it does
not fully explain why higher population densities are observed in the Eucalyptus
woodland relative to the ectomycorrhizal Allocasuarina forests (Laurance 1997;
Vernes 2000), or the absence of populations in ectomycorrhizal wet sclerophyll forest
that has been invaded by rainforest. Other inconsistencies associated with this
hypothesis are also apparent.
In general, specialist frugivorous mammals are thought to limit reproduction
during periods of seasonal fruit shortage and also experience a decline in body
condition (Adler 1998; Dennis and Marsh 1997). These phenomena have also been
observed for the specialist mycophagous Tasmanian bettong, Bettongia gaimardi
Desmarest. Body condition of B. gaimardi improved when the proportion of fungus
in the diet increased, and declined when secondary resources (fruit) were utilised
(Johnson 1994b). In all previous studies of B. tropica, body condition and frequency
of births remained uniform regardless of season (McIlwee and Johnson 1998; Vernes
2000; Vernes et al. 2001). Obtaining this result for a fungal specialist requires that
both fungus availability and intake do not fluctuate enough to affect body condition or
reproductive phenology.

Abell et al. (2006) Biological Conservation 132(4): 533-540
10
This has led to a further extension of the habitat/diet specialisation hypothesis
suggesting that B. tropica has a distinct preference for habitat that supports both a
high abundance and low seasonality of hypogeous fungi (Dennis 2002; Johnson and
McIlwee 1997). However, available data do not fully support this model.
Considerable variability has been observed in the proportion of fungi
consumed by B. tropica. By use of faecal analysis the proportion of fungus in B.
tropica’s diet was initially estimated at between 23% and 67% with some seasonal
variation (Johnson and McIlwee 1997). More recently it has been estimated at 56%
with no significant difference between seasons (Vernes et al. 2001). Unfortunately,
no data are currently available on the distribution and abundance of hypogeous fungi
independent of those eaten by B. tropica.
Extrapolation from temperate studies suggests that tropical hypogeous fungal
abundance may not be strictly seasonal, but instead may track rainfall and moisture
levels (Beaton et al. 1984; Claridge et al. 1993; Fogel 1976; Harvey et al. 1978; Hunt
and Trappe 1987; Johnson 1994a). I hypothesise that (a) fungus availability will in
general be seasonal in the tropics due to the highly seasonal rainfall, only rarely in
years of unseasonably high rainfall will fungi be consistently available across seasons
and (b) if tropical hypogeous fungi are seasonal then the observed maintenance of
body condition and reproductive output by B. tropica across seasons requires the
utilisation of a replacement resource of equivalent value during dry seasons, possibly
A. semialata grass bases.

Abell et al. (2006) Biological Conservation 132(4): 533-540
11
To test these hypotheses the seasonal abundance of hypogeous fungi was
examined and the number of chewed and discarded (consumed) A. semialata bases
was observed, along a gradient of wet to moist sclerophyll forest on the Lamb Range
in north-eastern Australia. If correct, then fungal abundance should decline as rainfall
decreases and use of A. semialata by bettongs should increase at the same time. Such
an outcome would help to explain anomalies in the distribution and habitat
associations of B. tropica and provide new information critical to the effective
management of this endangered species.
2.2 Methods
2.2.1 Study sites
The study site was located at Davies Creek on the Lamb Range in the Wet
Tropics World Heritage Area of far North Queensland, Australia (145o35’E, 17o01’S).
Fungal survey sites were positioned in three vegetation types across the gradient of
wet to moist sclerophyll forest; (i) wet sclerophyll sites were located in tall open-
forest on granite dominated by Eucalyptus resinifera, Eucalyptus acmenioides,
Eucalyptus intermedia, Eucalyptus cloeziana, Eucalyptus grandis and Syncarpia
glomulifera (Type 14b: Tracey 1982).

Abell et al. (2006) Biological Conservation 132(4): 533-540
12
The understorey was predominantly sedge and in most sites rainforest tree seedlings
and saplings, (ii) Allocasuarina forest sites were located in medium woodland on
granite, with a dense canopy dominated by Allocasuarina torulosa and Allocasuarina
littoralis, that may also have included E. intermedia, Eucalyptus tereticornis,
Tristania suaveolens, Acacia cincinnata, Acacia flavescens and Banksia compar
(Type 16e: Tracey 1982). Sedge and bracken fern (Pteridium spp.) dominated the
understorey in almost all Allocasuarina sites. Lower altitude Allocasuarina sites
(closer to the Eucalyptus woodland) contained a small proportion of grass in the
understorey, (iii) Eucalyptus woodland sites were located in medium woodland on
granite with a relatively open canopy that included Eucalyptus acmenioides, E.
tereticornis, E. intermedia, Syncarpia glomulifera, Tristania suaveolens, Melaleuca
viridiflora, Acacia flavescens, Allocasuarina littoralis and Xanthorrhoea johnsonii
(Type 16m:Tracey 1982). The understorey was dominated by grass species including
Themeda triandra, Alloteropsis semialata (cockatoo grass), Heteropogon contortus
and Imperata cylindrica. The higher altitude sites (closer to the Allocasuarina forest)
also contained a small proportion of sedge in the understorey.
2.2.2 Rainfall data
Rainfall data for each site were not available. Therefore, rainfall data were
obtained from the climatically closest weather station at Kairi (altitude 700m ASL),
22 km south of the study area. Rainfall data were also obtained from the
geographically closest weather station at Mareeba, 10 km west of the study area.

Abell et al. (2006) Biological Conservation 132(4): 533-540
13
The Australian Bureau of Meteorology provided monthly rainfall data from both
stations for the 1995–1996 and 2004–2005 periods as well as the 74-year means
(Figure 2-1).
2.2.3 Hypogeous fungi sampling
Six sites within each of the Eucalyptus woodland, Allocasuarina forest and
wet sclerophyll vegetation types were selected from a GIS vegetation map. All sites
were 500 m apart, to ensure site independence and 500 m from well-used roads to
minimise edge effects. Each site was located in the field by GPS. At each site four
(one for each season), 50m by 20m quadrats were permanently marked with wooden
stakes.
Figure 2-1: The monthly rainfall measured at Kairi weather station for two study periods, black columns 2004 to 2005 (this study), white columns 1995 to 1996 (Vernes et al., 2001) superimposed with the expected () seasonal pattern of rainfall (74-year monthly means).

Abell et al. (2006) Biological Conservation 132(4): 533-540
14
To minimise vegetation and environmental heterogeneity within sites the four season
quadrats were positioned adjacent to each other with their long axes aligned with the
same elevation contour. The four quadrats at each site were randomly assigned to a
season prior to sampling.
Time-standardised census is a technique that has been used to assess habitat
relationships of hypogeous fungi on a large scale in south-eastern Australia (Claridge
et al. 2000b). This method was also used in the current study as it allowed a large
number of sites to be sampled within a relatively short time, while minimising
disturbance to the site (<20%) and allowing repeated sampling (Claridge et al.
2000b). A pilot study using species–time relationships was performed to determine
the number of person–minutes required to sample 80%–100% of the morphologically
different groups of hypogeous fungi present within the defined sampling area.
Surveys were undertaken in June and September in 2004 as well as January and April
in 2005. These sampling sessions were assigned to four seasons: Early-Dry (June),
Late-Dry (September), Early-Wet (January) and Late-Wet (April).
Within a two and a half week period each season, one quadrat (1000m2) at
each site was raked with four-pronged truffling forks, for the standard time of 160
person–minutes. The number of hypogeous fungi sporocarps collected in a total of
18,000 m2 was converted to a per hectare frequency of crop availability per season.
All sporocarps were later dried then weighed to obtain the fungal dry weight (g) for
both vegetation type and season. The number of sporocarps was used as an
estimation of the quantity of sporocarps available as a resource for the bettongs and
the dry weight of sporocarps relates to the biomass of that resource in the different
vegetation types across seasons.

Abell et al. (2006) Biological Conservation 132(4): 533-540
15
2.2.4 Cockatoo grass observations
Cockatoo grass, Alloteropsis semialata (R.Br.), is a widespread perennial
tropical to sub-tropical grass species that flowers early after the first rains of the wet
season (Crowley and Garnett 2001). In the Davies Creek region A. semialata occurs
predominantly in Eucalyptus woodland, and decreases in occurrence towards
Allocasuarina forest (Vernes 2003). B. tropica favours the succulent stem base of the
grass, a storage organ, that is located below the surface of the soil (Johnson and
McIlwee 1997). As B. tropica require a low fibre, high quality diet, their behavioural
strategy is to chew the base of A. semialata then disgorge the dry fibre pellet (Winter
and Johnson 1995). Freshly disgorged fibre pellets appear to have been bleached and
are highly visible in the field. From preliminary observations, the number of grass
pellets appeared noticeably higher in the late dry season in comparison with the early
dry season. Therefore, the abundance of grass pellets was quantified starting in the
late dry season, continuing through the early and late wet seasons. As part of the
routine environmental measurements taken at each site at the time of hypogeous fungi
sampling, the number of A. semialata grass pellets per seasonal quadrat were counted
and converted into a per hectare estimation of the frequency of cockatoo grass usage
for each season.
2.2.5 Data analysis
The data obtained for both sporocarp abundance and dry weight did not
conform to expectations of normality due to large numbers of zero observations
during particular seasons (Levene’s equality of variances: F3,62 = 9.069; P < 0.01 and
F10,55 = 2.995; P < 0.01).

Abell et al. (2006) Biological Conservation 132(4): 533-540
16
Therefore, Kruskal–Wallis one-way non-parametric analysis of variance (ANOVA)
was used to compare sporocarp abundance and dry weight across both vegetation type
and season. Firstly, the effect of vegetation type was tested within each season
separately. If vegetation type consistently had no significant effect on sporocarp
abundance or dry weight then data from all vegetation types were pooled and a further
Kruskal–Wallis ANOVA performed to test for between season effects. When data
could not be pooled because of vegetation effects within seasons, separate tests of
seasonal effects were performed for each vegetation type. When significant seasonal
effects were obtained from any analysis, post-hoc pair-wise Mann–Whitney tests
among seasonal categories were performed (with Bonferroni corrections) to identify
which pairs of factors caused the significance. χ2 goodness of fit tests were used to
compare sporocarp abundance and cockatoo grass use per hectare between seasons.
2.3 Results
2.3.1 Rainfall patterns
Despite above average rainfall during both wet seasons, the overall seasonal
pattern during 2004/2005 represents the typical rainfall pattern expected for this
region (Figure 2-1). Rainfall was high in March, petered out between April and July
2004 and was almost absent in August and September (Figure 2-1). The wet season
rains began in October 2004 and continued to April 2005 (Figure 2-1). The annual
rainfall of 1861.5mm (March 2004–March 2005) was higher than the mean annual
rainfall of 1274.3mm measured over a 74-year period. This above average rainfall
was recorded during the wet season months of March 2004, December and January
2005 (Figure 2-1).

Abell et al. (2006) Biological Conservation 132(4): 533-540
17
The geographically closest weather station Mareeba, although more arid than the
study site, reported the same pattern of seasonal rainfall as the Kairi station. In
contrast, during the study period of a previous project (Vernes et al. 2001) an
aseasonal rainfall pattern was observed (Figure 2-1). Above average rainfall occurred
during the dry season month of August 1995 while during both wet seasons, rainfall
was below average (Figure 2-1).
2.3.2 Resource quantity
No significant differences in sporocarp abundance were observed between
vegetation types within seasons (Kruskal–Wallis: early wet χ22 = 0:480; P = 0.787;
late wet χ21 = 1:265; P = 0.261; early dry χ2
2 = 1:473; P = 0.479; late dry χ22 = 2:224;
P = 0.326). When vegetation types were pooled the abundance of sporocarps was
significantly different between seasons (Kruskal–Wallis: χ23 = 30:5; P < 0.0001). The
lowest ranking season was the late dry season. After this category was excluded there
was no significant difference in sporocarp abundance between seasons (Kruskal–
Wallis: χ22 = 2:229; P = 0.328). Posthoc pair-wise comparisons confirmed that the
late dry season had a significantly lower number of sporocarps compared to all other
seasons (Figure 2-2), while sporocarp numbers among the other three seasons did not
differ significantly.

Abell et al. (2006) Biological Conservation 132(4): 533-540
18
2.3.3 Resource biomass
Significant differences in sporocarp biomass were observed between
vegetation types within seasons. The biomass of sporocarps was significantly lower
during the late dry season for the Eucalyptus woodland (Kruskal–Wallis: χ23 =
10:773; P = 0.013) and Allocasuarina forest (Kruskal–Wallis: χ23 = 14:505; P =
0.002) (Figure 2-3). Although the late dry season also ranked the lowest for the wet
sclerophyll vegetation type, there was no significant difference in dry weight of
sporocarps between seasons (Kruskal–Wallis: χ23 = 4:725; P = 0.094) (Figure 2-3).
Figure 2-2: The mean (± 2 S.E.) number of sporocarps sampled in the early dry, late dry, early wet and late wet seasons 2004/5. * Significant difference

Abell et al. (2006) Biological Conservation 132(4): 533-540
19
2.3.4 Resource availability and use
There was also significant seasonality of total sporocarp numbers per hectare
(χ2 = 207.298; df = 3; P < 0.001). The abundance of sporocarps per hectare was
relatively stable during the early dry (145.83 ha-1), early wet (137.5 ha-1) and late wet
(240 ha-1) but dropped considerably to 6.67 ha-1 in the late dry season (Figure 2-4).
Figure 2-3: The mean dry weight (±1SE) of sporocarps for the three vegetation types; a) wet sclerophyll, b) Allocasuarina forest and c) Eucalyptus woodland sampled in the early and late wet, early and late dry seasons. Data are unavailable for the wet sclerophyll vegetation type in the late wet season. *Significant difference.

Abell et al. (2006) Biological Conservation 132(4): 533-540
20
This low abundance occurred after a three to four month period of minimal rain (May
to August) that included a period of almost no rainfall one month prior to sampling
(August) (Figure 2-1). The peak annual production of sporocarps (240 ha-1) occurred
in the late wet season (Figure 2-4) after extensive monsoonal rainfall (Figure 2-1).
This contrasts with the peak use of A. semialata by B. tropica, which occurred in the
late dry season (62.22 ha-1) during the trough of fungal abundance (6.67 ha-1) (Figure
2-4). The lowest use of A. semialata occurred during the early wet season when no
chewed grass pellets were observed (Figure 2-4). A. semialata was used at a
relatively low level (4.15 ha-1) during the late wet season at the time of hypogeous
fungi peak abundance (240 ha-1) (Figure 2-4). Flowering culms of A. semialata were
only observed during the early wet season sampling trip at a time when no grass
pellets were present (Figure 2-4).
Figure 2-4: The number of sporocarps of hypogeous fungi (grey columns) and chewed grass pellets of Alloteropsis semialata (♦) sampled per hectare in four seasons, 2004/2005. Data are unavailable for A. semialata in the early dry season. *Significant difference.

Abell et al. (2006) Biological Conservation 132(4): 533-540
21
Although not quantified, the number of grass pellets observed in the early dry season
was clearly lower in comparison to the late dry season.
2.4 Discussion
2.4.1 Seasonality of tropical hypogeous fungi
This is the first study to document an overall seasonal shortage of sporocarp
production in Australian hypogeous fungi. Sporocarp abundance differed little
between seasons except the late dry season when both the total and median abundance
of sporocarps dropped to low levels. This appears to be directly correlated with the
seasonal rainfall pattern experienced during the study period.
There have been two other published Australian surveys of hypogeous fungi at
a seasonal scale, independent of those examining fungi consumed by mammals
(Claridge et al. 1993; Johnson 1994a). Both studies were conducted in temperate
ecosystems with relatively uniform annual rainfall. In those studies a positive
relationship between sporocarp density and rainfall was documented for particular
taxa including Mesophellia and Hysterangium (Johnson 1994a). However, the
production of sporocarps was aseasonal, mirroring the aseasonal temperate rainfall
(Claridge et al. 1993; Johnson 1994a). While different taxa may have particular soil-
moisture preferences, it is possible that there is a lower threshold of soil moisture
availability that limits the production of sporocarps. This appears to be the case for
the hypogeous fungi observed. Fruiting intensity of hypogeous fungi is directly
related to the supply of carbohydrates obtainable from the host (Maser et al. 1978;
Vernes et al. 2001). Therefore, during the annual winter drought, production of
sporocarps may be restricted because host plants have higher carbohydrate demands
for their own growth and/or reproduction (Hatch 1937; Krueger and Trappe 1967).

Abell et al. (2006) Biological Conservation 132(4): 533-540
22
The results of this chapter, suggesting that tropical sporocarp abundance tracks
rainfall patterns, may explain disparities in the results obtained in two previous
studies of B. tropica. The proportion of fungi in the diet of B. tropica as determined
by Vernes (2001) did not vary with season while some seasonal variation was
observed in the study of Johnson (1997). Record rainfall was experienced during the
normally dry month of August in 1995 (Figure 2-1), suggesting relatively even
precipitation across the seasons may have contributed to the lack of seasonal variation
observed by Vernes in 1995 (Vernes et al. 2001).
In Tasmania, B. gaimardi body condition was correlated with the proportion of
fungus in the diet (Johnson 1994a, b), despite the lack of an overall relationship
between rainfall and sporocarp production. This is in contrast to the seasonally
uniform body condition of B. tropica despite current and previous evidence of
seasonality of resources (Johnson and McIlwee 1997). Our findings suggest that in
most years B. tropica will be unable to rely on hypogeous fungi as their primary food
resource for up to three months during the dry season. That B. tropica consistently
maintain body condition year round means that individuals must access an alternative
food source capable of replenishing body reserves during the dry period.
2.4.2 Substitutable resource
Secondary resources of other potoroid species include fruits and seeds (B.
gaimardi) or insects (Potorous tridactylus). Grasses and lilies are the second most
abundant resource in the diet of B. tropica with the protein and carbohydrate rich
shoot base of A. semialata thought to be an important component (Johnson and
McIlwee 1997).
Abell et al. (2006) Biological Conservation 132(4): 533-540
23
Our results further support these findings, suggesting that B. tropica seasonally switch
to using A. semialata grass bases subject to hypogeous fungi availability (Figure 2-4).
A. semialata is a perennial C4 tropical to subtropical grass species that flowers
almost immediately after the first rains of the wet season (Crowley and Garnett 2001).
Bettongia tropica selectively feeds on the base of this grass, which is a storage organ.
The function of the storage organ is to allow the plant to persist throughout the dry
season and possibly, to allow it to flower early in the wet season, using stored
nutrients and carbohydrates. This means that the nutritional status of A. semialata
could be expected to change throughout the year, being low during the early wet
season but peaking during the mid to late dry season. This is consistent with the
pattern of A. semialata use by B. tropica. Alloteropsis semialata was not used during
the early wet season even though hypogeous fungi were not at peak production. In
contrast, when hypogeous fungi were at peak availability in the late wet season A.
semialata was also used, although at low levels compared to use during the late dry
season. This suggests that while B. tropica may preferentially use fungi, they do not
ignore an available, potentially high quality, resource.
2.4.3 Habitat preference of B. tropica
Previous authors have argued that B. tropica distribute themselves across the
gradient of fungal abundance in accordance with an ‘‘ideal-free’’ theoretical model of
distribution (Johnson and McIlwee 1997). This relationship has been used to explain
their preference for Eucalyptus woodland as determined by Winter (1997) and
Laurance (1997). In tropical ecosystems as aridity increases the seasonality of rainfall
increases and the mean annual rainfall decreases.

Abell et al. (2006) Biological Conservation 132(4): 533-540
24
Therefore, as aridity increases the time period that sporocarps are at critically low
levels or unavailable to B. tropica would increase. Thus, the seasonality of
hypogeous fungi could explain the habitat preference at the wetter end of the rainfall
gradient and the restriction at the dryer end of this gradient. However, it does not
entirely explain their habitat restriction at the wet end of the gradient.
The Eucalyptus woodland that is preferred by B. tropica does not lie on the
very edge of the rainforest; at least two other vegetation types intervene, including
ectomycorrhizal Allocasuarina and wet sclerophyll forest. There was no significant
difference found in sporocarp abundance between these three different forest types in
the first year of this study. If the northern bettong was purely restricted to habitat that
supports a high abundance and low seasonality of fungus, all three forest types should
support equivalent bettong populations. However, although the abundance of the
fungal resource did not differ between the forest types the biomass of this resource did
vary. The dry weight of sporocarps in the wet sclerophyll forest remained at low
levels throughout the year and did not show the same seasonal increase during the
wetter months (Figure 2-3). The consistent low biomass of this resource regardless of
season may, in part, explain why wet sclerophyll is not utilised by B. tropica.
The wet sclerophyll and Allocasuarina forests also have a sedge (not grass),
dominated understorey. Alloteropsis semialata is found in higher abundance within
Eucalyptus woodland compared to Allocasuarina forest (Vernes 2003). This is
possibly related to the increasing canopy coverage of Allocasuarina providing less
light to support grass species in the understorey and/or allelopathy.

Abell et al. (2006) Biological Conservation 132(4): 533-540
25
Therefore, B. tropica’s apparent preference for Eucalyptus woodland over the other
two forest types may also be explained, in part, by the distribution of A. semialata.
This suggests that while decreasing hypogeous fungi abundance may restrict the
distribution of B. tropica at the dry end of the rainfall gradient, the need to utilise A.
semialata at specific times of the year may further restrict this species distribution at
the wet end of this gradient. This identifies B. tropica as a true ecotonal specialist
with a habitat preference for Eucalyptus woodland that is associated with rainforest
margins and other transitional forest types between the rainforest to dry sclerophyll
gradient.

Abell et al. (2008a) Oecologia in review
26
Chapter Three: Reproductive Cues And Strategies Of Tropical
Hypogeous Fungi
3.1 Introduction
The nutrients and water made available by mycorrhizal fungi facilitate the
acquisition of carbohydrates through photosynthesis by their plant hosts. In return
sporocarp production is supported by a current photosynthate supply, between 30 and
60% of the net photosynthesis rate of their plant hosts (Norton et al. 1990; Simard et
al. 1997a). Photosynthesis rate is determined by prevailing environmental conditions,
including precipitation, temperature and sunlight availability (Clark 2004; Nara et al.
2003; Tester et al. 1986). Seasonal variability in rainfall is the most significant factor
in determining primary productivity within tropical ecosystems (Schloss et al. 1999).
The same environmental factors affecting mycorrhizal plant host productivity are
expected to contribute to mycorrhizal fungal productivity, including reproduction.
Hypogeous (fruiting below-ground) fungi are representative of a diverse
polyphyletic group within the kingdom fungi (Bougher and Lebel 2001). They
directly contribute to all trophic levels, through their role in ectomycorrhizal nutrient
cycling and availability as a resource to both generalist and often endangered
specialist mycophagists. Fluctuations in richness, abundance and biomass for
hypogeous fungi have been observed in many studies.

Abell et al. (2008a) Oecologia in review
27
In temperate ecosystems, peaks and troughs in richness, abundance and
biomass of hypogeous fungal sporocarps are thought to be a function of season,
relating to an interaction between the availability of moisture and critical temperature
thresholds (Beaton et al. 1984; Claridge et al. 1993; Fogel 1976; Harvey et al. 1978;
Hunt and Trappe 1987; Johnson 1994a). Moisture may be the most important driver
for reproduction of hypogeous fungi. In an Australian temperate region study, almost
all variables explaining species diversity could be attributed to moisture availability
(Claridge et al. 2000a).
At the landscape scale, diversity of hypogeous fungi was lower in sandy, high
drainage soils compared to soils with more structure, less drainage and hence less
moisture variability (Claridge et al. 2000a). At a more localized scale, diversity was
higher in wetter sheltered slopes and gullies, while dryer exposed slopes and ridges
reduced species diversity (Claridge et al. 2000a; Claridge et al. 1993). Individual
hypogeous fungal taxa appear to respond either positively or negatively to increased
moisture availability (Claridge et al. 1993; Johnson 1994a). These patterns are also
found in temperate ecosystems on other continents (Fogel 1976; Harvey et al. 1978;
Hunt and Trappe 1987). Despite the connection between plant and fungus
productivity, to our knowledge, no study has shown a direct relationship at the
community level between precipitation and species richness, abundance or biomass of
hypogeous fungi.
All of the ecological studies on hypogeous fungi have been conducted in
temperate ecosystems, where the effect of multiple environmental variables may
interact with or mask direct correlations. Temperate region climate is generally
characterized by low interannual fluctuations in precipitation and high fluctuations in
temperature, relative to the tropical climate.
Abell et al. (2008a) Oecologia in review
28
Therefore, the effect of precipitation on fungal productivity may not be as
complicated by the time of year (season) in the tropics, brought about by an
interaction with temperature.
The aim of this chapter is to determine the reproductive cues of
ectomycorrhizal hypogeous fungi as well as the effect of season and/or climate on
species richness and community assemblage within a tropical ecosystem. Due to
previous evidence showing a lower threshold (correlated with low levels of
precipitation) of hypogeous sporocarp production during the first year of sampling
(Abell et al. 2006) I hypothesise that precipitation not temperature will be the main
factor influencing fruiting. Increased rainfall in the second year will allow this
hypothesis to be tested. If precipitation does have an effect on hypogeous fungal
abundance regardless of the time of year, then fungal diversity may also increase with
precipitation levels.
Trends in temperate studies suggest there may be distinct community
assemblages attributed to the morphology of the fruiting body (Claridge et al. 2000b;
Claridge et al. 1993; Johnson 1994a), or to the time of year (autumn or spring)
(Claridge et al. 2000b; Fogel 1976; Johnson 1994a; Luoma et al. 1991). Therefore,
the proportion of the community that responds to season and/or precipitation will also
be closely examined.

Abell et al. (2008a) Oecologia in review
29
3.2 Methods
3.2.1 Sample Design
The study location was at Davies Creek on the Lamb Range in the Wet
Tropics World Heritage Area of far North Queensland, Australia (145o35’E, 17o01’S).
Surveys were undertaken in June and September in 2004, January, April and
September in 2005 as well as January and May 2006. These sampling sessions were
assigned to the following four seasons: Early-Dry (June), Late-Dry (September),
Early-Wet (January) and Late-Wet (April and May) (Figure 3-1). These tropical
seasons correspond to the temperate region seasons of winter, spring, summer and
autumn respectively. A description of the sample design including how the fungal
survey sites were selected, detailed site vegetation descriptions as well as the
hypogeous fungal sampling protocol are provided in a previous publication (Abell et
al. 2006).
Figure 3-1: The monthly rainfall (black columns) measured at Kairi weather station for the study period (2004 – 2006), superimposed with the expected (◊) seasonal pattern of rainfall (74-year monthly means). Vertical arrows indicate collection dates.

Abell et al. (2008a) Oecologia in review
30
3.2.2 Environmental data
Climate data including precipitation, sunshine hours, cloud cover, maximum
and minimum temperature were obtained for each survey date from the climatically
closest weather station at Kairi (altitude 700m ASL), 22 km south of the study area.
The Australian Bureau of Meteorology provided precipitation data for the 2004 –
2006 period as well as the 74-year means (Figure 3-1). Soil moisture was determined
by collecting two sealed bags of topsoil 5m up-slope and 5m down-slope from the
centre of each quadrat at the time of survey. A wet weight was obtained on return to
the laboratory, the soil was dried and a dry weight was recorded. The difference
between the wet weight and dry weight was calculated and converted to the mean soil
moisture for each site in mL/g.
Two major climatic events occurred prior to the last survey (May 2006) with
the passage of two severe tropical cyclones south (Cyclone Larry; Cat. 5; March
2006), then north (Cyclone Monica; Cat. 3; April 2006) of the study area. The
extreme precipitation was more than three times the average for the month of April
2006 (Figure 1). Major structural damage to the vegetation was not observed within
the survey sites. However, it is expected that a certain level of leaf loss of the host
plants would have occurred in the high winds experienced during the cyclones.
3.2.3 Assessment of fungal diversity
All sporocarps were photographed, measured and described in their fresh state
prior to drying at low temperature overnight in a food dehydrator. Spores were also
examined, photographed and included in a photographic reference library. Initially
the reference library was used to group the collection into broad morphological
groups.

Abell et al. (2008a) Oecologia in review
31
Morphological groups were subsequently identified to genera (Appendix One) with
the assistance of expert taxonomists Dr Teresa Lebel of the Royal Botanic Gardens
Melbourne Australia, as well as Dr James Trappe of the Department of Forest Science
Oregon State University Corvallis, USA.
Species identifications were carried out using current published keys as well as
unpublished preliminary keys provided by and with the guidance, where possible, of
both Dr Teresa Lebel and Dr James Trappe. Identification to species was deliberately
conservative and performed first by using spore shape, size, ornamentation and
reaction to chemicals (Meltzers reagent and KOH), while fresh and dried sporocarp
characters were used only to add further weight to the groupings (Appendix Two).
Identified species have been lodged in the Queensland Plant Pathology Herbarium
(BRIP), Department of Primary Industries, with duplicates in the Australian Tropical
Herbarium (ATH), James Cook University, Cairns. Undescribed/unknown species
are currently awaiting description elsewhere and/or final identification, and will be
deposited at the appropriate time.
3.2.4 Data Analysis
The data obtained for mean sporocarp abundance, biomass and sporocarp size
(biomass/abundance) as well as genera and species number did not conform to
expectations of normality due to large numbers of zero observations during particular
surveys (Levene’s equality of variances: F3, 116 = 4.060; P < 0.01; F3, 116 = 4.652; P <
0.01; F3, 110 = 4.197; P < 0.001; F1, 118 = 0.270; P < 0.01 and F1, 118 = 3,985; P < 0.05
respectively).

Abell et al. (2008a) Oecologia in review
32
Therefore, Kruskal–Wallis one-way non-parametric analysis of variance (ANOVA)
was used to compare mean sporocarp abundance, biomass and sporocarp size across
season. When comparing frequency of genera and species occurrence, Pearson one-
way non-parametric chi square (χ2) analyses were used.
Available climate variables (sunshine hours, cloud cover, max/min and 9am
temperature and precipitation) were examined initially using scatter-plots at different
time scales (eg. 2 weeks, 1 month, 2 months) prior to and/or including the survey
month. To correct for normality, data were transformed to means prior to regression
analyses. The time scale with the largest and most significant linear regression r2
values were used in subsequent regression analyses. Linear regression analyses were
performed, for the climate variable (x) and mean sporocarp abundance (y), with the
last survey outlier (May 2006) included then excluded for abundance and all surveys
included for biomass and species number.
The species richness (S) was compared to the Shannon-Weiner Richness Index
(H’) for the wet and dry seasons. Non-parametric diversity indices were also
calculated using the EstimateS software (Version 7.5, R. K. Colwell,
http://purl.oclc.org/estimates). Both the standard Chao1 (Chao 1984) and also ACE
indices were computed (Chao and Lee 1992; Chao et al. 1993). ACE provides a more
conservative species diversity prediction in comparison to Chao1 by taking into
account the occurrence of singletons and doubletons (Chao 1984, 1987; Chao et al.
1992; Chao et al. 1993; Lee and Chao 1994). The following equation was used to
determine the completeness of the sample: Estimated sampling completeness =
observed species numbers x 100/ estimated species numbers (Chao1 and ACE).

Abell et al. (2008a) Oecologia in review
33
After detecting that abundance and biomass of sporocarps did not have the
same pattern after extreme rainfall, two possible responses were predicted, either a)
all species decreased in abundance but increased in biomass or b) a differential
species response occurred. This was examined by comparing the change in biomass
before and after the extreme rainfall event. Three potential species groups were
predicted those that i) increased in abundance and biomass (increasers), ii) decreased
in abundance and biomass (decreasers) and iii) did not change in biomass or
abundance (stable). The data set was reduced to those species that were surveyed a
minimum of three times including the extreme rainfall survey (14 species). To
distinguish between the groups a standard K-means cluster analysis was performed.
The parameters used to distinguish between groups were the change in biomass and
abundance between “normal” precipitation surveys (under 400mm) and “extreme”
rainfall surveys (above 400mm). A discriminant function analysis (DFA) was then
performed to determine the validity of those groupings. The assumptions of DFA
including a multivariate normal distribution and equal covariance are not fatal to the
analysis as long as outliers are not observed in the data (Tabachnick and Fidell 1996).
The data in this analysis although non-normal were skewed but did not contain
outliers.

Abell et al. (2008a) Oecologia in review
34
3.3 Results
3.3.1 Precipitation and abundance
There was a significant effect of season on abundance (Kruskal-Wallis: χ23 =
19.832; P < 0.001). The lowest ranking season overall was the Late Dry Season
(Figure 3-2). When this category was removed there was no significant effect of
season found (Kruskal-Wallis: χ22 = 3.719; P = 0.156).
Post-hoc pairwise comparisons confirmed that the Late Dry Season had
significantly less sporocarps compared to the other seasons (Figure 3-2).
Figure 3-2: The mean (±1SE) sporocarp abundance (white columns) and biomass (g) (grey columns) surveyed in the Early-Wet, Late-Wet, Early-Dry and Late-Dry seasons 2004 to 2006. * Significant difference

Abell et al. (2008a) Oecologia in review
35
There was no effect of soil moisture on the mean abundance of sporocarps (r2
= 0.384; P = 0.137; linear regression). When the last survey was included, there
were no significant linear correlations between the mean abundance of hypogeous
sporocarps and precipitation (mm) two months prior (r2 = 0.401; P = 0.127; linear
regression), at any other time scale, or with any other large-scale climate variable
measured. When the last survey outlier (May 2006) was excluded from the analysis
there was a highly significant positive linear correlation (y = -2.051 + (0.072 * x), r2
= 0.984; P = 0.001) between the mean sporocarp abundance (y) and precipitation (x)
two months prior (Figure 3-3). There were no significant linear correlations between
any other large-scale climate variables or with soil moisture when the last survey was
excluded.
Figure 3-3: The positive linear relationship between the mean sporocarp abundance and precipitation two months prior to the survey with the May 2006 (empty circle) outlier excluded from the regression.

Abell et al. (2008a) Oecologia in review
36
3.3.2 Precipitation and biomass
There was a significant effect of season on biomass (Kruskal-Wallis: χ 23 =
12.905; P < 0.01). The lowest ranking season was the Late Dry Season (Figure 3-2).
When this category was removed there was no significant effect of season found
(Kruskal-Wallis: χ22 = 1.975; P = 0.372). Post-hoc pairwise comparisons confirmed
that the Late Dry Season had significantly less biomass compared to the other seasons
(Figure 3-2).
There was no effect of soil moisture on the mean biomass of sporocarps (r2 =
0.480; P = 0.084; linear regression). When all surveys were included, there was a
highly significant positive linear correlation (y = 0.842 + (0.007 * x), r2 = 0.842; P =
0.01) between the mean sporocarp biomass (y) and precipitation (x) two months prior
(Figure 3-4). A number of positive increasing curve models were also found to
significantly explain the relationship between these variables (Logarithmic, r2 =
0.849, P < 0.01; Cubic, r2 = 0.976, P < 0.01; S, r2 = 0.948, P < 0.001).
Figure 3-4: The positive logarithmic relationship between the mean sporocarp biomass and precipitation two months prior.

Abell et al. (2008a) Oecologia in review
37
3.3.3 Precipitation and richness
There was no effect of soil moisture on the number of fungal species (r2 =
0.548; P = 0.057; linear regression). When all surveys were included, there were no
significant positive linear correlations (r2 = 0.399; P = 0.128: linear regression)
between the number of fungal species (y) and precipitation (x). Three positive
increasing curve models were found to significantly explain the relationship between
these variables (Logarithmic, r2 = 0.757, P < 0.05; Cubic, r2 = 0.967, P < 0.05; S, r2
0.959, P < 0.001; Figure 3-5).
Figure 3-5: The positive logarithmic relationship between the number of hypogeous fungal species surveyed and precipitation two months prior.
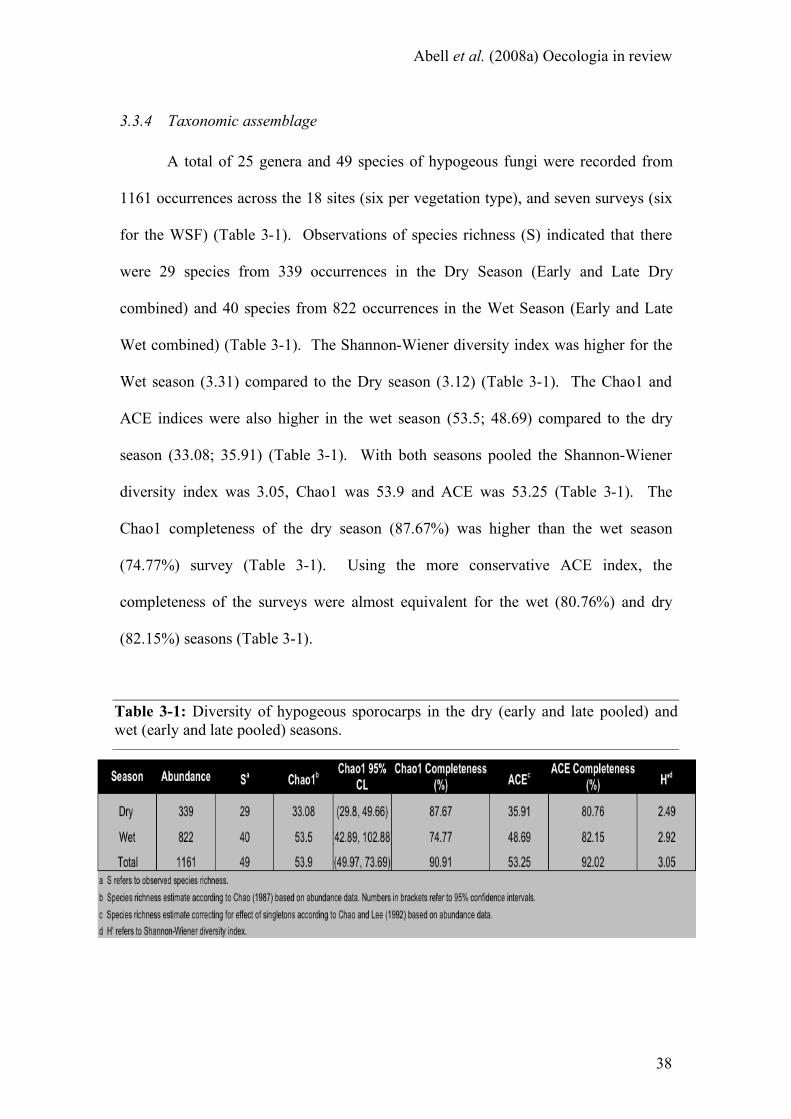
Abell et al. (2008a) Oecologia in review
38
3.3.4 Taxonomic assemblage
A total of 25 genera and 49 species of hypogeous fungi were recorded from
1161 occurrences across the 18 sites (six per vegetation type), and seven surveys (six
for the WSF) (Table 3-1). Observations of species richness (S) indicated that there
were 29 species from 339 occurrences in the Dry Season (Early and Late Dry
combined) and 40 species from 822 occurrences in the Wet Season (Early and Late
Wet combined) (Table 3-1). The Shannon-Wiener diversity index was higher for the
Wet season (3.31) compared to the Dry season (3.12) (Table 3-1). The Chao1 and
ACE indices were also higher in the wet season (53.5; 48.69) compared to the dry
season (33.08; 35.91) (Table 3-1). With both seasons pooled the Shannon-Wiener
diversity index was 3.05, Chao1 was 53.9 and ACE was 53.25 (Table 3-1). The
Chao1 completeness of the dry season (87.67%) was higher than the wet season
(74.77%) survey (Table 3-1). Using the more conservative ACE index, the
completeness of the surveys were almost equivalent for the wet (80.76%) and dry
(82.15%) seasons (Table 3-1).
Table 3-1: Diversity of hypogeous sporocarps in the dry (early and late pooled) and wet (early and late pooled) seasons.
Abell et al. (2008a) Oecologia in review
39
A total of twenty-one genera were collected in the wet season compared to
seventeen in the dry season (Table 3-2). Of the genera that were collected in the wet
season, thirteen (61.90%) were also collected in the dry season surveys (Table 3-2).
The remaining eight genera (38.10%) were only collected during the wet season
surveys (Table 3-2). Of the genera collected in the dry season, thirteen (76.47%)
were also collected in the wet season (Table 3-2). In comparison to the wet season
there was a lower (4; 23.53%) proportion of genera unique to the dry season surveys
(Table 3-2). Overall there was no significant difference between the number of
shared or unique genera between the seasons (Pearson: χ21 = 1.043; P = 0.307; Table
3-2).
A total of forty species were collected in the wet season surveys compared to
twenty-nine species in the dry season (Table 3-2). Twenty (50%) of these species
were only collected in the wet season (Table 3-2). The remaining twenty (50%),
species were collected in both the wet and dry seasons (Table 3-2). Of the species
collected in the dry season, twenty (68.95%) were also collected during the wet
season surveys (Table 3-2). There was a lower (9; 31.03%) proportion of species that
were unique to the dry season surveys (Table 3-2). However, the number of species
that were unique or shared between the wet and dry seasons was not significantly
different (Pearson: χ21 = 2.482; P = 0.115; Table 3-2).

Abell et al. (2008a) Oecologia in review
40
Table 3-2: The total list of species surveyed, indicating the genera and species unique (u) or shared (s) between the wet and dry seasons.

Abell et al. (2008a) Oecologia in review
41
When considering the change in sporocarp biomass and abundance between
“normal” and “extreme” rainfall, three distinct groups of species could be
distinguished (Discriminant Function Analysis: Wilks’ λ = 0.200; F211 = 22.145; P <
0.0001; Figure 3-6). All (100%) of the cases were correctly classified to each group.
Figure 3-6: The change in biomass and abundance (±1SE) between normal and extreme rainfall showing the significant centromeres produced by a K-means analysis; () represents eight species that decreased in both abundance and biomass, () three species that increased in abundance and biomass and () three species that were relatively stable and increased only slightly in abundance and biomass.

Abell et al. (2008a) Oecologia in review
42
Figure 3-7: The mean sporocarp size (biomass/abundance) and mean abundance of species from all surveys. Each data point represents a single survey with species that () decreased, () increased, () remained relatively stable or () were unable to be assigned a category (were not present) after extreme rainfall.
Three species, Gautieria amara Trappe, Gummiglobus joyceae Trappe,
Castellano & Amar. and G. spB increased in both abundance and biomass, and three
species Stephanospora spA, Zelleromyces spC and Aroramyces spA maintained a
relatively stable abundance and biomass (Figure 3-6). Eight species, Chondrogaster
spB, Hysterangium aggregatum J.W. Cribb, H. gardneri E. Fisch., H. inflatum
Rodway, H. spC, Sclerogaster spA, Zelleromyces spD, Z. spE decreased in both
abundance and biomass (Figure 3-6). The species that remained relatively stable after
extreme rainfall were found to produce few, small sporocarps (Figure 3-7). The
species that increased in both abundance and biomass after extreme rainfall produced
few, large sporocarps, while the species that decreased in both abundance and
biomass after extreme rainfall produced many, small sporocarps (Figure 3-7).

Abell et al. (2008a) Oecologia in review
43
3.4 Discussion
Due to the variability in the level of precipitation during the two years of
sampling (Figure 3-1), the hypothesis that precipitation not temperature influenced
abundance and biomass of hypogeous fungi in the tropics (Abell et al. 2006) was able
to be tested. There was a significantly lower abundance and biomass of sporocarps
found during the pooled late dry season (spring 2004/05) samples and no difference
between the other seasons, including the early wet (summer 2005/2006), late wet
(autumn 2005; 2006) and early dry (winter 2004) (Figure 3-1 and 3-2).
This is a very different pattern of sporocarp production compared to the
temperate region, where peaks in abundance occur both in spring and autumn. In the
tropics, sporocarp production was high and not significantly different in all seasons
(autumn, winter and summer), except for spring when it was consistently significantly
lower (Figure 3-2). This occurred despite the higher precipitation leading up to the
second spring survey (September 2005) (Abell et al. 2006) compared to the first
spring survey (September 2004) (Figure 3-1). The variability in abundance between
the wet and dry seasons indicated a possible correlation with climate variables.
However, there were no correlations with temperature, sunlight, cloud cover or soil
moisture and initially a correlation between precipitation and sporocarp abundance
could not be detected.
Prior to the last survey (May 2006), two extreme climatic events occurred with
the passage of two tropical cyclones south (Cyclone Larry; Cat. 5; March 2006), then
north (Cyclone Monica; Cat. 3; April 2006) of the study area. Subsequently,
precipitation was more than three times above the expected levels (74 year means) for
the month of April, immediately prior to the May 2006 survey (Figure 3-1).

Abell et al. (2008a) Oecologia in review
44
These precipitation levels were also the highest of any other survey throughout the
study (Figure 3-1). Instead of the highest abundance, sporocarps were recorded at
medium levels for that survey (Figure 3-3). This may indicate a non-linear
relationship between abundance and precipitation. However, although abundance was
lower, biomass was at the highest level after the extreme precipitation (Figure 3-4)
and the number of species fruiting also did not decline (Figure 3-5).
A potential explanation for the lower abundance and higher biomass after the
extreme rainfall could be that a different assemblage of species were fruiting in the
wet season compared to the dry season. The species richness, Shannon Weiner,
Chao1 and ACE indices confirmed that the dry season surveys were lower in richness
compared to the wet season (Table 3-1). However, there were no significant
differences between the taxonomic assemblage of species sampled in the wet (Early
and Late Wet) compared to the dry (Early and Late Dry) seasons (Table 3-2).
In prior studies the taxonomic assemblage did differ between the seasons
(autumn and spring) and those differences were attributed to morphological
characteristics of the sporocarps (Claridge et al. 2000b; Claridge et al. 1993; Johnson
1994a). In contrast to the temperate region studies there were no significant
differences between the genera or species that fruited in the wet and the dry seasons
(Table 3-2). Therefore, the taxonomic assemblage could not explain the difference in
abundance and biomass observed after extreme rainfall. The number of species
sampled asymptoted after 200mm of precipitation and remained at a relatively
constant level thereafter (Figure 3-5). This indicated that the same fungal species
responded in a different way after extreme rainfall by producing relatively fewer, but
larger sporocarps.

Abell et al. (2008a) Oecologia in review
45
When this was examined closely a more complicated pattern emerged (Figure
3-6). Three different responses were found; three species increased in both
abundance and biomass, three species remained relatively stable, and the majority of
species (eight) decreased significantly in abundance as well as biomass (Figure 3-6).
Extreme rainfall appears to have affected the reproductive ability of the majority of
species, explaining the discrepancy between biomass and abundance that was found
(Figures 3-3 & 3-4).
The species that increased in abundance and biomass may be tentatively
described as being ecologically hydrophilic and the decreasers as hydrophobic. This
observation may have a physiological basis as ectomycorrhizal fungi, including
hypogeous fruiting species, are known to have hyphae with hydrophobic and
hydrophilic physiological properties (Agerer 2001).
The taxa that are known to have hydrophobic hyphae include species from the
genus Hysterangium as well as Gautieria (Agerer 2001). Hydrophobic
ectomycorrhizal fungal species may be highly sensitive to water-logging under
laboratory conditions, and this is considered to occur only rarely in some temperate
forest soils (Stenstrõm 1991). Hysterangium aggregatum, H. gardneri, H. inflatum,
H. spC, Chondrogaster spB, Sclerogaster spA, Zelleromyces spD and Z. spE were
found to have a possible hydrophobic response to extreme precipitation.
Stephanospora spA, Zelleromyces spC and Aroramyces spA remained stable while,
Gautieria amara, Gummiglobus joyceae and G. spB were found to have a hydrophilic
response to extreme precipitation.

Abell et al. (2008a) Oecologia in review
46
The results of this study indicate a potential negative effect of waterlogging on
the reproductive ability of hypogeous hydrophobic taxa in the field (Figure 3-6).
These observations require experimental data to confirm a physiological basis to the
apparent ecological response.
The ecological responses to extreme rainfall allowed different reproductive
strategies for all taxa to be distinguished. The decreasers were found to produce
many, small sporocarps, while the increasers produced few, large sporocarps (Figure
3-7). The different reproductive strategies may be related to the water tolerance of
those taxa. Hydrophobic species are thought to have a selective advantage in
environments that experience periodical drought (Unestam 1991; Unestam and Sun
1995). Producing many, small sporocarps may be a water efficient reproductive
strategy. Alternatively, hydrophilic taxa are thought to have a selective advantage in
wetter environments (Unestam 1991; Unestam and Sun 1995).
Precipitation was required by all species to initiate reproduction (Figure 3-3,
3-4 and 3-5). The two-month lag effect of precipitation indicates that the fungal
symbionts are buffered from current environmental conditions by their plant hosts and
explains why there were no correlations for soil moisture that was measured at the
time of each survey. Increased precipitation results in an increased photosynthesis
rate due to elevated carbon fixation, augmenting the ability of the fungus to undergo
sexual reproduction. This relationship between host plant photosynthesis rate and
fungal fruiting is confirmed in numerous studies (Godbout and Fortin 1990, 1992;
Hacskaylo 1965; Hogberg et al. 2001; Lamhamedi et al. 1994; Last et al. 1979; Nara
et al. 2003; Norton et al. 1990; Simard et al. 1997a). In the seasonal tropics there are
two extremes of the climate. Water is extremely limiting during the dry season and
this dry period is generally followed by high rainfall during the wet season.
Abell et al. (2008a) Oecologia in review
47
Water tolerance may provide a competitive advantage for both hydrophobic and
hydrophilic hypogeous fungal species, facilitated by alternative reproductive
strategies, at the two extremes of the tropical climate.

Abell et al. (2008b) Ecosystems in review
48
Chapter Four: Nutrient Levels Determine The Spatial
Distribution Of Tropical Hypogeous Fungal Sporocarps
4.1 Introduction
Environmental gradients correlated with abiotic factors help to determine
patterns of animal and plant species diversity (Barbour et al. 1987; Begon et al. 2006;
Lomolino 2001; Rahbek 1995; Rosenzweig 1995; Rosenzweig and Abramsky 1993;
Whittaker and Niering 1975; Zobel et al. 1976). Fungi provide essential ecosystem
services both directly as a resource for mycophagous animals, and indirectly in their
role as decomposers and mycorrhizal symbionts. Therefore, understanding the
environmental factors that influence the structuring of fungal communities provides
important insight into their role in ecosystem function and their influence on both
animal and plant spatial distribution. Despite their ecological importance, to date few
studies have examined patterns of fungal diversity along environmental gradients in
undisturbed natural ecosystems.
In Australia hypogeous (fruiting below-ground) fungal species have a high
diversity (est. 2000 spp.) and endemicity (35% genera; 95% species) (Bougher and
Lebel 2001). They also contribute significantly to ecosystem function by forming
ectomycorrhizal associations with the roots of woody plants. Through these
associations they provide water and otherwise unavailable nutrients in exchange for
30 – 60% of the sugars produced by their host plants (Norton et al. 1990; Simard et
al. 1997b).

Abell et al. (2008b) Ecosystems in review
49
The fruiting bodies of hypogeous fungi are also an important resource for native
mammals (Bougher and Lebel 2001), with many specialist mycophagous mammals,
including the northern bettong, Bettongia tropica, being listed as endangered (IUCN
Species Survival Commission 2007).
The majority of studies on the diversity of hypogeous fungi have been carried
out in the Northern Hemisphere and have focused on host specificity (Bougher and
Lebel 2001). These studies have shown that in mono-dominant forests consisting of
hardwoods and conifers, the distribution of ectomycorrhizal fungi is explained, in
part, by host specificity (Bills et al. 1986; Nantel and Neumann 1992; Villeneuve et
al. 1989).
However, these findings are not generally applicable. Many ectomycorrhizal
species are host generalists (Bougher and Lebel 2001; Bruns et al. 2002; Molina et al.
1992) and host specificity is expected to be substantially lower in mixed forest types
(Trudell and Edmonds 2004). Hypogeous fungal species in Australian forests appear
to have relatively low host plant specificity (Bougher and Lebel 2001; Bougher and
Tommerup 1996; Malajczuk et al. 1982; Smith and Read 1997).
Laboratory studies have previously correlated abiotic variation with
ectomycorrhizal species characteristics. For example, ectomycorrhizal formation
(root tip colonisation) is decreased by low temperature (McInnes and Chilvers 1994),
reduced soil organic matter (Reddell and Malajczuk 1984) and low light availability
(Reid et al. 1983), as well as by high moisture availability (Bougher and Malajczuk
1990), high soil pH (Thomson et al. 1996), high soil phosphorous (Bougher et al.
1990) and high nitrogen (Lilleskov et al. 2001).

Abell et al. (2008b) Ecosystems in review
50
Excessive nutrients have immediate and more pronounced negative effects on
extramatrical mycelium formation as well as sporocarp production (Jonsson et al.
2000; Peter et al. 2001; Wallenda and Kottke 1998).
Data from the limited number of field studies available on factors influencing
ectomycorrhizal fungal sporocarp abundance and distribution are equivocal. A
northern hemisphere study carried out along an elevation gradient with uniform host
species distribution, found moisture was the most significant factor influencing the
spatial distribution of ectomycorrhizal epigeous (fruiting above-ground) sporocarps
(O'Dell et al. 1999). In another study comparing two sites with uniform host species,
decreased soil nitrogen could explain differences in taxonomic assemblage between
sites and increased sporocarp abundance in one site (Trudell and Edmonds 2004).
This pattern has also been found in disturbed ecosystems, ectomycorrhizal species
richness and sporocarp abundance are significantly reduced by high soil nitrogen
levels (Lilleskov et al. 2001; Wallenda and Kottke 1998).
In Australia, field studies have shown that fruiting of certain hypogeous fungal
species may be influenced by broad-scale characteristics of climate, topography, host
plant and animal vector, as well as disturbance history (Bougher and Lebel 2001;
Claridge et al. 2000a; Claridge et al. 2000b), but detailed functional relationships
were not identified in these studies. Only one study has demonstrated a temporal
community level increase in abundance and species richness of hypogeous fungal
species with increasing precipitation (Abell et al. 2008a; Chapter 3).

Abell et al. (2008b) Ecosystems in review
51
The aim of this chapter is to determine the relative importance of different
biotic and abiotic factors in determining the spatial distribution and taxonomic
assemblage of ectomycorrhizal hypogeous fungal species in three contiguous
vegetation types situated along an elevational gradient. If there are no differences in
taxonomic assemblage between the vegetation types (minimal host specificity),
northern hemisphere studies suggest that in general richness, abundance and biomass
of ectomycorrhizal fungal sporocarps will be positively correlated with the altitudinal
moisture gradient. However, fine-scale variation may also be associated with changes
in microclimate and soil nutrient levels. Therefore, a range of potential driving
factors for ectomycorrhizal hypogeous fungal species distribution were examined
across this elevational gradient in an hierarchical analysis. These were host
association (vegetation type), soil moisture, variation in light availability and
temperature, as well as total soil nutrient content (nitrogen and phosphorous).
4.2 Methods
4.2.1 Sample Design
The study site was located at Davies Creek on the Lamb Range in the Wet
Tropics World Heritage area of far north Queensland, Australia (145o35’E, 17o01’S).
Eighteen fungal survey sites were positioned in three vegetation types (six in each)
across an altitude gradient approximately 5km wide, in ecotonal wet to moist
sclerophyll forest (Figure 4-1).

Abell et al. (2008b) Ecosystems in review
52
Figure 4-1: A map of the study site at Davies Creek on the Lamb Range, showing the location of six sites per vegetation type, including the wet sclerophyll forest (WSF; Type G14b), Allocasuarina forest (AF: Type G16e) and Eucalyptus woodland (EW: Type G16m). The letter G before the vegetation type number indicates the soil type (granite), the solid line is Davies Creek Road and the broken lines indicate drainage.

Abell et al. (2008b) Ecosystems in review
53
Wet sclerophyll forest (WSF) sites ranging in altitude from 1040 to 770 m (a.s.l.)
were located in tall open-forest on granite. The dominant tree species were
Eucalyptus resinifera, E. acmenioides, E. intermedia, E. cloeziana, E. grandis and
Syncarpia glomulifera (Type 14b: Tracey 1982). Allocasuarina forest (AF) sites
ranging in altitude between 720 to 670 m (a.s.l.) were located in medium woodland on
granite. This forest type had a dense canopy dominated by Allocasuarina torulosa and
A. littoralis, and may also have included Eucalyptus intermedia, E. tereticornis,
Tristania suaveolens, Acacia cincinnata, A. flavescens and Banksia compar (Type
16e: Tracey 1982). Eucalyptus woodland (EW) sites ranging in altitude between 700
and 640 m (a.s.l.) were located in medium woodland on granite. This forest type had
a relatively open canopy that included Eucalyptus acmenioides, E. tereticornis, E.
intermedia, Syncarpia glomulifera, Tristania suaveolens, Melaleuca viridiflora,
Acacia flavescens, Allocasuarina littoralis and Xanthorrhoea johnsonii (Type 16m:
Tracey 1982).
Surveys were undertaken at each site in June and September in 2004, January,
April (excluding the WSF sites) and September in 2005 as well as January and May
2006. A detailed explanation of the sample design including how the fungal survey
sites were selected as well as the hypogeous fungal sampling protocol are given in
Abell et al. (2006).
4.2.2 Assessment of fungal diversity
Fungal sporocarps were identified (Appendix) using current and unpublished
preliminary keys provided by and with the guidance, where possible, of experts in the
field; Dr Teresa Lebel of the Royal Botanic Gardens Melbourne Australia and Dr
James Trappe of the Department of Forest Science Oregon State University Corvallis,
USA.
Abell et al. (2008b) Ecosystems in review
54
A detailed description of how the assessment of fungal diversity was carried out is
given in Abell (2008a; Chapter 3). The species richness (S) was compared to the
Shannon-Weiner Richness Index (H’) for the three vegetation types.
4.2.3 Light/ Temperature
Light levels and temperature were not measured directly. Instead a surrogate
measurement, canopy cover was used. Canopy cover at each site was determined by
estimating the percent coverage when standing at the center of each 50 x 20m quadrat,
at the time of each survey. To determine the light level, the opposite of canopy cover,
the canopy cover percentages were converted into reciprocal (1/canopy cover)
proportions. The mean (SE) light levels for each vegetation type were then
calculated. Light availability is generally positively correlated with temperature and
the same values of light availability were used to also infer temperature levels for
each site.
4.2.4 Soil analysis
Two sealed bags of topsoil were collected from 5m up-slope and 5m down-
slope from the centre of each quadrat at the time of each survey (n=7). Upon return to
the laboratory the soil was dried, and the mean soil moisture (mL/g) was determined
for each site per survey. Samples were then resealed and stored in a cool dry
environment awaiting nutrient analysis.
A total of 240 soil samples were collected from 18 sites (12 in one survey) and
seven surveys. Pooling of the soil samples (36 WSF; 42 AF, EW) was performed in
an attempt to remove the expected effect of temporal (between surveys) and spatial
(between quadrats) differences of soil nutrient status within sites.

Abell et al. (2008b) Ecosystems in review
55
This was achieved by combining equal portions of soil from each survey into one
homogenous soil sample, including two replicates (above and below quadrat centre)
for each site. A total of 36 (18 sites x 2 replicates) samples were subsequently sent
for analysis to the Tropical Vegetation Dynamics Research Group, School of Marine
and Tropical Biology, James Cook University, Townsville campus, Queensland
Australia. Nine of the original samples were repeated to ensure accuracy of the
chemical analysis.
Samples were first passed through a 2mm sieve to separate the fine earth
fraction from gravel, then the single digestion method of Anderson and Ingram (1989)
for the determination of N, P and cations was performed. Total Nitrogen (µg/g) was
determined colorimetrically by the salicylate-hypochlorite method of Baethgen &
Alley (1967), and Total Phosphorus (µg/g) by an adaptation of Murphy and Riley’s
(1967) single solution method (Anderson and Ingram 1989).
4.2.5 Data analysis
The data obtained for sporocarp abundance, biomass, soil moisture and light
availability did not conform to expectations of normality (Levene’s equality of
variances: F2, 117 = 1.779; P =0.173; F2, 117 = 4.233; P < 0.05; F2, 117 = 6.389; P <
0.01; F2, 117 = 14.292; P < 0.01 respectively). Therefore, Kruskal–Wallis one-way
non-parametric analysis of variance (ANOVA) were used to compare mean sporocarp
abundance, biomass and light availability across vegetation types. When the data
were normal (soil nutrients, genera and species), one-way parametric ANOVA and
Bonferroni post-hoc tests were used. When comparing frequency of genera and
species occurrence in the different vegetation types, Pearson one-way non-parametric
chi square (χ2) analyses were used.

Abell et al. (2008b) Ecosystems in review
56
4.3 Results
4.3.1 Fungal species richness
A total of 49 species of hypogeous fungi were recorded from 1161
occurrences across the 18 sites (six per vegetation type), and seven surveys (six for
the WSF) (Table 4-1). Observations of species richness (S) indicated that there were
26 species from 197 occurrences in the WSF, 29 from 491 in the AF and 27 from 473
in the EW (Table 4-1). Shannon-Wiener diversity indices ranged from 2.38 in the
WSF, 2.60 in the AF and 2.54 in the EW. With all vegetation types pooled the
Shannon-Wiener diversity index was 3.05.
The total number of genera collected in the AF was higher compared to the
other vegetation types (Table 4-1). Eighteen genera were collected in the AF
compared to fifteen in both the WSF and EW (Table 4-1).
Of the genera that were collected thirteen (86.67%) from the WSF, fourteen
(77.78%) from the AF and twelve (80%) from the EW were shared between
vegetation types (Table 4-1). The remaining genera were collected solely from each
vegetation type, two (13.33%) from the WSF, four (22.22%) from the AF and three
(20%) from the EW (Table 4-1). However, there was no significant effect of
vegetation type on the mean number of genera (One-way ANOVA: F2 = 2.309; P =
0.134).
A similar pattern to the number of genera was found for the number of species
(Table 4-1). Of the species that were collected nineteen (70.37%) from the WSF,
eighteen (69.23%) from the AF and twenty (68.97%) from the EW were shared
between vegetation types (Table 4-1).

Abell et al. (2008b) Ecosystems in review
57
Table 4-1: The total list of species that were surveyed in three vegetation types: wet sclerophyll forest (WSF), Allocasuarina forest (AF) and Eucalyptus Woodland (EW)

Abell et al. (2008b) Ecosystems in review
58
The remaining species were collected solely from each vegetation type, eight
(29.63%) from the WSF, eight (30.77%) from the AF and nine (31.03%) from the EW
(Table 4-1). There was no significant difference for the proportion of unique species
between the vegetation types (Pearson: χ22 = 0.014; P = 0.993). There was no
significant effect of vegetation type on the mean number of species (One-way
ANOVA: F2 = 1.952; P = 0.176).
4.3.2 Fungal abundance and biomass
There was a significant effect of vegetation type on sporocarp abundance
(Kruskal-Wallis: χ22 = 8.246; P < 0.05). The lowest ranking vegetation type overall
was the WSF (Figure 4-2). When this category was removed there was no significant
effect of vegetation type found (Kruskal-Wallis: χ21 = 0.588; P = 0.443). Post-hoc
pairwise comparisons confirmed that the WSF had significantly less sporocarps
compared to the other vegetation types (Figure 4-2).
There was a significant effect of vegetation type on sporocarp biomass
(Kruskal-Wallis: χ22 = 9.982; P < 0.01). The highest ranking vegetation type overall
was the AF (Figure 4-2). When this category was removed there was no significant
effect of vegetation type found (Kruskal-Wallis: χ21 = 1.392; P = 0.238). Post-hoc
pairwise comparisons confirmed that the AF had significantly higher sporocarp
biomass than both the EW and WSF and there was no difference between the latter
vegetation types (Figure 4-2).

Abell et al. (2008b) Ecosystems in review
59
Figure 4-2: The mean (±1SE) sporocarp abundance (white columns) and biomass (grey columns) surveyed in the wet sclerophyll forest (WSF; n=36), Allocasuarina forest (AF; n=42) and Eucalyptus woodland (EW; n=42). * Significant difference

Abell et al. (2008b) Ecosystems in review
60
4.3.3 Moisture
As expected the observed mean soil moisture differed significantly among the
vegetation types (Figure 4-3a, Kruskal-Wallis: χ22 = 37.428; P < 0.01). The highest
ranking vegetation type was the WSF followed by the AF (Figure 4-3a). When the
lowest ranking vegetation type (EW) was removed there was no significant difference
between the AF and WSF vegetation types (Kruskal-Wallis: χ21 = 2.859; P = 0.091).
Figure 4-3: The mean (±1SE) a) soil moisture and b) light availability (inverse proportion of canopy cover) from the wet sclerophyll forest (WSF), Allocasuarina forest (AF) and Eucalyptus woodland (EW). * Significant difference

Abell et al. (2008b) Ecosystems in review
61
4.3.4 Light/ Temperature
The observed mean light/ temperature availability (inverse proportion of
canopy cover) increased significantly across the altitude gradient (Figure 4-3b). Post-
hoc pair-wise comparisons confirmed that there was a significant difference in light
availability between all three vegetation types (Kruskal-Wallis: EW/AF/WSF χ22 =
61.340; P < 0.01; EW/AF χ21 = 39.716; P < 0.01: EW/WSF χ2
1 = 45.213; P < 0.01;
AF/WSF χ21 = 7.810; P < 0.01; Figure 4-3b).
4.3.5 Nutrients
There was a significant effect of vegetation type on total soil nitrogen (µg/g)
(One-way ANOVA: F2 = 6.119; P < 0.01). The EW vegetation type had significantly
less nitrogen compared to the other vegetation types (Figure 4-4a). There was also a
significant effect of vegetation type on total soil phosphorous (P) (µg/g) (One-way
ANOVA: F2 = 8.247; P < 0.01), with the WSF vegetation type having significantly
more phosphorous compared to the other vegetation types (Figure 4-4b).
4.4 Discussion
The number (S) and species richness (H’) of hypogeous ectomycorrhizal
sporocarps did not vary between the vegetation types. The number and species
richness were similar in the WSF (26; 2.38), AF (29; 2.60) and the EW (27; 2.54).
The fungal community structure observed suggests little if any host association
(potential host specificity) at this location. The spatial distribution of ectomycorrhizal
fungi did not vary significantly across the ecotonal gradient from WSF, through AF to
EW, with the majority of genera and species shared between the vegetation types
(Table 4-1).

Abell et al. (2008b) Ecosystems in review
62
Figure 4-4: The mean (±1SE) a) total soil nitrogen and b) soil phosphorous (µg/g) sampled from the wet sclerophyll forest (WSF), Allocasuarina forest (AF) and Eucalyptus woodland (EW). * Significant difference

Abell et al. (2008b) Ecosystems in review
63
Genera that were ubiquitous in all vegetation types included Aroramyces,
Austrohysterangium, Chondrogaster, Royoungia, Sclerogaster and Zelleromyces
(Table 4-1).
Genera shared between the WSF and the AF included Castoreum, Gautieria,
Pogisperma and Stephanospora (Table 4-1). Genera shared between the AF and EW
included Dingleya, Endogone and Mycoamaranthus (Table 4-1). Mesophellia and
Scleroderma were shared only by the WSF and the EW (Table 4-1). This latter
association was the only indication of potential host specificity found. Mesophellia
and Scleroderma appear to prefer vegetation dominated by Eucalypts rather than
Allocasuarina. This is consistent with current distribution records. Mesophellia are
found to be associated with natural and planted Eucalyptus forests in Australia and
like Scleroderma are associated with Eucalyptus plantations outside of Australia
(Bougher and Lebel 2001; Giachini et al. 2004; Trappe et al. 1996). Low host
specificity is also consistent with the findings of previous studies of hypogeous fungi
in Australia (Bougher and Lebel 2001; Bougher and Tommerup 1996; Malajczuk et
al. 1982; Smith and Read 1997).
While richness and taxonomic assemblage did not vary between vegetation
types, abundance of sporocarps was significantly lower in the WSF compared to the
other forest types, and biomass was significantly higher in the AF (Figure 4-2). This
finding appears to contradict previous studies showing a clear link between average
monthly precipitation and fungal fruiting at a seasonal scale (Abell et al. 2008a;
Chapter 3).

Abell et al. (2008b) Ecosystems in review
64
Previous studies predict both species richness and productivity should have
been equivalent and higher in the WSF and AF forest types (high soil moisture), than
in the EW (low soil moisture) (Figure 4-3a). The EW did have a lower biomass than
the AF, which could be attributed to the significant difference in soil moisture
between these two vegetation types (Figure 4-3a). However, biomass was equivalent
between the WSF and EW (Figure 4-2). Overall, the observed pattern of productivity
could not be due to a positive correlation with soil moisture (Figure 4-3a). Other
abiotic factors that may influence productivity include light/temperature and nutrient
levels.
Higher light availability has been found to increase the formation of
ectomycorrhizas (Reid et al. 1983) and is expected to increase the availability of
sporocarps due to the positive association between increased current photosynthate
supply and fruiting found in numerous studies (Godbout and Fortin 1990, 1992;
Hacskaylo 1965; Hogberg et al. 2001; Lamhamedi et al. 1994; Last et al. 1979; Nara
et al. 2003; Norton et al. 1990; Simard et al. 1997a).
Light availability can also be used as a surrogate measurement of temperature.
Increased temperature has also been found to improve ectomycorrhizal formation
(McInnes and Chilvers 1994). Light availability/ temperature were significantly
lower in the WSF than in the other two vegetation types (Figure 4-3b), a pattern
consistent with the observed differences in sporocarp production (Figure 4-2).
However, the AF also had significantly lower light/temperature levels as compared to
the EW (Figure 4-3b) and the highest sporocarp production (both abundance and
biomass) occurred at intermediate light/temperature levels (Figure 4-2).

Abell et al. (2008b) Ecosystems in review
65
There was a higher production of sporocarps found within the intermediate
light/temperature forest type, AF (Figure 4-3b). Therefore, light/ temperature
variation could not explain the pattern of productivity observed.
High nutrient levels, especially of nitrogen (Lilleskov et al. 2001) and
phosphorous (Bougher et al. 1990) are known to influence ectomycorrhizal formation,
production of extramatrical mycelium and sporocarps (Wallander 1995; Wallander
and Nylund 1992). According to the carbohydrate hypothesis (Bjorkman 1940, in
Wallander 1995), a host will allocate less carbohydrates to the fungus at higher levels
of nutrient supply (phosphorous and nitrogen), because of greater carbon demand by
the host for shoot production. In contrast, Wallander (1995) suggests that it is the
fungus, not the host that partitions carbon supply. Even relatively small increases in
nitrogen are predicted to reduce the ability of the fungus to allocate carbon away from
nitrogen assimilation, to its own reproduction and growth (Trudell and Edmonds
2004; Wallander 1995). Regardless of the mechanism involved, both models predict
that fungal growth is reduced as soil nitrogen levels increase.
On the other hand, low phosphorous is thought to counteract the effect of high
nitrogen levels (Wallander 1995; Wallander and Nylund 1992). It does this by
reducing plant shoot growth and thus the nitrogen demand of the host (Wallander
1995; Wallander and Nylund 1992). This means that under low phosphorous
conditions fungi will be better able to partition carbon into reproduction and growth,
as well as into nitrogen assimilation (Wallander 1995; Wallander and Nylund 1992).

Abell et al. (2008b) Ecosystems in review
66
The negative effect of nitrogen on ectomycorrhizal communities have been well
documented along anthropogenic nitrogen deposition gradients and in nitrogen
fertilisation experiments (see Trudell and Edmonds 2004). Aspects of these
hypotheses have only once been tested in natural ecosystems (Trudell and Edmonds
2004) and never across an undisturbed ecotonal gradient.
In the current study, significantly higher levels of both nitrogen and
phosphorous were found within the WSF soils (Figure 4-4). Soils around the nitrogen
fixing Allocasuarina spp. within the AF also had higher nitrogen levels, compared to
the levels found for the EW (Figure 4-4a). Unlike the WSF, the AF had a low level of
phosphorous (Figure 4-4b). As discussed previously, low phosphorous counteracts
the effect of high nitrogen by reducing plant shoot growth, thus the nitrogen demand
of the host, allowing the fungus to partition carbon to reproduction and growth as well
as nitrogen assimilation (Wallander 1995; Wallander and Nylund 1992). The higher
abundance and biomass of fruiting bodies in the AF can be explained by the
significantly lower availability of phosphorous in the soil (Figure 4-4b). This is the
first time that the spatial distribution of hypogeous ectomycorrhizal fungal organisms
could be explained in terms of their physiological functioning along a natural
moisture and nutrient gradient.
The relative levels of soil nutrients observed are also consistent with what is
known of the ecological process associated with the different over-story vegetation
types. Mineralisation of nitrogen and phosphorous can occur at a faster rate with
higher moisture levels (Trudell and Edmonds 2004). Therefore, higher estimated soil
moisture (Figure 4-3a) in the WSF forest, may explain the increased level of nitrogen
and phosphorous found in the soil there (Figure 4-4).

Abell et al. (2008b) Ecosystems in review
67
The WSF also contains a high proportion of rainforest tree species (Harrington and
Sanderson 1994) and rainforest leaves are known to be more easily degraded than
sclerophyll leaves (Read and Perez-Moreno 2003). Higher moisture (mineralisation),
reduced fire frequency and subsequent invasion by rainforest species, may have
contributed to the increased nutrient load in the soil of the WSF.

68
Chapter Five: Micro-spatial Distribution Of Tropical
Ectomycorrhizal Hypogeous Fungi
5.1 Introduction
Despite the ecological importance of hypogeous fungi in many ecosystems,
few studies have attempted to identify factors responsible for either the availability or
richness of fungi within specific communities (Abell et al. 2008b; Chapter 4; Claridge
et al. 2000a). The scale at which species distributions are analysed is an important
ecological consideration (Levin 1992 ; Schneider 2001; Wiens 1989) as hypogeous
fungal communities may be shaped by multiple abiotic and biotic variables with
different factors being more or less important at different temporal and spatial scales
(Meyer and North 2005).
At the largest spatial scale of landscape, studies in temperate ecosystems have
shown precipitation (North 2002), elevation and moisture gradients (Claridge et al.
2000a) to be the factors most likely to affect hypogeous fungal species occurrence. In
the tropics little is known about the processes influencing spatial variation at this scale
but at one location season-to-season variation in sporocarp availability, richness and
taxonomic richness were correlated with annual patterns of precipitation (Abell et al.
2008a; Chapter 3; Abell et al. 2006).
At the more localised spatial scale of between forest-stands, temperate studies
suggest that differences in forest structure (North et al. 1997; Smith et al. 2002), host
specificity (Bills et al. 1986; Loeb et al. 2000; Nantel and Neumann 1992; Villeneuve
et al. 1989) and forest age (Luoma et al. 1991; Vogt et al. 1981 ) are the most
important determinants of hypogeous fungal distribution and abundance.

69
In contrast, in tropical ecotonal sclerophyll forest phosphorous levels have been
shown to be more important determinants of hypogeous sporocarp availability
(abundance and biomass) but not of taxonomic richness (Abell et al. 2008b; Chapter
4). It is clear that the factors driving hypogeous fungal community structure in
temperate regions are not necessarily the same as those in the tropics.
At the finest micro-spatial scale of individual sites, the factors responsible for
hypogeous fungal sporocarp availability and taxonomic richness are less clear-cut.
Instead the relationships appear to be taxon or species-specific. Many different
microhabitat variables have been documented influencing the distribution and
diversity of individual hypogeous fungal taxa. For example, fungal species can be
influenced by the presence/absence of decaying logs (Amaranthus et al. 1994;
Claridge et al. 2000a; North and Greenberg 1998), orientation and size of fallen logs
within a site (Maser and Trappe 1984), depth and cover of leaf litter (Beaton et al.
1985; Claridge et al. 2000a; Claridge et al. 1993; Johnson 1994a), slope and aspect
(Claridge et al. 2000a; Claridge et al. 1993), soil moisture and nutrient status (Perry et
al. 1987) (Claridge et al. 1993; Johnson 1994a), altitude (North 2002) as well as
topography (Claridge et al. 2000a; Claridge et al. 1993). Site-specific interactions
among these variables have been tested in very few of those studies. As with results
for other spatial scales these findings have been generated primarily from temperate
ecosystems.
Data at other spatial scales clearly suggests tropical fungal communities
function differently and that data from temperate studies cannot easily be extrapolated
to tropical systems. Currently there are no data available to determine which, if any,
of the above factors are important at the micro-spatial scale in the tropics.

70
Previous data at the larger forest-stand scale show that phosphorous is the most likely
determinant of overall hypogeous sporocarp availability in the tropics (Abell et al.
2008b; Chapter 4). This may also be true at the smaller micro-spatial scale but is, as
yet, untested. No clear picture of the factors determining taxonomic richness in the
tropics has previously been obtained from studies at larger spatial scales (Abell et al.
2008b; Chapter 4). Therefore, variables operating at the finest micro-spatial scale
may also be more important in explaining patterns at these larger scales.
The aim of this chapter is to identify the relative importance of different
environmental variables in influencing the micro-spatial scale distribution of both
availability (sporocarp abundance and biomass) and richness (genus and species) of
ectomycorrhizal hypogeous fungi across an ecotonal altitude gradient. Since previous
evidence points to low phosphorous levels being an important determinant of
hypogeous fungal availability at larger scales (Abell et al. 2008b; Chapter 4), the
primary analysis in this chapter will focus on establishing if this is also true at smaller
spatial scales.
In an hierarchical analysis this chapter will first examine how much variation
in fungal availability and richness can be explained by a) soil phosphorous using
simple regression analysis and then b) multiple microhabitat variables that have been
known to influence the distribution of individual hypogeous fungal species in
temperate systems. This second analysis will be undertaken using an Information
Theoretic Model Comparison (ITMC) approach (Burnham and Anderson 1998). This
will allow interactions between variables to be examined as well as the most plausible
and parsimonious model(s) to be identified to help explain the factors driving
hypogeous fungal species distribution at the micro-spatial scale within tropical
ecotonal sclerophyll forest.

71
5.2 Methods
The study site was located at Davies Creek on the Lamb Range in far North
Queensland, Australia (145o35’E, 17o01’S). Six fungal survey sites were positioned
in each of three forest types (n =18); wet sclerophyll Forest (WSF) (Type 14b: Tracey
1982), Allocasuarina forest (AF) (Type 16e: Tracey 1982) and Eucalyptus woodland
(EW) (Type 16m: Tracey 1982) that comprised ecotonal wet to moist (respectively)
vegetation along an altitude gradient.
A detailed explanation of the sample design, including how the fungal survey
sites were selected as well as the hypogeous fungal sampling protocol are given in
Abell et al. (2006). A description of how the assessment of fungal diversity was
carried out is detailed in Abell et al. (2008a; Chapter 3) and a site map is available in
Abell et al. (2008b; Chapter 4). Surveys were undertaken at each site in June and
September 2004, January, April (excluding the WSF sites) and September 2005 and
January, May 2006.
At the time of each survey abiotic and biotic microhabitat measurements were
recorded following the protocol of Claridge et al. (2000a). Abiotic factors included
soil nitrogen, phosphorous and moisture (as per Abell et al. (2008b; Chapter 4)),
topographic category (ridge, upslope, midslope, downslope or gully), site aspect
(North, East, South or West), slope measured using an inclinometer and rock cover
(%) estimated at site center.
The biotic variables were measured as either an estimated vegetation percent
cover from site centre, or by counting within a 2 x 50m transect that ran through the
centre (one metre either side) on the long axis of each quadrat.

72
Percent cover measurements included canopy cover, understorey cover (above head-
height), ground cover (below head-height), litter cover and coarse woody debris.
Transect variables included number of potential host species including Eucalyptus and
Allocasuarina stems the number of non-ectomycorrhizal host species including
Acacia and rainforest stems, as well as number of stags (standing dead trees), fallen
trees, fallen trees lying across the slope and large (>50cm diameter) fallen trees. The
number of small animal (bettong/ bandicoot) diggings within the transect were also
recorded within the transect. Litter depth (mm) was measured by averaging thirteen
random measurements taken within each quadrat.
5.2.1 Data Analysis
Previous evidence suggests soil phosphorous levels may significantly
influence the spatial availability of hypogeous fungi (Abell et al. 2008b; Chapter 4;
Bougher et al. 1990; Johnson 1994a). Therefore, prior to any other analyses multiple
curve-fits were analysed relating soil phosphorous with the dependent variables being
fungal abundance, biomass, number of genera and species. The equation (i.e. linear,
logarithmic, exponential etc.) that fitted best to the data (highest r2 value and lowest P
value) for each dependent variable was subsequently presented.
As previous studies provide multiple potential hypotheses to explain the
distribution of hypogeous fungi, traditional null hypothesis testing with regression
analyses were not appropriate to use in this instance (Burnham and Anderson 1998).
The Information Theoretic Model Comparison (ITMC) approach is suitable to use
when there are multiple hypotheses to test (Burnham and Anderson 1998). Using
ITMC means that it is possible to simultaneously compare different plausible models
leading to the selection of one (or a smaller set) best approximating model (Burnham
and Anderson 1998).

73
This was performed by fitting general linear regression models (GLM) to the data that
combined multiple hypotheses to explain the dependent variables abundance and
biomass (g) (sporocarp availability) as well as species and genera number (richness).
The independent microhabitat variables used in the analyses, were chosen
based on a previous study by Claridge et al. (2000a). A reduced version of the data
set was derived by averaging the data from seven surveys for each site (18). This
removed the expected temporal variability associated with rainfall levels (Abell et al.
2008a; Chapter 3) as well as reduced the number of zeros contributed by particular
surveys. This also normalised the data but there were more independent than
dependent variables.
Accordingly, a principal components analysis (PCA) using SPSS software
(Version 16.0, http://www.spss.com) was used to summarise the environmental
variables into a smaller subset (23 reduced to 5) of independent variables and also
remove the confounding effects of colinearity (Graham 2003). The strength of the
PCA was checked by repeating the analysis using standardised variables and this did
not change the factor scores or loadings.
Multiparameter candidate models were developed using different
combinations of the principal coordinate variables. Akaike Information Criterion
(AIC) were used to determine the most parsimonious model(s) for each of two
dependent variables (the number of genera and the number of species) (Burnham and
Anderson 1998). As the sample size (n=18) was small (n/K>40) compared to the
number of variables (K=5), the second order Akaike bias correction parameter (AICc
= AIC + 2K(K+1)/n-K-1) was used, as recommended by Burnham and Anderson
(1998). The model with the lowest AICc value was designated as the AICmin.

74
The relative support for each model was determined by comparing the AICmin with
each models own AIC value (Δi = AICi - AICmin) (Burnham and Anderson 1998).
Those with the lowest AICc values that were within 2 AIC units (Δi ) of the lowest
value were considered as candidate models (Burnham and Anderson 1998). Akaike
weights (wi = exp(-Δi/2)/ ΣRr=1 exp (-Δr/2)) were used as a measure of the relative
likelihood (probability) of each model (Burnham and Anderson 1998).
The smallest subset of candidate models that summed to 0.95 (wi), were used
to generate the 95% confidence limits for each model (Burnham and Anderson 1998).
The probability that an independent variable was contained in the best approximating
model was obtained by calculating the sum of the wi (Selection Probability) and the
associated confidence limits (95% CL Selection probability) by summing the 95% CL
wi, for each model containing that variable (Burnham and Anderson 1998). Lastly,
the maximum log likelihood χ2 values for each model were examined for
significance.
Linear regressions were then fitted, testing each dependent variable including
abundance, biomass, number of genera and number of species against the significant
and most plausible AIC determined principal component(s).
5.3 Results
5.3.1 Soil phosphorous regressions
There were significant correlations between mean soil phosphorous and mean
sporocarp abundance (y = 38.042e0.016x; r2 = 0.4713; F1,17 = 14.263; P < 0.01:
exponential) (Figure 5-1a). Mean soil phosphorous and mean sporocarp biomass
were also negatively correlated (y=19.28e-0.0247x; r2 = 0.388; F1,17 = 10.146; P < 0.01:
exponential) (Figure 5-1b).

75
There was a weak correlation between mean soil phosphorous (x) and the mean
number of genera (y = 2.7094e-0.0079x; r2 = 0.238; F1,17 = 4.986; P < 0.05:
exponential) (Figure 5-1c). The mean number of species (y) was also weakly
correlated with the mean soil phosphorous (y = 4.073e-0.0102x; r2 = 0.375; F1,17 =
9.588; P < 0.01: exponential) (Figure 5-1d).
When the outlier was removed the relationships for phosphorous and the mean
number of genera (r2 = 0.001; F1,16 = 0.017; P = 0.898) and also the mean number of
species (r2 = 0.052; F1,16 = 1.216; P = 0.381) were no longer significant.
Figure 5-1: Inverse exponential relationships between a) mean sporocarp abundance, b) mean sporocarp biomass, c) mean number of genera and d) mean number of species with mean soil phosphorous per site.
76
5.3.2 Principal components interpretation
The PCA with varimax raw rotation summarised 23 independent variables to
five (as determined by a scree plot) principal components (Table 5-1). The first five
principal components of the PCA explained 81.32% of the total environmental
variance among sites (Table 5-1). The first principal component (PC1) was mainly
defined by a negative association with the number of Eucalyptus stems and a positive
correlation with the number of Allocasuarina stems (Table 5-1). This axis was
interpreted as explaining the change in vegetation type across the gradient from the
WSF (High Eucalyptus, Low Allocasuarina), through the AF (Low Eucalyptus, High
Allocasuarina) to the EW (High Eucalyptus, Low Allocasuarina). The second
principal component (PC2) was related to the abiotic site characteristics and was
defined by a negative association with slope and rock cover (Table 5-1). Principal
component three (PC3) was defined simply by aspect (Table 5-1).
Principal component four (PC4) was defined by soil phosphorous, altitude, the
number of rainforest stems, understorey vegetation percent cover and soil moisture
(Table 5-1). This axis was interpreted as explaining the increase in altitude across the
environmental gradient as it was considered to be the most likely causative variable
within the principal component (Table 5-1). Principal component five was interpreted
as the axis explaining the biotic structure of the site as it was defined by a negative
correlation with the percent of ground cover present as well as a positive relationship
with the amount of coarse woody debris within the sites.

77
5.3.3 Statistical Modelling
The number of significant plausible models explaining the distribution of
hypogeous fungi at the micro-spatial scale, as determined by a Δi of less than two and
the significance of the maximum log-likelihood ratio was relatively small compared
to the potential models available (Table 5-2). Out of a set of 31 potential models for
each dependent variable, three (9.7%) were considered plausible for the mean number
of genera and three (9.7%) for the mean number of species (Table 5-2). Plausible
models consistently included the index of vegetation type PC1 (83.3%), followed by
the index of increasing altitude PC4 (66.7%) (Table 5-2). Represented less frequently
(16.7%) were PC2 and PC5, which were the abiotic and biotic site structure indices
respectively (Table 5-2). The index of site aspect PC3 was not included in any
plausible model (Table 5-2).
Table 5-1: Principal component scores of the environmental variables measured at seven surveys from 18 sites (12 in one survey). The main structuring variables (>0.70) determined after varimax raw rotation for each principal component are indicated in bold type.

78
Consistent second-order interactions were found between vegetation type PC1 and
altitude PC4, with this interaction occurring three times within plausible models
(Table 5-2). Less consistent second-order interactions included vegetation type PC1
with abiotic site structure PC2 (16.7%) as well as PC1 with abiotic site structure PC2
(16.7%). There were no significant interactions for PC1 with either site aspect PC3,
or biotic site structure PC5 (Table 5-2). Only a single significant third-order
interaction was observed between vegetation type PC1, altitude PC4 and biotic site
structure PC5 (Table 5-2).
Overall, the most significant model explaining mean number of genera (y) per
site was the positive relationship with vegetation type PC1 (x) (AICmin: χ2 = 8.0332; P
< 0.01) (y = 0.3036x + 1.3639; r2 = 0.379; P < 0.01: Linear) (Table 5-2a; Figure 5-
2). This single variable model had the highest selection probability at 95.41% (±
0.0536). Other less likely models included a first-order interaction between
vegetation type PC1 and altitude PC4 (AIC: Δi =1.2493; χ2 = 9.3339; P < 0.01), as
well as PC1 and abiotic site structure PC2 (AIC: Δi =1.9661; χ2 = 8.6171; P < 0.05)
(Table 5-2a). The selection probabilities for these models were well below 50%
(Table 5-2a) and could therefore be excluded.

79
Table 5-2: Plausible models generated to explain the distribution of hypogeous fungi using the ITMC approach for a) number of genera and b) number of species, based on 23 microhabitat variables that were summarised into five principal component independent variables (PC1–5). The table includes AICc values, AICc differences (Δi), AIC weights (wi), 95% confidence limits (95% CL wi), log likelihood ratio (L.Ratio χ 2) and associated P values. Significant models are in bold type.

80
The most plausible model relating site characteristics to the mean number of
fungal species was an interaction between vegetation type PC1 and altitude PC4 (AIC:
Δi =0.000; χ2 = 6.9766; P < 0.05) (Linear: y = 1.62 + -0.27PC4 + 0.23PC1; r2 =
0.374; P < 0.05) (Table 5-2b; Figure 5-3). Other less plausible models included a
third-order interaction between vegetation type PC1, altitude PC4 and biotic site
structure PC5 (AIC: Δi =1.9821; χ2 = 7.9088; P < 0.05) (Table 5-2b). A first order
interaction with altitude was also found (AIC: Δi =0.5213; χ2 =3.9053; P < 0.05)
(Table 5-2b). The highest selection probabilities for the number of species were
altitude PC4 at 71.52% (± 0.0444), followed by vegetation type PC1 at 58.72% (±
0.0364) (Table 5-2b).
Figure 5-2: The positive correlation between vegetation type PC1 with the mean number of genera. The number of genera increase with the number of Allocasuarina and decrease with the number of Eucalyptus stems.

81
There were no significant models that related microhabitat site variables to
sporocarp abundance (AICmin: χ2 = 2.5273; P = 0.119) or biomass (AICmin: χ2 =
2.8328; P= 0.0924).
Figure 5-3: The interactive effect of proximity to rainforest PC4 and vegetation type PC1 on the mean number of species. Mean number of species increases with the number of Allocasuarina stems and an increase in altitude.

82
5.4 Discussion
At the micro-spatial scale, significant negative relationships were found
between phosphorous concentration and both the availability (abundance and
biomass) and richness (genera and species) of hypogeous fungi (Figure 5-1). There
were no plausible models found for abundance or biomass using the ITMC approach.
While this relationship still requires further in-situ experimental confirmation, it
provides further evidence that in general both among forest stands and sites high
phosphorous levels significantly decrease sporocarp production of hypogeous fungi in
tropical ecotonal sclerophyll forest (Figure 5-1; (Abell et al. 2008b; Chapter 4). The
functional mechanisms behind this observed association have been discussed
previously in Abell et al. (2008b; Chapter 4).
In contrast the correlations detected between phosphorous levels and fungal
species and genera richness were weak and obviously a function of only a single data
point in each case (Figures 5.1c; 5.1d). This suggests that at best phosphorous
concentration is only one of a number of factors affecting fungal taxonomic diversity
at the micro-spatial scale. Similarly, when the distribution of species and genera were
examined using the ITMC analysis the selection probabilities for the abiotic (PC1),
biotic (PC5) and aspect (PC3) axes were all well below fifty percent. Therefore,
factors associated with these axes (Table 5-1; 5-2) were not considered to
significantly influence hypogeous fungal distribution.
The strongest correlate of fungal richness at the site scale was the index of
host-type availability (Table 5-2). Both the mean number of fungal genera and
species increased with the number of Allocasuarina stems and decreased with the
number of Eucalyptus stems among sites (Table 5-1 and 5-2; Figure 5-2 and 5-3).

83
Allocasuarina species are known to form ectomycorrhizal associations (Reddell et al.
1986; Warcup 1980), but a lack of long-term fungal sporocarp surveys in forests
dominated by Allocasuarina has meant that the relative importance of these
associations has been unknown. The current data confirm that Allocasuarina are
important ectomycorrhizal hosts in this system. They also suggest that Allocasuarina
are able to form ectomycorrhizal relationships with more fungal genera and species
and may have broader host receptivity than the Eucalyptus species present.
This finding is significant, as it suggests that previously the relative importance of
Allocasuarina as host species may have been substantially underestimated.
Allocasuarina is considered to be an invasive climax species that utilise
allelopathy to increase its dominance within sclerophyll ecosystems (Lunt 1998;
Withers 1978). This effectively reduces the ability of other plant species to recruit in
the absence of disturbance, especially fire (Lunt 1998; Withers 1978) and defines
Allocasuarina forests as monodominant. Our findings further suggest that the ability
of Allocasuarina species to invade and then dominate patches within sclerophyll
forest may also be a function of their higher ectomycorrhizal fungal receptivity.
Ectomycorrhizal communities are generally characterised as having a low host
diversity and high fungal diversity compared to endomycorrhizal communities (Allen
et al. 1995; Connell and Lowman 1989; Janos 1985). There are many examples of
ectomycorrhizal communities with poor plant host diversity. These include northern
hemisphere conifer and oak forests, southern hemisphere Nothofagus forests and also
monodominant forest stands that even occur alongside, or within, diverse tropical
rainforests (Allen et al. 1995). Monodominant stands also tend to occur on nutrient
poor soils, deficient in nitrogen and/or phosphorous (Allen et al. 1995).

84
Unlike endomycorrhizal fungi, ectomycorrhiza are able to scavenge as well as
liberate (hydrolyse) otherwise unavailable organic forms of nitrogen and phosphorous
(Lambers et al. 2008). The improved access to nutrients that ectomycorrhizal plants
have due to fungal scavenging may explain their ability to colonise, then maintain
monodominance within nutrient poor soils (Janos 1985) (Allen et al. 1995; Connell
and Lowman 1989). The most plausible model relating the test variables to the
number of hypogeous fungal species was an interaction between the index of host
availability and altitude (Table 5-2; Figure 5-3).
As well as increasing with the number of Allocasuarina stems, the number of
hypogeous fungal species increased at higher altitudes (Figure 5-3). At higher
altitudes moisture levels were also higher and there was an associated increase in soil
phosphorous, number of rainforest stems and understorey cover (Table 5-1).
Therefore, fungal species diversity was related to soil phosphorous levels in a pattern
opposite to that observed for sporocarp abundance and biomass (Figure 5-1a; 5-1b).
Instead of a decrease, fungal species number increased with increasing phosphorous
levels (Figure 5-3).
At higher altitudes an increase in Allocasuarina stems is correlated with an
increase in phosphorous, soil moisture (Abell et al. 2008b; Chapter 4), number of
rainforest stems and understorey cover (pers. obs.). Whereas, with an increase in
Eucalyptus stems at a lower altitude (Eucalyptus woodland and not wet sclerophyll)
there is a decrease in phosphorous, soil moisture (Abell et al. 2008b; Chapter 4),
number of rainforest stems and understorey cover (pers. obs.). Therefore, due to the
correlation between PC1 and PC4 it is difficult to determine which is the causative
factor.

85
The altitude axis (Figure 5-3) may simply reinforces the positive correlation between
the number of hypogeous fungal species and the number of Allocasuarina stems.
In summary, the results at the micro-spatial scale are the same as the patterns
previously found among forest stands (Abell et al. 2008b; Chapter 4). Soil
phosphorous levels are also essential environmental determinants of patterns of
sporocarp abundance and biomass at this smaller scale. The optimal conditions for
promoting hypogeous fungal diversity in this tropical ecosystem appear to be within
Allocasuarina forest, between the rainforest invaded wet sclerophyll forest at higher
altitudes, and the Eucalyptus dominated woodland at lower altitudes. The results
highlight the apparent broader host receptivity of Allocasuarina species and that
ecotonal sclerophyll monodominant forests, in comparison to mixed forest types,
support a higher hypogeous sporocarp fungal diversity.
86
Chapter Six: Thesis Synthesis
The aim of this thesis was to identify the relative importance of different biotic
and abiotic factors in determining both the a) temporal and b) spatial distribution of
hypogeous fungal taxa in a tropical ecotonal landscape. As predicted, factors that
contributed to changes in the distribution and abundance of tropical hypogeous fungi
differed in both time and space and were consistently different to phenomena previously
identified as being important in temperate studies. This chapter presents summaries of
the main findings of this thesis and the significance of those findings for managing the
endangered mammal species Bettongia tropica. Potential future research directions are
also outlined.
6.1 Diversity of hypogeous fungi
In total 49 morphological groups (species) of fungi were identified from 1161
occurrences recorded in this the first long-term study of hypogeous fungi in a tropical
ecosystem. While identification to genus was possible (with only one exception) using
current published and unpublished preliminary keys, a large proportion (84%) of
morphological groups were not able to be assigned species names. Preliminary
comparison to the literature suggests that at least one third (31%) of the morphological
groups are likely to be new species to science. This level of diversity is equivalent to that
found in Australian temperate regions, although this may need to be re-evaluated after
more rigorous examination of the samples. Taxonomic descriptions of these species are
ongoing and will be published elsewhere.
87
6.2 Temporal distribution of sporocarps
In temperate northern and southern hemisphere ecosystems fluctuations in fruiting
intensity and differences in the availability of ectomycorrhizal hypogeous fungal species
have been linked to both temperature variation and between season changes in moisture
availability. In contrast, the current study found that in the tropics, season per se, or
temperature alone were not directly associated with fungal fruiting, but that precipitation
was the sole factor driving the temporal distribution of tropical hypogeous sporocarps.
Both sporocarp abundance, and biomass (availability) were significantly correlated with
precipitation; the magnitude of each parameter being significantly reduced during the late
‘dry-season’ in most years. This is the first study to document an overall temporal
shortage of sporocarps in the tropics and an annual pattern of production that appears to
be unique to tropical systems.
Precipitation patterns also influenced fungal taxonomic assemblage. Extreme
rainfall contributed to a decrease in abundance and biomass of species from the genera
Chondrogaster, Hysterangium, Sclerogaster and Zelleromyces. Species of Gautieria and
Gummiglobus increased in biomass and abundance. The species/genera that decreased in
abundance all had similar life-history characteristics. They were always smaller in size
and at relatively greater densities than other taxa, characteristics suggesting that they
require less water to reproduce and may have a possible competitive advantage during the
dry season. In comparison, fungi that increased in abundance during high rainfall periods
were always relatively larger species that consistently occurred at lower densities. Taxa
that are likely to require more water to reproduce and so would have a reproductive
advantage during the wet season.

88
6.3 Spatial distribution of sporocarps
At the more localised spatial scale of between forest-stands, fungal taxonomic
assemblage did not differ among the three contiguous vegetation types; wet sclerophyll,
Allocasuarina forest and Eucalyptus woodland. The fungal community structure
observed suggested little if any host association (potential host specificity or preference)
at this scale and location. Previous studies identifying soil moisture as the principal
determinant of fungal abundance predicted that both species richness and productivity
should have been equivalent and higher in the wet sclerophyll and Allocasuarina forest
types (high soil moisture), than in the Eucalyptus woodland (low soil moisture). Reduced
sporocarp abundance and biomass were observed in the Eucalyptus woodland as
expected. However, counter-intuitively, less fungal productivity occurred in the wettest
forest type, wet sclerophyll forest than in the Allocasuarina forest.
Fine scale spatial analysis of relative differences in soil nutrient levels identified
the reason for this apparent anomaly. Both fungal abundance and biomass were reduced
in the presence of high soil nitrogen and phosphorous in the wet sclerophyll forest, while
the effect of high nitrogen availability was counteracted by low phosphorous levels in the
Allocasuarina forest. Importantly, these finding were consistent with laboratory based
studies on the relative importance of, and synergistic interactions between, these two soil
nutrients. This is the first time that field observations on the spatial distribution of
hypogeous ectomycorrhizal fungal organisms could be explained in terms of their
physiological functioning along a natural moisture and nutrient gradient.

89
These patterns were then examined at the finest micro-spatial scale of individual
sites. As expected the same relationships were found at this spatial scale as had been
observed at the forest-stand scale; there being negative correlations between soil
phosphorous levels and sporocarp abundance/biomass. However, at the finer scale,
changes in soil phosphorous did not adequately explain differences in patterns of species
richness observed among sites. Therefore, multivariate models incorporating a range of
other potentially important environmental variables at each site were compared using an
Information-Theoretic approach. There were no significant multivariate models found
linking any of these new factors to changes in abundance and/or biomass, thus
confirming that relative differences in phosphorous and nitrogen levels were the most
plausible explanation for variation in fungal availability at both the between forest-stand
and the micro-spatial scales.
In contrast, variations in the mean number of genera were best explained by an
index of vegetation type; a positive correlation with the number of Allocasuarina stems
and a negative correlation with the number of Eucalyptus stems. The most plausible
model describing changes in the mean number of fungal species was one that involved an
interaction between the indices of vegetation type and altitude. Species number increased
with an increase in altitude (along with soil moisture, phosphorous, number of rainforest
stems and understorey) and also by the number of Allocasuarina stems. That the number
of fungal taxa (both species and genera) was consistently correlated with the number of
Allocasuarina stems, suggests that Allocasuarina species may have a broader
ectomycorrhizal host receptivity than Eucalyptus species.

90
Ectomycorrhizal plant communities although low in host diversity
(monodominant) are generally more diverse in fungal taxa compared to mixed forest
types. Ecotonal sclerophyll forests become increasingly dominated by Allocasuarina in
the absence of fire or other disturbances. In this ecosystem an increase in host
monodominance appears to also increase fungal richness. This pattern of plant-fungus
taxonomic assemblage (i.e. the Ectomycorrhizal Hypothesis) has been found previously
for monodominant ectomycorrhizal rainforest stands (Connell and Lowman 1989; Janos
1985) but never for ectomycorrhizal sclerophyll forest.
6.4 Implications and recommendations for B. tropica
The endangered northern bettong, B. tropica is thought to be restricted to habitats
where the availability of hypogeous fungi, their principal food resource, remains
consistently high. In this study a relationship was found between annual precipitation
patterns and fungal availability. Fungal availability correlated strongly with the seasonal
rainfall pattern determined from 74-year monthly means and was significantly lower in
the late dry-season. This contrasted with a previously published study where mycophagy,
measured by bettong faecal analysis, remained high across all seasons, presumably
because of aseasonal rainfall during that study period. Based on my findings, hypogeous
fungi could not remain consistently available to bettongs throughout an average rainfall
year. This means that an alternative resource must be available to B. tropica during the
typical annual fungal shortage.

91
Alloteropsis semialata (cockatoo grass) use by bettongs increased significantly
during the period of low fungal availability. This suggests that the importance of
cockatoo grass as an alternative food resource during annual and extended dry periods
was previously underestimated. An important and possibly equivalent dependence of B.
tropica on both hypogeous fungi and A. semialata helps to explain the bettongs restricted
distribution, previously identified habitat preferences (Laurance 1997; Winter 1997) and
identifies this species as a true ecotonal specialist.
The principal findings of this thesis have important implications for the
management of B. tropica. The results have already been used to inform a new northern
bettong recovery plan. Understanding the factors influencing hypogeous sporocarp
production at both the temporal and spatial scales provides novel information including
a) potential reasons for historic and current population declines, b) the importance of
alternative resources during periods of low fungal availability as well as c) explanations
for bettong habitat restrictions.
Since European settlement, drought has interacted with a multitude of other
anthropogenic factors to cause the extinction of three out of five rat–kangaroo species in
New South Wales, Australia (Short 1998). Increasing drought frequency (or intensity)
may already have affected the range of B. tropica in Queensland, with population
contraction occurring to higher rainfall areas. Contraction appears to have occurred from
south to north (‘‘extinction’’ of the subtropical Rockhampton population and more
recently the decline in the tropical Coane Range population), and west to east
(‘‘extinction’’ of the low rainfall Kaban–Ravenshoe population).

92
The close link between hypogeous fungal availability and precipitation found in
this study suggests that this population contraction can be expected to continue as the
intensity and/or frequency of drought in Australia increases with global climate-change
(Hughes 2003; Kothavala 1999). My findings also suggest that small, relatively isolated
B. tropica populations will be especially vulnerable during times of drought. This
specifically includes the Coane Range, Carbine and Mt Windsor populations. Monitoring
rainfall patterns, may allow managers to implement drought mitigation protocols for
these populations as required.
The results presented here also highlight the importance of A. semialata as a
critical supplementary resource for B. tropica. This grass species does not respond well
to long-term over-grazing due to a low seed-bank abundance and early wet season
flowering (Crowley and Garnett 2001). After only moderate defoliation (as a surrogate
for grazing) in the early wet season, inflorescence production can be reduced for at least
two years (Crowley and Garnett 2001). It is believed that the recent change in tenure
from State Forest to National Park throughout most of B. tropica’s range may have
reduced the problems associated with over-grazing of this resource by cattle. However,
this assumption may require re-evaluation after modelling (using the
precipitation/fruiting relationship), establishes core habitat of B. tropica. An additional
threat to the ground-cover resources of B. tropica may be the feral pig Sus scrofus.
The reason that wet sclerophyll appears to be marginal habitat for B. tropica in the
Lamb Range area, may be due to associated changes in vegetation structure caused by a
lack of an adequate fire regime. Almost all wet sclerophyll sites in this study were found
to have a rainforest understorey.

93
This is thought to result from variable fire intensity failing to remove the rainforest
saplings, a process that results in sclerophyll trees dominating the canopy and rainforest
saplings dominating the understorey (Harrington and Sanderson 1994). Although this
does not appear to have a short-term effect on fungal abundance, it does affect the
distribution of other important food resources including A. semialata and Hypoxis lilies in
the understorey. This marginalisation of habitat also appears to be occurring within the
higher altitude Allocasuarina forests at Davies Creek. A lack of fire increases the canopy
cover of Allocasuarina trees making them the dominant species, again shading out the
groundcover resources of B. tropica.
While the increase in Allocasuarina monodominance may be detrimental to the
availability of bettong ground-cover resources, the importance of Allocasuarina hosts
should not be underestimated. The evidence suggests Allocasuarina trees are important
hosts in this ecosystem, significantly contributing to hypogeous sporocarp diversity.
Alloteropsis semialata is sensitive to fires during the growing season (early wet
season) (Everson et al. 1988). The managers should develop an adequate fire regime
ensuring that the fire intensity and regularity is suited, in particular, to the requirements
of A. semialata and other important groundcover species. Specifically fire should be
avoided during the early wet season. If there has been a particularly dry wet season, fire
should be avoided during the subsequent dry season, as stores in the shoot base of A.
semialata would most likely be depleted during growth, following fire. This will ensure
that adequate resources are available for B. tropica when fungal resources are limiting.

94
Alternatively, fire should be encouraged during wetter dry seasons when fungal resources
are available to make up for the depletion in the A. semialata resource during the time of
fire.
Relationships driving the spatial availability of hypogeous sporocarps determined
in this thesis also helps to clarify the habitat preference or restriction of B. tropica within
a narrow band (>10km) of wet to moist sclerophyll forest on the western margin of Wet
Tropics rainforest in Far North Queensland, Australia. Bettongia tropica relies on
hypogeous sporocarps for as much as 67% of their diet (Johnson and McIlwee 1997).
Previous studies have shown that B. tropica has a preference for ecotonal Eucalyptus
woodland and Allocasuarina Forest and tends to avoid wet sclerophyll forest (Laurance
1997; Winter 1997). Until now the reasons why B. tropica does not utilise wet
sclerophyll forest were unknown. Despite the availability of ectomycorrhizal plant hosts
as well as high moisture levels, expected to be beneficial for sporocarp production, high
nutrient levels appear to reduce the reproductive potential of hypogeous fungi in the wet
sclerophyll forest. Hypogeous fungal resource availability, in synchrony with other
crucial resources, clearly defines the habitat restriction of Bettongia tropica at both the
wet and dry end of the ecotonal gradient.

95
6.5 Future Research
6.5.1 Hypogeous fungi and their plant hosts
A number of new hypotheses have been generated from this thesis. Precipitation
appears to drive temporal availability as well as diversity of tropical hypogeous
ectomycorrhizal fungal sporocarps. With the available data it is not known whether the
relationship between precipitation and mean sporocarp abundance plateau’s or decreases
at high rainfall. It is predicted that there is an upper limit to the production of sporocarps.
A trade-off seems to be evident in the data with a subsequent increase in biomass rather
than in abundance at the highest rainfall level. This trade-off between size and
abundance has been examined extensively for plants (i.e. seed size/number trade-off
theory) but not for hypogeous fungi or fungi in general.
Nutrient levels appear to have a strong influence on the spatial availability
(abundance and biomass) of tropical hypogeous sporocarps. This is not a new hypothesis
for fungi as there have been many studies on, for instance the effects of anthropogenic
nitrogen deposition on fungal sporocarp production. However, it is a new hypothesis for
hypogeous fungi and it appears that even small differences in phosphorous and nitrogen
levels in a natural ecosystem significantly affect the number of hypogeous sporocarps
that are produced. This hypothesis now requires experimental confirmation.
At the micro-spatial scale of site, taxonomic diversity of sporocarps appears to be
associated with the number of Allocasuarina stems and this may be related to host
monodominance.

96
The “Ectomycorrhizal Hypothesis” has been used to explain the presence and
maintenance of monodominant forest stands of ectomycorrhizal rainforest plants amidst
or adjacent to hyper-diverse stands of tropical endomycorrhizal rainforests (Connell and
Lowman ; Janos 1985). This hypothesis appears to be equally applicable to ecotonal,
monodominant Allocasuarina sclerophyll forest and also warrants further study.
6.5.2 The bettongs
The relationship between fungal abundance and precipitation can now be used to
develop population viability and habitat models under different climate change and
drought scenarios. Such models will indicate to managers the areas of vulnerable
(presumably lower altitude/rainfall) and core B. tropica habitat. Currently, little is known
of the relationship between feral pig, A. semialata or hypogeous sporocarp abundance
and these relationships require careful investigation.
More data are required to determine the impact of fire on fungal and ground-cover
resources in both the short and long term within tropical ecotonal sclerophyll forest. One
of the biggest questions is whether bettongs re-colonise or increase population numbers
in wet sclerophyll forest after the rainforest is replaced with a grassy understorey that
includes A. semialata and Hypoxis spp. If this does occur appropriate fire management
may significantly increase the area of suitable habitat that is currently available,
improving the now dire prospects of this endangered mycophagous marsupial, Bettongia
tropica.

97
References
Abell, S. E., P. A. Gadek, C. A. Pearce, and B. Congdon. 2008a; Chapter 3.
Reproductive cues and strategies of tropical hypogeous fungi. Oecologia
(Berlin) in review.
Abell, S. E., P. A. Gadek, C. A. Pearce, and B. Congdon. 2008b; Chapter 4. Nutrient
levels determine the spatial distribution of tropical hypogeous fungal
sporocarps. Ecosystems in review.
Abell, S. E., P. A. Gadek, C. A. Pearce, and B. C. Congdon. 2006. Seasonal resource
availability and use by an endangered tropical mycophagous marsupial.
Biological Conservation 132:533-540.
Adler, G. H. 1998. Impacts of resource abundance on populations of a tropical forest
rodent. Ecology 79:242-254.
Agerer, R. 2001. Exploration types of ectomycorrhizae: A proposal to classify
ectomycorrhizal mycelial systems according to their patterns of differentiation
and putative ecological importance. Mycorrhiza 11:107-114.
Albee-Scott, S. R. 2007. Does secotioid inertia drive the evolution of false-truffles?
Mycological Research 111:1030-1039.
Allen, E. B., M. E. Allen, D. J. Helm, J. M. Trappe, R. Molina, and E. Rincon. 1995.
Patterns and regulation of mycorrhizal plant and fungal diversity. Plant and
Soil 170:47-62.
Amaranthus, M., J. M. Trappe, L. Bednar, and D. Arthur. 1994. Hypogeous fungal
production in mature Douglas-fir forest fragments and surrounding plantations
and its relation to coarse woody debris and animal mycophagy. Canadian
Journal of Forest Research 24:2157-2165.

98
Anderson, S. E., and J. S. I. Ingram 1989. Tropical Soil Biology and Fertility: A
Handbook of Methods. C.A.B. International, Aberystwyth.
Baethgen, W. E., and M. M. Alley. 1989. A manual colorimetric procedure for
measuring ammonium nitrogen in soil and plant Kjeldahl digests.
Communications in Soil Science and Plant Analysis 20:961-969.
Barbour, M. G., M. Rejmanek, A. F. Johnson, and B. M. Pavlik. 1987. Beach
vegetation and plant distribution patterns along the northern Gulf of Mexico
USA. Phytocoenologia 15:201-234.
Beaton, G., D. N. Pegler, and T. W. Young. 1984. Gasteroid Basidiomycota of
Victoria, Australia: 8-9. Kew Bulletin 40:827-842.
Beaton, G., D. N. Pegler, and T. W. K. Young. 1985. Gasteroid Basidiomycota of
Victoria State Australia 8-9. Kew Bulletin 40:827-842.
Begon, M., C. R. Townsend, and J. L. Harper 2006. Ecology: from individuals to
ecosystems. Blackwell Publishing, Malden, Massachusetts, USA.
Bills, G. F., G. I. Holtzman, and O. K. J. Miller. 1986. Comparison of
ectomycorrhizal basidiomycete communities in Red Spruce vs. Northern
Hardwood forests of West-Virginia USA. Canadian Journal of Botany
64:760-768.
Binder, M., and A. Bresinsky. 2002. Derivation of a polymorphic lineage of
Gasteromycetes from boletoid ancestors. Mycologia 94:85-98.
Bougher, N. L., T. S. Grove, and N. Malajczuk. 1990. Growth and phosphorus
acquisition of karri (Eucalyptus diversicolor F. Muell.) seedlings inoculated
with ectomycorrhizal fungi in relation to phosphorus supply. New Phytologist
114:77–85.

99
Bougher, N. L., and T. Lebel. 2001. Sequestrate (truffle-like) fungi of Australia and
New Zealand. Australian Systematic Botany 14:439-484.
Bougher, N. L., and N. Malajczuk. 1990. Effects of high soil moisture on formation of
ectomycorrhizas and growth of karri (Eucalyptus diversicolor F.Muell.)
seedlings inoculated with Descolea maculata, Pisolithus tinctorius and
Laccaria laccata. New Phytologist 114:87–91.
Bougher, N. L., and I. C. Tommerup. 1996. Conservation significance of
ectomycorrhizal fungi in Western Australia: their coevolution with indigenous
vascular plants and mammals. Pages 299–308 in S. D. Hopper, J. Chappill, M.
Harvey, and N. Marchant, editors. Gondwanan Heritage: Past, Present and
Future of the Western Australian Biota. Surrey Beatty and Sons, Notting Hill.
Bruns, T. D., M. I. Bidartondo, and D. L. Taylor. 2002. Host specificity in
ectomycorrhizal communities: what do the exceptions tell us? Integrative and
Comparative Biology 42:352-359.
Bruns, T. D., R. Fogel, T. J. White, and J. D. Palmer. 1989. Accelerated evolution of a
false-truffle from a mushroom ancestor. Nature 339:140-142.
Burnham, K. A., and D. R. Anderson 1998. Model selection and inference. A
practical Information-Theoretic Approach. Springer, New York.
Caughley, G., D. Grice, R. Barker, and B. Brown. 1988. The edge of the range.
Journal of Animal Ecology 57:771-785.
Chao, A. 1984. Nonparametric estimation of the number of classes in a population.
Scandinavian Journal of Statistics 11:265-270.
Chao, A. 1987. Estimating the population size for capture-recapture data with unequal
catchability. Biometrics 43:783-791.

100
Chao, A., and S.-M. Lee. 1992. Estimating the number of classes via sample
coverage. Journal of American Statistical Association 87:210-217.
Chao, A., S.-M. Lee, and S.-L. Jeng. 1992. Estimating population size for capture-
recapture data when capture probabilities vary by time and individual animal.
Biometrics 48:201-216.
Chao, A., M.-C. Ma, and M. C. K. Yang. 1993. Stopping rules and estimation for
recapture debugging with unequal failure rates. Biometrika 80:193-201.
Claridge, A. W., S. C. Barry, S. J. Cork, and J. M. Trappe. 2000a. Diversity and
habitat relationships of hypogeous fungi. II. Factors influencing the
occurrence and number of taxa. Biodiversity and Conservation 9:175-199.
Claridge, A. W., S. J. Cork, and J. M. Trappe. 2000b. Diversity and habitat
relationships of hypogeous fungi. I. Study design, sampling techniques and
general survey results. Biodiversity and Conservation 9:151-173.
Claridge, A. W., and T. W. May. 1994. Mycophagy among Australian Mammals.
Australian Journal of Ecology 19:251-275.
Claridge, A. W., A. P. Robinson, M. T. Tanton, and R. B. Cunningham. 1993.
Seasonal production of hypogeal fungal sporocarps in a mixed-species
eucalypt forest stand in South-eastern Australia. Australian Journal of Botany
41:145-167.
Clark, D. A. 2004. Sources or sinks? The responses of tropical forests to current and
future climate and atmospheric composition. Philosophical Transactions of
the Royal Society of London Series B-Biological Sciences 359:477-491.
Connell, J. H., and M. D. Lowman. 1989. Low-diversity tropical rain forests: some
possible mechanisms for their existence. American Naturalist 134:88-119.

101
Crowley, G. M., and S. T. Garnett. 2001. Growth, seed production and effect of
defoliation in an early flowering perennial grass, Alloteropsis semialata
(Poaceae), on Cape York Peninsula, Australia. Australian Journal of Botany
49:735-743.
Dennis, A. J. 2002. Recovery plan for the northern bettong, Bettongia tropica 2000-
2004. Report to Environment Australia, Canberra. Queensland Parks and
Wildlife Service, Brisbane.
Dennis, A. J., and H. Marsh. 1997. Seasonal reproduction in musky rat-kangaroos,
Hypsiprymnodon moschatus: a response to changes in resource availability.
Wildlife Research 24:561-578.
Doebeli, M., and N. Knowlton. 1998. The evolution of interspecific mutualisms.
Proceedings of the National Academy of Sciences of the United States of
America 95:8676-8680.
Eveling, D. W., R. N. Wilson, E. S. Gillespie, and A. Bataille. 1990. Environmental
effects on sporocarp counts over fourteen years in a forest area. Mycological
Research 94:998-1002.
Everson, C. S., T. M. Everson, and N. M. Tainton. 1988. Effects of intensity and
height of shading on the tiller initiation of 6 grass species from the Highland
Sourveld of Natal. South African Journal of Botany 54:315-318.
Fogel, R. 1976. Ecological studies of hypogeous fungi part 2 sporocarp phenology in
a western Oregon USA Douglas-fir stand. Canadian Journal of Botany
54:1152-1162.
Giachini, A. J., L. A. B. Souza, and V. L. Oliveira. 2004. Species richness and
seasonal abundance of ectomycorrhizal fungi in plantations of Eucalyptus
dunnii and Pinus taeda in southern Brazil. Mycorrhiza 14:375-381.

102
Godbout, C., and J. A. Fortin. 1990. Cultural control of basidiome formation in
Laccaria bicolor with container-grown White Pine seedlings. Mycological
Research 94:1051-1058.
Godbout, C., and J. A. Fortin. 1992. Effects of nitrogen fertilization and photoperiod
on basidiome formation of Laccaria bicolor associated with container-grown
Jack Pine seedlings. Canadian Journal of Botany 70:181-185.
Graham, M. H. 2003. Confronting multicollinearity in ecological multiple regression.
Ecology 84:2809-2815.
Grant, J. D., and L. M. Naylor. 1993. Surveys for the northern brush-tailed bettong
Bettongia tropica on the Mount Carbine Tableland and Mount Lewis, north-
east Queensland. Report to the Queensland Department of Environment and
Heritage, Far North Regional Centre, Cairns.
Hacskaylo, E. 1965. Thelophora terrestris and mycorrhizae of Virginia Pine. Forest
Science 11:401-404.
Harrington, G. N., and K. D. Sanderson. 1994. Recent contraction of wet sclerophyll
forest in the wet tropics of Queensland due to invasion by rainforest. Pacific
Conservation Biology 1:319-327.
Harvey, A. E., M. F. Jurgensen, and M. J. Larsen. 1978. Seasonal distribution of
ectomycorrhizae in a mature Douglas-fir/larch forest soil in western Montana.
Forest Science 24:203-208.
Hatch, A. B. 1937. The physical basis of mycotrophy in the genus Pinus. Black Rock
Forest Bulletin 6:1-168.
Herre, E. A., N. Knowlton, U. G. Mueller, and S. A. Rehner. 1999. The evolution of
mutualisms: exploring the paths between conflict and cooperation. Trends in
Ecology & Evolution 14:49-53.

103
Hogberg, P., A. Nordgren, N. Buchmann, A. F. S. Taylor, A. Ekblad, M. N. Hogberg,
G. Nyberg, M. Ottosson-Lofvenius, and D. J. Read. 2001. Large-scale forest
girdling shows that current photosynthesis drives soil respiration. Nature
411:789-792.
Hughes, L. 2003. Climate change and Australia: Trends, projections and impacts.
Austral Ecology 28:423-443.
Hunt, G. A., and J. M. Trappe. 1987. Seasonal hypogeous sporocarp production in a
western Oregon USA Douglas-fir stand. Canadian Journal of Botany 65:438-
445.
IUCN. Species Survival Commission 2007. IUCN Red List Categories. IUCN, Gland.
Janos, D. P. 1985. Mycorrhizal fungi: agents or symptoms of tropical community
composition? Pages 98-103 in R. Molina, editor. Proceedings of the 6th North
American Conference on mycorrhizae. Forest Research Laboratory, Corvallis,
Oregon.
Johnson, C. N. 1994a. Fruiting of hypogeous fungi in dry sclerophyll forest in
Tasmania, Australia: seasonal variation and annual production. Mycological
Research 98:1173-1182.
Johnson, C. N. 1994b. Nutritional ecology of a mycophagous marsupial in relation to
production of hypogeous fungi. Ecology 75:2015-2021.
Johnson, C. N., and A. P. McIlwee. 1997. Ecology of the northern bettong, Bettongia
tropica, a tropical mycophagist. Wildlife Research 24:549-559.
Johnson, N. C., J. H. Graham, and F. A. Smith. 1997. Functioning of Mycorrhizal
Associations Along the Mutualism-Parasitism Continuum. New Phytologist
135:575-586.

104
Jonsson, L., D. Anders, and B. Tor-Erik. 2000. Spatiotemporal distribution of an
ectomycorrhizal community in an oligotrophic Swedish Picea abies forest
subjected to experimental nitrogen addition: above- and below-ground views.
Forest Ecology and Management 132:143-156.
Kothavala, Z. 1999. The duration and severity of drought over eastern Australia
simulated by a coupled ocean-atmosphere GCM with a transient increase in
CO2. Environmental Modelling and Software 14:243-252.
Krueger, K. W., and J. M. Trappe. 1967. Food reserves and seasonal growth of
Douglas-fir seedlings. Forest Science 3:192-202.
Lambers, H., J. A. Raven, G. R. Shaver, and S. E. Smith. 2008. Plant nutrient-
acquisition strategies change with soil age. Trends in Ecology & Evolution
23:95-103.
Lamhamedi, M. S., C. Godbout, and J. A. Fortin. 1994. Dependence of Laccaria
bicolor basidiome development on current photosynthesis of Pinus strobus
seedlings. Canadian Journal of Forest Research-Revue Canadienne De
Recherche Forestiere 24:1797-1804.
Last, F. T., J. Pelham, P. A. Mason, and K. Ingleby. 1979. Influence of leaves on
sporophore production by fungi forming sheathing mycorrhizas with Betula
Spp. Nature 280:168-169.
Laurance, W. F. 1997. A distributional survey and habitat model for the endangered
northern bettong Bettongia tropica in tropical Queensland. Biological
Conservation 82:47-60.
Lee, S.-M., and A. Chao. 1994. Estimating population size via sample coverage for
closed capture-recapture models. Biometrics 50:88-97.

105
Leigh, E. G., and T. E. Rowell. 1995. The evolution of mutualism and other forms of
harmony at various levels of biological organisation. Ecologie (Paris) 26:131-
158.
Levin, S. A. 1992 The problem of pattern and scale in ecology. Ecology 73:1943-
1967.
Lilleskov, E. A., T. J. Fahey, and G. M. Lovett. 2001. Ectomycorrhizal fungal
aboveground community change over an atmospheric nitrogen deposition
gradient. Ecological Applications 11:397-410.
Loeb, S. C., F. H. Tainter, and E. Cazares. 2000. Habitat associations of hypogeous
fungi in the southern Appalachians: Implications for the endangered northern
flying squirrel (Glaucomys sabrinus coloratus). American Midland Naturalist
144:286-296.
Lomolino, M. V. 2001. Elevation gradients of species-density: historical and
prospective views. Global Ecology & Biogeography 10:3–13.
Lunt, I. D. 1998. Allocasuarina (Casuarinaceae) invasion of an unburnt coastal
woodland at Ocean Grove, Victoria: structural changes 1971–1996. Australian
Journal of Botany 46:649-656.
Luoma, D. L., R. E. Frenkel, and J. M. Trappe. 1991. Fruiting of Hypogeous Fungi in
Oregon Douglas-Fir Forests Seasonal and Habitat Variation. Mycologia
83:335-353.
Malajczuk, N., R. Molina, and J. M. Trappe. 1982. Ectomycorrhiza formation in
Eucalyptus. I. Pure culture synthesis, host specificity and mycorrhizal
compatibility with Pinus radiata. New Phytologist 91:467-482.

106
Maser, C., and J. M. Trappe. 1984. The seen and unseen world of the fallen tree.
Pacific Northwest and Range Experiment Station, USDA Forest Service
General Technical Report.
Maser, C., J. M. Trappe, and R. A. Nussbaum. 1978. Fungal-small mammal
interrelationships with emphasis on Oregon coniferous forests. Ecology
59:799-809.
Maynard Smith, J., and E. Szathmary 1995. The major transitions in evolution.
Oxford University Press, New York.
McIlwee, A. P., and C. N. Johnson. 1998. The contribution of fungus to the diets of
three mycophagous marsupials in Eucalyptus forests, revealed by stable
isotope analysis. Functional Ecology 12:223-231.
McInnes, A., and G. A. Chilvers. 1994. Influence of environmental factors on
ectomycorrhizal infection in axenically cultured eucalypt seedlings. Australian
Journal of Botany 42.
Meyer, M. D., and M. P. North. 2005. Truffle abundance in riparian and upland
mixed-conifer forest of California's southern Sierra Nevada. Canadian Journal
of Botany-Revue Canadienne De Botanique 83:1015-1020.
Molina, R., H. Massicotte, and J. M. Trappe. 1992. Specificity phenomena in
mycorrhizal symbioses: Community-ecological consequences and practical
implications. Pages 357–423 in M. F. Allen, editor. Mycorrhizal functioning:
An integrative plant-fungal process. Chapman and Hall, New York.
Murphy, J., and J. P. Riley. 1967. A modified single solution method for the
determination of phosphate in natural waters. Analytica Chimica Acta 27:31-
36.

107
Nantel, P., and P. Neumann. 1992. Ecology of ectomycorrhizal-Basidiomycete
communities on a local vegetation gradient. Ecology 73:99-117.
Nara, K., H. Nakaya, and T. Hogetsu. 2003. Ectomycorrhizal sporocarp succession
and production during early primary succession on Mount Fuji. New
Phytologist 158:193-206.
North, M., and J. Greenberg. 1998. Stand conditions associated with truffle
abundance in western hemlock/Douglas-fir forests. Forest Ecology &
Management 112:55-66.
North, M., J. Trappe, and J. Franklin. 1997. Standing crop and animal consumption of
fungal sporocarps in Pacific northwest forests. Ecology 78:1543-1554.
North, M. P. 2002. Seasonality and abundance of truffles from Oak woodlands to Red
Fir forests. USDA Forest Service General Technical Report PSW-GTR-183.
Norton, J. M., J. L. Smith, and M. K. Firestone. 1990. Carbon flow in the rhizosphere
of ponderosa pine seedlings. Soil Biology & Biochemistry 22:449–455.
Nowak, M. A., S. Bonhoeffer, and R. M. May. 1994. Spatial games and the
maintenance of cooperation. Proceedings of the National Academy of Sciences
of the United States of America 91:4877-4881.
O'Dell, T. E., J. F. Ammirati, and E. G. Schreiner. 1999. Species richness and
abundance of ectomycorrhizal basidiomycete sporocarps on a moisture
gradient in the Tsuga heterophylla zone. Canadian Journal of Botany
77:1699-1711.
Perry, D. A., R. Molina, and M. P. Amaranthus. 1987. Mycorrhizae,
mycorrhizospheres, and reforestation: current knowledge and research needs.
Canadian Journal of Forest Research 17.
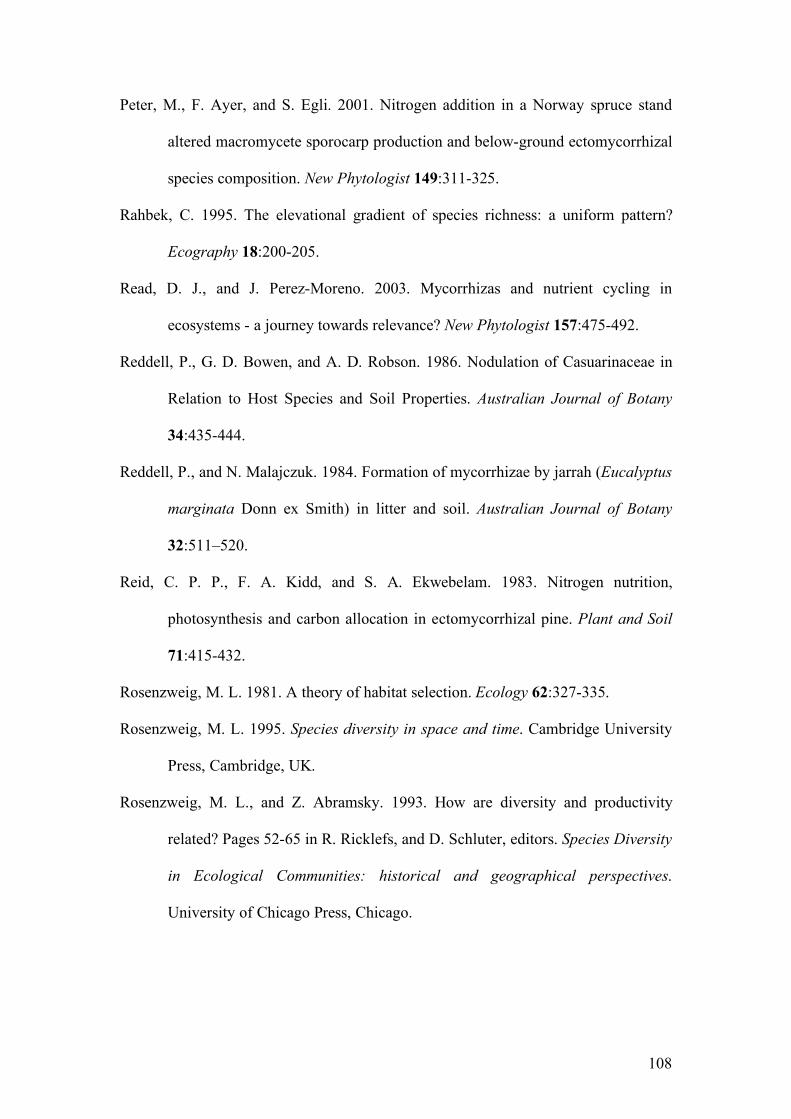
108
Peter, M., F. Ayer, and S. Egli. 2001. Nitrogen addition in a Norway spruce stand
altered macromycete sporocarp production and below-ground ectomycorrhizal
species composition. New Phytologist 149:311-325.
Rahbek, C. 1995. The elevational gradient of species richness: a uniform pattern?
Ecography 18:200-205.
Read, D. J., and J. Perez-Moreno. 2003. Mycorrhizas and nutrient cycling in
ecosystems - a journey towards relevance? New Phytologist 157:475-492.
Reddell, P., G. D. Bowen, and A. D. Robson. 1986. Nodulation of Casuarinaceae in
Relation to Host Species and Soil Properties. Australian Journal of Botany
34:435-444.
Reddell, P., and N. Malajczuk. 1984. Formation of mycorrhizae by jarrah (Eucalyptus
marginata Donn ex Smith) in litter and soil. Australian Journal of Botany
32:511–520.
Reid, C. P. P., F. A. Kidd, and S. A. Ekwebelam. 1983. Nitrogen nutrition,
photosynthesis and carbon allocation in ectomycorrhizal pine. Plant and Soil
71:415-432.
Rosenzweig, M. L. 1981. A theory of habitat selection. Ecology 62:327-335.
Rosenzweig, M. L. 1995. Species diversity in space and time. Cambridge University
Press, Cambridge, UK.
Rosenzweig, M. L., and Z. Abramsky. 1993. How are diversity and productivity
related? Pages 52-65 in R. Ricklefs, and D. Schluter, editors. Species Diversity
in Ecological Communities: historical and geographical perspectives.
University of Chicago Press, Chicago.

109
Schloss, A. L., D. W. Kicklighter, J. Kaduk, and U. Wittenberg. 1999. Comparing
global models of terrestrial net primary productivity (NPP): comparison of
NPP to climate and the Normalized Difference Vegetation Index (NDVI).
Global Change Biology 5:25-34.
Schneider, D. C. 2001. The rise of the concept of scale in ecology. Bioscience 51:545-
553.
Seebeck, J. H., and R. W. Rose. 1989. Potoroidea. Pages 1-45 in D. W. Walton, and
B. J. Richardson, editors. Fauna of Australia Series. Australian Government
Publishing Service, Canberra.
Shenbrot, G., and B. Krasnov. 2000. Habitat selection along an environmental
gradient: Theoretical models with an example of Negev Desert rodents.
Evolutionary Ecology Research 2:257-277.
Short, J. 1998. The extinction of rat-kangaroos (Marsupialia:Potoroidae) in New
South Wales, Australia. Biological Conservation 86:365-377.
Simard, S. W., M. D. Jones, D. M. Durall, D. A. Perry, D. D. Myrold, and R. Molina.
1997a. Reciprocal transfer of carbon isotopes between ectomycorrhizal Betula
papyrifera and Pseudotsuga menziesii. New Phytologist 137:529–542.
Simard, S. W., D. A. Perry, M. D. Jones, D. D. Myrold, D. M. Durall, and R. Molina.
1997b. Net transfer of carbon between ectomycorrhizal tree species in the
field. Nature 388:579-582.

110
Smith, J. E., R. Molina, M. M. P. Huso, D. L. Luoma, D. McKay, M. A. Castellano,
T. Lebel, and Y. Valachovic. 2002. Species richness, abundance, and
composition of hypogeous and epigeous ectomycorrhizal fungal sporocarps in
young, rotation-age, and old-growth stands of Douglas-fir (Pseudotsuga
menziesii) in the Cascade Range of Oregon, USA. Canadian Journal of
Botany-Revue Canadienne De Botanique 80:186-204.
Smith, S. E., and D. J. Read 1997. Mycorrhizal Symbiosis. Academic Press, London.
Stenstrõm, E. 1991. The effects of flooding on the formation of ectomycorrhizae in
Pinus sylvestris seedlings. Plant and Soil 131:247-250.
Tabachnick, B. G., and L. S. Fidell 1996. Using Multivariate Statistics. Harper
Collins College Publishers, New York.
Tester, M., S. E. Smith, F. A. Smith, and N. A. Walker. 1986. Effects of photon
irradiance on the growth of shoots and roots, on the rate of initiation of
mycorrhizal infection and on the growth of infection units in Trifolium
subterraneum L. New Phytologist 103:375-390.
Thiers, H. D. 1984. The secotioid syndrome. Mycologia 76:1-8.
Thomson, B. D., T. S. Grove, N. Malajczuk, and G. E. S. J. Hardy. 1996. The effect
of soil pH on the ability of ectomycorrhizal fungi to increase the growth of
Eucalyptus globulus Labill. Plant and Soil 178:209–214.
Tracey, J. G. 1982. The vegetation of the humid tropical region of North Queensland.
CSIRO, Melbourne.
Trappe, J. M., M. A. Castellano, and N. Malajczuk. 1996. Australasian truffle-like
fungi. VII. Mesophellia (Basidiomycotina, Mesophelliaceae). Australian
Systematic Botany 9:773-802.

111
Trudell, S. A., and R. L. Edmonds. 2004. Macrofungus communities correlate with
moisture and nitrogen abundance in two old-growth conifer forests, Olympic
National Park, Washington, USA. Canadian Journal of Botany 82:781-800.
Unestam, T. 1991. Water repellency, mat formation, and leaf-stimulated growth of
some ectomycorrhizal fungi. Mycorrhiza 1:13-20.
Unestam, T., and Y.-P. Sun. 1995. Extramatrical structures of hydrophobic and
hydrophilic ectomycorrhizal fungi. Mycorrhiza 5:301-311.
Vernes, K. 2000. Ecology of the northern bettong in fire prone wet sclerophyll forest.
PhD Thesis. James Cook University, Townsville.
Vernes, K. 2003. Fine-scale habitat preferences and habitat partitioning by three
mycophagous mammals in tropical wet sclerophyll forest, north-eastern
Australia. Austral Ecology 28:471-479.
Vernes, K., M. Castellano, and C. N. Johnson. 2001. Effects of season and fire on the
diversity of hypogeous fungi consumed by a tropical mycophagous marsupial.
Journal of Animal Ecology 70:945-954.
Vernes, K., and L. C. Pope. 2001. Stability of nest range, home range and movement
of the northern bettong, (Bettongia tropica) following moderate-intensity fire
in a tropical woodland, north-eastern Queensland. Wildlife Research 28:141-
150.
Vernes, K., and L. C. Pope. 2006. Population density of the northern bettong
Bettongia tropica in northeastern Queensland. Australian Mammalogy 28:87-
92.
Villeneuve, N., M. M. Grandtner, and J. A. Fortin. 1989. Frequency and diversity of
ectomycorrhizal and saprophytic macrofungi in the Laurentide mountains of
Quebec Canada. Canadian Journal of Botany 67:2616-2629.

112
Vogt, K. A., R. L. Edmonds, and C. C. Grier. 1981 Biomass and nutrient
concentrations of sporocarps produced by mycorrhizal and decomposer fungi
in Abies amabilis stands. Oecologia (Berlin) 50:170-175.
Wallander, H. 1995. A new hypothesis to explain allocation of dry matter between
mycorrhizal fungi and pine seedlings in relation to nutrient supply. Plant and
Soil 168-169:243-248.
Wallander, H., and J. E. Nylund. 1992. Effects of excess nitrogen and phosphorus
starvation on the extramatrical mycelium of ectomycorrhizas of Pinus
sylvestris L. New Phytologist 120:495-503.
Wallenda, T., and I. Kottke. 1998. Nitrogen deposition and ectomycorrhizas. New
Phytologist 139:169-187.
Wang, B., and Y. L. Qiu. 2006. Phylogenetic distribution and evolution of
mycorrhizas in land plants. Mycorrhiza 16:299-363.
Warcup, J. H. 1980. Ectomycorrhizal associations of Australian indigenous plants.
New Phytologist 85:531-535.
Whittaker, R. H., and W. A. Niering. 1975. Vegetation of the Santa-Catalina
mountains Arizona USA Part 5 biomass production and diversity along the
elevation gradient. Ecology 56:771-790.
Wiens, J. A. 1989. Spatial scaling in ecology. Functional Ecology 3:385-397.
Winter, J. W. 1997. Distribution of the northern bettong, Bettongia tropica, in north-
eastern Australia. Report to the World Wide Fund for Nature, Australia.
Winter, J. W., and P. M. Johnson. 1995. Northern bettong, Bettongia tropica. Pages
294-295 in R. Strahan, editor. The Mammals of Australia. Reed Books,
Chatswood.

113
Wisheu, I. 1998. How organisms partition habitats: Different types of community
organization can produce identical patterns. Oikos 83:246-258.
Withers, J. R. 1978. Studies on the status of unburnt Eucalyptus woodland at Ocean
Grove, Victoria. III* comparative water relations of the major tree species.
Australian Journal of Botany 26:819-835.
Zobel, D. B., A. McKee, G. M. Hawk, and C. T. Dyrness. 1976. Relationships of
environment to composition structure and diversity of forest communities of
the Central Western Cascades of Oregon USA. Ecological Monographs
46:135-156.

114
Appendix One: Key to the Genera of Hypogeous Fungi
Surveyed in Far North Queensland, Australia
1. Spores large >60 µm.............................. 2 Zygomycete/Glomeromycete (A)*
1. Spores small <60 µm..................................................................................... 3
2. Peridium well developed (~60 µm), thick spore walls (>2 µm) and >1 spore
hyphal attachment often difficult to detect at maturity ..................... Endogone
2. Peridium thin, thin spore walls <2 µm and one obvious terminal hyphal
attachment to each spore...................................................................... Glomus
3. Spores formed within an ascus........................................... 4 Ascomycete (B)*
3. Spores formed on a basidium........................................ 5 Basidiomycete (C)*
4. Peridium dark brown, lightly tomentose (woolly), reticulate with raised ridges on mature specimens, (mature specimens: paraphyses half as long as asci) ................................................................................................... Labyrinthomyces
4. Peridium light brown, scabrous and tessellated, (mature specimens: paraphyses
the same length as asci)...................................................................... Dingleya
5. Spores globose and ornamented..................................................................... 6
5. Spores with all other shapes, with or without ornaments ...............................13
6. Spore ornaments turning blue/black (amyloid reaction) in Meltzers reagent or
iodine solution ............................................................................................... 7
6. Spore ornaments with no amyloid reaction to Meltzers reagent or iodine
solution.......................................................................................................... 9
7. Stipe columella present................................................................Macowanites
7. Columella absent, vestigial stipe sometimes present....................................... 8
* See relevant sections within the species key Appendix Two

115
8. Latex milky to watery in fresh specimens, lactiferous tissue abundant in the
peridium ......................................................................................Zelleromyces
8. No latex and no lactiferous tissue present in the peridium ........... Gymnomyces
9. Spores dark brown in water ..........................................................................10
9. Spores hyaline or light brown in water..........................................................11
10. Peridium light yellow to brown, smooth and lacking a crust, solid black tar-
like gleba, small spores (<14 µm) with short ornaments (<2 µm) . Scleroderma
10. Peridium brown to black with yellow, orange or brown hyphae forming a
carbonaceous crust, black powdery spore mass at maturity, relatively large
spores (20 µm) with long spines (>2 µm) only shells found........ Elaphomyces
11. Latex milky to watery in fresh specimens, lactiferous tissue present in the
peridium, gel-filled chambers, ornamented spores with spines forming
conspicuous cones ........................................................................... Octaviania
11. Latex absent, globose spores spinose ............................................................12
12. Spores with coalescing spines around the spore base forming a corona (crown)
locules visible through the thin peridium...................................Stephanospora
12. Small (5 µm) spores, thick white or light brown peridium.............Sclerogaster
13. Utricle present ..............................................................................................14
13. Utricle absent................................................................................................15
14. Spores lacking ornaments, utricle either inflated or appressed to spore wall and
not covering the spore apex .......................................................Hysterangium
14. Spores ornamented, utricle inflated and surrounding the spore apex.................
..................................................................................................... Aroramyces
15. Spores lacking ornamentation .......................................................................16
15. Spores with ornamentation............................................................................21

116
16. Spores yellow ...............................................................................................17 16. Spores hyaline ..............................................................................................18
17. Spores fusiform, yellow to light brown in 5% KOH and water, peridium bright
chrome-yellow, gleba orange-yellow and gelatinous ....................... Royoungia 17. Spores broadly ovoid, obvious sterigmal attachment, yellow spores in 5%
KOH and water, peridium yellow-brown, gleba bright yellow and dry with small open locules.................................................................... Geogyroporous
18. Spores smooth oblong-elliptical (pill-shaped), rounded at both the spore base
and apex, white peridium when fresh bruising brown, gleba cream or brown ... ....................................................................................................Pogiesperma
18. Spores fusiform with obvious sterigmal attachment ......................................19
19. Spores ellipsoid, 4-6 angles in polar view, peridium staining blue, gleba pale yellow...........................................................................................Chamonixia
19. Spores ellipsoid or ovate, not angular in polar view ......................................20
20. Spores ellipsoid or ovate, gleba shades of olive-greens or browns, dendritic cartilaginous columella present but no solid glebal core ............Hysterangium
20. Spores ellipsoid, rounded in polar view, peridium crusty and carbonaceous, spore mass olive green, surrounding a solid glebal core ................ Mesophellia
21. Spores not ellipsoid ......................................................................................22
21. Spores ellipsoid ............................................................................................23
22. Spores lemon-shaped, ornamented with warts or ridges except for the smooth apical hump .............................................................................. Hymenogaster
22. Spores broadly ovoid with minute (<1 µm) spines, dark brown-yellow spores, peridium bright chrome-yellow, gleba dark brown and gelatinous.................... ............................................................................................ Mycoamaranthus
23. Ornaments are prominent longitudinal ridges, in polar view rounded, peridium
bright canary yellow, gleba cinnamon brown .................................... Gautieria 23. Ornaments spines, rods or warts....................................................................24

117
24. Spores warty, fusiform and ellipsoid without a utricle, peridium tightly adherent to the surrounding soil and rootlets .............................Chondrogaster
24. Spores minutely warty and ellipsoid without a utricle, peridium consisting of gummy mycelium surrounding the spore mass..............................................25
25. Columella present......................................................................Gummiglobus 25. Columella absent ............................................................................ Castoreum

118
Appendix Two: Key to the Species of Hypogeous Fungi
Surveyed
(A) Spores large >60 µm, well developed peridium (~60 µm), thick spore walls (>2 µm)
and >1 spore hyphal attachment often difficult to detect at maturity Endogone... 1
1 Peridium white, yellow gleba densely packed with globose spores 80 x 85 µm
.................................................................................................Endogone spA
1 Peridium white, apricot-orange gleba, spores arranged in packages with white
subtending tissue, orange globose spores 93 x 97 µm.......................................
................................................................................................. Endogone spB
Spores large >60 µm, thin peridium, thin spore walls <2 µm and one obvious
terminal hyphal attachment to each spore Glomus ............................................. 1
1 Peridium and gleba rusty-brown .................................................................... 2
1 Gleba tan to white.......................................................................................... 4
2 Peridium/gleba rusty-brown, gleba densely packed with globose spores 77 µm x
82 µm ...........................................................................................Glomus spC
2 Peridium/gleba rusty-brown, gleba densely packed with obovate spores ........ 3
3 Spores small and obovate 65 x 89 µm...........................................Glomus spA
3 Spores large and obovate 81 x 106 µm..........................................Glomus spB
4 Peridium rusty-brown, tan gleba, large obovate spores 102 x 122 µm ..............
.....................................................................................................Glomus spD
4 Peridium white-cream, tan gleba with open locules, small hyaline spores 35 x 65
µm................................................................................................Glomus spE

119
(B) Spores formed within an ascus, peridium dark brown, lightly tomentose (woolly),
reticulate with raised ridges on mature specimens, (mature specimens: paraphyses
half as long as asci) .......................................... Labyrinthomyces spA (cf varius)
Spores formed within an ascus, peridium light brown, scabrous and
tessellated,(mature specimens: paraphyses the same length as asci) Dingleya..... 1
1. Peridium light brown – orange, intersected with white-cream tessellations ......
..............................................................................Dingleya spA (cf tesselata)
1. Peridium light brown-cream, carbonaceous – sandy in mature specimen, white-
cream tessellations in immature specimen...................................Dingleya spB
(C) Spores globose and ornamented formed on a basidium, spore ornaments turning blue
(amyloid reaction) in Meltzers reagent or iodine solution, stipe columella present
Macowanites....................................................................................................... 1
1. Spores 7 µm diameter, basidiocarp brown...................................................... 2
1. Spores 9 µm diameter, basidiocarp white-cream, gleba cream-yellow...M. spC
2. Ornaments spinose, <1 µm, peridium brown, gleba light brown............M. spA
2. Ornaments reticulate, <0.5 µm, peridium absent ...................................M. spB
Spores globose and ornamented formed on a basidium, spore ornaments turning blue
(amyloid reaction) in Meltzers reagent or iodine solution, columella absent, vestigial
stipe sometimes present, fresh specimens exuding a milky to watery latex, lactiferous
tissue abundant in the peridium Zelleromyces ..................................................... 1

120
1. Spores diameter >9 µm, ornament height >1 µm............................................ 2
1. Spores 6 x 7 µm, ornaments 0.1 µm high, minute reticulated dots and lines,
peridium brown and up to 300 µm thick consisting of appressed hyphae, cream
gleba......................................................................................................Z. spA
2. Spore ornaments consisting of spines and rods often coalescing into long ridges
...................................................................................................................... 3
2. Spore ornaments consisting only of individual rods and spines, spores 9 x 9 µm,
ornaments <1 µm, cream peridium with orange patches, cystidia present on the
peridial surface, cream gleba..................................................................Z. spB
3. Spores 9–13 (15) µm in diameter and most ornaments 2 µm or more high...... 4
3. Spores 7–10 µm in diameter, ornaments 1–2 µm high, locules visible through the
thin brown (100–200 µm) peridium, gleba tan/cream .............................Z. spC
4. Gleba dark, rusty-red to dark brown, mean spore size 11 x 11 µm, peridium dark
red/maroon to brown..............................................................................Z. spD
4. Gleba pale, tan-cream to light brown, mean spore size 10 x 11 µm, peridium dark
orange to brown....................................................................................Z. spE.
Spores globose and ornamented 7 x 7 µm, formed on a basidium, low (<0.8 µm)
spore ornaments turning blue (amyloid reaction) in Meltzers reagent or iodine
solution, columella absent, vestigial stipe sometimes present, fresh specimens not
exuding latex and no lactiferous tissue present in the peridium, peridiopellis a turf of
hyphal tips, large hymenial cystidia present 32–54 µm long, light brown peridium,
pale brown gleba ...........................................................Gymnomyces eildonensis
Spores globose and ornamented formed on a basidium, spore ornaments with no
amyloid reaction to Meltzers reagent or iodine solution, spores dark brown in water
and small (<14 µm) with short ornaments (<2 µm), peridium light yellow to brown,
smooth and lacking a crust, solid black tar-like gleba Scleroderma .................... 1
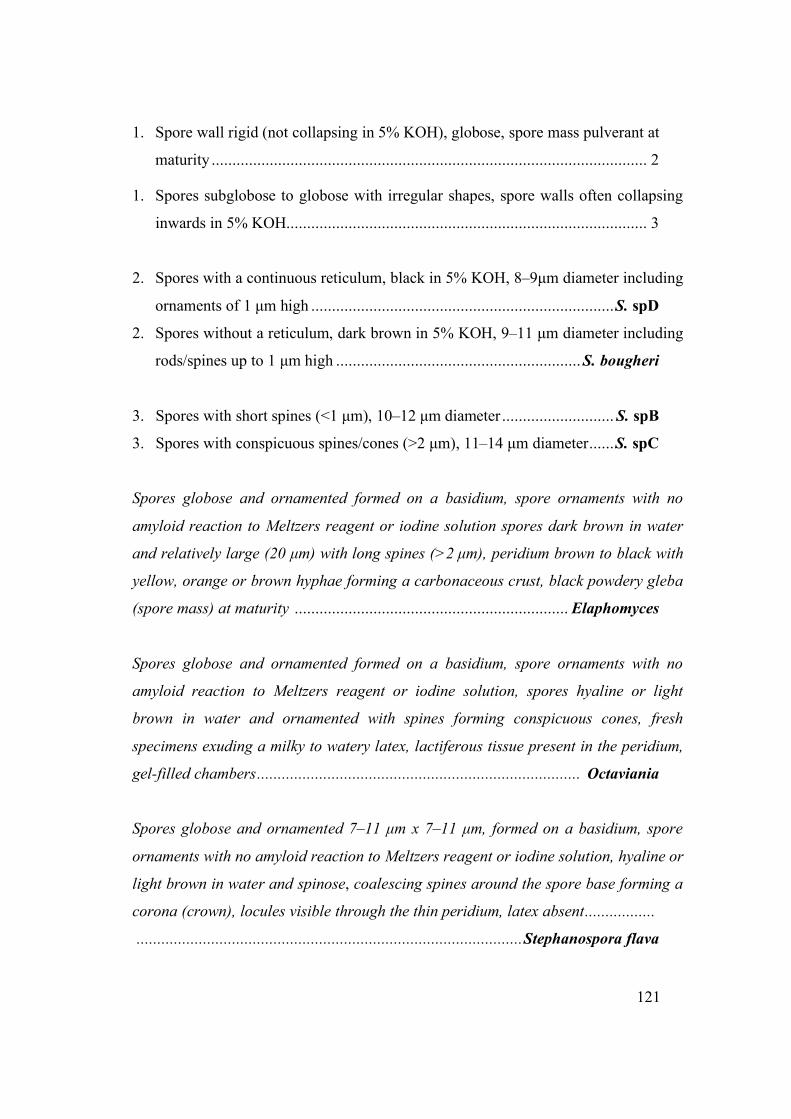
121
1. Spore wall rigid (not collapsing in 5% KOH), globose, spore mass pulverant at
maturity ......................................................................................................... 2
1. Spores subglobose to globose with irregular shapes, spore walls often collapsing
inwards in 5% KOH....................................................................................... 3
2. Spores with a continuous reticulum, black in 5% KOH, 8–9µm diameter including
ornaments of 1 µm high .........................................................................S. spD
2. Spores without a reticulum, dark brown in 5% KOH, 9–11 µm diameter including
rods/spines up to 1 µm high ........................................................... S. bougheri
3. Spores with short spines (<1 µm), 10–12 µm diameter ........................... S. spB
3. Spores with conspicuous spines/cones (>2 µm), 11–14 µm diameter......S. spC
Spores globose and ornamented formed on a basidium, spore ornaments with no
amyloid reaction to Meltzers reagent or iodine solution spores dark brown in water
and relatively large (20 µm) with long spines (>2 µm), peridium brown to black with
yellow, orange or brown hyphae forming a carbonaceous crust, black powdery gleba
(spore mass) at maturity .................................................................. Elaphomyces
Spores globose and ornamented formed on a basidium, spore ornaments with no
amyloid reaction to Meltzers reagent or iodine solution, spores hyaline or light
brown in water and ornamented with spines forming conspicuous cones, fresh
specimens exuding a milky to watery latex, lactiferous tissue present in the peridium,
gel-filled chambers.............................................................................. Octaviania
Spores globose and ornamented 7–11 µm x 7–11 µm, formed on a basidium, spore
ornaments with no amyloid reaction to Meltzers reagent or iodine solution, hyaline or
light brown in water and spinose, coalescing spines around the spore base forming a
corona (crown), locules visible through the thin peridium, latex absent.................
.............................................................................................Stephanospora flava

122
Spores globose and ornamented formed on a basidium, spore ornaments with no
amyloid reaction to Meltzers reagent or iodine solution, spores hyaline or light
brown in water, spinose and small (5 x 5 µm), thick white (in youth) to brown
peridium, gleba orange, latex absent .......................................... Sclerogaster spA
Spores formed on a basidium, utricle present or absent, without ornaments, utricle
either inflated or appressed to spore wall and not covering the spore apex, gleba
olive green, brown or dark brown/black and gelatinous Hysterangium............... 1
1. Spores oval to ovate, tapering only at one end ............................................... 2
1. Spores fusiform, tapering at both ends ........................................................... 4
2. Utricle present, gleba brown.......................................................................... 3
2. Utricle absent, gleba green to dark brown/black, peridium staining pink, spores
10–14 x 5–6 µm................................................................................... H. spD
3. Utricle thin and hyaline, tightly appressed to the spores, 10–14 x 6–7 µm,
peridium brown, gleba tan brown ......................................................... H. spB
3. Utricle thick, up to 2 µm thick, spores 12–14 x 5–7 µm, peridium brown and
wrinkled upon drying, gleba dark tan to brown..................................... H. spC
4. Utricle present, small sporocarps 2–15 mm in diameter ................................. 5
4. Utricle absent, large sporocarps 10–30 mm in diameter, spores 9–14 x 3–5 µm,
peridium brown, gleba dark chocolate brown (some specimens olive-green)....
............................................................................................................. H. spA

123
5. Spore size average 10 x 4 µm (8–13 x 3–5 µm).............................................. 6
5. Spore size average 12 x 5 µm (10–14 x 4–5 µm), very small sporocarps 2–4 mm
in diameter, peridium embedded in soil and rootlets, distinctive grey-green gleba
................................................................................................ H. aggregatum
6. Peridium consisting of thickened (<20 µm) hyphae ....................................... 7
6. Peridium consisting of inflated cells >20 µm in diameter, dark olive-green to
black gleba ........................................................................................ H. affine
7. Utricle often inconspicuous and always partially appressed to the spore wall
(especially evident in spore polar view), gleba pale olive-green to dark olive-
green/black................................................................................H. cf gardneri
7. Utricle always conspicuous and often inflated up to 2 µm around the spore wall, (especially evident in spore polar view), gleba dark olive-green to dark brown/black...................................................................................H. inflatum
Spores formed on a basidium, utricle present, spores ornamented, 11 x 6 µm, utricle inflated and surrounding the spore apex, gleba tan to dark brown ......................................................................... Aroramyces cf gelatinosporus
Spores formed on a basidium 9–12 x 4–5 µm fusiform, utricle absent and lacking
ornamentation, spores yellow to light brown in 5% KOH and water, peridium bright
chrome-yellow, gleba orange-yellow to light brown and gelatinous........................
............................................................................................ Royoungia boletoides
Spores formed on a basidium, utricle absent, spores lacking ornamentation, broadly
ovoid, obvious sterigmal attachment, yellow in 5% KOH and water, peridium yellow-
brown, gleba bright yellow and dry with small open locules ........... Geogyroporous

124
Spores formed on a basidium, utricle absent, spores lacking ornamentation, hyaline,
smooth oblong-elliptical (pill-shaped), rounded at both the spore base and apex, white
peridium, when fresh bruising brown, gleba cream or brown Pogisperma............ 1
1. Spores large, 8–10 x 3–4 µm, brown gleba, thick white peridium consisting of a
turf of hyphal ends........................................................................................P. spA
1. Spores small, 6–7 x 2–3 µm, cream gleba, thin brown peridium.............P. spB
Spores formed on a basidium, utricle absent, spores 10–13 x 4–6 µm, lacking
ornamentation, hyaline, fusiform ellipsoid, with obvious sterigmal attachment, 4-6
angles in polar view, peridium staining blue, gleba pale yellow..............................
......................................................................................... Chamonixia vitatispora
Spores formed on a basidium, utricle absent, spores lacking ornamentation, hyaline
and fusiform ellipsoid with obvious sterigmal attachment and rounded in polar view,
spore mass olive green surrounding a solid glebal core, peridium crusty and
carbonaceous Mesophellia/Malajczukia .............................................................. 1
1. Spore mass pulverant..................................................................................... 2
1. Spores borne on basidia lining locules radiating from the solid glebal core, large
spores 12 x 5 µm .................................................... Malajczukia ingrattissima
2. Spores large 9–12 x 4–5 µm .......................................................................... 3
2. Spores short 8–9 x 3–5µm ............................................. Mesophellia clelandii

125
3. Trabeculae few and large 0.5–2 mm+ wide, firmly attaching glebal core to the
peridium........................................................................... Mesophellia glauca
3. Trabeculae small, many (hundreds) <0.7 mm wide, glebal core movable and able
to be easily detached from the peridium...........................Mesophellia oleifera
Spores 17 x 9 µm, formed on a basidium, utricle absent, spores lemon-shaped with
ornamentation of warts or ridges except for the smooth apical hump, brown peridium
and gleba................................................................................. Hymenogaster spA
Spores formed on a basidium, utricle absent, spores 12–16 x 7–9 µm broadly ovoid,
hyaline to dark brown-yellow with minute (<1 µm) spines, peridium bright chrome-
yellow, gleba light to dark brown and gelatinous ........ Mycoamaranthus auriorbis
Spores formed on a basidium, utricle absent, spores 16–22 x 7–10 µm (average 18 x 8
µm), ellipsoid with ornaments that are prominent longitudinal ridges rounded in polar
view, peridium bright canary yellow, gleba cinnamon brown .................................
.................................................................................................... Gautieria amara
Spores formed on a basidium, utricle absent, spores fusiform ellipsoid with ornaments
of minute spines or warts, peridium tightly adherrent to the surrounding soil and
rootlets Chondrogaster ........................................................................................ 1
1. Spore length/width ratio Q = 2.0–3.0, isolated warts or smooth ..................... 2
1. Spore length/width ratio Q < 2, prominent ornaments/spore coating .............. 4
2. Spores fusiform and warty 12 x 4 µm, Q = 2.7–3.0, peridium white and consisting
of dirt and rootlets, gleba light olive-green.............................................C. spB

126
2. Spores ovate, tapering only at the base........................................................... 3
3. Spores 10 x 5 µm, most spores with warts, Q = 2.0–2.4, peridium bruising dark
pink and consisting of dirt and rootlets, dark olive-green gleba............. C. spA
3. Spores 12 x 6 µm and smooth, Q = 2.1, peridium consisting of gummy mycelium,
gleba pale green.................................................................................... C. spC
4. Spores surrounded by long (5 µm) crowded ornaments and enclosed by a utricle,
oval spores 13 x 8 µm, Q = 1.5, peridium consisting of gummy mycelium, orange-
brown gleba.......................................................................................... C. spD
4. Spores enclosed with a thick amorphous covering making it difficult to detect the
spore outline, oval spores 15 x 9 µm, Q = 1.8, peridium white and encrusted with
soil, gleba dark brown/black ..................................................................C. spE
Spores formed on a basidium, utricle absent, spores ellipsoid with ornaments of
minute spines or warts, peridium consisting of gummy mycelium surrounding the
spore mass, columella present Gummiglobus....................................................... 1
1. Spores ellipsoid and ornamented 9–13 x 4–6 µm, Q = 2–2.1, cinnamon brown
spore mass, pulverant at maturity.....................................................G. joyceae
1. Spores sub-fusoid to ellipsoid and predominantly smooth 10–13 x 4–5 µm, Q =
2.5–2.7, olive green spore mass, adherrent at maturity .......................... G. spB

127
Spores formed on a basidium, utricle absent, spores ellipsoid with ornaments of
minute spines or warts, peridium consisting of gummy mycelium surrounding the
spore mass,columella absent, gleba a powdery spore mass lacking veins of gummy
tissue Castoreum .................................................................................................. 1
1. Q < 2, majority of spores with warts, ellipsoid 9–15 x 5–8 µm, (mean: 11 x 7 µm)
Q = 1.6–1.8, cinnamon brown spore mass........................................................
................................... C. infimiratio sp. nov. (Trappe provisional key 2003)
1. Q>2, majority of spores smooth..................................................................... 2
2. Spores large, 13–17 x 5–8 µm (mean: 16 x 7 µm), Q = 2.4, some spores with low
warts, spore mass cinnamon brown.......................................... C. tasmanicum
2. Spores small and smooth 8–12 x 3–5 µm (mean: 10 x 4 µm), Q = 2.3, spore mass
olive green......................C. sublaeve sp. nov. (Trappe provisional key 2003)