this material has been developed by georgia tech hci faculty, and continues to evolve. contributors...
TRANSCRIPT

This material has been developed by Georgia Tech HCI faculty, and continues to evolve. Contributors include Gregory Abowd, Jim Foley, Diane Gromala, Elizabeth Mynatt, Jeff Pierce, Colin Potts, Chris Shaw, John Stasko, and Bruce Walker. Comments directed to [email protected] are encouraged. Permission is granted to use with acknowledgement for non-profit purposes. Last revision: January 2004.
Requirements Gathering & Task Analysis – Part 4 of 5
Why, What and How – Making Sense of All the Data

Introduction to HCI
Goal - Organize Information
• Organizing the information blends in with the step of documenting the results
• Group process - compare notes• Several tools can be used to facilitate
Affinity diagrams (card sorting) Flow charts Task analysis diagraming

Introduction to HCI
From Interaction Design, Preece Rogers and Sharp
Affinity Diagram - from Card Sorting
Cards are post-it notes from interviews, focus groups, etc.
Introduction to HCI
Affinity diagrams
• Brings issues and insights about customers/users together Fastest and best way
• Affinity wall a communication tool to stimulate design thinking
• Work bottom-up Group individual notes, then group these
groups, then these, then these Of course use colored post-its!

Introduction to HCI
Introduction to HCI
Affinity diagram
• Let the data indicate the groupings and the labels for the groups
• Use voice of the customer (I do this…)
• Important to retain individual variation
• Then walk the diagram and get design ideas from it

Introduction to HCI
Affinity diagram
• Many ways to build the diagram – purpose is to push your understanding of user and key distinctions
• Look at data (note) and think “what is the point really about?”
Introduction to HCI
Overview of process
• Everyone gets 20 notes to start• Moderator leads teams through
process Get this first set up on the wall in
natural groupings – do as a group Then do it individually Then label blue in ‘I’ language Then label pink, then green (abstract)
Introduction to HCI
Posting notes Rules
• Allowed to move notes without discussion/argument
• Note can only go in one column• Fit in questions and design ideas• Have pile of ‘don’t fit’ notes – try later• Junk category – eg. demographics• Split notes with more than one idea on
them
Introduction to HCI
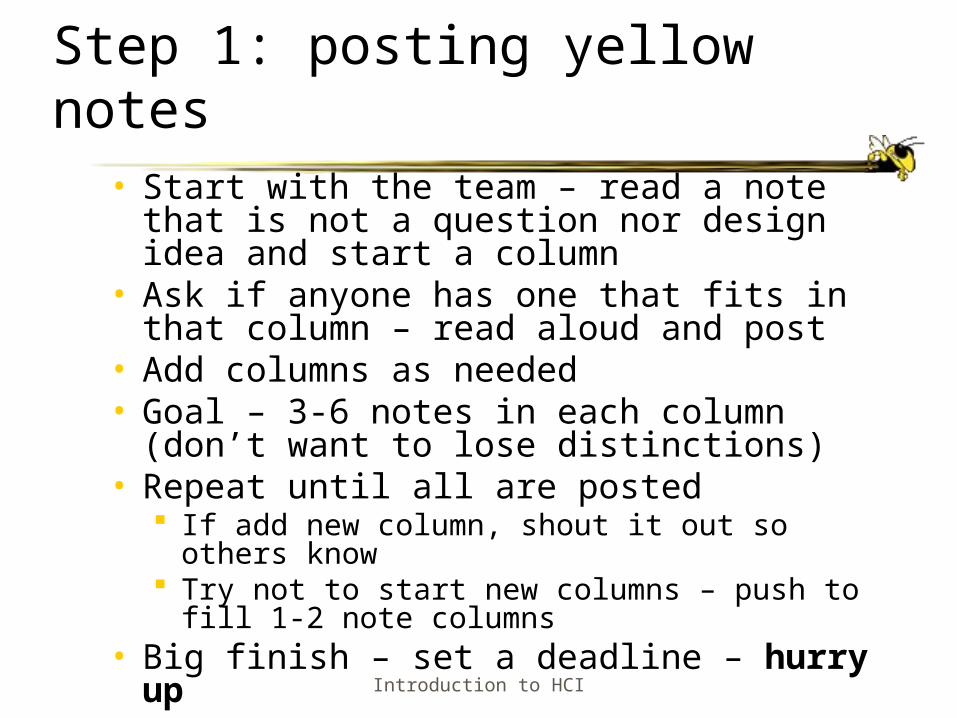
Step 1: posting yellow notes• Start with the team – read a note that
is not a question nor design idea and start a column
• Ask if anyone has one that fits in that column – read aloud and post
• Add columns as needed• Goal – 3-6 notes in each column (don’t
want to lose distinctions)• Repeat until all are posted
If add new column, shout it out so others know
Try not to start new columns – push to fill 1-2 note columns
• Big finish – set a deadline – hurry up
Introduction to HCI
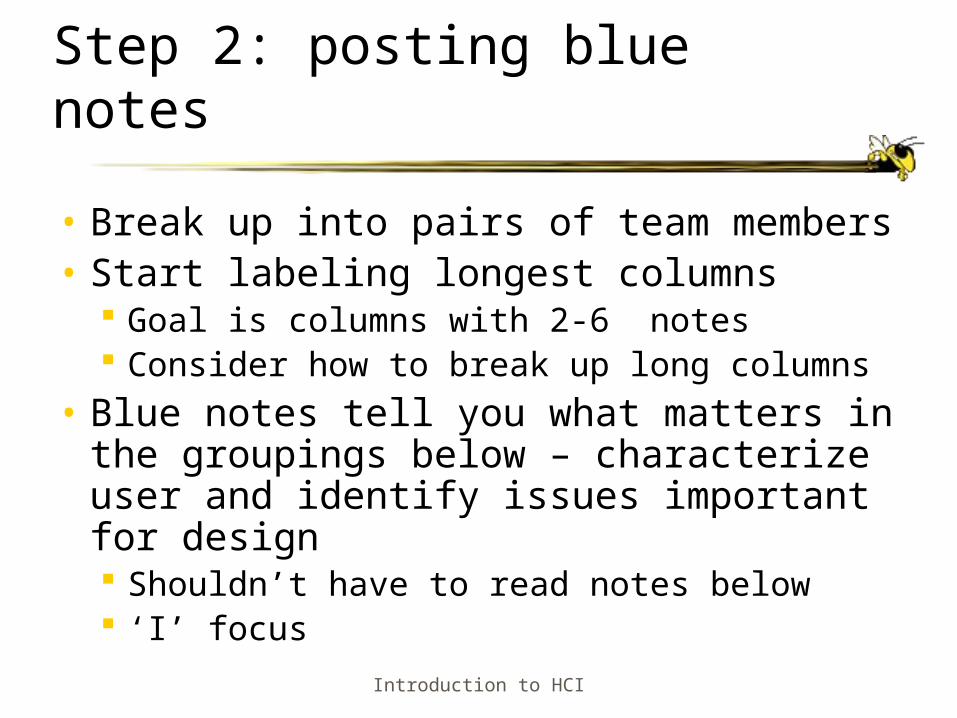
Step 2: posting blue notes
• Break up into pairs of team members• Start labeling longest columns
Goal is columns with 2-6 notes Consider how to break up long columns
• Blue notes tell you what matters in the groupings below – characterize user and identify issues important for design Shouldn’t have to read notes below ‘I’ focus
Introduction to HCI
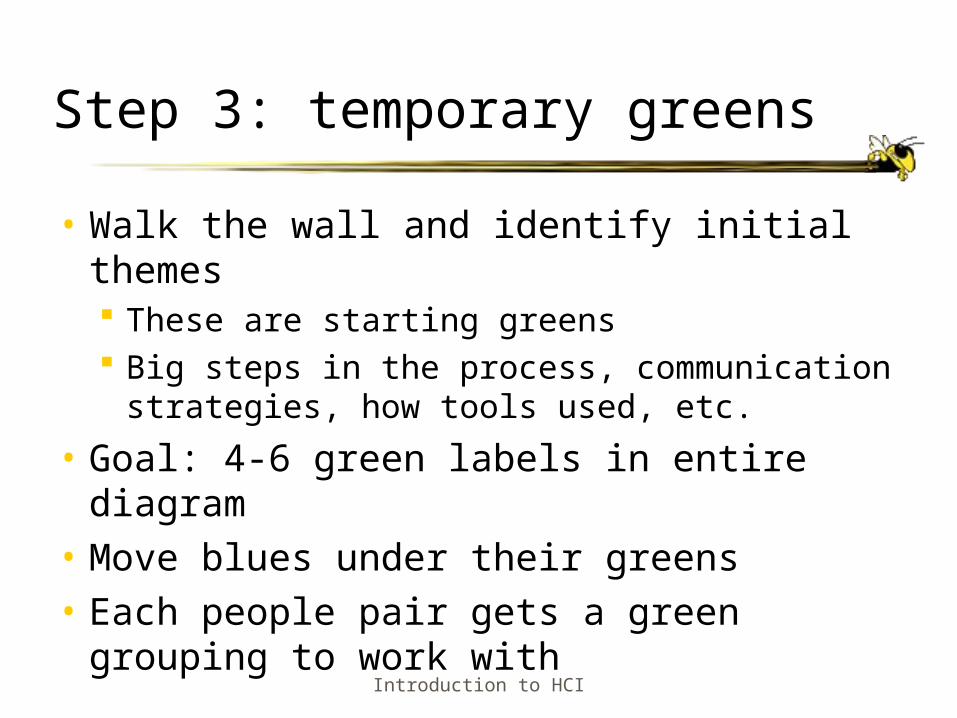
Step 3: temporary greens
• Walk the wall and identify initial themes These are starting greens Big steps in the process, communication
strategies, how tools used, etc.
• Goal: 4-6 green labels in entire diagram
• Move blues under their greens• Each people pair gets a green
grouping to work with

Introduction to HCI
Step 4: organizing greens• Each pair restructures Blue labels
under their Green to Eliminate redundancies Have Blues that are 2-6 notes long
• Write final Blue labels• Create Pink categories by grouping
like Blues (2-6 per category) Tells you what matters in Blues below it
• Group Pinks under the Green (5-8) Write final Green label Not ‘I’
Introduction to HCI
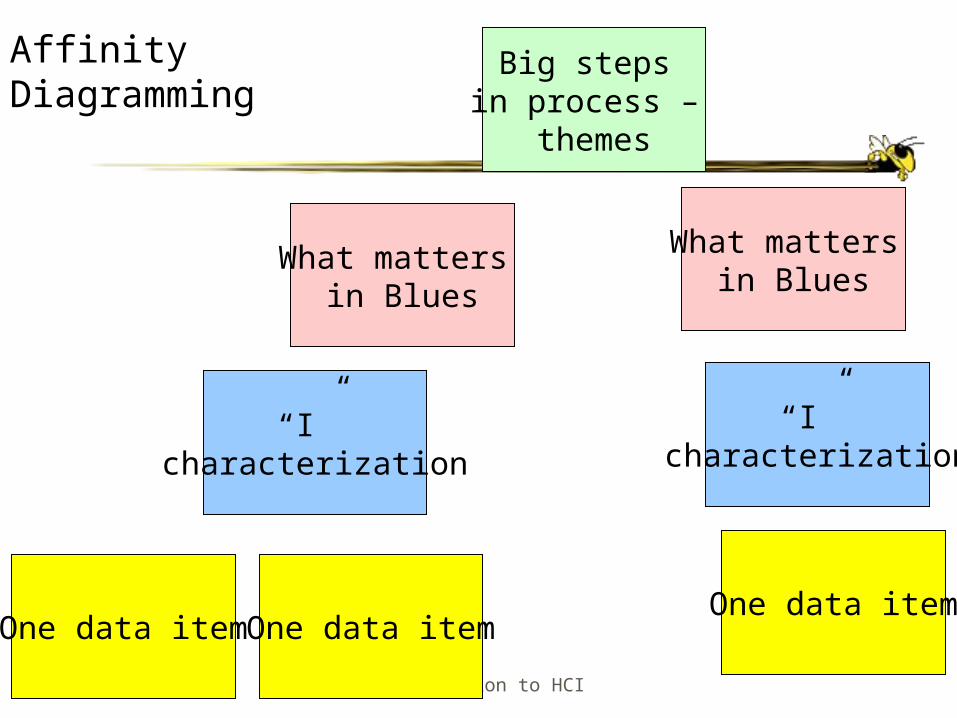
Affinity Diagramming
Big steps in process –
themes
What matters in Blues
What matters in Blues
“I” characterization
“I” characterization
One data item One data itemOne data item

Introduction to HCI
Rolling in new data
• Can do this in two passes See missing data, make sure to get it Adjust interviews as needed
• Add to diagram• Adjust, clean up, re-organize as
needed

Introduction to HCI
Remember …
… your goal is to create new distinctions
If columns/groups too big, burying these distinctions!