this page intentionally left blank.robek28/conferences/diss2017/...preambulum 4 the second part,...
TRANSCRIPT


This page intentionally left blank.

DiSS ’03
Disfluency in Spontaneous Speech
5–8 September, 2003, Göteborg University, Sweden
An ISCA Research Workshop
The organisers would like to thank the following for their support:
Vetenskapsrådet, The Swedish Research Council
Göteborg University, Sweden
Gothenburg Papers in Theoretical Linguistics 90
Edited by
Robert Eklund
ISSN 0349–1021

2
Gothenburg Papers in Theoretical Linguistics Papers in GPTL cover general and theoretical topics in linguistics. The series contains papers both from single individuals and project groups. It appears irregularly in two subseries, blue for English Papers and green for Swedish Papers. Jens Allwood Editor, GPTL © 2003
Department of Linguistics, Göteborg University, ISCA, the editor and the authors. ISSN 0349-1021

Proceedings of DiSS�03, Disfluency in Spontaneous Speech Workshop, 5�8 September 2003, Göteborg University, Sweden. Robert Eklund (ed.), Gothenburg Papers in Theoretical Linguistics 90, ISSN 0349�1021, pp. 3�4.
3
Preambulum
Speech is not like text. Because speech is real-time and on-line, editing is �in the open� � not hidden as it is in written text (like this foreword, for example). Since very few of us speak completely fluently without changing our minds, with consistently perfectly eloquent wordings, and without any hesitation or slips, one characteristic of spontaneous speech is that it includes phenomena such as pauses, hesitations, �err� words, truncated words, repetitions, prolonged sounds, repairs, etc. Although studied earlier, the formal study of disfluency really took off in the 1950�s beginning somewhat independently in three separate disciplines. Within stuttering research, seminal work was carried out by Wendell Johnson and his colleagues. Disfluencies were also studied within general linguistics, pioneered by Frieda Goldman-Eisler among others. Also, within psychotherapy, much work on disfluency was carried out by George F. Mahl and colleagues. During the following decades disfluency has received attention from a wide variety of other fields. These proceedings are the result of a workshop held in Gothenburg, Sweden, the third in a series of workshops devoted to disfluency. The first, Disfluency in Spontaneous Speech, was a one-day event, held at Berkeley University, 30 July, 1999, as a satellite of the 14th International Congress of Phonetic Sciences in San Francisco. The second event was a three-day workshop held at Edinburgh University, 29�31 August, 2001, as a satellite of Eurospeech 2001 in Aalborg, and was given the acronym DiSS �01. This was also an official ISCA tutorial and research orkshop. What you are now holding in your hands are the proceedings of DiSS �03, held at Göteborg University, 5�8 September, 2003, as a satellite of Eurospeech 2003 in Geneva. The name of these workshops � and consequently the title of these proceedings � includes the word �disfluency�, which may or not may not be considered a felicitous term. Indeed, the phenomenon under scrutiny is known under a wide variety of different terms including "non-fluency�, �dysfluency�, �discontinuity�, �flustered speech�, �speech disturbance�, �hesitation�, �speech management�, �own communication management�, �turnholding devices�, �changes of mind�, �self repair�, �self correction�, �self editing�, and even such a self-contradictory term (from an etymological point of view) as �normal dysfluency�. This list gives only the more common hyperonyms. It goes without saying that the choice of term(s) depends on the particular research perspectives which are numerous. Thus, disfluency research has been carried out within (just to name a few) stuttering research, general linguistics, cognitive psychology, consciousness philosophy, phonetics, gender studies, physiology, acoustics, and, more recently, within speech and language technology which was motivated by the launching of computerised dialogue systems. This diversity is reflected in the present volume which is somewhat arbitrarily divided into seven different parts. In the first part, General Aspects, Kirsner, Dunn & Hird take a closer look at pausing, and reviews recent research on pause analysis using a novel approach, arguing that short and long pause duration distributions are functionally independent. The second paper, by Nicholson, Bard, Lickley, Anderson, Mullin, Kenicer & Smallwood, address the causes of disfluency and assess the claim that, on the one hand, disfluency is a strategic device for intentional signalling to an interlocutor that the speaker is committed to an utterance, and on the other hand, that disfluency is an automatic effect of cognitive burdens. In the third paper, Finlayson, Forrest, Lickley & Beck study whether restricted ability to use gestures has an impact on speech fluency, thus correlating disfluency with the other communication mode.

Preambulum
4
The second part, Production, Perception and Monitoring, starts out with a paper by Nooteboom, who looks at the role of self-monitoring in the lexical bias of phonological speech errors. In another paper on monitoring, Howell questions whether a perceptual monitor is needed at all to explain speech repairs. Broadening the concept of monitoring from self-perception to the perception of other speakers, Hartsuiker, Corley, Lickley & Russell study perception of fluency in people who either do or do not stutter. In the third part, Disfluencies in First and Second Language Development, Rieger investigates hesitation strategies of intermediate learners of German as a second or foreign language. The second paper, by Menyhárt, studies alterations of disfluency phenomena as a function of age. The fourth part, Computational Aspects, opens with a paper by Aylett, who investigates how different factors influence the behaviour of an automatic speech recogniser. While automatic speech recognisers have reached accuracy levels that make such applications practical in public settings, disfluency still constitutes a problem for such systems. Funakoshi & Tokunaga describe a parser designed to handle ill-formed Japanese speech. Lager presents a computational model capable of dealing with spontaneous speech phenomena, such as hesitation and repairs. Lendvai, van den Bosch & Krahmer investigate how machine learning can be used for automatic disfluency chunking of spontaneous speech. In the closing paper, Adda-Decker, Habert, Barras, Adda, Boula de Mareuil & Paroubek compare different types of audio transcripts of French radio interviews with the goal of obtaining a better model of spontaneous speech. Part five, Repeats and Repairs in Different Languages, begins with a paper by Tseng, who presents a study of repairs and repetitions in Mandarin Chinese. Henry & Pallaud study the interaction of repeats and word fragments in French. Benkenstein & Simpson take an acoustic look at self-initiated repairs in German, comparing phonetic differences between reparandum and repair. The sixth part, Phonology and Prosody, contains two papers. In the first, Den presents a study of segmental prolongation in Japanese, taking into account factors such as speaker gender, word classes, word position, preceding fillers and others. In the second paper, Savova & Bachenko look for prosodic cues for different disfluency types, using intonation and duration to detect disfluency sites. The final session, Corpus and Annotation, is represented in the proceedings by a paper by Yang, Heeman & Strayer, who present a tool for annotation of speech disfluency called DialogueView. In particular, they describe a specific feature called �clean play� which deletes annotated speech reparanda and editing terms, and plays back the remaining speech. The papers included in these proceedings cover several different disciplines, and are thus illustrative of the interdisciplinary character of this area. It has been a rewarding task to edit the ensuing suite of papers, covering a wide array of different angles and approaches to the subject matter. It is my contention and conviction that they will contribute to an enhanced understanding of spontaneous speech in general, and disfluency in particular.
Robert Eklund Västerhaninge, 2003-08-13

5
Committees
Organising and Local Committee
Jens Allwood Robert Eklund Åsa Wengelin
Scientific Committee
Elisabeth Ahlsén Jens Allwood Herbert Clark Yasuharu Den Danielle Duez Robert Eklund Dafydd Gibbon Rob Hartsuiker Peter Heeman Richard Hirsch
Sotaro Kita Mark Knapp Robin Lickley
Madeline Maxwell Sieb Nooteboom Sharon Oviatt
Elizabeth Shriberg Marc Swerts
Shu-Chuan Tseng Åsa Wengelin
Webmaster, Photography, Proceedings Design, Editor
Robert Eklund

6
Homepage
Main Site
http://www.ling.gu.se/konferenser/diss03/
Mirror Site
http://roberteklund.info/diss03/

7
Contents
Session I: General Aspects
Kim Kirsner, John Dunn & Kathryn Hird Fluency: Time for a paradigm shift 13–16
Hannele Nicholson, Ellen Gurman Bard, Robin Lickley, Anne H. Anderson, Jim Mullin, David Kenicer & Lucy Smallwood The Intentionality of disfluency: Findings from feedback and timing
17–20
Sheena Finlayson, Victoria Forrest, Robin Lickley & Janet Mackenzie Beck Effects of the restriction of hand gestures on disfluency 21–24
Session II: Production, Perception and Monitoring
Sieb Nooteboom Self-monitoring is the main cause of lexical bias in phonological speech errors 27–30
Peter Howell Is a perceptual monitor needed to explain how speech errors are repaired?
31–34
Robert J. Hartsuiker, Martin Corley, Robin Lickley & Melanie Russell Perception of disfluency in people who stutter and people who do not stutter: Results from magnitude estimation 35–37
Session III: Disfluencies in First and Second Language Development
Caroline L. Rieger Disfluencies and hesitation strategies in oral L2 tests 41–44
Krisztina Menyhárt Age-dependent types and frequency of disfluencies 45–48

8
Session IV: Computational Aspects
Matthew P. Aylett Disfluency and speech recognition profile factors 51–54
Kotaro Funakoshi & Takenobu Tokunaga Evaluation of a robust parser for spoken Japanese 55–58
Torbjörn Lager In dialogue with a desktop calculator: A concurrent stream processing approach to building simple conversational agents 59–62
Piroska Lendvai, Antal van den Bosch & Emiel Krahmer Memory-based disfluency chunking 63–66
Martine Adda-Decker, Benoît Habert, Claude Barras, Gilles Adda, Philippe Boula de Mareuil & Patrick Paroubek A disfluency study for cleaning spontaneous speech automatic transcripts and improving speech language models
67–70
Session V: Repeats and Repairs in Different Languages
Shu-Chuan Tseng Repairs and repetitions in spontaneous Mandarin 73–76
Sandrine Henry & Berthille Pallaud Word fragments and repeats in spontaneous spoken French 77–80
Ramona Benkenstein & Adrian P. Simpson Phonetic correlates of self-repair involving word repetition in German spontaneous speech 81–84
Session VI: Phonology and Prosody
Yasuharu Den Some strategies in prolonging speech segments in spontaneous Japanese 87–90
Guergana Savova & Joan Bachenko Prosodic features of four types of disfluencies 91–94
Session VII: Corpus and Annotation
Fan Yang, Peter A. Heeman & Susan E. Strayer Acoustically verifying speech repair annotations 97–100

9
Author index
Adda, Gilles .................................................................................................... 67
Adda-Decker, Martine ...................................................................................... 67
Anderson, Anne H. ........................................................................................... 17
Aylett, Matthew P. ........................................................................................... 51 Bachenko, Joan................................................................................................ 91
Bard, Ellen Gurman ......................................................................................... 17
Barras, Claude ................................................................................................ 67
Beck, Janet Mackenzie ..................................................................................... 21
Benkenstein, Ramona ...................................................................................... 81
Bosch, Antal van den ....................................................................................... 63
Boula de Mareuil, Philippe ................................................................................. 67
Corley, Martin ................................................................................................. 35
Den, Yasuharu ................................................................................................ 87 Dunn, John ..................................................................................................... 13
Finlayson, Sheena ........................................................................................... 21
Forrest, Victoria .............................................................................................. 21
Funakoshi, Kotaro ........................................................................................... 55
Habert, Benoît ................................................................................................ 67
Hartsuiker, Robert J. ........................................................................................ 35
Heeman, Peter A. ............................................................................................ 97
Henry, Sandrine .............................................................................................. 77
Hird, Kathryn .................................................................................................. 13
Howell, Peter .................................................................................................. 31
Kenicer, David ................................................................................................ 17
Kirsner, Kim ................................................................................................... 13

10
Krahmer, Emiel ............................................................................................... 63
Lager, Torbjörn ............................................................................................... 59
Lendvai, Piroska .............................................................................................. 63
Lickley, Robin J. ....................................................................................17, 21, 35
Menyhárt, Krisztina ......................................................................................... 45
Mullin, Jim ...................................................................................................... 17
Nicholson, Hannele .......................................................................................... 17
Nooteboom, Sieb G. ........................................................................................ 27
Pallaud, Berthille ............................................................................................. 77
Paroubek, Patrick ............................................................................................ 67
Rieger, Caroline L............................................................................................. 41 Russell, Melanie .............................................................................................. 35
Savova, Guergana............................................................................................ 91
Simpson, Adrian P. .......................................................................................... 81
Smallwood, Lucy ............................................................................................. 17
Strayer, Susan E. ............................................................................................ 97 Tokunaga, Takenobu ....................................................................................... 55
Tseng, Shu-Chuan............................................................................................ 73
Yang, Fan ....................................................................................................... 97

Session I: General Aspects

12

Proceedings of DiSS’03, Disfluency in Spontaneous Speech Workshop, 5–8 September 2003, Göteborg University, Sweden. Robert Eklund (ed.), Gothenburg Papers in Theoretical Linguistics 90, ISSN 0349–1021, pp. 13–16.
13
Fluency: Time for a paradigm shift
Kim Kirsner†, John Dunn† & Kathryn Hird‡
† University of Western Australia ‡ Curtin University of Technology
Abstract Pauses in spontaneous speaking constitute a rich source of data for several disciplines. They have been used to enhance automatic segmentation of speech, classification of patients with acquired communication disorders, the design of psycholinguistic models of speaking, and the analysis of psychological disorders. Unfortunately, however, although pause analysis has been with us for more than 40 years, their interpretation has been compromised by several problems [6]. The first problem is that the pause distribution is skewed, making mean duration a poor measure of central tendency. The second problem is that there are at least two components to the pause duration distribution, a problem that has been confounded by the fact that most authors have assumed that short pauses can be ignored. The third problem is that many scholars have used an arbitrary criterion to separate the pause components, thereby adopting statistics that reflect errors of commission or omission.
In this paper we review recent work that resolves each of these issues and illustrates the application of the new paradigm to a variety of problems. Our research indicates that, first, there are at least two pause duration distributions, each of which may be sensitive to theoretically interesting variables; second, the distributions are log-normal, thereby opening the way to appropriate measures of central tendency and dispersion, and, third, the distributions can be reliably separated by application of signal detection theory, and the proportion of misclassifications minimised and estimated. This paper reviews recent research using the new approach to pause analysis.
1. Introduction The objective of this paper is to review problems that have compromised pause analysis, and table provisional solutions to those problems. The first problem concerns the shape of the pause duration distribution. Because the distribution is skewed, it provides a poor platform for conventional statistical analysis. The fact that the pause distribution is skewed was first reported by Quinting [9] however his paper has had little or no impact on pause analyses in either clinical or research work.
A typical pause duration distribution is shown in Figure 1. It shows the pause duration distribution for a 20 minute autobiography by an English first language speaker. PRAAT was used to measure the duration of all pauses greater than 20 msec. The mean, median, mode, standard deviation and range for this distribution are 240, 69, 32, 434 and 20–5156 msec, respectively. The distribution is obviously skewed, and the traditional measures of central tendency and dispersion are therefore inappropriate. The scale of the problem is indicated by the fact that negative numbers are encountered within one standard deviation of the mean. The distribution meets the conditions that Limpert, Stahel & Abbt [8] specified for the use of log-normal procedures; that is, the mean values are low, the variance is large, and values cannot be negative.
Figure 1: Pause distribution (msec) for 20 minute autobiography from individual participant.
The second problem involves the arbitrary rejection of short pause data in research involving spontaneous speech. This convention was adopted following Goldman-Eisler’s seminal work [3], on the basis of which it was argued that ultra-short pauses (below about 250 msec) reflected processes qualitatively different from longer pauses (above 250 msec). The distinction originally involved the contrast between ‘articulation’ and ‘hesitation’ pauses [3], and the argument was applied more or less universally despite evidence that the majority of pauses in the 130–250 msec range at least could not be attributed to articulation [5].
The third problem involves the wide variety of criteria that have been used by different authors to identify theoretically significant pause durations. Goldman-Eisler [3] adopted 250 msec as the most appropriate value to separate ‘articulatory’ and hesitation’ pauses, and while this value has proved popular in subsequent research, speech scientists have also used a variety of values ranging from 100 msec to more than one second [7]. For comparative purposes it is imperative that speech scientists adopt a uniform approach to the criterion problem.
A fourth and related problem involves the certainty that each individual will have a unique criterion or, worse, each individual will have a criterion that will actually fluctuate according to topic, task, time of day, age, general health, and neurological status. This problem poses a particularly significant challenge because it can only be answered by adopting measurement procedures that specify the criterion for each individual or, more probably, each speech sample.
The procedure that we have adopted to solve these problems involves two steps. The first step is based on the proposition that log transformations are appropriate for characterising data when distributions are skewed, variances are large, and negative values inadmissible. Figure 2 depicts the pause data from Figure 1 following log transformation (ln) of the original values. The data do not conform exactly to the obvious prediction based on Limpert, Stahel & Abbt [8]. Instead of observing a single log-normal function; the observed pattern involves at least two log-normal functions, a pattern reported independently by Campione & Veronis [1] and Kirsner, Dunn, Hird, Parkin & Clark [6].
0.00
0.10
0.20
0.30
0 2000 4000 6000Pause Duration (msec)
Prop
ortio
n
m = 240s = 434me = 69mo = 32ra = 20 - 5156

Kirsner, Dunn & Hird
14
0.00
0.05
0.10
0.15
0.20
2 3 4 5 6 7 8 9Pause Duration (ln)
Prop
ortio
n
me1 = 3.95 ± 0.47me2 = 6.30 ± 0.74
Figure 2: Pause distribution (ln msec) for 20 minute autobiography from individual participant.
The second step involved a modelling procedure supplemented by an application of signal detection theory. The modelling procedure was used to define the log-normal distributions reflected and characterised in Figure 2. As depicted there, the median and standard deviations for the components are 3.95 ± 0.47 and 6.30 ± 0.74. The real values that correspond to these medians are 52 and 545 msec.
Signal detection theory was used to define the criterion where the criterion was chosen so as to minimise the proportion of misclassifications. The criterion for this data set was 4.93 (138 msec) and the proportion of misclassifications associated with this solution was 0.026. Further analysis indicated that the distribution of speech segment durations was also log-normal, and that, when the speech segments were defined by pauses that exceeded 138 msec, the median speech segment duration was 7.04 in log time or 1156 msec in real time.
2. Data In this section we will present selected results from four experiments involving the data analysis procedures described above. The experiments have been selected to illustrate the value of these procedures for the cognitive, communication and clinical domains, and introduce the mapping procedure that we have used to characterise the short and long pause distributions. Experiments 2, 3 and 4 were implemented in collaboration with Lesley Churchyard, Momoko Taira and Natalie Ciccone respectively. Experiment 1. Story generation versus story recall. Participants in Experiment 1 provided five three-minute stories about friends or members of their families. PRAAT was used to measure the duration of all pauses greater than 20 msec. Figure 3 depicts the results from just two of these trials, involving generation of one story and the recall of the same story. It was hypothesized that recall would selectively influence the long pause as distinct from the short pause distribution, although we could find no precedent involving this precise manipulation. Figure 3 shows the difference in the medians between recall and generation for short and long pause durations.
The results are consistent with this prediction; while the difference in median long pause duration is generally positive, indicating longer pauses under recall than generation conditions, there is no consistent effect on the difference in short pause duration.
Experiment 2: Fluency in normal and amnesic speakers. The second experiment was originally designed to examine the impact of incidental repetition on word duration during spontaneous speech [10]. The speakers were asked to describe
how they would do a number of everyday chores, including for example making a sandwich or changing a tyre.
-100-80-60-40-20
02040
-100 0 100 200 300 400
Long Pause Duration (Recall - Generation)
Shor
t Pau
se D
urat
ion
(Rec
all -
Gen
erat
ion)
Figure 3: The differences between recall and generation for short and long pause duration.
The procedure did not include questions that would have required the participants to recall specific episodes, and it therefore involves ‘implicit’ or ‘semantic’ memory rather than ‘explicit’ memory.
The speech collected for the original study was re-analysed and PRAAT was used to measure the duration of all pauses greater than 20 msec. The participants were 10 institutionalised amnesic patients, all of whom presented with symptoms consistent with Korsakoff’s syndrome, and ten aged matched controls. Figure 4 depicts median short and long pause duration for the participants in the control group and for two of the amnesics. The means and standard deviation are shown for the control group and, while the amnesic values fall well inside 99% confidence intervals for short pause duration, they fall well outside the 99% confidence intervals for long pause duration. It is as if the presence of amnesia has selectively influenced long pause duration in these participants despite the fact that the task involved general knowledge about familiar tasks – a semantic memory task in Tulving’s terminology [11] – and did not directly challenge or require the use of explicit retrieval processes, the sine qua non of memory failure in amnesia.
30
50
70
90
110
250 750 1250 1750 2250
Long Pause Duration
Shor
t Pau
se D
urat
ion
Controls
Amnesics
Figure 4: Short and Long Pause Duration for two Korsakoff amnesiacs and ten control participants. Experiment 3: Fluency in Japanese First Language and English Second Language Speakers (JFL/ESL). The third experiment involved the collection of three 3-minute speech samples from each of 11 JFL/ESL speakers living in Perth, a multi-cultural but predominantly English-speaking community. The second and third samples were in Japanese and English respectively, and involved stories about the participant’s favourite holiday destinations, in Japan and Australia, respectively. The results indicated that, overall, the participants had longer short pause duration medians and longer long pause duration medians in English than Japanese, and that each of these effects was statistically significant. Figure 5 is a summary of the results, showing the increase in

Proceedings of DiSS’03, Disfluency in Spontaneous Speech Workshop, 5–8 September 2003, Göteborg University, Sweden. Robert Eklund (ed.), Gothenburg Papers in Theoretical Linguistics 90, ISSN 0349–1021, pp. 13–16.
15
the median durations for the short and long pauses for English relative to Japanese.
-10
0
10
20
30
-200 0 200 400 600
Long Pause Duration Difference Values (English - Japanese)
Shor
t Pau
se D
urat
ion
Diff
eren
ce V
alue
s (E
nglis
h - J
apan
ese)
Figure 5: Difference values (English – Japanese) for short and long pause duration in story-telling. The correlation between the short and long pause duration values observed in Figure 5 was significant, (r (10) = 0.57), but the variables were also related to, ‘hours of training and experience in English’, indicating that practice in the participant’s second language influenced both short and long pause duration. We also found that the participant’s had longer median speech segment durations in English than Japanese, at 898 versus 1044 msec, however the extent to which this is due to language differences or practice differences between the speaker’s languages cannot be determined from our data.
Experiment 4: Fluency in normal and aphasic speakers. The fourth experiment involved the analysis of speech collected from eight aphasics and 13 control participants. Each person provided four narratives/ descriptions during each of each of eight sessions. PRAAT was used to measure the duration of all pauses greater than 20 msec.
The results depicted in Figure 6 are means based on the medians calculated separately for each individual for each session. The means for the control group are 67 ± 8 and 749 ± 111 msec for short pause duration and long pause duration respectively. The individual vales for the ‘Broca’ and ‘Anomic’ patients as classified by the Boston Diagnostic Aphasia Examination are both outside the 99% confidence intervals for the control participants.
40
60
80
100
120
250 750 1250 1750 2250
Long Pause Duration
Shor
t Pau
se D
urat
ion
Controls
Broca
Anomic
NC
Figure 6: Short and Long Pause Duration for three aphasics and 13 control participants.
Criteria for normal participants. The research reported in this paper was designed in part to overcome the problems associated with the use of different but arbitrarily selected criteria to distinguish different types of pauses.
Figure 7 depicts the criteria for 33 speakers. Twenty of these speakers participated in the memory experiment reported above, and the other 13 were the control participants for the aphasia experiment. The mean for each individual was based
on between 600 and 2000 pauses involving between three and eight separate data acquisition sessions. The mean, standard deviation and range for the criteria were 255, 83 and 98 – 490 msec, respectively. The misclassification errors associated with these values ranged from less than one percent to 16 percent. The mean criterion is remarkably consistent with the general criterion advocated by Goldman-Eisler [3], 250 msec (see arrow in Figure 6); although the spread is consistent with our assertion that adoption of a general criterion for all participants is inappropriate.
0
100
200
300
400
500
600
1 4 7 10 13 16 19 22 25 28 31
Participant
Crit
erio
n (m
sec)
Figure 7: Criteria for 33 normal English speakers.
3. Concluding remarks While interpretation of double dissociations requires a degree of caution [2], it is nevertheless appropriate to present our results within this frame of reference. What is the relationship between the two pause types? Do they involve independent processes for example, or do they reflect the operation of a single process at two temporally distinct moments in language production, and, if that characterization is valid, do they involve intersecting or non-intersecting sets of variables?
The results of Experiments 1, 2 and 3 are consistent with the hypothesis that the short and long pause duration distributions are functionally independent. Whereas recall instructions and amnesia selectively influence long pause duration, and we found a similar pattern for the Broca’s aphasic, anomia selectively influenced short pause duration. On the other hand, the contrast between first and second language fluency was reflected in changes in both short and long pause durations, and individual differences in short and long pause duration were correlated in the memory experiments (in data not summarised above).
There are two classes of explanation for an association between short and long pause duration even if they are functionally independent. First, because both sets of pauses operate through a single and common functional unit [4], the vocal tract, variables that influence this unit are likely to produce correlated changes on each measure. This may be affected by changes in health, emotional status, arousal, tension and, significantly, variables that moderate coordination of the language production system [12]. The second class of variable concerns practice. Practice can be expected to operate on variables such as articulation pauses, speed of articulation, phonological error detection and correction and voiceless transitions, all potentially affecting short pause duration. But practice can also be expected to affect retrieval and implementation efficiency of both syntactic and lexical structures, thus potentially affecting long pause duration.
However, the functional independence of short and long pause durations suggests that they are affected by at least partially independent variables even if these variables are also moderated by higher level variables such as emotion and practice. In addition to the selective effects identified in the

Kirsner, Dunn & Hird
16
first three experiments, it is to be expected that variables such as intention, attention, planning, topic change, and inspiration will selectively influence long pause duration although, until appropriate data is available this hypothesis is speculative.
The implications of our research are as follows. First, the analysis of spontaneous speech requires new foundations involving the use of signal detection or other models to determine individual criteria. Second, the longstanding and widespread disinterest in short pauses must be reversed. Third, answers to questions about the process or processes responsible for short and long pauses are integral to language production, and cannot be treated as if they involve questions separate from models of this domain. Fourth, because each coordination moment provisionally involves information from component processes from different ‘domains’, their presence challenges modular approaches to language production.
4. References [1] Campione, E. & J. Veronis. 2002. A Large-Scale
Multilingual study of silent pause duration. http://www.Ipl.univ.aix.fr/sp22002/pdf/campione-veronis.pdf
[2] Dunn, J. C. & K. Kirsner. 2003. What can we infer from double dissociations? Cortex, vol. 39, pp. 1–7.
[3] Goldman-Eisler, F. 1968. Psycho-linguistics: Experiments in spontaneous speech. New York: Academic Press.
[4] Gracco, V. L. 1990. Characteristics of speech as a motor control system. Cerebral control of speech and limb movements. G. E. Hammond. North Holland, Amsterdam: Elsevier Science Publishers B.V, pp. 3–28.
[5] Hieke, A. E., S. Kowal & D. C. O’Connell. 1983. The trouble with “articulatory” pauses. Language and Speech, vol. 26, pp. 203–214.
[6] Kirsner, K., J. Dunn, K. Hird, T. Parkin & C. Clark. 2002. Time for a pause… Proceedings Ninth International Speech Science Technology Conference, Melbourne.
[7] Kowal, S., R. Wiese & D. C. O’Connell. 1983. The use of time in story-telling. Language and Speech, vol. 26, no. 4, pp. 377–392.
[8] Limpert, E., W. A. Stahel & M. Abbt. 2001. Log-normal distributions across the sciences: Keys and Clues. Bioscience, vol. 51, no. 5, pp. 341–352.
[9] Quinting, G. 1971. Hesitation phenomena in adult aphasic and normal speech. The Hague.
[10] Robertson, C. & K. Kirsner. 2000. Indirect memory measures in spontaneous discourse in normal and amnesic subjects. Language and Cognitive Processes, vol. 15, no. 2, pp. 203–222.
[11] Tulving, E. 1972. Episodic and Semantic Memory. In: E. Tulving & W. Donaldson (eds.), The Organization of Memory, New York: Academic Press, pp. 382–404.
[12] Turvey, M. 1990. Coordination. American Psychologist, vol. 45, pp. 938–953.

Proceedings of DiSS’03, Disfluency in Spontaneous Speech Workshop, 5–8 September 2003, Göteborg University, Sweden. Robert Eklund (ed.), Gothenburg Papers in Theoretical Linguistics 90, ISSN 0349–1021, pp. 17–20.
17
The intentionality of disfluency: Findings from feedback and timing
Hannele Nicholson1, Ellen Gurman Bard1, Robin Lickley2, Anne H. Anderson3, Jim Mullin3, David Kenicer3 & Lucy Smallwood3
1 University of Edinburgh, Edinburgh, Scotland 2 Queen Margaret University College, Edinburgh, Scotland
3 University of Glasgow, Glasgow, Scotland
Abstract This paper addresses the causes of disfluency. Disfluency has been described as a strategic device for intentionally signalling to an interlocutor that the speaker is committed to an utterance under construction [14, 21]. It is also described as an automatic effect of cognitive burdens, particularly of managing speech production during other tasks [6]. To assess these claims, we used a version of the map task [1, 11] and tested 24 normal adult subjects in a baseline untimed monologue condition against conditions adding either feedback in the form of an indication of a supposed listener’s gaze, or time-pressure, or both. Both feedback and time-pressure affected the nature of the speaker’s performance overall. Disfluency rate increased when feedback was available, as the strategic view predicts, but only deletion disfluencies showed a significant effect of this manipulation. Both the nature of the deletion disfluencies in the current task and of the information which the speaker would need to acquire in order to use them appropriately suggest ways of refining the strategic view of disfluency.
1. Introduction Disfluency is known to be more common in dialogue than in monologue [19]. Explanations for this fact fall into two categories. One ties disfluency to active strategies for cultivating common ground, the accumulating knowledge that interlocutors are mutually conscious of sharing [9, 13, 21], while the other sees disfluency as an accidental result of cognitive burdens [6], which necessarily increase when a speaker must process a listener’s utterances while composing his or her own.
In the strategic view, disfluency is one of a number of intentional strategies which speakers employ to maintain mutuality. Clark & Wasow [14] argue that repetition disfluencies are strategically deployed to signal ongoing difficulty in producing an utterance to which the speaker is nonetheless committed. Evidence of prosodic cues that signal strategic intention has been obtained for repetitive repair [21].
In the alternate view, conversation is a cognitively taxing process and competition is high for production resources [3, 4, 9, 15, 16]. A speaker must design the sub-goals of any task which a dialogue helps the interlocutors to pursue, plan the sections of the dialogue which correspond to these goals, and attend to the contributions of the interlocutor, while micro-planning his/her own utterances [4, 5]. Disfluencies may occur when this burden becomes so great that errors in planning or production are not detected and edited covertly before articulation begins. Increases in disfluency accompanying increased complexity of any of the cognitive functions underlying dialogue are taken to support this view. Long utterances, which tend to be more complex than short, certainly tend to be disfluent more often [14]. Bard and her
colleagues have shown that even with utterance length taken into account, production burdens correlate with disfluency: formulating multi-reference utterances and initiating new sections of the dialogue both tend to encourage disfluency. In contrast, no characteristics of the prior interlocutor utterance have any independent effect on disfluency rate. This account of disfluency joins other models of dialogue phenomena in ascribing to the speaker’s own current needs many of the behaviours which are often thought to be adaptations to a developing model of the listener’s knowledge [See 2, 3, 4, 5, 8, 20].
This paper presents the first group of results from a series of experiments designed to discover whether speakers are more concerned with attending to their listeners’ knowledge or completing their own production tasks. The experiments use a variant of the map task [1, 11]. In the original task, players have before them versions of a cartoon map representing a novel imaginary location. The Instruction Giver communicates to the Instruction Follower a route pre-printed on the Giver’s map. The current series uses only Instruction Givers and manipulates both time-pressure and feedback from a presumptive Follower.
The time-pressure variable contrasts instructions composed in the Giver’s own time with a time-limited condition. If disfluencies are a basic signaling device and important to the conduct of a dialogue, then this manipulation will not affect them. If disfluencies are failures of planning, time-pressure should increase their rate of occurrence. If, on the other hand, disfluencies are a luxury, a rhetorical device available to speakers but not required for the process of maintaining mutual knowledge, then they may be more common when interlocutors have the time to indulge in them, that is, in the untimed condition.
The feedback variable contrasts monologue map tasks, supposedly transmitted to a listener in another room, with tasks for which there is minimal feedback in the form of a square projected on the map to represent the direction of the Follower’s gaze. If modeling the listener’s knowledge is critical to the process of dialogue, then this is the most important kind of feedback, for it tells one interlocutor what the other knows about the map and how s/he interprets the instructions. If speakers treat these tasks as interactive, and if disfluency is an intentionally helpful signal, then disfluency should be more common in this condition than in pure monologue. For example, repetition disfluency should be induced by the availability of the listener [14].
The interactions of these two manipulations are of particular interest. A pure strategic model demands a main effect of feedback but would sit well with enhanced rates of disfluency in the feedback condition with time pressure, where most difficulties would arise. A pure cognitive difficulty model predicts enhanced rates of disfluency under time pressure, but particularly again where feedback and time-pressure both add

Nicholson, Bard, Lickley, Anderson, Mullin, Kenicer & Smallwood
18
to the speaker’s cognitive burdens. Associated with the cognitive difficulty model are a set of results which could support a hybrid view: that listener-centric behaviour in dialogue is a luxury [15, 16] which will be abandoned when the speaker has more pressing tasks to pursue. This model predicts that disfluencies will appear at a higher rate where feedback makes the task interactive and where ample time permits the consideration of the listener’s needs.
2. Method 2.1. Task Disfluencies are obtained from the MONITOR corpus currently under collection [7]. This corpus employs a variant of the map task [1, 11]. In this version of the MONITOR task, subjects are seated before a computer screen displaying a map of a fictional location which includes a route from a marked start-point to buried treasure. Labelled landmarks and map designs are adapted from the HCRC Map Task Corpus [1]. Subjects are requested to help a distant listener reproduce the route. Subjects’ instructions were recorded onto the video record by a close-talking microphone and their gaze direction was recorded by a screen-mounted eye-tracker. At the beginning of each trial, the tracker was calibrated.
2.2. Experimental Design The experiment crossed feedback (2) and time-pressure (2). In the no feedback conditions, subjects saw only the map. In the feedback condition, a small moving square was superimposed on the map and subjects were told that this represented the current direction of their Instruction Follower’s gaze. Unbeknownst to the subjects, there was no actual Follower. The feedback gaze-square followed a pre-programmed sequence. It remained on the landmarks determining the route until the first two or three had been successfully negotiated. Subsequently, feedback gaze wandered off-course at least once every other landmark The pattern of incorrect gaze-responses corresponded roughly to the distribution of landmarks which did not match across Giver and Follower maps in [1]. In four cases in each map, the feedback square did not go to the intended landmark, but instead moved to a second, but distant, copy of that landmark or to a space on the map which would have hosted a landmark on the Follower’s version of the corresponding HCRC map. In each case, once the subject had introduced the next route-critical landmark, an experimenter in another room advanced the feedback gaze square to its next scheduled target. The square moved about its target landmark in a realistic fashion, with sorties of random radius and angle.
Crossed with feedback was the time-pressure variable. In half of the trials, speakers were permitted only one minute to complete the task; otherwise time was unlimited.
Subjects with normal uncorrected vision were recruited from the Glasgow University community. All were paid for their time. All encountered all 4 conditions. Four different basic maps were used, counter-balanced across conditions over the whole design. Subjects were eliminated if any single map trial failed to meet criteria for feedback or capture quality. The feedback criterion demanded that the experimenter advance the feedback square between the introduction of the pertinent landmark and the onset of the following instruction in all cases where where the feedback was scheduled to be errant and in 70% where the square’s movement was scheduled to be correct. The capture criterion demanded that at least 80% of the eye-tracking data was intact. Fifty-four subjects were run before 24 remained with valid sessions in all conditions and with a balanced design in total.
3. Results
3.1. Dialogue Structure Each monologue was transcribed verbatim and then coded for transaction [12]. A transaction is a block of speech in task-oriented dialogue which accomplishes a task sub-goal. Accordingly, in this task Normal transactions are periods of standard instruction giving. Review transactions recount the route negotiated thus far. Overviews describe the route or map in general. Irrelevant transactions are all off-task remarks.
A fifth type of transaction, Retrievals, was identified in the present monologues and can be used to show that the feedback conditions were in fact interactive. In a Retrieval the speaker neither gives new instructions nor reviews the route but instead moves the presumed IF to a previously named landmark where s/he should be but apparently is not. Figure 1, which divides Transactions by type in each of the four conditions, shows that Retrievals occurred in the two feedback conditions (13% of all Transactions in Feedback-Timed; 18% in Feedback-Untimed) but very rarely otherwise (0.8% of all No Feedback Timed Transactions and 0.3% of No Feedback Untimed: by-subjects 2 × 2 repeated measures ANOVA main effect for Feedback, F1(1,23) = 25.84, p < .001). The imbalance suggests that Retrievals are unlikely to be mere clarifications, independent of the IF’s behaviour. Since each speaker encountered 4 off-route gaze locations per dialogue, the average number of Retrieval transactions per dialogue, 1.58 for Feedback Timed; 2.58 for Feedback Untimed, shows fairly good uptake of the feedback square’s ‘mistakes’. The effect of Time-pressure approached significance (F1(1,23) = 4.12, p = .054). but only because of an increase in Retrievals in Feedback conditions (interaction: F1(1,23) = 5.40, p = .029).
As Figure 1 also shows, Retrievals do not follow the general trends for volume of transactions. Both Normal transactions and total number of transactions are more numerous in the Untimed conditions (11.40 Normal transactions, 13.83 in total per trial) than in the Timed (9.63 Normal, 11.27 total) (F1(1,23) = 5.77, p = .025 for normal; F1(1,23) = 9.95, p < .01, overall), with no effect of feedback. Other transaction types were unaffected by the experimental variables.
Figure 1: Mean numbers of transactions per trial by type and experimental condition (N = No Feedback; F = Feedback; T = Timed; U = Untimed).
3.2. Words Word counts included whole and part-words. Again results show less speech with time-pressure (224 words/trial on average) than without (319): (F1(1,23) = 33.69, p < .001). There was a non-significant tendency for speakers to resist the effect of time-pressure more with feedback (FT: 238 words/trial; FU: 316) than without (NT: 209; NU: 320): (F1(1,23) = 3.31 p = .082).
0 5 10 15 20
FT
FU
NT
NU
Con
ditio
n
Mean Frequency
NormalRetrievalReviewOther

Proceedings of DiSS’03, Disfluency in Spontaneous Speech Workshop, 5–8 September 2003, Göteborg University, Sweden. Robert Eklund (ed.), Gothenburg Papers in Theoretical Linguistics 90, ISSN 0349–1021, pp. 17–20.
19
3.3. Disfluencies Disfluencies were first labeled according to the system devised by Lickley [18]: as repetitions, insertions, substitutions or deletions. The disfluency coder used Entropic/Xwaves software to listen, view and label disfluent regions of speech. Spectrograms were analyzed whenever necessary. Each word within a disfluent utterance was labeled as belonging to the onset, reparundum, repair, or continuation [17].
Because disfluencies are more common in longer utterances [3, 14, 21], raw disfluency counts may reflect only opportunities for disfluency. To provide a measure of disfluency rate, we divided the number of disfluencies in a monologue by its total number of fluent words, that is by the total number of words less the words in reparanda.
Figure 2: Rates of disfluency by type and experimental condition
The data in Figure 2 display a pattern which would be predicted from an strategic model of disfluency: Speakers were more disfluent in conditions with feedback (0.044) than in conditions without feedback (0.034), (F1(1,23) = 8.66, p = .007), but were unaffected by time pressure (F1(1,23) = 1.87, p = .185) or by any interaction (F1(1,23) < 1). Because transaction-initial utterances are prone to disfluency, the effects were recalculated with number of transactions in the trial as a covariate. Again, only feedback affected disfluency (F1(1,22) = 11.33, p < .003).
3.4. Disfluency Type Figure 2 also displays the breakdown of disfluencies by type across experimental conditions. Only the rate of deletions showed any significant effect of feedback: an increase in the feedback conditions (.008) over no feedback (.004): (F1(1,23) = 14.61, p = .001; F1(1,22) = 14.24, p = .001 with transactions as covariate). There was no overall effect of time pressure on deletion (F1(1,23) = 2.44 p > .10), though there was a non-significant tendency (F1(1,23) = 3.59, p = .071; F1(1,22) = 3.62, p = .070 with transactions as covariate) towards the ‘disfluency as luxury’ pattern: deletions tended to be more common in Feedback Untimed (0.010) than in Feedback Timed (0.007) trials, with no corresponding effect of time pressure in the No Feedback conditions (0.004 in both cases). No other type of disfluency and no combination of other types showed significant effects, though the rate of all non-deletion disfluencies was numerically higher (0.035) with feedback than without (0.030) (F1(1,23) = 3.21, p = .086).
4. Discussion and Conclusions The literature provided us with two major proposals for the causes of disfluency. One suggests that interlocutors intentionally employ disfluencies to warn each other of local difficulty. An interactive situation should encourage more disfluency, and if the signal function is critical, it should be maintained or even increase as the speaker’s difficulties are
augmented with increasing time pressure. An alternative view suggests that disfluency is an accident of heightened cognitive burden. If so, time pressure should promote disfluency particularly when feedback complicates the speaker’s task. A third prediction stresses the fragility of listener-centric behaviour. If disfluency is listener-centric and all such behaviour is at best an option available to speakers when time or attention permit, disfluencies should be more frequent when speakers are not under time pressure but are interacting with listeners. The experiment reported above successfully manipulated the interactive quality of the speaker’s task and the pressure to complete it efficiently. Feedback in the form of a visual representation of a presumptive listener’s gaze changed speakers’ strategic treatment of the route communication task. A novel type of transaction, provides circumstantial evidence that subjects took seriously the task of tracking and redirecting their listener’s gaze when it appeared to have strayed off-course. Retrievals were almost exclusive to the Feedback trials. Time pressure affected how much subjects said, with fewer transactions and fewer words under the one-minute limit.
With the manipulations effective in altering speakers’ behaviour, we can return to the predictions for disfluency rate. At first glance, disfluency seems to operate as an important strategic tool, with higher rates in the conditions with feedback and no effect of time-pressure. Yet, when disfluencies are subdivided by type, only deletion disfluencies were significantly more common in feedback trials. This fact is not just a result of sparse data in certain disfluency sub-types. Taken together, all the other kinds of disfluency still failed to respond robustly to feedback. Deletions alone support the strategic view.
Subject 10. Feedback Untimed Start Utterance 70.4340 ehm go around and do a big circle ehm like just
do a big loop down, not 71.4250 oh sorry there was 72.1388 <breath 72.2730 two stone creeks 72.4504 breath> 75.1890 ehm so yeah you're in the right place
Subject 19. Feedback Timed Start Utterance 55.6070 and then you take a right across the farmed land 56.4686 < breath 56.7157 breath> 57.8160 doing a s- 58.8550 no you go right right at the farmed land
Figure 3: Deletion examples. Deletion disfluency in boldface. It cannot yet be said that they support it conclusively. First, there was a nearly significant interaction of the type which would be predicted if disfluency were a luxury: disfluency rates were highest in the untimed feedback trials rather than in the timed, where there ought to have been more problems to report. Though we are unable to conclude definitively that deletions result from some optional rhetorical strategy, their content invites further investigation.
The examples in Figure 3 are typical. Subject 10 appears to be abandoning an utterance because he encountered
0 0.02 0.04 0.06
FT
FU
NT
NU
Con
ditio
n
Disfluencies per fluent word
DeletionsSubstitutionsInsertionsRepetitions

Nicholson, Bard, Lickley, Anderson, Mullin, Kenicer & Smallwood
20
difficulties in reading the map, and resumed with more accurate instructions. His deletion marks ‘Giver failure’. Subject 19, on the other hand, interrupts the flow of speech and begins anew because the feedback gaze square did not move in the correct direction. This is an instance of ‘Follower failure’: the ‘Follower’s’ action appears to have induced the subject to abandon an instruction which the Follower was in no position to obey.
Though deletions are indicators of interaction, it would be difficult to see them as signalling commitment to an utterance, as is thought to be the case for repetitions [14]. Instead, by abandoning an utterance, the speaker is expressing either the inadequacy of his/her own description or inappropriacy of the Follower’s response. Whether the two functions are equally likely in both timing conditions we do not yet know.
It is plain, however, that both of these actions would require visual attention beyond what is needed for tracking the route to the next landmark and describing it. Our preliminary analyses of the eye-tracking data captured during these trials indicate that subjects’ gaze primarily at the landmarks which are critical to the route [7]. The operations which appear to underlie deletions would produce two different patterns of off-route speaker gaze: scanning the map in the case of Giver failures and monitoring the feedback square’s location in the case of Follower failures. If digressions are more common with feedback than without, and if they predominantly track the feedback square, then we may have a visual substrate for Follower failure deletions. If digressions are more common in untimed trials than in timed, then time to acquire the knowledge which underlies any deletion may be the real luxury afforded by our paradigm. Exactly how such a luxury is used – for better scanning of the map or tracking of the interlocutor, we do not yet know. At present, we are examining Giver gaze data to determine which patterns accompany disfluency.
5. Acknowledgements The authors would like to thank Maria Luisa Flecha-Garcia and Yiya Chen who devised and administered the transcription and dialogue coding systems. This work was supported by EPSRC Research Grant GR/R59038/01 to Ellen Gurman Bard and and GR/R59021/01 to Anne H. Anderson.
6. References [1] Anderson, Anne H., Miles Bader, Ellen Gurman Bard,
Gwyneth Doherty, Simon Garrod, Steve Isard, Jacqueline Kowtko, Jan McAllister, Jim Miller, Cathy Sotillo, Henry S. Thompson, and Regina Weinert, 1991. The HCRC Map Task Corpus. Language and Speech, vol. 34, pp. 352–366.
[2] Anderson, Anne H., Ellen Gurman Bard, Cathy Sotillo, Alison Newlands & Gwyneth Doherty-Sneddon, 1997. Limited visual control of the intelligibility of speech in face-to-face dialogue. Perception and Psychophysics, vol. 59(4), pp. 580–592.
[3] Bard, Ellen Gurman, Anne H. Anderson, Cathy Sotillo, Matthew Aylett, Gwyneth Doherty-Sneddon & Alison Newlands. 2000. Controlling the intelligibility of referring expressions in dialogue. Journal of Memory and Language, vol. 42, pp. 1–22.
[4] Bard, Ellen Gurman, Matthew Aylett & Matthew Bull. 2000. More than a stately sance: Dialogue as a Reaction Time experiment. Proceedings of the Society for Text and Discourse.
[5] Bard, Ellen Gurman & Matthew Aylett, 2001. Referential Form, Word duration, and Modelling the Listener in Spoken Dialogue. Proceedings of the 23rd Annual Conference of the Cognitive Science Society.
[6] Bard, Ellen Gurman, Matthew Aylett & Robin Lickley,2002. Towards a Psycholinguistics of dialogue: Defining Reaction time and Error Rate in a Dialogue Corpus. EDILOG 2002. Proceedings of the 6th workshop on the semantics and pragmatics of dialogue. Edinburgh: The University of Edinburgh.
[7] Bard, Ellen Gurman, Anne H. Anderson, Marisa Flecha-Garcia, David Kenicer, Jim Mullin, Hannele B.M. Nicholson, Lucy Smallwood & Yiya Chen, 2003. Controlling Structure and Attention in Dialogue: The Interlocutor vs. the Clock. Proceedings of ESCOP, 2003, Granada, Spain.
[8] Barr, Dale J. & Boaz Keysar, 2002. Anchoring comprehension in linguistic precedents. Journal of Memory and Language, vol. 46, pp. 391–418.
[9] Brennan, Susan. & Herbert H. Clark, 1996. Conceptual Pacts and Lexical choice in Conversation. Journal of Experimental Psychology: Learning, Memory and Cognition, vol. 22(6), pp. 1482–1493.
[10] Brown, P. & Gary S. Dell, 1987. Adapting production to comprehension – the explicit mention of instruments, Cognitive Psychology, vol 19, pp. 441–472.
[11] Brown, Gillian, Anne H. Anderson, George Yule, Richard Shillcock, 1983. Teaching Talk. Cambridge: Cambridge University Press.
[12] Carletta, Jean, Amy Isard, Steve Isard, Jacqueline Kowtko, Gwyneth Doherty-Sneddon, and Anne H. Anderson, 1997. The reliability of dialogue structure coding scheme. Computational Linguistics, vol. 23, pp. 13–31.
[13] Clark, Herbert H. and Catherine. Marshall, 1981. Definite reference and mutual knowledge. In Aravind K. Joshi, Bonnie L. Webber, and Ivan A. Sag (eds.), Elements of discourse understanding. Cambridge: Cambridge University. Press.
[14] Clark, Herbert H. & Thomas Wasow, 1998. Repeating words in Spontaneous Speech. Cognitive Psychology, vol. 37, pp. 201–242.
[15] Horton, W. & Boaz Keysar, 1996. When do speakers take into account common ground? Cognition, vol. 59, pp. 91–117.
[16] Keysar, Boaz, 1997. Unconfounding common ground. Discourse Processes, vol. 24, pp. 253–270
[17] Levelt, Willem J.M., 1989. Monitoring and self-repair in speech, Cognition, vol. 14, pp. 14–104.
[18] Lickley, Robin J. 1998. HCRC Disfluency Coding Manual HCRC Technical Report 100. http://www.ling.ed.ac.uk/~robin/maptask/disfluency-coding.html
[19] Oviatt, Sharon, 1995. Predicting disfluencies during human-computer interaction. Computer Speech and Language, vol. 9, pp. 19–35.
[20] Pickering, Martin & Simon Garrod, in press, Towards a mechanistic theory of dialogue: The interactive alignment model. Behavioral & Brain Sciences.
[21] Plauché, Madelaine & Elizabeth Shriberg, 1999. Data-Driven Subclassification of Disfluent Repetitions Based on Prosodic Features. Proceedings of the International Congress of Phonetic Sciences, vol. 2, pp. 1513–1516, San Francisco.

Proceedings of DiSS’03, Disfluency in Spontaneous Speech Workshop, 5–8 September 2003, Göteborg University, Sweden. Robert Eklund (ed.), Gothenburg Papers in Theoretical Linguistics 90, ISSN 0349–1021, pp. 21–24.
21
Effects of the restriction of hand gestures on disfluency
Sheena Finlayson, Victoria Forrest, Robin Lickley & Janet Mackenzie Beck
Queen Margaret University College, Edinburgh, Scotland.
Abstract This paper describes an experimental pilot study of disfluency and gesture rates in spontaneous speech where speakers perform a communication task in three conditions: hands free, one arm immobilized, both arms immobilized.
Previous work suggests that the restriction of the ability to gesture can have an impact on the fluency of speech. In particular, it has been found that the inability to produce iconic gestures, which depict actions and objects, results in a higher rate of disfluency. Models of speech production account for this by suggesting that gesture and speech production are part of the same integrated system. Such models differ in their interpretation of the location of the gesture planning mechanism in relation to the speech model: some authors suggest that iconic gestures relate closely to lexical access, while others suggest that the link is located around the conceptualization stage.
The findings of this study tentatively confirm that there is a relationship between gesture and fluency – overall, disfluency increases as gesture is restricted. But it remains unclear whether the disfluency is more related to lexical access than to conceptualization. Proposals for a larger study are suggested.
The work is of interest to psycholinguists focusing on the integration of gesture into models of speech production and to Speech and Language Therapists who need to know about the impact that an impaired ability to produce gestures may have on communication.
1. Introduction A growing body of research suggests that many hand and arm gestures stem from the same basic process as the generation of spoken language, resulting in one interactive and co-expressive system. Gestures are assumed to enhance and elaborate on the content of accompanying speech but also form a part of the speech planning process. In some cases, like the description of spatial relationships between objects, gestures may be crucial to conveying the complete message. If this is so, what effect does the restriction of the ability to use gesture have? In this paper we describe preliminary research that compares some of the characteristics of speech produced with and without restrictions on arm movements: in particular, we investigate the relationship between restricted gestures and the production of disfluencies.
While many studies demonstrate that gesture may have a communicative function, conveying various forms of information to a listener [6], it is clear that gestures also serve some function in the speaker’s encoding of speech. Some authors contend that gesture has a role in facilitating lexical access [2, 11, 17], while others, following McNeill [15], take the view that gesture is involved at the level of conceptual planning of speech [1, 4]
These differing viewpoints can be described with reference to Levelt’s model of speech production [13], incorporating the basic components Conceptualiser, Formulator and Articulator and extending the basic model with some version of a gesture planning module. While Butterworth & Hadar’s [2]
explanation of apparent lexical facilitation by gesture would locate the source of iconic gestures within the lexicon itself, more recent accounts suggest that they are generated around or within the conceptualiser. In the model proposed by Krauss, Chen & Gottesman [12], iconic gestures (lexical, in their terminology) derive from non-propositional representations in working memory, just prior to the conceptualiser component of speech production. In their view, the gestures thus produced are able to facilitate lexical access by feeding into the phonological encoder within the formulator. De Ruiter’s [4] Sketch model and the Information Packaging Hypothesis of Kita and colleagues [1, 9] locates the source of gestures within the conceptualiser itself. In the Sketch model, the gesture planning module branches out of the conceptualiser, taking input from a sketch generation subcomponent, which uses spatio-temporal information, within the conceptualiser and feeding back a signal to the message generator as well as producing a motor program for the gesture. Unlike Krauss et al.’s model, there is no external feed into the lexical selection process: any such interaction must thus take place via the conceptualiser. Outside the conceptualiser, speech and gesture are produced independently and in parallel. While Krauss et al. argue that gestures can help to activate lexical items via some kind of cross-modal priming, de Ruiter’s model allows some spatial features to be activated and reactivated by gestures via a feedback loop from the gesture planner to the conceptualiser.
All authors agree that more hard data on gesture planning is needed before such models can be much more than speculative.
All of these models suggest that gesture may have a facilitatory role in the production of speech. By implication, it is suggested that the removal of the ability to gesture should therefore result in less efficient speech production. In particular, a lack of gesture could lead to lexical access difficulties or more general planning difficulties, particularly with spatial content phrases, where iconic gestures are very prevalent [11]. Such planning and lexical access difficulties typically induce disfluencies, especially hesitations – silent and filled pauses and stalling repetitions. Studies with restricted gestures have indeed shown that under such conditions, the time spent pausing [5] and the rate of disfluency [17] increase.
Other studies which examine the relationship between gesture and disfluency demonstrate that the timing of gesture and speech overlaps considerably – gesture does not have the function of filling a pause while a speaker plans, self-corrects or searches for a word. Seyfeddinipur & Kita [19] found that for disfluent stretches of speech, gestures are suspended just before speech stops and resume just before speech restarts. Similarly, in the speech of people who stutter, Mayberry & Jaques [14] found that iconic gestures did not occur during episodes of blocking or repetition, but only coincided with stretches of fluent speech. If, as suggested by the studies reported above, gesture has a role in the planning of speech or in accessing lexical items, its timing seems to be very closely linked to the relevant speech events.

Finlayson, Forrest, Lickley & Beck
22
In the present study, we aim to add to our understanding of the relationship between gesture and fluency, by partially replicating previous work, while extending the scope of the research to include partial (one-handed) gesture restriction.
Studies of the effects of partial immobilization on speech production are hard to find. Rimé, Schiarature, Hupet & Ghysselinckx [18] experimented with the immobilisation of various body parts (head, legs and arms) during spontaneous conversation. They found increased levels of movement in the body zones that were left free, but found no effect on the speech rate nor on fluency. Their study did not focus specifically on gestures nor did it examine closely the relationship between partial gesture restriction and fluency. Several studies suggest that gestures are most reliant on the speaker’s dominant hand [7, 8, 15, 20]. Given the findings reported above on complete restriction of hand movement, this poses the question of whether the restriction of the dominant hand only will produce similar effects on fluency, or whether the ability to use the non-dominant hand will compensate.
In this study, we compare the performance of subjects in 3 conditions: hands-free, both hands restricted, dominant hand restricted. The task was based on one used in previous studies (e.g. [16]): the narration of the story of a children’s animated cartoon. The story was useful in eliciting gestures, since subjects were required to describe a lot of movement and the cartoon contained barely any dialogue.
Given previous findings [5, 17], it was hypothesised that, relative to the hands-free condition, there would be a higher rate of disfluency in the condition where both hands were constrained.
In the condition where the dominant hand is constrained, current models do not suggest clear hypotheses. If the dominant hand is the more important in performing iconic gestures, and the other hand does not easily compensate, we would expect similar problems with formulating sentences or with lexical access, resulting in increased disfluency compared to the hands-free condition. However, if the non-dominant hand is able to compensate, then no effects on disfluency should be found (of course, this is indistinguishable from the null hypothesis, that there is no relationship between the ability to gesture and the ability to speak fluently).
The design of the task also allows us to look at relationships between disfluencies and another frequent gesture type, beat gestures, which, according to previous work, are less reliant on use of the dominant hand.
2. Method
2.1. Subjects Six subjects took part as speakers in the study. All were female, aged between 17–25 and from various social and educational backgrounds. None reported a history of mobility, auditory or communication problems and none had more than a minimal knowledge of sign language. Other participants took part as passive listeners: these people were within the same age range as the subjects. No participants were paid for taking part and all were free to withdraw from the experiment at any stage.
2.2. Materials The experiment took place in a sound-proofed room, measuring about 4m × 4.5m. Two straight-backed armchairs were placed in the room, facing each other, about 2m apart. The subjects’ armchair was fitted with strips of Velcro on the arms, to allow arm movements to be restricted when required. A digital video camera was placed behind the listeners’ chair,
facing the subject, so that the subjects’ head, trunk and arms were in focus.
2.3. Recording Procedure
Subjects were informed in advance that the study aimed to examine communicative behaviour in story telling. No reference to gesture was made in the instructions.
Each subject was required to watch a cartoon on video, while sitting alone in a quiet room. When the cartoon was finished, the subjects were asked to retell the story of the cartoon to a listener in the same room. Listeners took no part in any dialogue, but offered appropriate backchannels. This procedure was performed three times for each subject, each time with the same cartoon, but with a different listener. In the first session, subjects retold the story with no restrictions on arm movement. In the second session, three of the subjects had their dominant arm fastened to the arm of the chair with a Velcro strip, while the other three had both arms immobilised. In the third session, the arm-binding conditions were reversed, so that all subjects took part in all three conditions. There was a break of five minutes between each session.
2.4. Analysis
Orthographic transcriptions were made from the video recordings, and subsequently checked using digital sound files and speech waveforms on a PC, when disfluencies were annotated on the transcriptions.
Gestures were analysed using the video recordings viewed frame by frame. They were classified using McNeill’s definitions: iconics (depicting actions and objects), metaphorics (relating to abstract aspects of the topic of speech), deictics (pointing to an area of the speaker’s gestural space) and beats (movements reflecting rhythmic aspects of the speech) [15].
Disfluencies were identified by careful auditory examination of the digitised audio recordings by two of the authors. These included pauses (silent and filled), repetitions and reformulations. They were subclassified as non-juncture disfluencies, where they occurred mid-clause, and juncture disfluencies, where they occurred between clauses. Most of the latter were filled pauses.
Spatial content phrases, defined as phrases containing spatial prepositions, were identified by inspection of the transcriptions.
3. Results Table 1 shows raw results by condition for word counts and
rate per 100 words of spatial content phrases (SCP), iconic and beat hand gestures, and non-juncture, juncture and total disfluencies. Other gesture types are disregarded in the rest of this study, as their number was too low. Because of the small number of subjects and the large amount of variabity between subjects for most of these factors, we restrict the analyses to descriptive and non-parametric statistics. The most important examples of inter-subject variability for this study are in rate of iconic gestures (e.g., range in hands-free condition: 3.5–7.9 per 100 words) and in disfluency rates (e.g. range for all disfluencies in hand-free condition: 2.0–12.4 per 100 words).
Word counts were greater in the two restricted-gesture conditions than in the hands-free condition, but this may be because speakers were able to recall more detail on their later attempts at the task rather than because of gesture restriction.

Proceedings of DiSS’03, Disfluency in Spontaneous Speech Workshop, 5–8 September 2003, Göteborg University, Sweden. Robert Eklund (ed.), Gothenburg Papers in Theoretical Linguistics 90, ISSN 0349–1021, pp. 21–24.
23
Table 1: Mean number of words and rate per 100 words of spatial content phrases, iconic and beat gestures and non-juncture and juncture disfluencies, by condition.
Hands Free
One hand
No hands
Overall NN
Mean number of words
269.3 345 316.67 310.3 5586
Spatial content phrases
24.5 30 30.3 28.3 509
Iconic Gestures 5.82 2.32 N/A 3.85 142
Beat Gestures 2.41 4.73 N/A
Non-juncture disfluencies
4.64 4.35 5.16 4.71 263
Juncture disfluencies
1.61 2.31 2.05 2.02 113
Total disfluencies
6.25 6.67 7.21 6.73 376
The rate per 100 words of SCPs also increased from the hands-free condition to the restricted gesture conditions. There was no difference between the one-hand and the both-hands restricted conditions for the rate of SCPs. Iconic hand gestures reduced dramatically between the hands-free and one-hand condition – with their dominant hand immobilised, subjects did not compensate by using their non-dominant hand to produce iconics.
In the hands-free condition, which had the highest rate of iconic gestures, we found evidence of a relationship between use of iconic gesture and fluency – speakers who used more iconic gestures also produced fewer non-juncture disfluencies (ρ= –.807, N=6, p<.05) (Figure 1). In the one-handed condition, where iconic gestures were much rarer, no such relationship was found. Conversely, for beat gestures, a numerically higher rate was found in the one handed condition, though this failed to reach significance.
02468
1012
0 5 10
Iconic GesturesNon
-junc
ture
dis
fluen
cies
Figure 1: Rates per hundred words of Iconic Gestures and Non-Juncture Disfluencies for all six speakers in the hands-free condition.
Interestingly, perhaps, the difference between conditions for beat gestures coincided with a slight change in disfluency rates between the two-handed and one-handed conditions: a lower rate of non-juncture disfluency was found in the one-handed condition than in the two-handed condition, though, again, the difference was not significant. Models discussed in the introduction, as well as previous findings, would predict that disfluency rates would be higher when gesture was restricted. Numerically, overall disfluency rates were higher in both restricted gesture conditions (One hand: 6.67. No hands: 7.21/100 words) than in the hands-free condition (6.25). This was not a statistically significant finding. For non-juncture disfluencies, however, the lowest rate of disfluency was in the one-hand condition and this was
significantly lower than the rate for the no hands condition (Wilcoxon signed ranks test: W=0, N=6, p<.05, two-tailed). Finally, for juncture disfluencies (mostly clause-initial filled pauses), the numerical increase from the hands-free condition to the restricted condition was also not significant (Figure 2).
012345678
Handsfree
One hand No hands
Rat
e pe
r 100
wor
ds
JDsNJDs
Figure 2: Disfluency rates per 100 words by condition. (NJD = Non-juncture disfluency; JD = Juncture disfluency). While spatial content phrases were more frequent in the two gesture-restricted conditions than with hands free, no relationship between SCP rates and disfluency rates could be found.
4. Discussion This study can be seen as a pilot for a larger and more carefully designed study to be undertaken shortly. Various methodological issues and large variability in disfluency and gesture rates in this small group of subjects mean that any conclusions that we draw have to be seen as tentative. Accordingly, we present the following outcomes as possible indicators for further research.
• In the hands-free condition, speakers who used more iconic gestures, also produced significantly fewer non-juncture disfluencies.
• With the ability to gesture restricted, the overall disfluency rate is higher.
• In the one-handed condition, with the dominant hand restricted, subjects used fewer iconic gestures, not compensating by using the non-dominant hand. However, no effect on disfluency rates was seen as a result of the reduction in iconic gestures.
• Beat gestures occurred at a higher rate in the one-handed condition than in the hands-free condition, coinciding with a lower rate of non-juncture disfluencies.
The first two points support previous findings [17] which demonstrated an increase in disfluency with restricted gesture. This is compatible with models of speech production which incorporate gesture as part of the same system. From this study, it is hard to argue in favour of a model which links gesture planning to lexical access rather than the conceptual level. The data in Table 1 suggest that the increase in disfluency rate is not restricted to non-juncture disfluencies, as a lexical access account might predict: there is an increase in disfluency rates for clause-onset disfluencies (mostly filled pauses), as well as for non-juncture disfluencies. This may indicate that more general utterance planning is affected (i.e., at the conceptual level) rather than, or at least as much as, lexical access, thus supporting a model which relates gesture-planning more closely to the conceptualiser than to lexical access. The third point, that a drop in rate of iconic gestures in the one-handed condition with respect to the hands-free condition

Finlayson, Forrest, Lickley & Beck
24
did not coincide with an increase in disfluency, is problematic for models that assume a link between use of iconic gesture and fluency. We speculate that the increase in the use of beat gestures may have a confounding role here. Evidence from experiments which impose external timing on spontaneous speech by use of a metronome suggests that such rhythmical support dramatically reduces the rate of filled pauses without affecting the overall speech rate [3]. The same method is commonly reported to reduce disfluency rates in people who stutter (e.g., [10]). If the use of beat gestures has a similar effect on disfluency as an artificial timing device, then we would expect to find more fluent speech as the rate of beat gesture increases.
A more mundane explanation for an increase in disfluency in the restricted-gesture conditions might be that the restrictions simply constituted a minor distraction from the speaking task, which had an impact on the speakers’ ability to focus on speech planning alone. The study by Rimé et al. [18], reported above, provides some evidence against this explanation, but in future work, control for this possible confound should be implemented. There are clear methodological problems in this relatively small pilot project. Firstly, given the high rate of variation in disfluency and gesture rates by subject, a larger sample is needed. Secondly, the method of restricting arm movements allowed a certain amount of gesture leakage – despite the subjects’ arms being restricted, it was observed that some subjects still attempted to perform gestures with their hands and fingers: the amount of such gesturing was too small to be reported here, but future studies should ensure that this is not possible. Thirdly, all speakers performed the same communication task three times, introducing the possibility of rehearsal effects. We might hypothesise that this would decrease the disfluency rates in the gesture-restricted conditions, since the planning load on retelling the story would be reduced. In fact, we still found an increase in disfluency rates overall. If a rehearsal effect is there, then this suggests that the design fault in our experiment may have reduced the observable effect of gesture restriction on disfluency.
In summary, we have some evidence to support the view that gesture is helpful to fluent speech production, but we can not yet explicitly support either a lexicon-linked or a conceptualiser-linked model of integrated speech and gesture production. While interesting for psycholinguists working in speech production, the work is also relevant to Speech and Language Therapists dealing both with clients with fluency disorders and mobility problems.
5. Acknowledgements This work is based on final-year undergraduate dissertations by Sheena Finlayson and Victoria Forrest, supervised by Janet Beck, on the BSc course in Speech Pathology and Therapy at Queen Margaret University College, Edinburgh. Their participation at DiSS ’03 was partially funded by profits from previous workshops in the series at Berkeley and Edinburgh.
6. References [1] Alibali, M. W., S. Kita & A. J. Young. 2000. Gesture and
the Process of Speech Production: We Think, therefore we Gesture. Language and Cognitive Processes, vol. 15(6), pp. 593–613.
[2] Butterworth, B. & U. Hadar. 1989. Gesture, Speech and Computational Stages: A reply to McNeill. Psychological Review, vol. 96, pp. 168–174.
[3] Christenfeld, N. 1996. Effects of a Metronome on the Filled Pauses of Fluent Speakers. Journal of Speech and Hearing Research, vol. 39, pp. 1232–1238.
[4] De Ruiter, J. P. 2000. The Production of Gesture and Speech. In: D. McNeill (ed), Language and gesture (284–311). New York: Cambridge University Press.
[5] Graham, J. A. & S. Heywood. 1976. The Effects of Elimination of Hand Gesture and of Verbal Codability on Speech Performance. European Journal of Social Psychology, vol. 5, pp. 189–195.
[6] Kendon, A., 1994. Do Gestures Communicate? A Review. Research on Language and Social Interaction, vol. 27, pp. 175–200.
[7] Kimura, D. 1973a. Manual Activity during Speaking – I. Right-handers. Neuropsychologia, vol. 11, pp. 34–50.
[8] Kimura, D. 1973b. Manual Activity during Speaking – II. Left-handers. Neuropsychologia, vol. 11, pp. 51–55.
[9] Kita, S. 2000. How Representational Gestures Help Speaking. In: D. McNeill (ed.), Language and gesture. New York: Cambridge University Press, pp. 162–185.
[10] Klingbeil, G. M. 1939. The Historical Background of the Modern Speech Clinic. Journal of Speech Disfluencies, vol. 4, pp. 115–132.
[11] Krauss, R. M. 1998. Why do we Gesture when we Speak? Current Directions in Psychological Science, vol. 7, pp. 54–59
[12] Krauss, R. M., Y. Chen & R. F. Gottesman. 2000. Lexical Gestures and Lexical Access: a Process Model. In McNeill, D. (ed), Language and gesture. New York: Cambridge University Press, pp. 261–283.
[13] Levelt, Willem J. M. 1989. Speaking. From Intention to Articulation. Cambridge, Massachusetts: MIT Press.
[14] Mayberry, R. I. & J. Jaques. 2000. Gesture Production during Stuttered Speech: Insights into the Nature of Gesture–Speech Integration. In: D. McNeill (ed), Language and gesture. New York: Cambridge University Press, pp. 199–214.
[15] McNeill, D. 1992 Hand and Mind: What Gestures Reveal about Thought. Chicago: University of Chicago Press.
[16] McNeill, D. & E. T. Levy. 1982. Conceptual Representations in Language Activity and Gesture. In: R. Jarvella & W. Klein (eds.) Speech Place and Action. Chichester, UK: Wiley and Sons, pp. 271–295.
[17] Rauscher, F. B., R. M. Krauss & Y. Chen. 1996. Gesture, Speech and Lexical Access: The Role of Lexical Movements in Speech Production. Psychological Science, vol. 7, pp. 226–230.
[18] Rimé, B., L. Schiarature, M. Hupet & A. Ghysselinckx. 1984. Effects of Relative Immobilization on the Speaker’s Nonverbal Behavior and on Dialog Imagery Level. Motivation and Emotion, vol. 8(4), pp. 311–325.
[19] Seyfeddinipur, M. & S. Kita. 2001. Gesture as an Indicator of Early Error Detection in Self-Monitoring of Speech. Proceedings of DiSS ’01, ISCA Tutorial and Research Workshop on Disfluency in Spontaneous Speech, Edinburgh, Scotland, pp. 29–32.
[20] Sousa-Poza, J. F., R. Rohrberb & A. Mercure. 1979. Effect of Type of Information (abstract–concrete) and Field dependence on Asymmetry of Hand Movements during Speech. Perceptual and Motor Skills, vol. 48, pp. 1323–1330.

Session II: Production, Perception and Monitoring

26
Proceedings of DiSS’03, Disfluency in Spontaneous Speech Workshop, 5–8 September 2003, Göteborg University, Sweden. Robert Eklund (ed.), Gothenburg Papers in Theoretical Linguistics 90, ISSN 0349–1021, pp. 27–30.
27
Self-monitoring is the main cause of lexical bias in phonological speech errors
Sieb G. Nooteboom
UiL OTS, Utrecht University, Utrecht
Abstract In this paper I present new evidence, stemming both from an experiment and from spontaneous speech, demonstrating that (a) lexical bias is caused by self-monitoring of inner speech, as proposed by Levelt et al. [6], and (b) that there is phoneme-to-word feedback in the mental programming of speech, as supposed by Dell [2] and Stemberger [10]. It is argued here that possibly phoneme-to-word feedback is an unavoidable side-effect of self-monitoring of inner speech.
1. Introduction Baars, Motley & MacKay [1] elicited spoonerisms by having subjects read aloud a target like darn bore preceded by bias items in which at least the first phoneme in this case was a b, triggering the spoonerism barn door. They observed that the error rate for cases such as darn bore, triggering lexically viable outcomes, was higher than the error rate for cases like dart board, triggering non-word outcomes. The authors explained this result, generally known as “lexical bias”, by positing an output-editing mechanism suppressing non-words from inner speech. Levelt, Roelofs & Meyer [6] supported this original explanation by Baars et al. [1] and suggested that the pre-articulatory editing leading to lexical bias is a form of covert self-correction of internal speech by the self-monitoring system that is also responsible for overt detection and correction of speech errors. A different approach has been suggested by Dell & Reich [3] and Dell [2], who proposed that lexical bias is caused by “phoneme-to-word” feedback during production processes, and therefore obviously not by the same mechanism that is responsible for the overt detection of speech errors.
The two questions I will attempt to answer in this paper are the following: (1) What is the cause of lexical bias in phonological speech errors? (2) Is there phoneme-to-word feedback in the mental programming of speech? I will do so mainly by way of an experiment adapted from Baars et al. [1], eliciting spoonerisms of the kind darn bore for visually presented barn door, or gad boof for visually presented bad goof, by phonological priming caused by preceding word pairs having the initial consonants of the spoonerism to be elicited. I made some changes to that experiment, meant to help me in answering my questions.
It occurred to me that if it would be possible to externalize some aspect of output editing, this might help us to choose between the proposed mechanisms. Now Levelt [5] (pp. 473, 474) argued that halting speech as in v.... horizontal, in a situation where the speaker has a choice between horizontal and vertical, cannot be a reaction to the speaker’s own overt speech, because the v is considerably shorter than a humanly possible reaction time. So it must be a reaction to the speaker’s inner speech. It is a reasonable and parsimonious assumption that this is an overt form of editing that generally stays covert, and that this is the same mechanism that is held accountable for lexical bias by Baars et al. and by Levelt et al. If so, and if we could tap such overt reactions to inner speech, it could help us decide between self-monitoring and feedback as the main
mechanism causing lexical bias. The reason is that both explanations provide different predictions for the data distribution: Feedback predicts a lexical bias both in completed and in aborted spoonerisms. Output editing predicts a lexical bias in completed but an inverted lexical bias in early aborted spoonerisms. Such a result would also imply that self-monitoring of inner speech is different from self-monitoring of overt speech. Possibly one might increase the number of aborted and corrected errors in an experiment à la Baars et al., by giving the subjects more time for correction.
A further possibility to discriminate between the two explanations of lexical bias would be to assess the effect of phonetic distance between the two to-be-spoonerised consonants on the relative rates of lexical and non-lexical completed and aborted spoonerisms. The reason is that self-monitoring is supposed to rely on the same speech-comprehension system that is operative in the perception of other-produced speech. It is reasonable that single-feature errors are less easily detectable than errors involving more features. As it turns out, both feedback and self-monitoring predict an increasing lexical bias with increasing phonetic distance. But the feedback account predicts that this will be the same for completed and aborted spoonerisms. The self-monitoring account predicts that the rate of completed non-lexical errors will decrease and the rate of aborted non-lexical errors will increase with increasing phonetic distance. For this reason, potentially phonetic distance between the two to be spoonerised consonants is a helpful experimental variable.
Logically, the question what is the cause of lexical bias is separate from the question whether or not there exists phoneme-to-word feedback. So, how can we find out whether there is feedback? Feedback is supposed to generate extra activation for the units being part of the feedback loop. Extra activation will help a unit to exceed its threshold faster (cf. Roelofs [8]). Therefore feedback should affect response times in a Baars et al.-like experiment, not only response times of the errors, but, more importantly, also of the error-free productions. If the phonologically primed error is a lexical unit, the activation of phoneme nodes will be fed back to both the correct word node and the erroneous word node, and both word nodes will again re-activate their own phoneme nodes. Thus, feedback will create considerable extra activation for the phonemes of the correct word node (and also of the erroneous word node, but we assume the correct node to win out). This extra activation will shorten the response time. However, in case the primed spoonerism is non-lexical, the erroneous phoneme string has no corresponding word node, and therefore cannot help to provide extra activation for the correct string of phonemes. Therefore response times will be longer in error-free productions of word pairs primed for nonwords, than in word pairs primed for words (at least if we assume that the shortening effect of extra activation of the correct word node on the average is stronger than the delaying effect of competition between correct and erroneous word node that is also created by feedback). This reasoning has inspired a third modification of the Baars et al. experiment, enabling me to measure response times.

Nooteboom
28
2. Method The method used was basically the same as the one applied by Baars et al. [1] with some minor modifications, as explained above.
2.1. Stimuli
Priming word pairs consisted of pairs of monosyllabic Dutch words, visually presented in clear capital print on a computer screen and intended to be read silently. Before each test stimulus there were 3, 4, 5, 6 or 7 priming word pairs, chosen to prime a spoonerism, as in the sequence give book, go back, get boot preceding the test stimuli bad goof. In total there were 144 priming word pairs preceding test stimuli, and 144 non-priming word pairs preceding unprimed base-line stimuli. The initial consonants of priming word pairs and test word pairs were chosen from the set /f, s, X, v, z, b, d, p, t, k/. There were 18 test stimuli primed for nonword-nonword spoonerisms, as bad goof giving gad boof, and 18 test stimuli primed for word-word spoonerisms as barn door giving darn bore. Each set of 18 was divided in 3 groups of 6 stimuli with equal phonetic distance between initial consonants, viz. 1 , 2 or 3 distinctive features. For example, /f/ vs /s/ differ in 1 feature, /f/ vs. /p/ differ in 2 features, and /f/ vs. /d/ differ in 3 features. There were 36 base-line stimuli preceded by 144 non-priming word pairs and not controlled for expected outcomes of spoonerisms, class of initial consonants, or phonetic distance between target and potential error. In all other respects they were similar to the test stimuli. After each test and each base-line stimulus word pair the subject saw on the screen a prompt SPREEK UIT (=“SPEAK”). After that the subject saw a second prompt CORRECTIE (=“CORRECTION”). In addition to the set of test and base-line stimuli described so far there was a set of 7 stimuli with a variable number, on the average 4, of non-priming preceding word pairs to be used as practice for the subjects, and of course also followed by two prompts each. The total number of visually presented priming word pairs (144), non-priming word pairs (144 + 28 = 172), practice stimuli (7), test stimuli (36), base-line stimuli (36) and prompts (144 + 14) was 553.
2.2. Subjects
There were 50 subjects, 17 male and 33 female, all of them naive as to the purpose of the experiment. They were staff members and students of Utrecht University, all with standard Dutch as their mother tongue and with no known history of speech or hearing pathology. Subjects varied in age from 17 to 56.
2.3. Procedure Each subject was tested individually in a sound proof booth. The timing of visual presentation on a computer screen was computer controlled. The order in which test and base-line stimuli, along with their priming or non-priming preceding word pairs were presented was randomized and different for each subject. Each (non-)priming word pair, each SPEAK-prompt and each CORRECTION-prompt was visible during 900 ms and was followed by 100 ms with a blank screen. The subject was instructed, on seeing the “SPREEK UIT” (=“SPEAK”) prompt to speak aloud the last word pair presented before this prompt. The subject was instructed to correct the spoken word pair in case of error. It was not
necessary to wait for the “CORRECTION” prompt. The purpose of the latter was only to provide each subject with plenty of time for correction in case an error was made. All speech of each subject was recorded, and digitally stored on one of two tracks of DAT. On the other track of the DAT two tones of 1000 Hz and 50 ms duration were recorded with each test or filler stimulus, one starting at the onset of the visual presentation of the “SPEAK” stimulus, the other starting at the onset of the presentation of the “CORRECTION” prompt. These signals were helpful for orientation in the visual oscillographic analysis of the speech signals, and the first of these was indispensable in measuring response times.
2.4. Collecting the data
Reactions to all remaining test and filler stimulus presentations were transcribed either in orthography, or, where necessary, in phonetic transcription by two phonetically trained transcribers, viz. the present author and one of his students, using a computer program for the visual oscillographic display and auditory playback of audio signals. Transcriptions differed in less than 2% of all utterances and in less than 10% of all utterances containing an error. Response times for all correct and incorrect responses, to both base-line and test stimuli were measured by hand in the two-channel oscillographic display from the onset of the 50 ms tone coinciding with the onset of the presentation of the visual “SPEAK” prompt to the onset of the spoken response.
3. Results 3.1. Analysis of spoonerisms
In total we found 680 erroneous reactions for primed stimuli and base-line stimuli together. Most of these errors had no relation to the experimental variables, and will not concern us here. I will concentrate on 56 completed spoonerisms, and 67 aborted spoonerisms. Do we find, as expected, a lexical bias here, and is this lexical bias the same for completed and aborted spoonerisms, or is it not? The relevant breakdown of the data is given in Table 1. Table 1. Numbers of spoonerisms as a function of lexicality and of completed versus aborted.
completed aborted lexical 37 28
nonlexical 19 39 The 56 completed spoonerisms show, as expected, a significant lexical bias (binomial test, p<0.01). The aborted spoonerisms, if anything, show an inverted effect of lexical bias, This is in itself not significant (p=0.11). However, the interaction between lexicality and completed versus aborted is significant (X2=7.21; df=1; p<0.01). This distribution of the data rather supports a self-monitoring account of lexical bias than a feedback account. What about the effect of phonetic distance? Is there such an effect and is it the same for completed and aborted spoonerisms? The data are given in Table 2.
The main interest is in the nonlexical spoonerisms, as the self-monitoring theory predicts lexical bias from nonlexical errors being edited out more frequently than lexical ones, and also predicts that the probability of being edited out increases
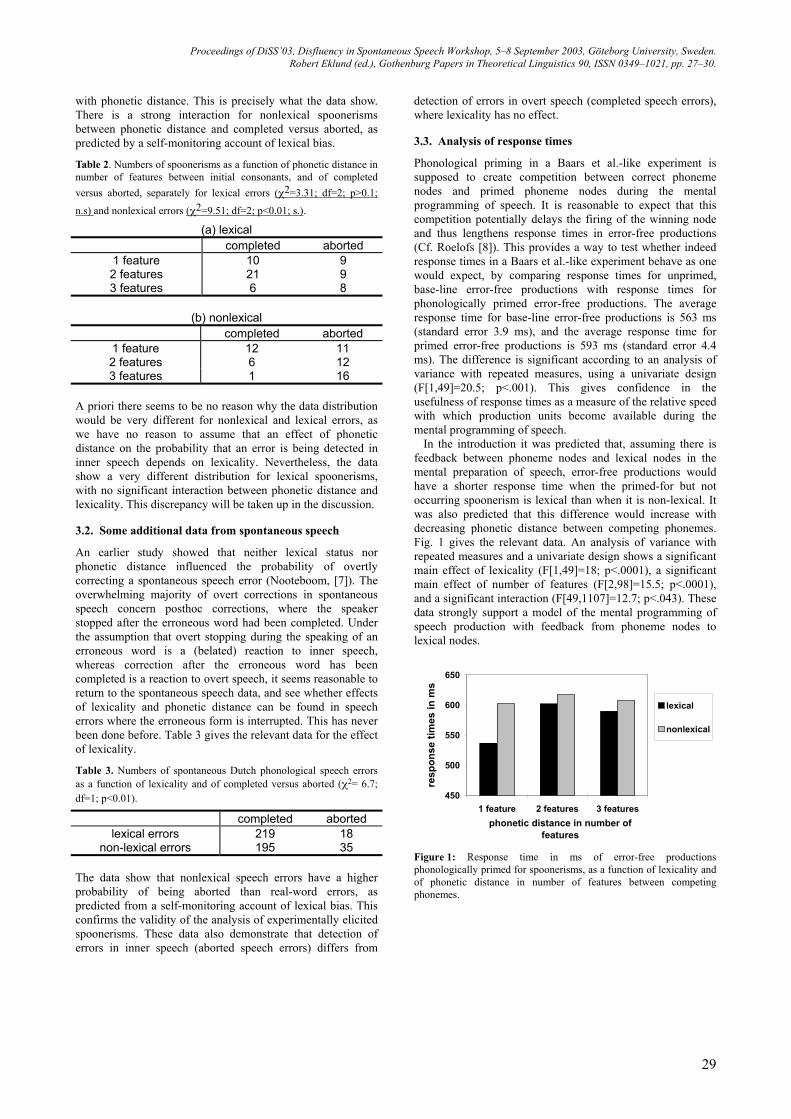
Proceedings of DiSS’03, Disfluency in Spontaneous Speech Workshop, 5–8 September 2003, Göteborg University, Sweden. Robert Eklund (ed.), Gothenburg Papers in Theoretical Linguistics 90, ISSN 0349–1021, pp. 27–30.
29
with phonetic distance. This is precisely what the data show. There is a strong interaction for nonlexical spoonerisms between phonetic distance and completed versus aborted, as predicted by a self-monitoring account of lexical bias.
Table 2. Numbers of spoonerisms as a function of phonetic distance in number of features between initial consonants, and of completed versus aborted, separately for lexical errors (X2=3.31; df=2; p>0.1;
n.s) and nonlexical errors (X2=9.51; df=2; p<0.01; s.).
(a) lexical completed aborted
1 feature 10 9 2 features 21 9 3 features 6 8
(b) nonlexical
completed aborted 1 feature 12 11 2 features 6 12 3 features 1 16
A priori there seems to be no reason why the data distribution would be very different for nonlexical and lexical errors, as we have no reason to assume that an effect of phonetic distance on the probability that an error is being detected in inner speech depends on lexicality. Nevertheless, the data show a very different distribution for lexical spoonerisms, with no significant interaction between phonetic distance and lexicality. This discrepancy will be taken up in the discussion.
3.2. Some additional data from spontaneous speech
An earlier study showed that neither lexical status nor phonetic distance influenced the probability of overtly correcting a spontaneous speech error (Nooteboom, [7]). The overwhelming majority of overt corrections in spontaneous speech concern posthoc corrections, where the speaker stopped after the erroneous word had been completed. Under the assumption that overt stopping during the speaking of an erroneous word is a (belated) reaction to inner speech, whereas correction after the erroneous word has been completed is a reaction to overt speech, it seems reasonable to return to the spontaneous speech data, and see whether effects of lexicality and phonetic distance can be found in speech errors where the erroneous form is interrupted. This has never been done before. Table 3 gives the relevant data for the effect of lexicality.
Table 3. Numbers of spontaneous Dutch phonological speech errors as a function of lexicality and of completed versus aborted (X2= 6.7; df=1; p<0.01).
completed aborted lexical errors 219 18
non-lexical errors 195 35 The data show that nonlexical speech errors have a higher probability of being aborted than real-word errors, as predicted from a self-monitoring account of lexical bias. This confirms the validity of the analysis of experimentally elicited spoonerisms. These data also demonstrate that detection of errors in inner speech (aborted speech errors) differs from
detection of errors in overt speech (completed speech errors), where lexicality has no effect.
3.3. Analysis of response times
Phonological priming in a Baars et al.-like experiment is supposed to create competition between correct phoneme nodes and primed phoneme nodes during the mental programming of speech. It is reasonable to expect that this competition potentially delays the firing of the winning node and thus lengthens response times in error-free productions (Cf. Roelofs [8]). This provides a way to test whether indeed response times in a Baars et al.-like experiment behave as one would expect, by comparing response times for unprimed, base-line error-free productions with response times for phonologically primed error-free productions. The average response time for base-line error-free productions is 563 ms (standard error 3.9 ms), and the average response time for primed error-free productions is 593 ms (standard error 4.4 ms). The difference is significant according to an analysis of variance with repeated measures, using a univariate design (F[1,49]=20.5; p<.001). This gives confidence in the usefulness of response times as a measure of the relative speed with which production units become available during the mental programming of speech.
In the introduction it was predicted that, assuming there is feedback between phoneme nodes and lexical nodes in the mental preparation of speech, error-free productions would have a shorter response time when the primed-for but not occurring spoonerism is lexical than when it is non-lexical. It was also predicted that this difference would increase with decreasing phonetic distance between competing phonemes. Fig. 1 gives the relevant data. An analysis of variance with repeated measures and a univariate design shows a significant main effect of lexicality (F[1,49]=18; p<.0001), a significant main effect of number of features (F[2,98]=15.5; p<.0001), and a significant interaction (F[49,1107]=12.7; p<.043). These data strongly support a model of the mental programming of speech production with feedback from phoneme nodes to lexical nodes.
450
500
550
600
650
1 feature 2 features 3 featuresphonetic distance in number of
features
resp
onse
tim
es in
ms
lexical
nonlexical
Figure 1: Response time in ms of error-free productions phonologically primed for spoonerisms, as a function of lexicality and of phonetic distance in number of features between competing phonemes.

Nooteboom
30
4. Discussion The current experiment was designed to help answering two questions: (1) What is the cause of lexical bias? and (2) Is there feedback between phoneme and word nodes in the mental preparation of speech? The data on relative frequencies of both elicited and spontaneous speech errors provided in the results section support the hypothesis by Levelt et al. [6] that lexical bias is caused by nonlexical phonological errors having a greater probability than lexical errors of being edited out from inner speech by the self-monitoring system. The data on response times support models of the mental preparation of speech exhibiting feedback from phoneme nodes to lexical nodes as proposed by Stemberger [10] and Dell [2], and as excluded by Levelt et al. [6].
As in all Baars et al.-like experiments the elicited spoonerisms are relatively few. This makes these data less convincing than one would wish. So I went looking for support from data on similar experiments. Unfortunately Baars et al. [1] and most other publications on similar experiments do not distinguish a separate category of aborted spoonerisms. Their “partial spoonerisms” apparently include such cases as darn door instead of barn door, where only the first of the two phoneme substitutions has been made. I found only one experiment, described by Humphreys [4], that is more or less comparable to the current one. She compared word-nonword with nonword-word outcomes, and found that lexical bias is completely controlled by the first word, word-nonword behaving as lexical, and nonword-word as nonlexical outcomes. Adding her numbers of lexical and nonlexical aborted spoonerisms to mine, gives 57 lexical and 77 nonlexical outcomes. This difference is as good as significant on a binomial test (p=.0502), providing further support for the current interpretation.
The predicted interaction between phonetic distance and completed versus aborted was only found for nonlexical errors, not for lexical errors. Conceivably this unpredicted finding is related to a different reaction of the perception system to lexical and nonlexical items. The most likely response to a nonlexical item differing only a single feature from a lexical one, is that lexical item. This probability will rapidly decrease with increasing phonetic distance. The most likely response to a lexical item differing only a single feature from another lexical item is not that other lexical item, but the item itself. This will remain the most likely response with increasing phonetic distance. This is precisely what was found.
The data on response times provide convincing evidence for the existence of phoneme-to-word feedback. This runs counter an argument by Levelt et al. [6] that there does not seem to be a function for such feedback. However, one would not need to consider such a function, if one assumes that feedback is an unavoidable side-effect of some other property of the speech production system. Levelt et al. [6] were forced by experimental evidence to introduce direct links from perception to production on three levels, lemma’s, lexemes, and phonemes. Roelofs [9] has suggested that phoneme-to-word feedback may originate from a lexeme-to-phoneme link between perception and production. This would make such a feedback an unavoidable side-effect of the way self-monitoring is organized.
5. Acknowledgement I am grateful to my student Eelco de Vries for running the experiment, to Hugo Quené for doing the statistical analysis, and many others for helpful comments.
6. References
[1] Baars, Bernard J., Michael T. Motley & Donald MacKay. 1975. Output editing for lexical status from artificially elicited slips of the tongue. Journal of Verbal Learning and Verbal Behavior, vol. 14, pp. 382–391.
[2] Dell, Gary S. 1986. A spreading-activation theory of retrieval in sentence production. Psychological Review, vol. 93, pp. 283–321.
[3] Dell, Gary S. & Peter A. Reich. 1981. Stages in sentence production: an analysis of speech error data. Journal of verbal Learning and verbal Behavior 20, 611-629.
[4] Humphreys, Karin. 2002. Lexical bias in speech errors. Unpublished doctoral dissertation, University of Illinois at Urbana Champaign.
[5] Levelt, Willem.J.M. 1983. Speaking: From Intention to Articulation. Cambridge Massachusetts, MIT Press.
[6] Levelt, Willem. J. M., Ardi Roelofs & Antje S. Meyer. 1999. A theory of lexical access in speech production. Behavioral and Brain Sciences, vol. 22, pp. 1–75.
[7] Nooteboom, Sieb G. In press. Listening to one-self: Monitoring speech production. In: Rob J. Hartsuiker, Roelien Bastiaanse, Albert Postma & Frank.N.K. Wijnen (eds.), Phonological encoding and monitoring in normal and pathological speech.
[8] Roelofs, Ardi. 2002. Storage and computation in spoken word production. In: Sieb Nooteboom, Fred Weerman & Frank Wijnen (eds.), Storage and Computation in the Language Faculty, Dordrecht: Kluwer Academic Publishers, pp. 183–216.
[9] Roelofs, Ardi. In press. Goal-referenced selection of verbal action: modelling attentional control in the stroop task. Accepted for publication in Psychological Review.
[10] Stemberger, Joseph P. 1985. An interactive activation model of language production. In: Andrew W. Ellis (ed.) Progress in the Psychology of Language Vol 1. London: Lawrence Erlbaum (pp. 143-186).

Proceedings of DiSS’03, Disfluency in Spontaneous Speech Workshop, 5–8 September 2003, Göteborg University, Sweden. Robert Eklund (ed.), Gothenburg Papers in Theoretical Linguistics 90, ISSN 0349–1021, pp. 31–34.
31
Is a perceptual monitor needed to explain how speech errors are repaired?
Peter Howell
Department of Psychology, University College London, UK
Abstract Kolk & Postma [6] proposed, following Dell & O’Seaghdha
[1], that when a speaker chooses a word, phonologically-related words as well as the intended word are activated. Initially, the activations of all these words are similar, though eventually the intended word reaches a higher asymptotic value when activation is complete [1]. According to Kolk & Postma [6], if a response is made in the phase where activation is building up (rather than at full activation), there is a higher chance of the competing, rather than the intended, word being selected (i.e. an error). They propose that a speaker detects such errors when they are produced overtly using the perceptual system, and a monitor in the linguistic system responds by interrupting and initiating the correction [6].
Word repetition and hesitation (not errors in themselves) have been regarded as signifying underlying errors that are detected and interrupted before speech is output in a similar way to overt errors. An assumption in [6] is that activation for a word stops (or, if it continues, is ignored) immediately a candidate word is selected. The brain processes responsible for speech production have massive parallel capacity. Consequently, activation for all the candidates for a word slot could continue beyond the point where a word is selected in cases where a word is responded to prematurely. When the selected word reaches asymptote, the relative activations of this and the other candidate words indicate when an error has occurred (when the selected word has a lower activation than one of the competing words), and what correction is appropriate (the word with the highest activation). This provides the basis for error detection and correction without the need for a perceptual monitor. Continuing the buildup of activation after a word has been selected, implies that activation of nearby words in its phrase overlaps. It is shown, with some realistic assumptions about how activation builds up and decays across different words in a phrase, that this model predicts word repetition and hesitation and also part-word disfluencies (a characteristic of stuttering), again without the need for a perceptual monitor.
1. Investigation Levelt’s work has provided an enormous impetus to research on disfluencies in spontaneous speech. His 1989 model [7] has a very wide scope and has been the imprimatur of many other models. It has set the standard in the sense that an adequate model of disfluencies in spontaneous speech must aspire to explaining most, if not all, the phenomena Levelt has explained.
One feature, shared between Levelt’s model and many others (including modular and interactive variants) is that generation of speech output is hierarchical, involving lexical and phonetic steps. Fluent speech control arises when all the steps are accurate. Conversely, disfluency occurs when any level in the hierarchical system malfunctions and gives rise to an error. Levelt’s model uses mechanisms outside the production processes to recover after such errors. There are two connections to the outside processes in Levelt’s model that
allow this: 1) The last step in processing in Levelt’s hierarchy is to place the results in a phonetic output buffer and the string is then sent to articulation processes. The articulation processes produce sound that is picked up by the auditory system that sends its information to the perception system (external loop). 2) Information about processing within linguistic planning is transmitted as it is generated to the speech perception system (internal loop). The information sent via the internal and external loops is deciphered by the speech perception system, and the results are sent to a monitor in the linguistic system that detects mismatches between the intended output and that achieved (i.e. whether an error has occurred). If an error has occurred, speech is interrupted and reinitiated. The problem with 1) is that it implies a particular model of the language-speech interface. This interface relies on auditory and speech perception mechanisms to detect whether one’s own speech is accurate, which available data suggest may not be possible. The problem with 2) is that, if true, it operates in a way that makes the events that it detects (the errors) unobservable. Consequently, all the support for this process is indirect and questionable for this reason.
An important line of evidence that led Levelt to propose external and internal loops is his account of the pattern of recovery after a speaker has made an error (referred to as “repair”). An example of a repair is “in the back, in the front of the...”. This utterance contains an overt error of lexical selection (back for front) that may have been detected over the external loop. According to [8], the monitor detects this error and interrupts speech (signified by the comma). Two words are repeated that occurred prior to the word in error (“in the”) that are referred to as a retrace, and then the speaker makes the correction. An example like “in the, in the front” (according to [8]) is a covert repair, which might have occurred because the speaker made the front-back error but detected it over the internal loop, and interrupted the speech before it was output. Covert repairs were characterised by Levelt by interruption and retrace features: They consist of “either just an interruption plus editing term [words like “no” said after the pause], or the repeat of one or more lexical items” ([8], p.55). Subsequent authors, such as Hartsuiker & Kolk [3], have classified speech events with short overt errors as covert repairs with the short section of overt error being attributed to inertia in stopping on-going speech. This clearly does not fit with Levelt’s definition and affects estimates of overt and covert events (some repairs Levelt would class as overt are reclassified as covert). Until the definition that allows overt errors to occur in covert repairs is defended, Hartsuiker and Kolk’s simulations of the operation of the internal loop should be ignored (they could be simulations of the operation of the external loop).
Levelt’s work has given license to certain terms in the area that are appropriate for those working within his own framework, but not for those taking different theoretical approaches. “Repair”, “monitor” and “feedback” are three value-laden terms that connote a specific way of dealing with errors. If there is no observable error (as when there is only timing disruption), referring to these events as covert “repairs”

Howell
32
is inappropriate, and some neutral term for these events should be employed. If the identity of a putative error cannot be given, there is no way of specifying what the feedback is. The operation of a monitor cannot be specified if it is not known what “feedback” is telling this process.
Elsewhere I have examined the problems with a perceptual monitoring proposal [4, 5] that further underline my own reasons for dismissing the terms Levelt’s work licences. These arguments will not be repeated here except to say they raise concerns about whether any external processes are coupled to the production system in the way Levelt describes. Instead, I want to examine the implications of one theory that derives from Levelt’s work, Kolk & Postma’s covert repair hypothesis (CRH) [6]. CRH is an account that has been applied to fluent speech control. CRH has also been applied to stuttering, a disorder where speakers have a high proportion of disfluencies. For this reason, stuttering is used as a test case for models of disfluency. Kolk & Postma [6] used Dell & O’Seaghdha’s [1] spreading activation model to explain how a slow phonological system leads to speech errors. According to [1], when a speaker intends to say the word “cat” (the target unit), phonologically-related competing units are also activated. (e.g. “rat”). Dell & O’Seaghdha [1] have steps involving lexical activation and phonological encoding. Overall activation represents the interaction between these processes in the original model [1], but Kolk & Postma focus on how activation patterns in the model can lead to phonological errors after lexical selection has taken place (this seems reasonable as fluent speakers are accurate at lexical selection on 99.99% of occasions [2]). The buildup of activation for the target and competing units, follow similar trajectories in early epochs, but later in time they asymptote at different levels (see Figure 1). At asymptote, the target unit has the higher activation level, which generates the appropriate word as response (points to the right of “S” in Figure 1). Operating under time pressure (such as when speech has to be produced rapidly) requires a speaker to generate words in the period where activation is still building up, for example at points near “S-” in Figure 1. The word response at this point would still be the one with highest activation. However, as the target and competing options have similar activation-trajectories during build-up, by chance one of the competing options may have highest activation and be triggered (resulting in a speech error) if word selection is made in this time-region. Speakers who have slow phonological systems (as Kolk & Postma propose to be the case in speakers who stutter) will extend the amount of time in the build-up phase. A word response generated in the extended build-up phase, has a heightened chance of a speech error arising for the same reason as a speech produced under time pressure.
Figure 1: Activation versus selection. Two points of selection normal (S) and early (S-) are shown.
Kolk & Postma’s account effectively involves imposing a decision rule for response selection (choose the candidate with the highest activation level at different imposed deadlines, empirically, at different points along the abscissa in Figure 1). The decision rule is arbitrary but defendable. The questionable issue, it seems to me, is why should activation stop building up at the point at which response selection is made when a response is made early? As Figure 1 shows, the trajectory of activation buildup beyond the deadline at which early response selection is made (points to the right of S), lead to the correct (target) unit having highest activation. Effectively truncating activation buildup at the deadline loses the information obtained up to this point, whereas, if processing continued for a short time, it would be clear that the word produced was in error. Continuing activation for this short time seems less costly than routing information through the perceptual system to the monitor that then interrupts and restarts speech as in CRH. Put simply, the monitoring system (internal and external loops, perceptual system and monitor) would not be required if activation was allowed to continue after the response was selected.
At asymptote, all candidate phones are fully activated. What would it mean, then, for a response to be initiated before activation level reaches asymptote? One way of looking at this issue is in terms of Levelt’s phonetic output buffer [7]. A phonetic buffer with five slots for phones is shown in Figure 2. Activation is complete for the first two (shaded line), but not for the final three, though activation over all phones is above the minimum threshold that is required for activating production of a word. Buildup of activation will stop once all candidate phones are fully activated. Conversely, the plan is only partial when any of the slots is not fully activated.
Figure 1 shows that to ensure the plan is complete and guarantee no error, activation has to be at asymptote. If a word is selected and produced before asymptote, and activation of a competing word is higher at asymptote, the latter should have been the target (i.e. an error occurred), then that plan is available, can be substituted and yield the correct response immediately. A simple threshold process would automatically select words that need to be substituted (“repaired”) because an error was made (only competing words that have activation levels that poke above the activation level of the word that was produced are in error and should be changed). In this way, error correction can occur without a perceptual monitor.
According to the proposed model, speakers have the wherewithal to detect and correct errors within the production system. Whilst this ability is built into the model, it should be noted that it is rarely called on (only 0.01% of words are in error [2]).
Figure 2: Activation states (shaded area) for five phones in a phonetic output buffer.

Proceedings of DiSS’03, Disfluency in Spontaneous Speech Workshop, 5–8 September 2003, Göteborg University, Sweden. Robert Eklund (ed.), Gothenburg Papers in Theoretical Linguistics 90, ISSN 0349–1021, pp. 31–34.
33
Extensions to the model are needed so that it can address the issues, a) how the features of covert repairs (hesitation and word repetition) arise, and b) how disfluencies on part of a complex word arise (these are features that are associated with, but not exclusive to, the speech of speakers who persist in their stuttering). The extensions are: 1) activation for words in a phrase takes place in parallel with the activation-onsets of words offset according to their order of appearance in the utterance, 2) activation builds up at different rates for words of different complexity, 3) activation begins to decay once a plan is completed, 4) (as a consequence of 3), when a word is initiated on the basis of a complete plan, some decay will occur after planning is complete during the time the word is being executed. When a word is initiated on the basis of an incomplete plan, activation will continue to build up after planning is complete during the time the word is being executed. In cases both where buildup for a word is or is not complete, activation for future words will be building up.
In the remainder of this paper, I will show how these four properties explain issues a) and b), for the phrase “in the spring”. Using 1), planning involves activation building up for the words and these overlap in time, though the first word starts building up before the second and so on (i.e. the plans start at different offsets). So, activation starts to build up for “in” first, then “the” and finally “spring”. Buildup of the phonetic output in a word also progresses left-to-right. Using 2), activation of words of different complexity builds up at different rates. This arises, to some extent, because of the complexity of the phonetic or phonological makeup of words. “in” and “the” build up rapidly as they have simple structure, whereas “spring” has a complex onset so its activation builds up more slowly (this most likely arises through phonological, as opposed to phonetic, influences).
The situation for fluent speech is considered now. The first word will start to decay when it starts to be executed (3 and 4), assuming its execution started with a complete plan. The build-up in activation continues for the subsequent words and, given the decay of the first word and offsets for activation of successive words (1), the next word in the sequence will be the one with maximum activation. The process continues, assuming the activation of successive words on completion of the current one is at or near that representing a complete plan (as would be the case in a well-configured biological system for fluent speech production).
The way disfluencies, that have been described as parts of covert repairs, arise is described next. The activation pattern at the time “the” has been spoken is shown in the centre panel of Figure 3. Activation patterns of the other two words over the same interval of time (Tx to Ty) are also shown. “in” (left panel) had built up to maximum previously, but activation by time Ty has dropped right off. “the” has also been at maximum and is showing decay during time for its execution (far less than for “in”). Rate of activation buildup for “in” and “the” was more rapid than for “spring” (right panel) which has the complex onset (property 2 above), and this is shown as having a gentler slope. At Ty (i.e. at the time “the” has been produced), the plan for “spring” is not complete, though some activation has occurred (this could be similar to that represented by the state of the phonetic buffer in Figure 2 with only the first phones complete). A threshold rule (produce the word whose activation is above T in Figure 3) would lead the speaker to repeat “the” in this case. A lower threshold that is still above that achieved at Ty by “spring” or a more rapid execution rate (that allows less time for decay of “in”) could leave both “in” and “the” above threshold. In this situation, both words would be above threshold and the speaker would
produce “in the, in the,”. Activation for “spring” can continue during either of these examples of repetitions and can lead to enough time for the plan for “spring” to be completed [4, 5], its threshold to be above T and it would be produced. Essentially, the overlapping activation patterns permit word repetition when they precede a word with a complex onset (usually a content word in English). Pauses would arise when “in” and “the” have decayed below threshold (due to threshold and rate parameters again), and “spring” has not reached T. Such word repetition and hesitation, that Levelt and Kolk & Postma took as evidence for corrections to errors detected over the internal perceptual loop, arise in the proposed model from overlapping activation patterns and the decay and threshold parameters that apply to the activations in production.
Figure 3: Activation patterns for the three words in the test utterance each shown for the interval of time Tx to Ty. Ty is after execution of the second word and represents a situation that will lead to word repetition. The situation can arise, depending on threshold value, speech rate or rate at which activation builds up (phonological complexity), where the two initial words in the phrase have decayed to values lower than T, and the third word is at or above T, but its plan is not complete. Such a situation is shown in Figure 4. Execution of this word can commence at the requisite time. Some plan still needs to be completed (usually the later phones are the ones that will not be complete, as shown in Figure 2). The plans can be completed in the time taken to execute the first part (and this will usually be the correct word [2]). If the plan runs out, only the first part of these words can be produced (part-word disfluencies at onset). These are characteristics of persistent stuttering [4, 5].
Figure 4. Activation patterns for the three words in the test utterance each shown for the interval of time Tx to Ty. Ty is after execution of the second word and represents a situation that will lead to part-word disfluency involving the onset of the third word. The point of this exercise has been to show errors, word repetition and hesitation, and part-word disfluencies can arise in a spreading activation model without a perceptual monitor. The model is based on some reasonable assumptions about activation buildup and decay in phrases. As a perceptual

Howell
34
monitor has been discarded, this poses a challenge to CRH. Some differences relative to Dell & O’Seaghdha (the model on which [6] was based) should be noted. These authors include lexical activation that is set to zero immediately after lexical selection. The buildup patterns Kolk & Postma show are solely phonological. Dell & O’Seaghdha were modeling priming data and, therefore, they did not consider what happened to activation after response initiation. Although the current work relies on Kolk & Postma’s phonological activation profiles, I want to emphasize that I do not want to commit myself either to a view that phonological activation is all that is important in leading to disfluency or to a different model in which phonological and lexical activation build up in the way Kolk & Postma propose which, for instance, differs from that in Dell & O’Seaghdha’s model. My view at present is that anything that varies the time-course of activation patterns (e.g. syntax as well as lexical influences) needs to be taken into account in accounting for disfluencies.
Many of the ideas behind this exercise have been taken from the EXPLAN model of fluency control [4, 5] and applied and extended to CRH’s representation of word activation. In EXPLAN, speech errors are ignored because they are rare, and fluency failures are focussed on as they are common. In EXPLAN, fluency failures arise because plans are not complete when the word needs to be executed. This leads either to word repetition or part-word disfluencies (the latter mainly in people who stutter). Part word disfluencies are considered problematic events that speakers should avoid. Consequently, a speaker needs to be aware of when this is happening and attempt to avoid it in the future. To achieve this, EXPLAN incorporates a model of the motor processes. Speech motor timing needs to be slowed when part-word disfluencies occur to avoid part-word disfluencies. (Slowing speech timing effectively allows more time for the part-plan to be completed, which is why disfluency is avoided.) How does the speaker become aware that speech timing needs to be altered? EXPLAN’s answer is that all you need to do is to determine whether a complete plan was supplied at the point where execution commenced. This can be determined by subtracting the plan at the point in time execution commenced from the plan at the point in time execution is completed. If the whole plan was supplied, the two will be identical, they will cancel and speech will be fluent. If the speaker initiates speech prematurely, more of the plan will be generated in the time taken to execute the first part and the two will differ and speech needs to be slowed. The points in time that execution starts and execution is completed are landmarks in the account how errors arise and are corrected, presented above. Given that the location of these points is needed to account for errors and that the plan at these points in time is needed to determine whether slowing is necessary, the extra requirement in EXPLAN for determining whether slowing speech is needed can be efficiently dealt with by the minor modification of taking a copy of the speech plan at these landmark points.
Slowing is achieved in EXPLAN by sending the information after subtraction to an external timekeeping mechanism that regulates speech timing. This proposal about the speech-language interface fills a similar role in EXPLAN to the external loop in CRH. Howell [4] presents arguments in favor of the EXPLAN proposal about the connection between the speech planning and motor execution processes (as well as arguments against CRH’s proposal).
There is a lot of work still to be done to link this work with that of Dell, CRH and EXPLAN. For instance, how can the fact that are children who stutter more likely to repeat function words whereas older speakers who stutter are likely to produce
content word disfluencies, be explained in the current model? The answer could be either: 1) that function word activation decays more rapidly in older speakers who stutter than younger ones and fluent speakers, or 2) content word activation starts to build up at the same rate in adults who stutter as with older speakers, but plateaus for some reason (e.g. problems at the juncture between onset and rhyme).
In summary, the occurrence of errors (on the rare occasions they happen) have been explained, word repetition and hesitation (features of covert repairs) and aspects of stuttering accounted for after perceptual loops and a monitor have been discarded.
2. Acknowledgements This work was supported by a grant from the Wellcome Trust.
3. References [1] Dell, G. S. & P. O’Seaghdha. 1991. Mediated and
convergent lexical priming in language production: A comment to Levelt et al. Psychological Review, vol. 98, pp. 604–614.
[2] Garnham, A., R. C. Shillcock, G. D. A. Brown, A. I. D. Mill & A. Cutler. 1981. Slips of the tongue in the London-Lund corpus of spontaneous conversation. Linguistics, vol. 19, pp. 805–817.
[3] Hartsuiker, R. J., & H. H. J. Kolk. 2001. Error monitoring in speech production: A computational test of the perceptual loop theory. Cognitive Psychology, vol. 42, pp. 113–157.
[4] Howell, P. 2002. The EXPLAN theory of fluency control applied to the Treatment of Stuttering by Altered Feedback and Operant Procedures. In: E. Fava (ed.), Current Issues in Linguistic Theory series: Pathology and therapy of speech disorders. Amsterdam: John Benjamins, pp. 95–118.
[5] Howell, P. & J. Au-Yeung. 2002. The EXPLAN theory of fluency control and the diagnosis of stuttering. In: E. Fava (ed.), Current Issues in Linguistic Theory series: Pathology and therapy of speech disorders. Amsterdam: John Benjamins, pp. 75–94.
[6] Kolk, H. H. J. A. & Postma. 1997. Stuttering as a covert-repair phenomenon. In: R. F. Curlee & G. Siegel (eds.), Nature and treatment of stuttering: New directions. Boston: Allyn & Bacon, pp. 182–203.
[7] Levelt, W. J. M. 1989. Speaking. From Intention to Articulation. Cambridge, Massachusetts: MIT Press.
[8] Levelt, W. J. M. 1983. Monitoring and self-repair in speech. Cognition, vol. 14, pp. 41–104.

Proceedings of DiSS’03, Disfluency in Spontaneous Speech Workshop, 5–8 September 2003, Göteborg University, Sweden. Robert Eklund (ed.), Gothenburg Papers in Theoretical Linguistics 90, ISSN 0349–1021, pp. 35–37.
35
Perception of disfluency in people who stutter and people who do not stutter: Results from magnitude estimation
Robert J. Hartsuiker† , Martin Corley‡, Robin Lickley§ & Melanie Russell§
† Ghent University, Belgium ‡ University of Edinburgh, UK
§ Queen Margaret University College, Edinburgh, UK
Abstract
Recent accounts of stuttering [7, 15] consider disfluencies the result of an interaction between speech planning and self-monitoring, emphasizing the continuity between errors made in everyday speech and those made by people who stutter. On Vasiç & Wijnen’s [14, 15] account, the monitor is hypervigilant for upcoming problems and interrupts and restarts the speech signal, resulting in disfluent speech. Crucially, on this account, self-monitoring is a perceptual function. Therefore, this account makes two predictions (1) people who stutter are also hypervigilant in perceiving another person’s speech. (2) the quality of disfluencies made by people who stutter and those who do not will be comparable. We tested these hypotheses using a magnitude estimation judgment task. Twenty participants who stutter and 20 controls were asked to rate the fluency of excerpted fluent and disfluent fragments from recorded dialogues, either between people who stutter or between non-stutterers. In line with the first hypothesis, people who stutter tended to rate all fragments as more disfluent than controls did. However the second hypothesis was not confirmed: across judges, fluent and disfluent fragments excerpted from recordings of people who stutter were rated as less fluent than those excerpted from control dialogues, suggesting that there are perceptually relevant differences between the speech of PWS and PWDNS, independent of number and type of disfluencies.
1. Introduction There is increasing attention for the hypothesis that the disfluencies typically occurring in stuttering (e.g., blocks, prolongations, hesitations, (part-)word repetitions, and self-corrections) are related to self-monitoring processes, the processes with which speakers inspect the quality of their own speech (see [10], for a recent review of monitoring theories). In a nutshell, this hypothesis entails that persons who stutter (PWS) detect many planning problems in their internal speech, and that disfluencies result from attempts to correct these problems ([11, 15]). Monitoring accounts generally assume continuity between the speech of PWS and people who do not stutter (PWDNS): disfluencies in both groups result from the same mechanisms, which tend to come into play more often in PWS. The aim of this study is to evaluate a specific aspect of a monitoring account proposed by Vasiç & Wijnen [15] and to put the continuity hypothesis to the test.
The first monitoring account was Postma & Kolk’s [7], [11] Covert Repair Hypothesis, which localizes the difference between PWS and PWDNS at the processing level where the segmental content of words is determined, i.e., phonological spell-out [5]. Because of the phonological impairment, PWS produce many phonological speech errors internally, which are subsequently detected and edited out by the self-monitor. The editing phase (interrupting and restarting) would result in
disfluencies, and the type of disfluency would depend on the moment of interruption. However, evidence for the covert repair hypothesis is mixed (see [6, 15] for reviews). In particular, there is little evidence that PWS produce excessive rates of phonological speech errors internally. Additionally, a recent study [4] found no group difference on an implicit priming task, a paradigm that is assumed to tap into phonological encoding [9].
More recently, Vasiç & Wijnen [14, 15] presented a variant of the covert repair hypothesis which no longer assumes a phonological encoding deficit. Instead, their ‘vicious circle hypothesis’ directly implicates the self-monitor. In particular, the self-monitor would be hypervigilant so that internal speech is more often considered as discrepant – and thus in need of covert repair – than is the case for PWDNS. They argued that three parameters of monitoring might be responsible for this hypervigilance, on Levelt’s [8] theory in which monitoring is a perceptual function. The first monitoring parameter is effort. PWS might invest so much effort in monitoring their speech, that they detect problems that PWDNS tend to miss. The second parameter is focus, or in other words the set of those aspects of speech to which the monitor attends. The focus in PWS may be maladaptive (i.e., paying to much attention on aspects of speech that frequently deviate but which are unimportant, such as slight variations in the timing of speech plan delivery). The third parameter is threshold. PWS may set the threshold for accepting a speech plan as well-formed too high, leading to more rejections (and hence attempts at repair) than PWDNS.
Vasiç & Wijnen’s study concentrated mainly on effort and focus. While participants spoke, they simultaneously performed a secondary task: a visuo-spatial tasked aimed at decreasing the amount of effort that could be invested in monitoring, or a word-spotting task, aimed at changing the focus of the monitor. Both manipulations decreased the rate of disfluencies in PWS (in particular blocks). However, in PWDNS, the visuo-spatial task decreased the number of disfluencies, but the word spotting task increased that number (in particular, of word repetitions). The data thus confirmed Vasiç & Wijnen’s two predictions concerning effort and threshold. However, it is less clear whether these data are in agreement with the continuity hypothesis.
The present study evaluates the third parameter (threshold) and reassesses the continuity hypothesis. Since the vicious circle hypothesis is based on the assumption that speech is monitored by perceiving it, we chose to directly assess it in a speech perception paradigm. A group of PWS and a control group listened to short fragments of speech and judged ‘how fluent they sounded’. The fragments were spoken by either PWS or PWDNS and they were either fluent or disfluent. The hypothesis that PWS set the threshold too high predicts that PWS judge fragments as more disfluent than the controls would. Additionally, the continuity hypothesis predicts that

Hartsuiker, Corley, Lickley & Russell
36
judges do not discriminate between equivalent disfluencies produced by PWS and those produced by PWDNS.
2. Method 2.1. Participants In order to obtain the stimulus materials, 8 PWS, all males and all native speakers of (Scottish) English, participated in pairs in a dialogue task (the Map Task, [2]). In this task, one person (the instruction-giver) describes a route on a slightly different map to another person (the instruction-follower). Each participant was recorded playing each role. This task results in natural speech, since discrepancies between the maps provide occasions for discussion and negotiation.
Twenty PWS and 20 age- and gender-matched controls participated in the perception experiment. In each group, there were 16 males. Average age for each group was 45 years. All PWS, but none of the controls, considered themselves to have ‘stammers’. 2.2. Materials We excerpted 50 fragments (short segments of speech, typically less than 2 seconds long) from the recorded dialogues between PWS. Of these fragments, 25 were disfluent, containing single word-onset repetitions. The remaining 25, matched for onset, were fluent. A further 50 fragments were excerpted from dialogues between male PWDNS available in the Map Task Corpus [2]. Again, 25 fragments were disfluent, and 25 matched fragments were fluent. As far as possible, pairs of fragments obtained from PWS were matched to pairs from PWDNS (of 25 matched pairs, only one differed in onset phoneme). To the resulting 100 fragments we added a further 100 filler fragments, varying in phonology and fluency, excerpted from dialogues between male speakers in the Map Task Corpus. None of the speakers used for fillers were used for experimental items. Finally, a further 10 filler fragments were selected as ‘practice’ fragments.
Four lists were constructed, each containing all the fragments in a different random order, with the restriction that each list began with the 10 practice fragments and was followed by the reference fragment. The reference fragment was repeated every 10 items. The lists were recorded on DAT tapes.
2.3. Procedure The experiment was administered as a paper- and pencil task. Participants listened to the DAT-tapes over high quality headphones and judged the fluency of each fragment that they heard. They wrote their ratings of each fragment in the corresponding box on a prepared scoring sheet. The rating paradigm use was Magnitude Estimation ([3, 13]). This psychophysical technique requires participants to assign an arbitrary number to the reference stimulus, and judge each stimulus in comparison to the reference (e.g., if a reference line of 10 cm would be assigned the arbitrary number 100, then a veridical judgment of a line of 20 cm would be 200).
In order to explain this procedure to the participants, a first practice phase involved 5 judgments of line lengths. When the experimenter was convinced the participant understood that procedure, a second practice phase involved 10 judgments of disfluency. Instructions emphasized that the judgment should not be based on considerations of gender or accent of speaker, and neither on the content, grammatical structure, or length of the fragment. After each practice fragment, the experimenter provided a prepared comment on that fragment (e.g., ‘nothing wrong with this, there is only some background noise on the tape, so this rating should be close to the reference’).
When it was clear that the participant understood the task, the experimental phase began. Each trial began with a single beep, followed by the fragment. There was an interval of several seconds, to allow participants to write down each rating, between trials. The reference stimulus was always proceeded by two beeps. The experimental phase consisted of two blocks of approximately 25 minutes each.
3. Results The raw ratings were standardized by dividing them by the reference rating. Since the data were ratios (how much more or less fluent than the reference) they were then log-transformed. A transformed rating of zero thus indicated that the participant had judged a stimulus to be equivalently fluent to the modulus; scores less than zero indicated increased disfluency, and scores greater than zero indicated that the stimulus had been rated as relatively fluent.
The mean standardized ratings per condition are shown in Table 1.
Table 1: Mean standardized rating per condition (fluent or disfluent fragments spoken by PWS or PWDNS) and juge (PWS or PWDNS).
JJuuddggee pws-fluent
pws-disfluent
pwdns-fluent
pwdns-disfluent
PWS -0.07 -0.39 0.01 -0.31 PWDNS 0.06 -0.26 0.11 -0.20 The data were subjected to two analyses of variance, one with subjects (F1) and one with items (F2) as the random variable. We set the alpha-level at 0.05.
There were additive effects of fluency of fragment (fluent or disfluent), speaker of fragment (PWS or PWDNS) and of judge (PWS or PWDNS). Fluent fragments were judged as more fluent than the disfluent fragments (0.03 vs -0.29; F1(1, 38) = 212.9; F2(1, 24) = 178.6). Fragments produced by PWDNS were judged as more fluent than fragments produced by PWS (-0.10 vs –0.16; F1(1, 38) = 32.81; F2(1, 24) = 8.33). Finally, PWDNS provided more lenient judgments overall. This effect was highly signficant by-items, but only marginally significant in the by-subjects analysis (-0.07 vs –0.19; F1(1,38) = 3.02; F2(1,25) = 190.13). No second-order or third-order interaction reached significance.
The additive effects of source and fluency of fragment surprisingly suggested that PWS were always rated more disfluent, even if the fragment was fluent. This was confirmed in a post-hoc test, restricted to fluent fragments only (PWS: 0 vs PWDNS: 0.06; F1(1, 39) = 20.20; F2(1, 48) = 4.89).
4. Discussion Taken together with the study reported by Vasiç & Wijnen [14, 15] the current results converge to implicate the self-monitor in stuttering. In a direct test of sensitivity to disfluency, PWS proved more likely to consider speech disfluent, and this did not depend on whether the speech was produced by a PWS, or whether we had classified it as disfluent. This result complements Vasiç & Wijnen’s findings: whereas their results suggested that cognitive effort and a maladaptive focus play a role in the production of disfluencies, our study, which most likely holds the other two parameters constant, suggests that the third monitoring parameter, threshold, is set higher in PWS than in the control group. Thus, the overall picture that appears from this line of research is that all three monitoring parameters are affected: PWS invest too much effort in monitoring, they focus too

Proceedings of DiSS’03, Disfluency in Spontaneous Speech Workshop, 5–8 September 2003, Göteborg University, Sweden. Robert Eklund (ed.), Gothenburg Papers in Theoretical Linguistics 90, ISSN 0349–1021, pp. 35–37.
37
much on whether upcoming speech will sound fluent, and are more likely to consider speech as disfluent.
Of course, this interpretation needs to be treated with caution. In particular, we have not considered individual differences within either group. It is possible however that there is large individual variation and in fact, this may the reason why there was a discrepancy between the significance levels in the subject and item analyses on judge: whereas the items were relatively homogenous, there is likely to be substantial individual variation with respect to judges.
The continuity hypothesis was not supported: excerpts from dialogues between PWS were rated as worse than those from PWDNS, regardless of whether they were fluent or not and regardless of who was doing the rating. Indeed, a post-hoc analysis confirmed that not only the disfluent fragments, but also the fluent fragments were rated as worse if they had been produced by a PWS. This corroborates some earlier reports, showing abnormal motor activity in the speech of PWS ([1], [12, 16]). Before rejecting the continuity hypothesis, however, follow-up research will have to address an alternative explanation. The disfluencies on each tape were generated by a limited number of speakers. It is conceivable that the judges classified a certain speaker as a PWS based on a disfluent fragment. Upon hearing a fluent fragment by the same speaker, the judge may have recognized the speaker and showed a bias to judge PWS as more disfluent. We plan to test that explanation in a follow-up study.
Even if the continuity hypothesis turns out to be false, however, it does not necessarily contradict a monitoring explanation. Although (perceptual) abnormalities in speech motor activity may be an aspect of stuttering, they do not explain what we regard as the primary symptom of stuttering: the occurrence of disfluencies. Whereas monitoring hypotheses have no straightforward account for abnormalities in speech motor programming, they do provide an explanation of disfluencies. As this study, along with other studies, has demonstrated, this explanation is testable and has survived the tests to date.
5. Acknowledgements This research was sponsored by the British Academy.
6. References [1] Adams, F. R., Freeman, F. J. & Edward Conture. 1985.
Laryngeal dynamics of stutterers. In: R. F. Curlee & W. H. Perkins (eds.), Nature and treatment of stuttering: New directions. San Diego, CA: College-Hill Press.
[2] Anderson, A. H., Marcus Bader, Ellen Bard, E. Boyle, G. Doherty, Simon Garrod, S. Isard, J. Kowtko, McAllister, J. Miller, C. Sotillo, C., H. Thompson & R. Weinert. 1991. The HCRC Map Task Corpus. Language and Speech, vol. 34, pp. 351–366.
[3] Bard, Ellen, D. Robertson & Antonella Sorace. 1996. Magnitude estimation of linguistic acceptability. Language, vol. 72, no. 1, pp. 32–68.
[4] Burger, Remca & Frank Wijnen. 1999. Phonological encoding and word stress in stuttering and non-stuttering subjects. Journal of fluency disorders, vol. 24, pp. 91–106.
[5] Dell, Gary. 1986. A spreading activation of retrieval in sentence production. Psychological Review, vol. 93, pp. 283–321.
[6] Hartsuiker, Robert, Herman Kolk & Robin Lickley. In press. Stuttering on function words and content words: A computational test of the Covert Repair Hypothesis. To appear in: R. J. Hartsuiker, R. Bastiaanse, A. Postma & F. Wijnen (eds.), Phonological encoding and monitoring in normal and pathological speech. Hove (East Sussex): Psychology Press.
[7] Kolk, Herman & Albert Postma. 1997. Stuttering as a covert-repair phenomenon. In: R. Corlee & G. Siegel (eds.), Nature and treatment of stuttering: New directions. Boston: Allyn & Bacon, pp. 182–203
[8] Levelt, Willem J. M. 1989. Speaking: From intention to articulation. Cambridge, Massachusetts: MIT Press.
[9] Meyer, Antje. 1991. The time course of phonological encoding in language production: phonological encoding inside a syllable. Journal of Memory and Language, vol. 30, pp. 69–89.
[10] Postma, Albert. 2000. Detection of errors during speech production: a review of speech monitoring models. Cognition, vol. 77, pp. 97–131.
[11] Postma, Albert & Herman Kolk. 1993. The covert repair hypothesis: Prearticulatory repair processes in normal and stuttered disfluencies. Journal of Speech and Hearing Research, vol. 36, pp. 472–487.
[12] Van Lieshout, Pascal, Herman Peters, C. Woodruff Starkweather & Wouter Hulstijn. 1993. Physiological differences between stuttererers and nonstutterers in perceptually fluent speech: EMG amplitude and duration. Journal of Speech and Hearing Research, vol. 36, pp. 55–63.
[13] Stevens, Stanley. 1975. Psychophysics. New York: Wiley.
[14] Vasiç, Nada & Frank Wijnen. Stuttering and speech monitoring.Proc DISS 2001 29–31 August 2001, Edinburgh, United Kingdom, vol. 1, pp. 13–17.
[15] Vasiç, Nada & Frank Wijnen. In press. Stuttering as a monitoring deficit. To appear in: R. J. Hartsuiker, R. Bastiaanse, A. Postma, & F. Wijnen (eds.), Phonological encoding and monitoring in normal and pathological speech. Hove (East Sussex): Psychology Press.
[16] Wood, Sarah. 1995. An electropalatographic analysis of stutterers' speech. European Journal of Disorders of Communication, vol. 30, pp. 226–236.

Hartsuiker, Corley, Lickley & Russell
38

Session III: Disfluencies in First and Second Language Development

40

Proceedings of DiSS’03, Disfluency in Spontaneous Speech Workshop, 5–8 September 2003, Göteborg University, Sweden. Robert Eklund (ed.), Gothenburg Papers in Theoretical Linguistics 90, ISSN 0349–1021, pp. 41–44.
41
Disfluencies and hesitation strategies in oral L2 tests
Caroline L. Rieger
University of British Columbia, Vancouver, Canada
Abstract This paper presents an investigation of hesitation strategies of intermediate learners of German as a second or foreign language (L2) when they take part in oral L2 tests. Previous studies of L2 hesitation strategies have focused on beginning and advanced L2 learners. They found that beginners tend to leave their hesitation pauses unfilled making their speech highly disfluent [17], while advanced L2 speakers – similar to native speakers – use a variety of fillers [10, 11, 13, 14]. In oral L2 tests, intermediate learners hesitate mainly for two reasons: to search for a German word or structure, or to think about the content of their utterance. Some participants use a variety of strategies to signal to the addressee that they are hesitating. This variety is not as rich as it is for advanced L2 learners or native speakers. Other participants leave their hesitation pauses unfilled or rely on quasi-lexical fillers to hold the floor when hesitating.
1. Introduction Hesitations are pauses of varying length, which are usually not left unfilled. They occur when the speaker is at a loss for words or is engaged in cognitive or verbal planning [2, 10, 12]. Native speakers use a variety of fillers to fill their hesitation pauses, such as non-lexical fillers, i.e., the lengthening or stretching of sounds, and quasi-lexical fillers, as well as repetitions of one or several lexical items, and lexical fillers [10, 11, 13, 14]. Bilinguals tend to develop a very unique strategy when hesitating, called idiosyncratic fillers [11].
Hesitation strategies belong to the larger class of ‘disfluencies’ or ‘self-repairs’. The latter are umbrella terms which cover more or less the same phenomena, but depending on the researcher and the field of study hesitation strategies are either included or excluded. In many studies on disfluencies or self-repairs, fillers do not receive much attention. While conversation analysts have not investigated the role of fillers, they do recognize that fillers are self-repair strategies. Mostly, they recognize them as repair initiators or indicators [15]. Psycholinguists do not always recognize fillers as part of the disfluency or self-repair ‘family’. Bear, Dowding, Shriberg & Price [1], who have developed a labeling system for all types of self-repair, do not in all instances label quasi-lexical (or lexical) fillers. Lexical fillers are often ignored by researchers in the study of self-repair. Most of the time they are not mentioned at all, let alone analyzed. Lickley [5] believes that their inclusion in the category of disfluency, is controversial, but Shriberg [16] shows that fillers have the same surface structure as other self-repair and Rieger [10, 11] argues that they fulfill the same function, namely dealing with some kind of trouble in spontaneous speech.
Most sociolinguistic, psycholinguistic or conversation analytic studies on disfluencies or self-repair focus on the production of these phenomena by first language (L1) users. By contrast, this study will concentrate on hesitation strategies of intermediate second language learners. The production of self-repairs or disfluencies by second language speakers has
only recently become of interest to linguists (cf. reviews in van Hest, Poulisse & Bongaerts [19], Kormos [4], and Rieger, [10]) and needs more extensive research so that similarities and differences between L1 and L2 disfluencies can be identified. Which in turn will lead to a better understanding of speech production in general and L2 speech production in particular. Furthermore, since hesitation strategies are not taught in the second/foreign language classroom [10, 14] it is important to find out when and how L2 learners do acquire these useful strategies that not only make their speech more fluent, but also prevent them from losing the floor or prevent the conversation from breaking down.
2. Disfluencies of second language users While countless studies focus on L1 disfluencies very few investigate self-repair strategies of second language users. So far studies on L2 disfluencies have focused on beginning and advanced L2 learners and they reveal that beginners use self-repairs differently than L1 speakers do while advanced learners use strategies similar to those native speakers employ.
Among the first investigators was Hieke [3], who found that non-native speakers employ more self-repairs than native speakers do. Wiese [20] studied self-repair in L1 and L2 production in order to demonstrate that L1 and L2 production are distinct processes. Wiese confirms that L2 speakers use more self-repairs than L1 speakers do. He argues that L2 speakers make more errors than L1 speakers and that they are also more inclined to correct these errors than L1 speakers are. He further infers that his results prove that L2 speakers need more time to plan their contributions, that they have an insufficient knowledge of their L2, and that they demonstrate a low degree of automatization in processing their second language. However, Wiese & Hieke fail to explore the relationship between language proficiency and self-repair usage.
O’Connor [7] analyzed the speech of beginning and advanced L2 learners and discovered that beginners do not use more self-repairs than advanced learners do. However, they employ different types of self-repair: they utilize more corrective repairs than anticipatory repairs (i.e., covert repairs1) while advanced learners use more anticipatory self-repairs.
Temple [17] investigated self-repair in the speech of L1 and beginner L2 users. She measured speech and repair rate in both samples and discovered that native speakers appear to speak twice as fast as non-natives because of their frequent and skillful usage of fillers. The non-natives, on the other hand, tend to leave their hesitation pauses unfilled. They also produce more false starts and leave more errors uncorrected compared to the native speakers. Like Wiese, Temple
1 Covert repairs or anticipatory repairs are self-repairs in which the repairable is produced in inner speech and thus is not hearable. These repairs are realized by hesitations and repetitions.

Rieger
42
concludes that L2 speakers display a low degree of automatization in L2 processing.
Kormos [4] reviewed psycholinguistic studies on self-repair in L2, focussing on their relevance for second language production. She shows how Levelt’s perceptual loop theory of monitoring can be adapted to describe monitoring in L2 speech. She also reports on studies by van Hest [18] and Poulisse & Bongaerts [9] which reveal that content words are more often corrected than function words. However, it needs to be stressed that this finding is not a characteristic of L2 self-repair, since it is comparable to results obtained by Maclay & Osgood [6], Lickley [5], and Rieger [10], who found the same phenomenon for L1 speakers, namely that content words are more often corrected or replaced while function words are more often repeated. In other words, monitoring seems to focus on content rather than form in L1 as well as in L2.
Kormos concludes from the findings of psycholinguistic studies in L2 self-repair that limited metalinguistic awareness and a lack of automaticity in beginning L2 learners reduces their command of preplanning mechanisms and leads to a higher production of errors and a lower correction rate of these errors. However, Kormos does not consider the production of fillers and repetitions, which, as Temple [17] points out, are used more frequently in the speech of native speakers compared to L2 learners. It may well be that the usage of fillers and repetitions increases as learners become more advanced and their attention shifts from lexical, grammatical, and phonological errors to pragmatic and discourse level difficulties.
3. Method
The subject group consists of ten intermediate learners of German. Prior to the data collection, they had either three years of high school German or one year of intensive German at the university, i.e. five hours a week over a period of two terms. Most (eight out of ten) of the participants I report on here had three years of high school German.
Over the course of one academic year three oral tests with the students from an intermediate German class at a large Canadian university were digitally recorded. The three oral tests consisted of a conversation in German between a student and his/her teacher. The conversations took place in the teacher's office and lasted approximately five to twelve minutes. Prior to the tests, the students had to read and prepare a German text so that they would be able to retell the story of the text in German and answer questions related to the text.
The conversations started with explanations on the format of the test and clarifications on the recording. These oral tests are mainly recorded for the purpose of accurate marking and to allow the teacher to be a full and natural participant in the conversation, that is, regardless of the research. It means the teacher does not need to concentrate on the student’s errors, performance and proficiency, instead she can concentrate on the content of the student’s utterances and her reaction to them. For this purpose a very small digital recording device is used. It is characterized by a very low-noise, high-sound-quality and large dynamic range. The recording device is attached to a preamplified boundary microphone characterized by high sensitivity, excellent sound quality and hemispherical directional sensitivity which has the ability to pick up the utterances of two or more people (sitting around a table or facing each other at a desk) at the same time. Once the students agree to be recorded, the oral test starts with some polite small talk to put the students at ease before they are asked to summarize the text they have prepared.
At the end of the academic year, the teacher asked the students’ permission to transcribe and analyze their oral tests for research purposes. At the time of the data collection the students did thus not know that their conversations were the object of a research study, much less what the objective of this study was. This permission as well as some background information was received from ten students.
After having received written consent from ten students, a total of thirty conversations were carefully transcribed and divided into units. The clause or a modified clause was chosen as the basic unit before the main coding process was undertaken. All elements of self-repair were coded for analysis.
This paper reports on the qualitative analysis of the participants’ hesitation strategies which is situated within the framework of interactional sociolinguistics (cf. the description of the method used in [10]).
4. Results and discussion The qualitative analysis of the data revealed that the participants in this study mainly hesitated for two reasons: One, the foreign language created difficulties, i.e., they had to search for a German word or a German construction, or two, they had forgotten parts or details of the text they prepared.
Regarding the filling of hesitation pauses all the students together used a variety of fillers, among which quasi-lexical fillers were used most frequently. An example is given in (1).
(1) ST: ja die mittagspause war ehm … langweilig ☺ yeah the “mittagspause” was uhm … boring ☺
In this example, the student is referring to the text ‘mittagspause’ which he finds boring. Since he needs to pause and think about the German equivalent of boring, he hesitates and uses the quasi-lexical filler ‘ehm’ (uhm) followed by a short but noticeable pause to signal to the teacher that he is hesitating.
Quasi-lexical fillers are frequently used in combination and we find more often ‘ehs’ (uhs) and ‘ehms’ (uhms) combined, than several repeated ‘ehs’ or ‘ehms', as in example (2).
(2) ST: gregor s. ehm .. eh .. liest ehm die annonce gregor s. uhm .. uh .. reads uhm the ad
Another frequent combination is ‘und eh’ (and uh) plus a pause. In these cases ‘und eh’ is almost pronounced like one single word and it clearly functions as a place-holder while the student plans his or her next conversational contribution. Two such instances are presented in example (3).
(3) ST: da war’n viel dialoge und eh .. es war auch lustig … und eh .. ich habe gedacht […] there were many dialogues and uh .. it was also funny … and uh .. I thought […]
Another frequent strategy is the stretching of sounds. It occurs in lexical items as well as in quasi-lexical fillers. In the transcripts, an equal sign indicates sound-stretches. Example (4) shows the stretching of the word ‘und’ (and) while example (5) presents two lengthened quasi-lexical fillers.
(4) ST: ja sie sind ganz süß .. u=nd sehr laut .. u=nd voll von energie […] yes they are very sweet .. a=nd very loud a=nd full of energy […]
(5) ST: aber .. e=h die maschine hat .. e=hm hat eh .. aufgeschrieben? but u=h the machine has .. u=hm has uh .. written down?
Some students use code-switching to signal that they are searching for a word. This is an interesting strategy, which has not been observed for beginners or highly proficient L2 speakers. In fact, in a corpus of more than 60,000 words

Proceedings of DiSS’03, Disfluency in Spontaneous Speech Workshop, 5–8 September 2003, Göteborg University, Sweden. Robert Eklund (ed.), Gothenburg Papers in Theoretical Linguistics 90, ISSN 0349–1021, pp. 41–44.
43
uttered by English-German bilinguals, there were only two code-switches observed to fill hesitation pauses [10]. Which at the time did confirm what research on code-switching has shown, namely that code-switching or language mixing is not an indication of inferior language skill but a natural part of bilingual speech. In fact, Poplack [8] has claimed that code-switching is avoided by all but the most fluent bilinguals. However, the code-switches in this corpus were not produced by fluent bilinguals. Moreover, the students who used them to signal that they were searching for a word were among the weaker of the ten students. (6) is a longer example containing several code-switches.
(6) TR: was passiert .. in dem text? ST: eh … it’s a … oh man … eine inventor? TR: ja ein erfinder ST: ein erfinder und eh er hat eh invented eine ehm
… (3) eh eine rude? TR: what happens .. in the text? ST: uh … it’s a … oh man … an inventor? TR: yes an inventor ST: an inventor and uh he has uh invented an uhm
… (3) uh a rude? This student is well prepared. He has read and understood
the text, nonetheless, he has many difficulties remembering the correct German terms to express the content of the text; instead he uses English words with a questioning intonation hoping that the teacher will help him out which she does. This student also uses the English language to express the frustration with his performance in the interjection ‘oh man’. Other students who use code-switching for hesitation purposes also use it for other purposes. They produce complete English clauses or English interjections (‘oh’ is common), or the conjunction ‘or’ is used on many occasions and most popular are discourse markers, mainly ‘whatever’, ‘actually’ and of course ‘like’. Here is another example with several code-switches.
(7) ST: e=h e=h .. ich mag .. wenn ehm .. I don’t know .. wenn der professor macht or macht die denkmaschine und sie ist like frech
ST: u=h u=h .. I like it .. when uhm .. I don't know .. when the professor makes or makes the thinking machine and it is like rude
The code-switching in oral tests is an interesting phenomenon. The students are eager to show that they are well prepared and if they lack German vocabulary to express all their knowledge they rather express it in English than not at all which is a wise decision. It is also a more advanced interactional behavior than remaining silent. It shows that these students – as opposed to those who leave their pauses unfilled – have internalized the fact that there are conversational and interactional rules similar to the ones in L1 conversations. Some mental or cognitive capacity is freed to monitor not only their verbal behavior but also their interactional behavior. Their automaticity is already at a higher level and they have more command over preplanning techniques and conversational strategies than beginners, but less than more advanced students who do not simply code-switch when searching for a word. Instead, they use a variety of strategies, such as appropriate German fillers, paraphrasing, and substitution – for instance one student used ‘entdecker’ (discoverer) instead of ‘erfinder’ (inventor).
Another strategy that intermediate L2 learners use when hesitating is the repetition of one or several lexical items, as in examples (8) and (9).
(8) ST: also dem dem erfinder fällt keine idee ein […] ST: well the the inventor can't think of an idea […]
(9) ST: ich fand ich fand das sehr interessant ST: I found I found that very interesting
This strategy is very common among native speakers as well as advanced learners, and addressees tend to tune it out. That means, as addressees we are not even aware of the fact that a speaker is using repetitions unless they are repeated several times, such as ‘I I I I I found that very interesting’ or they are so frequent that they occur in several consecutive clauses or turn-constructional units.
A further interesting hesitation strategy is the reformulation of the teacher's question or the verbalizing of the word search in the form of a question in the target language. Example (10) contains both strategies.
(10) TR: erzählen sie ein bißchen über ihr wochenende ST: ach mein wochenende? TR: nur so ein zwei sätze ST: als=o .. was hab ich gemacht? e=hm … nicht
viel einfach .. e=hm ich war zuhause und e=hm ja hab .. hab pitas gebackt (sic!)
TR: ja TR: tell me a bit about your weekend ST: oh my weekend? TR: just one or two sentences ST: wel=l .. what did I do? u=hm … not much ..
u=hm I was simply home and u=hm yeah I backed pita bread
TR: yes In addition, some of the stronger students use German
lexical fillers, which must be considered the most advanced hesitation strategy since they fulfill additional functions [10, 14]. However, the students do not use a great variety of lexical fillers. The German ‘oh’ was observed which is comparable to the English ‘oh’ (but pronounced differently) and the German ‘okay’ which is comparable to the English ‘ok’, as well as the German ‘ja’ and ‘also’. The last two have different functions depending on their position in the utterance [14]. ‘Also’ can be seen in examples (8) and (10) where it is used at the beginning of the turn-constructional unit and has a similar function as the English ‘well’. In example (11) – which is a continuation of example (4) – the student uses another German lexical filler, namely ‘ja’. Here ‘ja’ simultaneously functions as a discourse marker to frame and stress the content of her utterance and to create a link to what has been said before.
(11) ST: .. und ehm ja die sind sehr süß .. ja ST: .. and uhm yeah they are very sweet .. yeah
Finally, some of the weaker students leave some of their hesitation pauses unfilled. They display a behavior that has been observed for beginning L2 learners. If the students were to do that in a different context or setting, outside of school that is, they might lose the floor, have difficulties getting their point across, or the whole conversation might break down. In an oral test, however, or in classroom discussions the conversation does not break down, but the student loses the floor temporarily, as can be seen in example (12). Here, the student cannot remember what the inventor invented. She says:
(12) ST: e=hm … e=r erfinden= … (3.5) TR: okay das ist nicht schlimm wenn sie sich da
nicht dran erinnern können .. das ist auch nur ein detail .. […]
ST: u=hm… h=e invents= … (3.5) TR: ok it is not a big deal if you can’t remember it
.. this is only a little detail .. […] The teacher intervenes when the student hesitates for more than three seconds. Unfortunately, for a teacher it is not always easy to determine when a hesitation pause is too long.

Rieger
44
Some students get uncomfortable when the teacher waits for more than three seconds to help out while other students get uncomfortable when the teacher intervenes after three or four seconds. Another problem is for the teacher to know whether a student is hesitating or not. When students tend to leave their hesitation pauses unfilled it can be difficult to determine whether students are indeed hesitating or simply thinking they are done and have made their point.
5. Summary and conclusion In this small group of ten students we observe a rather divers behavior regarding hesitation strategies. Some students use strategies, which are commonly used by beginners, others use strategies commonly used by advanced learners while a third group seems to fit somewhere in between. Interestingly, the less complex strategies were used by the weaker students, i.e., those with less good grades, whereas the students with the best grades also employed more complex strategies.
The students with the lowest grades used: unfilled pauses, quasi-lexical fillers, and very few repetitions of lexical items.
The students with average grades used: many quasi-lexical fillers, code-switches, and few repetitions of lexical items.
The students with the best grades used: German lexical fillers, repetitions of lexical items, paraphrases of the teacher's question or verbalization of their word search, and quasi-lexical fillers.
This confirms that the usage of fillers and repetitions as hesitation strategies increases as the L2 students become more advanced since it can be claimed that the students who perform best on a linguistic or grammatical level also perform best on a conversational or discourse level. This might not be surprising since it is generally assumed that as the knowledge of the target language increases, the metalinguistic awareness also increases and, thus, attention shifts from lexical, grammatical, and phonological performance to the pragmatic and discourse level. Nevertheless, this study cannot determine whether a better linguistic performance leads to a better conversational performance or the other way around because the best students are also those with more conversational experience in the target language. They have been to Germany for extended periods of times where they took part in conversations with native speakers of German and they have made friends with whom they keep in touch. At the same time, they participate more often in German classroom interactions and make longer contributions. They also seek the opportunity to converse in German with their teacher, while the weaker students try to avoid conversing in German.
As the knowledge of the target language increases and this knowledge is more efficiently applied, L2 speakers allocate more attention to monitoring their speech performance at the discourse level. This seems to be the case for most intermediate students who, as this study has shown, are in the acquisition process of appropriate and diverse hesitation strategies. Since these are not part of the explicit teaching they seem to be acquired in conversations with native speakers outside of the classroom.
In sum, intermediate L2 learners’ hesitation strategies vary widely and there seems to be a correlation between students’ linguistic or grammatical knowledge and the complexity of the hesitation strategies they use.
6. References [1] Bear, John, John Dowding, Elizabeth Shriberg & Patti
Price. 1993. A system for labeling self-repair in Speech. SRI Technical Note, vol. 522, pp. 1–9.
[2] Hänni, Rolf. 1980. What is planned during speech pauses? In: H. Giles, W. P. Robinson & P. M. Smith (eds.), Language: Social psychological perspectives, pp. 321–26. Oxford: Pergamon Press.
[3] Hieke, Adolf. 1981. A context-processing view of hesitation phenomena. Language and Speech, vol. 24, pp. 147–160.
[4] Kormos, Judit. 1999. Monitoring and self-repair in L2. Language Learning, vol. 49(2), pp. 303–342.
[5] Lickley, Robin J. 1994. Detecting disfluency in spontaneous speech. Ph.D. thesis, University of Edinburgh, UK.
[6] Maclay, Howard & Charles E. Osgood. 1959. Hesitation phenomena in spontaneous English speech. Word, vol. 15, pp. 19–44.
[7] O’Connor, Nadine. 1988. Repairs as indicative of interlanguage variation and change. Georgetown University Round Table 1988, pp. 251–259.
[8] Poplack, Shana. 1980. “Sometimes I'll start a sentence in English y termino en espanol”: Toward a typology of code-switching. Linguistics, vol. 18, pp. 581–618.
[9] Poulisse, Nanda & Theo Bongaerts. 1994. First language use in second language production. Applied Linguistics, vol. 15, pp. 36–57.
[10] Rieger, Caroline L. 2000. Self-repair strategies of English-German bilinguals in informal conversations: The role of language, gender and proficiency. Ph.D. thesis, University of Alberta, Edmonton, Canada.
[11] Rieger, Caroline L. 2001. Idiosyncratic Fillers in the Speech of Bilinguals. Proc. DiSS’01, August 2001, Edinburgh, UK, pp. 81–85.
[12] Rieger, Caroline L. 2001. The Perception of Hesitation Pauses in American Sign Language Conversation. RASK, International Journal of Linguistics and Communication, vol. 14, pp. 33–48.
[13] Rieger, Caroline L. 2003. Repetitions as self-repair strategies in English and German conversations. Journal of Pragmatics, vol. 35, pp. 47–69.
[14] Rieger, Caroline L. 2003. German and English Conversational Fillers and Suggestions for their Teaching. Manuscript (under review).
[15] Schegloff, Emanuel A., Gail Jefferson & Harvey Sachs. 1977. The preference for self-correction in the organization of repair in conversation. Language, vol. 53, pp. 361–382.
[16] Shriberg, Elizabeth E. 1994. Preliminaries to a theory of speech disfluencies. Ph.D. thesis, University of Berkeley, California.
[17] Temple, Liz. 1992. Disfluencies in learner speech. Australian Review of Applied Linguistics, vol. 15, pp. 29–4.
[18] van Hest, Erna. 1996. Self-repair in L1 and L2 production. Tilburg, The Netherlands: Tilburg University Press.
[19] van Hest, Erna, Nanda Poulisse & Theo Bongaerts. 1997. Self-repair in L1 and L2 production: An overview. ITL, Review of Applied Linguistics, vol. 117–118, pp. 85–115.
[20] Wiese, Richard. 1984. Language production in foreign and native languages: Same or different? In: H. Dechert, D. Möhle, & M. Raupach (eds.), Second language productions, Tübingen, Germany: Narr, pp. 11–25.

Proceedings of DiSS’03, Disfluency in Spontaneous Speech Workshop, 5–8 September 2003, Göteborg University, Sweden. Robert Eklund (ed.), Gothenburg Papers in Theoretical Linguistics 90, ISSN 0349–1021, pp. 45–48.
45
Age-dependent types and frequency of disfluencies
Krisztina Menyhárt
Research Institute for Linguistics, Hungarian Academy of Sciences
Abstract The age-dependent changes of one’s speech production from childhood up to old age are relatively well known. However, there has been less research conducted concerning the possible alterations of the disfluency phenomena in speakers’ spontaneous speech determined by age. Our hypothesis is that permanent changes are going on in the operation of speech production processes from early childhood up to old age, and that those changes can be studied via observing disfluency phenomena. A series of experiments has been carried out with the participation of altogether 30 Hungarian-speaking persons, children, midle-aged adults and old subjects (ages of 77). Their spontaneous speech was recorded and analyzed concerning the articulation and speech tempi, silent and filled pauses, as well as other disfluency phenomena (like false starts, repetitions, slips, etc.). The aim of the research is to explore the invariant and variable factors of the disfluencies depending on age. The results highlight also the individual differences that seem to be independent of the age factor.
1. Introduction Spontaneous, “fluent” speech involves all sorts of disfluency phenomena. Silent pauses, hesitations, repetitions, fillers, grammatical errors, mis-selected lexical items, self-corrections, prolongations, false starts, slips of the tongue, etc., are all due to some disharmony between speech planning and execution. Speech disfluencies are generally defined as phenomena that interrupt the flow of speech and do not add propositional contents to an utterance [4].
The functions and motivations of disfluencies are manifold. Some of them, like silent pauses, are there to facilitate breathing, but also to enable the speakers to harmonise their speech processes and to leave time for the listeners to digest what they have heard. Other disfluency phenomena occur as “errors”, large numbers of which may be rather distracting for the listener.
According to recent data concerning the numbers of hesitations and/or “errors” occurring in speech [1, 4], spontaneous speech contains an instance of disfluency every six words, whereas in longer monologues, they occur every 3.6 words (due to the specific function of monologues, this count does not involve silent pauses).
Characteristic methodological differences can be observed in disfluency research [3, 5]. One approach tries to draw conclusions concerning the features of disfluencies on the basis of collected corpora; the drawbacks of that approach are that collection tends to be selective and that exact proportions of occurrence are difficult to establish for the various types of disfluency. The other approach analyses disfluencies occurring in a given spontaneous speech corpus, making it possible to get more exact information about the operation of production processes. On the other hand, it might be a problem that the various types of disfluency do not occur in balanced numbers (or not at all) in the corpus studied.
Disfluency phenomena have served as a basis for several models of speech production [2, 6]. Figure 1 shows an
adaptation of Levelt’s [8] speech production model indicating the production levels at which disfluencies may occur (cf. [7]). It can be seen that signs of uncertainty (pauses, hesitations, repetitions, fillers) arise at the conceptual level of speech planning, whereas “errors” can be committed at all levels of the process.
The characteristics of speech can be determined by a number of factors, one of them being age. In early childhood, learning how to speak requires the loading of the mental lexicon, the consolidation of articulatory movements, and the acquisition of grammatical, phonological, as well as pragmatic regularities of the given language. Two to three-year-old children commit seven times as many errors in their speech than adults do [10]. By the age of nine to ten, the process of first language acquisition can be seen as by and large completed, yet children of that age still need a lot of practice before they pick up the speech experience that is needed for school work. Figure 1: The process of speech production and sources of disfluency phenomena.
In adulthood, the quality of spontaneous speech depends on a number of factors that may be rather individual-bound. Such factors are genetic endowments, soundness of articulation, size and activatabilty of word stock, mother tongue awareness and practice in speaking, the topic itself, as well as the current mental state of the speaker.
In old age, a number of physiological changes occur. For instance, lung capacity decreases, forcing old speakers to breathe in more often. The ageing of the cavities influences voice quality, whereas due to changes in neurological
CONCEPTS
Freudian slips, malapropism
GRAMMATICAL PLANNING
grammatical disharmony, contamination,restart with
morphological change
UNCERTAINTY
pause, hesitation, repetition, fillers
PHONOLOGICAL PLANNING
phonological errors
ARTICULATION PLANNING
ordering errors
ARTICULATION
slips of the tongue
MENTAL LEXICON
word retrieving problems
restarts, prolongation, pause within word

Menyhárt
46
functions speech becomes monotonous and broken, and articulation becomes inaccurate. The time required for activating lexemes grows. These factors heavily influence the time structure of old persons’ speech and the disfluency phenomena occurring in it.
The topic of the present paper is an investigation of disfluency phenomena in the spontaneous Hungarian speech of three age groups: children, adults, and old persons. The research objective is to trace invariable features of speech production and its changes across ages. Our hypothesis is that permanent changes are going on in the operation of speech production processes from early childhood up to old age, and that those changes can be studied via observing disfluency phenomena.
2. Method and material We have conducted a series of experiments with the participation of 30 subjects, 15 of them females and 15 males. They constituted three age groups – children, adults, and old persons. The number of males vs. females was equal in all three groups.
The children were schoolchildren between 9 and 12 years of age, their mean age was 10;5. The adults were university students and teachers aged between 22 and 45, their mean age was 32 years. Old persons were aged between 60 and 90, their mean age was 77 years; all of them had had either secondary school or university education.
The participants’ spontaneous speech was recorded and sampled. The children had to tell a continuous story on the basis of a series of four pictures, whereas adults and old persons were interviewed on various topics (work, hobby, career). The stories/interviews were tape recorded and faithfully transcribed. The measurements were done by CSL-4300B digital signal processor (with respect to the duration of speech samples, pauses, and hesitations).
The duration of the full recorded material was an hour and 10 minutes, or approximately 2.5 minutes per person (the samples ranged between 1 and 7 minutes). The number of words analysed was 7642, an average of 255 words per subject.
Disfluencies were studied at eight different levels: 1. the conceptual level; 2. the level of grammatical planning; 3. the level of lexical access; 4. the level of phonological planning; 5. the disharmony of lexical access and articulatory
planning; 6. the level of articulatory planning; 7. the disharmony of articulatory planning and execution; 8. disfluencies involving several levels of planning.
We have summarised the numbers of occurrence of the various types of disfluency, the number of words per instance of disfluency, as well as discrepancies between male and female speakers. We also investigated the time structure (articulation rate, speech rate) of the speech of the participants. We have also performed statistical analyses (ANOVA, at a 95% level).
3. Results 3.1. Temporal relations in speech Since disfluency phenomena show a correlation with speech rate [7], we have analysed the temporal features of the speech of the three age groups (see Figure 2). The data are given in sound/s.
02468
101214
sound/s.
children adults old people
articulation rate speech rate
Figure 2: The articulation rate and speech rate of the subjects. The data show that children speak the most slowly, old persons speak less slowly, and the members of the adult group are the fastest speakers. This result was to be expected as speech rate is known to correlate with age or rather, with speech experience. The differences are significant in each case (see Table 1) except that between the articulation rates of children vs. old persons. Table 1: Significance of temporal relations of speech (p<0,05). Age group Articulation rate Speech rate Child vs. adult p<0.001 p<0.02 Child vs. old p<0.2703 p<0.013 Adult vs. old p<0.017 p<0.008
Inexperience at articulatory movements in childhood, respectively their inaccuracy in old age, result in diminishing differences between the two groups in terms of articulation rate. Males and females did not exhibit significant differences either in articulation rate or in speech rate (p < 0.855; p < 0.659).
The deviation parameters of our data are close to one another; we have not found extreme differences among subjects in any of the groups (see Table 2). Table 2: Standard deviation of data obtained. Articulation rate Speech rate Age group mean std. dev. mean std. dev. Children 10.56 1.1 6.99 1.88 Adults 13.35 1.256 10.31 0.898 Old persons 11.41 1.606 8.72 1.34
3.2. An analysis of disfluency phenomena In the full sample, a total of 2177 instances of disfluency have been found. Compared to the total number of words, this means that 35% of children’s utterances were characterised by disfluencies, whereas for adults and old persons, this figure was 25% and 27%, respectively.
The distribution and frequency of occurrence of disfluencies was quite variable. Table 3 shows the various types of disfluency, their numbers, and proportions across speakers.
As can be seen from the data, only silent pauses occurred with all speakers; this was, at the same time, the disfluency phenomenon occurring the most often. The reason for that can be found, primarily, in the physiological function of silent pauses: breathing. Most subjects also exhibited hesitation, repetition, the use of fillers, prolongation, and various grammatical errors.

Proceedings of DiSS’03, Disfluency in Spontaneous Speech Workshop, 5–8 September 2003, Göteborg University, Sweden. Robert Eklund (ed.), Gothenburg Papers in Theoretical Linguistics 90, ISSN 0349–1021, pp. 45–48.
47
Table 3: The number of disfluencies and their distribution across speakers.
Disfluency type Occurrence across speakers (%)
Number of disfluencies (total material)
silent pause 100 1368 hesitation 93.3 331 repetition 73.3 77 filler 66.6 107 syntactic error 73.3 61 contamination 10 3 restart with morpho-logical change 50 24
false word activa-tion
13.3 6
change of word 13.3 5 phonological error 3.3 1 restart 53 26 prolongation 73.3 82 silent pause within the word
30 34
false start 43.3 37 serial order error 16.3 8 slip of the tongue 6.7 5
The percentages of disfluency phenomena for the three age groups are shown in Table 4. Irrespective of age, the percentages of the various types of disfluency were roughly the same, significant differences were not found in any case (p < 0.9). The largest proportion of occurrence is shown by silent pauses, and especially with old people. The highest numbers of hesitations and grammatical errors were found with adults; children repeated things proportionately the most often, whereas fillers were found in large numbers with old people. Prolongations occurred roughly equally with children and with old people. Table 4: Percentages of disfluency phenomena.
Disfluency type Children (%)
Adults (%) Old persons (%)
silent pause 65 59.4 67.6 hesitation 13 18.2 11.3 repetition 7 3.5 2.8 filler 3 4.4 6 syntactic error 3 4.2 2 restart with morpho-logical change 3 0.7 1.3
problems of lexical access 0 0.9 0
restart 1 1.5 1.1 prolongation 4.5 3.3 4.1 silent pause within a word 0 2.2 1
false start 0.5 1 2.3 other 0 0.98 0.1
We have also investigated at which level of planning/execution (see section 2 above) the members of the three age groups exhibited the highest number of disfluencies (see Table 5). Our data show that, irrespective of age, the highest number of problems (uncertainties) occurred at the conceptual level (level 1), i.e., at the very beginning of the speech planning process. This is in accordance with results of earlier studies (cf. [7]). Relatively many problems occurred at the level of grammatical planning (level 2), or were due to a disharmony between lexical access and articulatory planning (level 5). At the other levels, either no disfluencies occurred at all, or – as with adults – their numbers were insignificant.
Table 5: The distribution of disfluencies by level (%). level
1 level
2 level
3 level
4 level
5 level
6 level
7 Children 88 6 0 0 6 0 0 Adults 85 4.2 0.9 0.08 8 0.58 0.4 Old persons 88 3.4 0 0 8.5 0.1 0
We have also calculated the ratio of words per disfluencies (see Table 6). We can see that children exhibited a disfluency phenomenon of the uncertainty type (including silent pauses) every three words, whereas the other two groups did that every five words. That difference is significant (p < 0.01; p < 0.03), that is, children’s speech contained a lot more uncertainties. If that ratio is recalculated as number of disfluencies per 100 words, we can see that children exhibited 29 instances of uncertainty, whereas adults and old persons exhibited 21.2 instances, in the course of uttering a hundred words.
Table 6: The frequency of disfluencies in terms of number of words (word/disfluency). Type Children Adults Old persons Uncertainties 3.4 4.7 4.7 Errors 36.4 32.9 42.6 Total (excluding silent pauses) 8.35 14.8 13.9
The ratio of occurrence of errors was a lot smaller, and the differences across groups were not significant. Every 100 words, children committed 2.7 errors, adults committed 3, whereas old persons committed 2.3 of them. At the level of all disfluencies (where, for better comparability, we have ignored silent pauses), 12 instances were found with children, 6.8 with adults, and 7.2 with old persons. These results are in accordance with those of both the Hungarian and the international literature [1, 7, 9].
On the basis of deviation data we can establish that the least deviation was found in children’s data (st. deviation: 4.2), whereas the results of the other two groups covered a somewhat broader range (adults: 7.832, old persons: 6.162). Table 7: Differences between male and female subjects. mean std. deviation Disfluencies females males females males Uncertainties 4.54 3.94 0.9612 1.062 Errors 37.35 30.42 23.824 14.290 Total 12.06 12.17 6.45 5.46
We compared the distribution of disfluency phenomena exhibited by male vs. female subjects, irrespective of age differences (see Table 7). In a hundred words, female subjects produced 27, and male subjects produced 21.3 instances of uncertainty, a significant difference (p < 0.035). For errors, these figures were 3.3 (females) and 2.2 (males); and for all disfluencies (excluding silent pauses), they were 8.2 (females) and 7.9 (males). No significant differences were found in this respect (p < 0.128; p < 0.886). That is, in women’s speech there were somewhat more disfluencies, and their data also showed larger deviation than those of men.
4. Discussion The hypothesis stated in the introduction – that speech undergoes permanent changes as the speaker gets older – has only partially been confirmed.
With respect to temporal features of speech, we have demonstrated that the child’s slower articulation rate and speech rate get faster by adulthood, and then slow down again, albeit to a lesser extent, as the speaker gets old. The

Menyhárt
48
articulation rates of children and old persons were rather close to one another; it can be seen that diverse causes – lack of experience, respectively the ageing of the organism – led to similar results.
With respect to disfluency phenomena, we have seen that problems always show up at the same levels, irrespective of age. The hardest task is to formulate what we are going to say; this can be seen in the number of uncertainties at the conceptual level. It is relatively difficult to assign the appropriate linguistic form to the contents we wish to communicate; this is what causes disfluency phenomena at the level of grammatical planning. Finally, it is not easy to harmonise lexical access with articulatory planning, a fact resulting in prolongations or false starts.
We have not found age differences in the numbers of occurrence of disfluencies – all three groups produced silent pauses in the largest numbers, followed by hesitations, fillers, repetitions, prolongations, and grammatical errors. That order is corroborated by other data from the literature (cf. [7]). The highest number of silent pauses were produced by old people; this is a result of the ageing of the organism, in view of the function that silent pauses have in facilitating breathing.
An overwhelming majority of disfluency phenomena we registered were uncertainties appearing at the conceptual level (87% of all the data); errors amounted to a mere 13% on average.
We found a difference between children and adults/old people in the number of disfluencies per 100 words with children producing significantly more instances of disfluency than the other two groups. The reason for that, undoubtedly, is lack of experience, which is partly due to age and partly to the peculiarities of the school system (the fact that schools provide little opportunity to practice speech).
The number of disfluencies per 100 words shows a correlation with data in the Hungarian, as well as the international, literature.
We have not found significant differences between male and female subjects in terms of articulation rate and speech rate; however, there was a difference with respect to disfluency phenomena. Women exhibited somewhat more instances of disfluency than men did.
On the basis of the results obtained, we can conclude that speech production and its disfluency phenomena change with age quantitatively rather than in qualitative terms. In view of the fact that the number of subjects participating in the present experiment, as well as the amount of spontaneous speech investigated, were rather limited, a more exact exploration of the tendencies found here requires further research.
5. Acknowledgements The research was supported by research grant OTKAT037287.
6. References [1] Bortfeld, Heather & Silvia D. Leon & Jonathan E. Bloom
& Michael F. Schober & Susan E. Brennan. 2001. Disfluency rate in conversation: effects of age, relationship, topic, role and gender. Language and Speech, vol. 44, pp. 123–147.
[2] Dell, Garry S. A spreading-activation theory of retrieval in sentence production. Psychological Review, vol. 93, pp. 283–321.
[3] Ferber, Rosa. 1993. Wie valide sind Versprech-sammlungen? Bern: Peter Lang.
[4] Fox Tree, Jean. 1995. The effect of false and repetition on the processing of subsequent words in spontaneous speech. Journal of Memory and Language, vol. 34, pp. 709–738.
[5] Fromkin, Victoria A. (ed.). 1980. Errors in Linguistic Performance: Slips of the Tongue, Ear, Pen and Hand. New York: Academic Press.
[6] Goldman Eisler, Frieda. 1968. Psycholinguistics. New York: Academic Press.
[7] Gósy, Mária. In press. Speaker-dependent characteristics of disfluencies in spontaneous speech. Govor 1.
[8] Levelt, Willem J. M. 1989. Speaking. From Intention to Articulation. Cambridge, Massachusetts: MIT Press.
[9] Lutz, Konnie C. & Mallard, A. R. 1986. Disfluencies and rate of speech in young adult nonstutterers. Journal of Fluency Disorders, vol. 11, pp. 307–316.
[10] Stemberger, Joseph P. 1989. Speech errors in early child language production. Journal of Memory and Language, vol. 28, pp. 164–188.

Session IV: Computational Aspects

50
Proceedings of DiSS’03, Disfluency in Spontaneous Speech Workshop, 5–8 September 2003, Göteborg University, Sweden. Robert Eklund (ed.), Gothenburg Papers in Theoretical Linguistics 90, ISSN 0349–1021, pp. 51–54.
51
Disfluency and speech recognition profile factors
Matthew P. Aylett
Department of Linguistics, University of Edinburgh and Rhetorical Systems Ltd.
Abstract This paper reports on work bringing together disfluency coding carried out by Lickley [7] and recognition work carried out as part of the ERF project (Bard, Thompson & Isard, [2]) at Edinburgh University. A set of factors are investigated which characterise the behaviour of the ASR during recognition based on an analysis of the resulting word lattice. These factors can be grouped as: Entropy Factors – the entropy of the acoustic and language model likelihoods, within the word lattice, over a 10 ms frame, and, Arc Factors – the number of non-unique and unique arcs in the word lattice in any given 10ms time frame, together with the variance of start and end times of these arcs, and the number of arcs starting or ending in the frame.
The values of all factors were used to train a simple CART model. The CART model was used to predict: recognition failure, interruption point location (the point where a disfluency begins), and whether the location was in a repair or a reparandum.
The entropy of the language model values contributed most to the models prediction of recognition failure, and whether a frame was in a repair or reparandum. In contrast, the number of unique word hypotheses contributed most to the successful prediction of a frame being close to an interruption point.
1. Introduction Disfluency is common in normal speech but automatic speech recognisers (ASRs) suffer disproportionate and sometimes disastrous deficits when confronted with normal, abandoned or amended utterances. We examined the behaviour of an automatic recogniser built using HTK [10], when applied to data which forms part of the HCRC Map Corpus [1], and compared this to the extensive and detailed disfluency coding which is available for this corpus [7].
We address the following questions: 1. Can we use the behaviour of an ASR to predict
disfluency coding? 2. If we can, how might we use this knowledge to
improve the performance of the ASR? The results show we can predict disfluency phenomena using an ASR to a certain extent. However, the accuracy of this prediction is low making it difficult to integrate this knowledge into a conventional ASR to improve performance. In this paper we will:
1. Give a brief example of the disfluency coding and the disfluency factors we tried to predict.
2. Give a description of the factors we took from the ASR, go into some depth concerning the rationale behind selecting these factors and describe the techniques we used to examine them.
3. Present a detailed example of a disfluent sentence and discuss how the ASR factors relate to disfluency.
4. Present the results from a predictive CART model based on the ASR factors.
5. Discuss possible strategies for integrating disfluency knowledge into ASRs.
2. Disfluency Coding The disfluency coding used in this study is described in depth in [1]. We used in the study, disfluencies categorised as: repetitions:
“right to my... my right” substitutions:
“I don’t suppose you’ve got the ballons... the baboons?”
insertions:
“parallel with the ravine... the word ravine” deletions:
“oh no what... the line stops at the flagship”
The three dots in the above examples mark the interruption point (IP) (which may or may not be followed by a pause). Before the IP there is material which, if removed, would produce a fluent utterance. This material is termed the reparandum. Following the IP their may be material which has replaced the reparandum, termed the repair. In addition we marked filled pauses, editing expressions (i.e. “I mean...”) and pauses following interruption points. It is possible (and not uncommon) for disfluencies to be nested, and to be multiple. See [7] for more detail. In this paper we will concern ourselves only with the four simple disfluency types described above.
3. Speech Recognition Profile Factors One possible output of an ASR is a word lattice. This is a set of transition probabilities for a various hypothesised sequences of words. The transition probabilities are divided into acoustic likelihoods (the probability of the sounds present in the word to be present in the input), and the language model likelihoods (in our case based on a bigram model – the probability of a word following a previous word). The most probable path though this lattice is regarded as the best hypothesis and usually is the final output of the system. See Figure 1 for a simple example of a word lattice.
Lattices, even for simple sentences, are potentially huge. In general, pruning is used during recognition to remove very unlikely arcs. However, even with such pruning it is not uncommon for a word lattice to have tens of thousands of arcs.
In previous work (e.g. [4, 6, 9]), these lattices have been examined to produce confidence measures. A confidence measure is a value which indicates how likely any word in the ASR’s output was in the input. One hypothesised means of estimating a confidence value is to calculate the entropy of the likelihoods in the lattice. A high entropy (all the likelihoods are around the same value) would reflect noise and uncertainty, a low entropy (some likelihoods much higher than others) would suggest certainty of a particular arc, or arcs.

Aylett
52
In order to calculate these entropy scores we sliced the lattice into 10ms sections. The acoustic, and language model, likelihood, of each arc present during this slice, is taken and normalised by the length of the arc. In section 4 we will examine figures which give some idea how these likelihoods behave across disfluencies. The entropy across these likelihoods in the slice, is then calculated both for the acoustic likelihoods, and the language model likelihoods.
In addition to the entropy of the likelihoods, previous work [6] has examined the way arcs are distributed within a lattice. The more arcs that persist at any point the more uncertain the lattice could be regarded as being, especially if all the arcs represent many different words. From this we produce two values: number of arcs and number of unique word arcs.
The lattice can also give information on boundaries that may or may not exist in the input. If all the arcs present start and end in the frame then the lattice gives a high probability of a word boundary being present. If however the arcs are all ending and beginning at different times in other frames then the lattice could be regarded as being uncertain concerning what boundaries are where. From this we generate three more values: the number of arcs ending in the frame, and the variance of the start points and the end points of all arcs present in the frame.
To summarise, the ASR factors which we used to describe the profile of the recognition that had occurred was as follows:
1. Entropy of Language Model likelihoods normalised by arc length.
2. Entropy of Acoustic Model likelihoods normalised by arc length.
3. Number of arcs. 4. Number of unique arcs. 5. Number of arcs ending in the frame. 6. Variance of arc start times. 7. Variance of arc end times.
These factors are connected with recognition certainty within a lattice. Disfluency has been shown to reduce recognition rates, and thus we might expect, to be related to these factors.
4. Qualitative Example In order to visualise the way acoustic and language model entropy within the lattice might relate to disfluency we constructed a 3D plot. Two examples of these plots are shown in Figure 2 and Figure 3. Figure 2 was constructed using the language model likelihoods, and Figure 3 using the acoustic likelihoods, for the disfluent section of the utterance:
a level with the... the word giraffes. Figure 2 shows the log likelihoods of the language model, normalised by arc length, for the most probable hundred arcs, sorted by likelihood, for the section “the... the word”. The result is an escarpment of values. The higher the entropy, the flatter (not higher) this escarpment will tend to become. The plot shows that the entropy is higher across the reparandum (the first ‘the’), drops during the pause (indicating the language model is more confident it has found the sequence ‘silence the’), rises at the beginning of repair and drops during the body of the repair (indicating the language model is more confidence in recognising the sequence ‘the word’).
Figure 3 shows the same plot for the normalised acoustic likelihoods. The entropy starts to rise through the first ‘the’ (i.e. the escarpment gets flatter). Then drops briefly, suddenly and strongly, for the acoustic burst of confidence surrounding the pause, then returns to the previous value and finally increases gradually within the sequence ‘the word’.
Figure 1: A simple word lattice without transition probabilities (Adapted from a figure in [5]).
Figure 2: Normalised language model entropy.
Figure 3: Normalised acoustic model entropy.

Proceedings of DiSS’03, Disfluency in Spontaneous Speech Workshop, 5–8 September 2003, Göteborg University, Sweden. Robert Eklund (ed.), Gothenburg Papers in Theoretical Linguistics 90, ISSN 0349–1021, pp. 51–54.
53
The recogniser produced the following hypothesis for this utterance:
no no level with where the words first Despite the fact arcs matching the transcription were present, within the top 100 arcs, for both language and acoustic models, apart from the word ‘giraffe’.
We believe these plots do help understand what is occurring within the entropy of the likelihoods. However more information regarding arcs is required to produce a clear picture of the recognisers behaviour. For example the majority of the arcs present during the sequence "word" in the top 100 arcs sorted by normalised acoustic likelihood were either “word” or “words” suggesting the apparently high entropy at this point reflected the uncertainty between choosing ‘word’ and ‘words’ not that the recogniser was uncertain about the acoustic information in general.
The acoustic and language model entropy does indeed correlate negatively with recognition success (Acoustic Entropy v Recognition Success n=1257, r=-0.352, p < 0.001, Language Model Entropy v Recognition Success n=1257, r = -0.430, p < 0.001). And more strongly than the overall likelihood of the best hypothesis (likelihood of best hypothesis v. Recognition Success n=1257, r=0.117, p < 0.001) which although significant is a very poor predictor indeed.
To investigate their relationship with disfluency we constructed a Decision Tree CART model.
5. Decision Tree CART Model Using the speech tools wagon program [3] a cart model was built and used to categorise output from an ASR. The cart model tried to learn:
1. Did the speech recognition profile factors suggest this frame would be recognised correctly.
2. Did they indicate that the frame was close to an Interruption point.
3. Could they indicate what part of a disfluency a 10ms frame was within.
Cart models were trained on 75% of the corpus data and then applied to the remaining 25%. In addition to the factors described above, we also used the entropy values from the previous frame as factors. This was so the CART model could potentially make use of the delta of the entropy scores as well as the absolute values.
The results from the CART model show the contribution to increasing predictive power for each parameter, the number of frames correctly classified and the overall success rate. For example, in Table 1a below, Normalised Language Model Entropy together with Number of Arcs led to a 76.68% percent correct classification, adding Number of unique arcs to the model increased classification to 78.33%. If a parameter is not shown its contribution to the classification was negligible. For predicting recognition failure Table 1b shows that the entropy of the language model contributes most to the model with the other factors increasing success by 6.5%. Table 1b shows the classification results. The CART model correctly categorises 80% of the frames according to recognition failure and success.
Table 1a: Predicting Recognition Failure: Contribution of Factors. Factor %Accuracy With Factor Normalised Language Model Entropy: 0.7425Number of Arcs 0.7668Number of Unique Arcs: 0.7833Variance of Arc End Times: 0.7964Variance of Arc Start Times: 0.8034Number of Arcs Ending in Frame: 0.8064Normalised Acoustic Model Entropy: 0.8085Normalised Language Model Entropy of Previous Frame: 0.8088
Table 1b: Predicting Recognition Failure: Classification Results. Model Predicts Recognition
Failure Recognition Success
total Correct
ASR Result Recognition Failure
7483 2801 10284 72.764%
Recognition Success
2723 15891 18614 85.371%
Total 28898 Correct 23374 - Percentage Correct 80.884% Table 2a and Table 2b show the results for predicting that a frame is within 60ms of an interruption point (IP). The number of frames next to IPs were balanced in number by a random selection that were not close to IPs. Otherwise the CART model gives a misleading 'percentage correct' by never positing an IP because they occur rarely. The number of unique arcs contributes most to the model with the other factors increasing success by 6.5% (Table 2a), the frames were categorised correctly 69% of the time (Table 2b). Table 2a: Frame within 60ms of IP: Contribution of Factors. Factor %Accuracy With Factor Number of Unique Arcs: 0.6297Variance of Arc Start Times: 0.6561Number of Arcs 0.6714Normalised Language Model Entropy: 0.6736Variance of Arc End Times: 0.6889Normalised Acoustic Model Entropy: 0.6911Number of Arcs Ending in Frame: 0.6945
Table 2b: Frame within 60ms of IP: Classification Results. Model Predicts No IP IP total Correct Disfluency Coding
No IP 869 418 1287 67.521% IP 402 995 1397 71.224% Total 2684 Correct 1864 - Percentage Correct 69.449% Table 3a and 3b show the results for a CART model which categorised frames as being either in a reparandum, a repair or not in a disfluency. As for predicting recognition failure the language model makes the biggest contribution to the result with other factors improving the predictive power by 2.7%. These results are skewed by the large number of non disfluent frames. If the results were calculated on chance we would expect: 74% correct categorisation of non-disfluent, 18% correct classification of reparandum and 11% correct classification of repairs. Table 3a: Predicting Location in Disfluency: Contribution of Factors. Factor %Accuracy With Factor Normalised Language Model Entropy: 0.7439Number of Arcs 0.7499Variance of Arc Start Times: 0.7578Variance of Arc End Times: 0.7667Number of Unique Arcs: 0.7710Normalised Language Model Entropy of Previous Frame: 0.7711Number of Arcs Ending in Frame: 0.7712
Table 3b: Predicting Location in Disfluency: Classification Results. Model Predicts Fluent Reparandum Repair total Correct Disfluency Coding
Fluent 33938 1354 633 35925 94.464% Reparandum 5303 2390 173 7866 30.384% Repair 3309 353 1168 18614 24.182% Total 48621 Correct 37469 - Percentage Correct 77.119%

Aylett
54
6. Discussion Overall the results are promising but not ideal. A number of factors make a CART model far from the ideal classifier.
1. The CART model regards each frame as independent when we know that, especially within disfluencies, what was classified previously or subsequently is related. e.g. an IP follows a Reparandum and a Repair follows an IP.
2. Prosodic structure other than IPs may well confound these results. For example the IP classifier might be categorising Intonational Phrase Boundaries as IPs. This would still give a result better than chance but if it cannot tell the difference between an IP and Phrase break the result is not useful.
3. To improve the recognition rate of the base recogniser we would like to produce a probabilistic hypothesis of the location of disfluencies. The CART models do not do this.
A major problem faced in this work was that state of the art recognisers perform poorly on the Map Task Data. This is partly because the data required to train a recogniser for the glaswegian accent is nor readily available but also because of the type of material, it is very natural dialogue, full of disfluencies and other features that typify normal spontaneous speech. Thus the very features which make it interesting material for research into disfluency make it hard for an ASR to deal with. Our baseline recogniser managed 50% word accuracy. This is poor but not dissimilar to the best results on Switchboard (a similarly difficult corpus) of around 60%. We did find that if we could spot disfluencies and remove reparandum the recogniser improved by 5% to 55% word error rate. This is a significant possible improvement.
Other work carried out in the ERF project tried to amalgamate disfluency spotting with the recogniser by post processing the lattice to allow the recogniser to remove reparandum. This met with some limited success [2].
It is interesting that the language model entropy predicted location in disfluency, while the number of unique arcs predicted the location of the IP. This could be because the loss of context has a ripple effect left and right through the lattice on each side of the IP, while the increase in the number of the unique arcs at the IP relate more closely to it acting as a boundary. However, the relationship between recognition failure, the contents of a lattice produced by an ASR, and disfluency, is still far from clear. It is the case that human beings appear to edit out reparandum during recognition [8]. It is true that if ASRs could do this they would perform better. It is the case that disfluencies are prevalent in normal speech and do appear to have structure. However, for it to significantly improve recognition scores we need to be able to detect disfluencies much more accurately than has so far been achieved.
7. Acknowledgements This work was supported by EPSRC Project Grant GR/L50280/01.
8. References
[1] Anderson, Anne H., Miles Bader, Eller Gurman Bard, Elizabeth Boyle, Gwyneth Doherty-Sneddon, Simon Garrod, Steve Isard, Iaqueline Kowtko, Jan McAllister, Jim Miller, Cathy Sotillo, Henry Thompson & Regina Weinert. 1991. The HCRC Map Task Corpus. Language and Speech, vol. 34(4), pp. 351–366.
[2] Bard, Ellen G., Henry S. Thompson & Steve Isard, 2000, ERF: Exploiting Recognition Failures in Automatic Recognition of Disfluent Speech, EPSRC, SALT GR/L50280 Final Report.
[3] Black, Alan W., Paul Taylor & Richard Caley. 1998. The Festival Speech Synthesis System: System documentation. CSTR, University of Edinburgh.
http://www.cstr.ed.ac.uk/projects/festival/festival_toc.html
[4] Chase, Lin. 1997. Word and Acoustic Confidence Annotation for Large Vocabulary Speech Recognition. Proc. Eurospeech ’97, Rhodes, vol. 2, pp. 815–818.
[5] Helzerman, Randall A. & Mary P. Harper. 1996. MUSE CSP: An Extension to the Constraint Satisfaction Problem, JAIR, vol. 5, pp. 239–288.
[6] Kemp, Thomas & Thomas Schaaf. 1997. Estimating Confidence Using Word Lattices. Proc. Eurospeech ’97, Rhodes, vol. 2, pp. 827–830.
[7] Lickley, Robin J., 1998. HCRC Disfluency Coding Manual. HCRC Technical Report. HCRC/TR-100.
[8] Lickley, Robin J., David McKelvie & Ellen G. Bard. 1999. Comparing Human and Automatic Speech Recognition Using Word Gating. Proceedings of the ICPhS Satellite meeting on Disfluency in Spontaneous Speech, UC Berkeley, pp. 23–26.
[9] Willet, Daniel, Andreas Worm, Christoph Neukirchen & Gerhard Rigoll. 1998. Confidence Measures for HMM-Based Speech Recognition. Proc. ICSLP ’98, Sydney, Australia.
[10] Young, Steve, Joop Jansen, Julian Odell, Dave Ollason & Phil Woodland. 1996. The HTK Book. Entropic. Version 2.00.

Proceedings of DiSS’03, Disfluency in Spontaneous Speech Workshop, 5–8 September 2003, Göteborg University, Sweden. Robert Eklund (ed.), Gothenburg Papers in Theoretical Linguistics 90, ISSN 0349–1021, pp. 55–58.
55
Evaluation of a robust parser for spoken Japanese
Kotaro Funakoshi & Takenobu Tokunaga
Department of Computer Science, Tokyo Institute of Technology
Abstract We implemented a parser designed to handle ill-formedness in Japanese speech. The parser was evaluated by utilizing newly collected speech data, which was obtained from an experiment designed to produce ill-formed data effectively. Introducing the proposed method increased the number of correctly analyzed utterances from 171 to 322, from among 532 utterances in the corpus.
1. Introduction Ill-formedness in speech is a major obstacle to designing effective speech dialogue systems. In Japanese, there are three major kinds of ill-formedness: postposition omission, inversion and self-correction. In this paper, we describe our implementation of the method previously proposed by our group [3] to handle ill-formedness. We evaluated this method by using newly collected speech data to demonstrate its effectiveness in speech dialogue systems.
In evaluating methods of dealing with ill-formedness, a major problem is to create a corpus that includes many ill-formed utterances. Although postposition omission, inversion, and self-correction are likely to occur more frequently than other, minor types of ill-formedness, their absolute frequencies of occurrence are not that large. Bear et al. [1] reported only 607 sentences containing self-corrections in a 10,000 sentence corpus (6%). According to Den [2], the ATR dialogue database has self-corrections in about 10% of its sentences. Nakano & Shimazu [6] found 704 self-corrections in their corpus of about 15,000 turns. In contrast, Heeman & Allen [4] reported 1,973 self-corrections in their Trains Corpus of 6,163 turns, and Levelt [5] reported a self-correction rate of 34% for human-human dialogue. Thus, the self-correction rate in a dialogue corpus seems be around 10% (5–30%), although it clearly varies according to the tasks involved in collection. Yamamoto et al. [8] found 171 postposition omissions in 4,063 noun phrases (4%) and 32 inversions in 1,818 utterances (1.8%). Both types of ill-formedness occur less often than self-correction.
We empirically expect that the more deliberately a speaker speaks, the less ill-formedness occurs. In contrast, ill-formedness should occur more frequently in a distractive situation in which a speaker can not concentrate on speaking. We thus designed an experiment to collect ill-formed utterances by creating such a distractive situation.
In section 2, we classify the various types of ill-formedness, and in section 3, we briefly describe our method of handling these phenomena. In section 4, we describe the procedure for collecting ill-formed data, examine the collected data, and give the results of our data analysis. We conclude the paper in section 5.
2. Ill-formedness in Japanese Speech We consider four types of ill-formedness in Japanese speech: postposition omission, inversion, self-correction, and hesitation. In this paper, we refer to an instance of each type of ill-formedness as a disfluency.
2.1. Postposition Omission In Japanese, the grammatical role of a noun phrase is marked by a postposition, and the order of postpositional phrases is relatively free. In Japanese dialogue, however, speakers often omit postpositions, and this causes difficulties in syntactic and semantic analysis. In addition, when we use automatic speech recognizers (ASRs) in dialogue systems, we have to deal with the misrecognition of postpositions. Because their acoustic power tends to be weak, postpositions tend to be misrecognized more than content words by ASRs.
Yamamoto et al. [8] reported that omission of the postpositions “wa”, “ga”, “wo”, “ni” and “e” makes up about 80% of all postposition omission. In this paper, we consider seven postpositions (the above five, “mo” and “no”).
2.2. Inversion Since Japanese is a head-final language, sentences usually end with a predicate. In dialogue, however, speakers sometimes add several phrases after the predicate. We consider such cases as inversion, and we assume that these post-predicate phrases depend on the predicate.
2.3. Self-correction Self-correction is also known as speech repair, or simply repair. In Japanese, self-correction can be combined with postposition omission and inversion [3]: (1) “akai tama-(wo) mae-(ni) osite migi-no yatsu-wo”
red ball-(ACC) front-(GOAL) push right-GEN one-ACC (Push the right red ball forward) In example (1), the speaker corrected “akai tama-(wo)” (“wo” was omitted) by adding the inverted pronoun phrase, “migi-no yatsu-wo”.
2.4. Hesitation Hesitation occurs when a speaker is interrupted or fails to articulate, resulting in a word fragment in the utterance. In many cases, self-correction follows a hesitation, but not always. Moreover, it is hard for current ASRs to recognize fragments. Thus, we treat hesitation as a different phenomenon from self-correction.
3. Analysis Method 3.1. Parser and Dictionary We adopt the dependency parser and method of handling ill-formedness proposed previously by our group [3]. The method handles all ill-formedness in the parser in parallel with syntactic analysis. We describe the parser and the dictionary it uses below.
3.1.1 Dependency Parser We can describe a fragment of a Japanese syntactic structure in a regular expression as “(C F*)+”, where C is a content word and F is a function word. We call such a unit “(C F*)” a phrase. The function word depends on the preceding content word.

Funakoshi, Tokunaga
56
The parser creates a dependency tree of phrases on a stack, in which each element stores a subtree of the structure. The parser maintains multiple stacks simultaneously, each corresponding to a different hypothesis (syntactic structure). After the parser receives a word sequence from the ASR, it incrementally pushes the words onto the stack.
Once a content word is pushed onto a stack, all the succeeding function words in the sequence are attached to the content word. If two consecutive function words are not allowed to adjoin, the parser considers the second one to be a correction of the first, and it replaces the first with the second. This process thus creates a phrase as one element at the top of the stack.
When more than one element is created in the stack, the parser pops the first two elements t1 and t2 (t2 is at the top), then checks for the possibility of a dependency between rw1 and rw2. Here, rwi denotes the root word of subtree ti. If the dependency is possible, the parser duplicates the stack. It then restores the original stack by pushing the two popped elements back on. In the new stack, the parser pushes a new element containing the dependency of rw1 and rw2. Finally, the parser recursively applies the same procedure to the new stack.
For example, suppose the verb “osite (push)” is pushed onto the following stack:1
[ (mae-ni) | ((akai) tama) > forward red ball
Assuming no function word follows “osite”, the parser generates three new stacks: [ (mae-ni) | ((akai) tama) | (osite) >, [ (mae-ni) | (((akai) tama) osite) >, [ ((mae-ni) ((akai) tama) osite) >.
The parser assigns a score to each hypothesis and thus limits the number of hypotheses. In this paper, we do not describe the score calculation algorithm in detail. Briefly, the parser gives preference to dependencies between closer words and interpretations that include more words in an utterance.
3.1.2. Dictionary Description
As mentioned above, we adopted a dependency parser, which does not employ explicit grammar rules. Instead, it has hard-coded grammatical knowledge of phrase structures and utilizes dependency constraints described in the word entries of a dictionary. Here, we show how those constraints are defined.
When a content word C1 depends on another content word C2, we assume that C1 takes a semantic role with regard to C2. The possible semantic roles and constraints on those roles are described in the dictionary as illustrated in Figure 1.
Figure 1: Dictionary entry for “osite (push)”.
1 “[“ and “>“ indicate the bottom and top of the stack, respectively. “|”
indicates the boundary between two elements. “( )” indicates a dependency.
The first line in Figure 1 gives the features of the verb “osite (push)”:
• part of speech (VERB) • imperative mood (IMP+) • action (PUSH+)
The following lines show the possible semantic roles of the verb and the constraints on each role. For example, the second line specifies the constraints on a word taking the role <OBJ>:
• number of words that can take this role (1) • part of speech (NOUN) • postpositions that can mark this role (”wa”, “wo” and
“mo”) • semantic feature(s) (INST+) The parser assigns a semantic role to every dependency
according to the dictionary. By referring to these roles, a syntactic tree can be easily transformed into a semantic frame. The semantic roles also help handle self-correction.
3.2. Analysis of Ill-formed Utterances
3.2.1. Postposition Omission and Inversion
We handle postposition omission and inversion by augmenting the parser and dictionary described in section 3.1. For postposition omission, we allow an unmarked (-) dependency for words that generally relate to one of the seven postpositions listed in section 2.1.
Inversion is handled by allowing not only forward dependency but also backward dependency. First, we specify the possible dependency directions for each role of every word in the dictionary by attaching one of the labels “B”, “F”, or “*”. “F” and “B” allow only forward dependency and backward dependency, respectively, while “*” allows both. Finally, the parser can then handle dependencies in both directions.
3.2.2. Self-correction
The algorithm to handle self-correction is described in detail in our group’s previous paper [3]. In this section, we explain it briefly.
The parser detects a possible self-correction by examining the two elements at the top of the stack. When the parser detects a self-correction, it duplicates the hypothesis stack, leaves one stack intact, and lets the other keep the restored data.
We give an example below: (2) “uma wa akai tama aoi tama osite” horse-TOP red ball-UM blue ball-UM push (Horse, push the red ball blue ball) Here, “UM” means “unmarked” due to postposition omission. This example translates as “Horse, push the red ball blue ball.” By applying its encoded rules, the parser detects the possibility that akai tama has been corrected with aoi tama, after it creates a hypothesis stack:
α: [ (uma-wa) | ((akai) tama) | ((aoi) tama) >. Then, the parser removes the redundant part, and generates a new stack:
β: [ (uma-wa) | ((aoi) tama) >. Here, stack β can be extended to a correct interpretation:
γ: [ ((uma-wa) ((aoi) tama) osite) >. Note that stack γ cannot be reached directly from stack α.
The method explained above cannot handle self-corrections between function words, including postpositions. All self-
Osite VERB IMP+ PUSH+ <OBJ> 1 NOUN wa|wo|mo INST+ <SBJ> 1 NOUN wa|ga|mo ANIM+ INST+ <TO> 1 NOUN ni|e LOC+ <FROM> 1 NOUN wa|ga|mo LOC+ <EXT> 1 ADV - DEG:*

Proceedings of DiSS’03, Disfluency in Spontaneous Speech Workshop, 5–8 September 2003, Göteborg University, Sweden. Robert Eklund (ed.), Gothenburg Papers in Theoretical Linguistics 90, ISSN 0349–1021, pp. 55–58.
57
corrections between function words are handled in creating phrases (section 3.1.1). However, speakers rarely correct only function words in a phrase. In most cases, they give a new phrase containing the correct function words. On the other hand, ASRs frequently insert incorrect function words after correctly recognized function words, due to fillers between phrases. Thus, we neglect the self-corrections between function words.
Lastly, when the parser encounters an editing term, it creates an empty stack for a restart.
3.2.3. Hesitation
It is difficult for ASRs to recognize word fragments resulting from hesitation. We handle hesitation (i.e., word fragments) by employing word skipping.
The parser skips words in parallel with the dependency analysis. We assume that misrecognized words tend to be isolated in their local contexts. Thus, to reduce ambiguity, the parser skips words that cannot depend on their neighboring words. When the parser finds such a word in a hypothesis stack, it duplicates the stack and removes the word from one of the two stacks.
4. Experiment We collected ill-formed speech data and evaluated the analysis method described in section 3.
4.1. Data Collection
4.1.1. Domain of Collected Utterances
In this experiment, the subject’s task was to arrange four colored balls in their prescribed positions by instructing four agents: Horse, Chicken, Snowman, and Camera. The agents other than the Camera could perform the following actions:
1. push an object; 2. turn to a certain direction; 3. move to a certain position or direction.
The Camera could turn and move but could not push an object. Instead, it could photograph a scene.
4.1.2. Collection Procedure
As mentioned in section 1, it is not easy to collect speech data that includes disfluencies. We thus designed our experiment to collect disfluencies as follows.
A supervisor and one subject participated in each session. We used five Japanese students (four male and one female) as subjects. The supervisor showed the subject a bird's-eye view of the current disposition of the agents and balls, as shown in Figure 2.
Figure 2: Revised dictionary entry for “osite”.
The agents were denoted by isosceles triangles and oriented by the sharpest vertices, while the balls were denoted by circles and colored blue or red. The agents and balls were labeled with their names.
The stimulus consisted of a sequence of marks indicating an action and its case roles, which were agent, object, source, and destination. The marks were displayed one by one on the map at intervals of 0.5 second in random order. The stimulus thus corresponded to a command to an agent, and the subjects were instructed to express the command orally, in parallel with the sequential presentation of the marks. Since the subjects were asked to utter their commands in real time—that is, while in the process of constructing a sentence—we could expect many ill-formed utterances, containing complex self-corrections in particular, as well as simple repetitions.
In Figure 2, the action is shown at the upper left in English, the agent is marked by the square on the Horse, the object is marked by the square on one of the red balls, and the destination of the action “push” is marked by the circle between the Chicken and one of the blue balls. This stimulus could be expressed as the command: “uma wa kamera no usiro no akai tama wo aoi tama no hidari ni osite (Horse, push the red ball behind the Camera to the left of the blue ball)”. However, the marks were not always presented in the same order as the standard surface order of the sentence. The keyword specifying the action could be shown before the other marks, so that, in such a case, an inversion would occur if the subject followed the order of the marks.
The subjects are instructed to repair their utterances freely if they thought their utterances were wrong or unnatural and they wanted to do so. However, they were not actually required to invert or correct their utterances.
4.1.3. Collected Data
We conducted two sessions with each subject and collected 536 utterances (about 50 utterances per session). The disposition of the agents and balls was changed for each session. The average length of the utterances was nine words. The collected data included 7 postposition omissions, 4 inversions, 153 self-corrections, and 49 hesitations. These disfluencies appeared in 139 utterances (26%).
We applied an ASR (AmiVoice, Advanced Media, Inc.) to the data, and it made 184 deletions, 55 insertions, and 300 substitutions. The grammar used by the ASR prescribed only the phrase structures. The vocabulary size was 120 words, including 11 fillers. The ASR recognized 203 utterances (38%) perfectly except for fillers. Of these, 168 were recognized perfectly and contained no disfluencies.
4.2. Evaluation
4.2.1. Evaluation Procedure
We implemented the parser described in section 3 and applied it to the collected data. For evaluation purposes, we used the best among the multiple interpretations produced by the parser. We then classified the syntactic analysis results into three categories. [Correct] The resulting dependency tree matched the
speaker's intention. The semantic roles assigned by the parser were also correct.
[Partially Correct] The resulting tree was a subtree of the correct tree.
[Wrong] Either the structure of the tree or the assigned semantic roles (or both) were inconsistent with the speaker's intention.

Funakoshi, Tokunaga
58
4.2.2. Results
First, we transcribed the speech data and parsed the transcribed text with the parser. Table 1 shows the parsing results, with each cell showing the number of utterances. Table 1: Results of parsing the manual transcription.
The parser correctly analyzed 76% of the utterances with disfluencies. For most of the incorrectly analyzed utterances with disfluencies, the parser preferred interpretations without self-corrections, because it was designed to give preference to interpretations covering more of the words in an utterance. As for the incorrectly analyzed utterances without disfluencies, the parser misinterpreted semantic roles.
Table 2 shows the parsing results for the ASR output. Table 2: Results of parsing the automatic dictation.
In this case, the parser correctly analyzed 64.5% (322) of the 499 utterances that were correctly analyzed for the manual transcription. Incorporating our method of handling ill-formedness into the parser enabled it to correctly analyze 151 (= 28 + 22 + 101) of those 322 utterances. Two thirds of the recovered misrecognitions were deletions of one of the seven postpositions. The remaining one third occurred in reparanda that the speakers intended to correct.
5. Conclusion In this paper, we reported our implementation and evaluation of a parser designed previously by our group [3] to handle ill-formedness in Japanese speech dialogue. Introducing a method of handling disfluencies into the parser enabled it to interpret 106 more utterances (about 20% of the collected data) if the ASR worked perfectly (Table 1). With the AmiVoice ASR, the number of sentences analyzed correctly was greatly improved, from 32% (171) to 60% (322).
We designed an experiment to obtain ill-formed data effectively. However, the collected data included only 7 postposition omissions and 4 inversions. This shows that the procedure described in section 4.1.2 was insufficient to produce large numbers of postposition omissions and inversions. We expect that free conversation would be more suitable than the restricted situations employed in our experiment for obtaining ill-formed data.
We also expected that the procedure would collect many complex self-corrections. However, there were only 6 self-
corrections containing more than four words in the reparanda (4% of 153), not including restarts. This was slightly greater than the number reported in Ref. [7] but less than that reported in Ref. [1] and much lower than expected. Our group [3] previously pointed out that Japanese speakers can correct their utterances from distant locations within a sentence by combining inversion and self-correction, as in example (1), but we could find only 3 such self-corrections in the collected data.
6. References [1] Bear, John, John Dowding & Elizabeth Shriberg. 1992.
Integrating multiple knowledge sources for detection and correction of repairs in human-computer dialog. Proc. of 30th Annual Meeting of ACL, pp. 56–63.
[2] Den, Yasuharu. 1997. A uniform approach to spoken language analysis (in Japanese). Journal of Natural Language Processing, vol. 4, No. 1 pp. 23–40.
[3] Funakoshi, Kotaro, Takenobu Tokunaga & Hozumi Tanaka. 2002. Processing Japanese self-correction in speech dialog systems. Proc. of COLING2002, pp. 287–293.
[4] Heeman, Peter A. & James F. Allen. 1997. Intonational boundaries, speech repairs and discourse markers: Modeling spoken dialog. Proc. of 35th Annual Meeting of ACL, pp. 254–261.
[5] Levelt, Willem J. M. 1983. Monitoring and self-repairs in speech. Cognition, vol. 14, pp. 41–104.
[6] Nakano, Mikio & Akira Shimazu. 1998. Parsing utterances including self-repairs (in Japanese). IPSJ Journal, vol. 39, no. 6. pp. 1935–1943.
[7] Spilker, Jörg, Martin Klaner & Günther Görz. 2000. Processing self-corrections in a speech-to-speech system. Wolfgang Wahlster, editor, Verbmobil: Foundations of Speech-to-Speech Translation, Springer, pp. 131–140.
[8] Yamamoto, Mikio, Satoshi Kobayashi & Seiichi Nakagawa. 1992. An analysis and parsing method of the omission of post-position and inversion on Japanese spoken sentence in dialog (in Japanese). IPSJ Journal, vol. 33, no. 11, pp. 1322–1320.
Utterance Type C P W Total w/ disfluency and
misrecognition 28 17 67 112
w/ disfluency only 22 1 2 25 w/ misrecognition only 101 42 76 219
w/o disfluency and misrecognition
171 1 6 178
Total 322 61 153 536
Utterance Type C P W Total w/ disfluency 106 2 31 139 w/o disfluency 393 1 3 396
Total 499 3 34 536 C: correct, P: partially correct, W: wrong

Proceedings of DiSS’03, Disfluency in Spontaneous Speech Workshop, 5–8 September 2003, Göteborg University, Sweden. Robert Eklund (ed.), Gothenburg Papers in Theoretical Linguistics 90, ISSN 0349–1021, pp. 59–62.
59
In dialogue with a desktop calculator: A concurrent stream processing approach to building simple conversational agents
Torbjörn Lager
Department of Linguistics, Göteborg University, Sweden
Abstract Human spontaneous face-to-face conversations are character-ized by phenomena such as turn-taking, feedback, sounds of hesitation and repairs. A simple and highly modular stream-based approach to natural language processing is proposed that attempts to deal with such things. A basic version of the model has been implemented in the Oz programming language.
1. Introduction
“And you do Addition?” the White Queen asked. “What’s one and one and one and one and one and one and one and one and one and one?” “I don’t know,” said Alice. “I lost count.” “She can’t do Addition,” the Red Queen interrupted.
Lewis Carroll: “Through the Looking Glass” Suppose we would like to hook up a desktop or pocket calculator to speech recognition and speech synthesis hardware and software, so as to enable people to solve arithmetic problems in an interactive fashion, in spoken dialogue with the resulting system. Imagine for example being able to ask something like [tu: pl√s Tri:] and after a short pause receive the answer [faIv]. Imagine further being able to follow up with [taIms tu:] after which the system will respond [ten].
What is the best way to accomplish this? It would not be very hard at all of course, unless we insisted on building a system that mimics human dialogue processing. Then it becomes considerably harder. Human spontaneous face-to-face conversations are characterized by phenomena such as turn-taking, feedback, sounds of hesitation and repairs [2]. Also, ambiguity and the resolution of ambiguity work in a different way in spoken language. We know very little about how to handle these things.
The purpose of the present paper is to propose a computational framework – Concurrent Stream Processing – in which modeling of this kind of interaction becomes simple and natural. As we shall see, the main attraction of this approach is that two important things come almost for free: incrementality and modularity. Incrementality makes seamless interaction possible. Modularity helps us fight the complexity inherent in building systems like these.
Although the main motivation behind the choice of type of application is simplicity, its potential use in ubiquitous computing – perhaps as a calculator for the blind – should also be obvious.
2. Dialogue game design decisions In this section, a relevant dialogue game will be designed, by considering one by one the features required.
2.1. Basic moves
From here on, dialogue fragments will be presented in the form of ‘musical score’ transcripts. For example, corresponding to the four turns in the conversation above we have:
U: 2+3 *2 S: 5 10
In a transcript like this, time flows from left to right, and characters that are aligned horizontally represent simultaneously occurring sounds. Periods of silence are transcribed as space characters. Thus, we see that there are periods of silence during which neither the user nor the system speak. Typically, this is where a change of turns is taking place, and indeed, it is the very occurrence of a pause of that particular length that signals to the system that it is allowed to grab the turn in order to present a (possibly only intermediate) result.
The example also shows that evaluation in this game is incremental in the sense that intermediate results are calculated, and may also be presented, along the way towards a final result.
Next, consider the following exchange:
U: 2+3 *2 2 +3*2 S: 10 8
First, note that the user’s first turn is almost identical to the combination of his first two turns in the previous example. The only difference is in the length of the pause; in this example it is not long enough to invite a response.
Secondly, note that although the two questions in the last example consist of basically the same sequences of phonemes, the pauses are inserted differently. The position of the pauses are very significant, since they determine whether a question is to be interpreted as (2+3)*2 or as 2+(3*2). This is the way ambiguity will be treated in the game. The pairing up of parentheses is not used much in spoken natural language, so we disallow them altogether. We use one disambiguation device only – the pause – which means that only two levels of syntactic embedding can be handled, and we assume that this is sufficient.1
1 Compare the use of comma (,) in written text: John and Mary, or
Paul vs. John, and Mary or Paul.

Lager
60
Finally, note the long stretch of silence between the second and third turn. It illustrates the fact that, depending on the state of the dialogue, a pause – long or short – may sometimes not mean anything at all. 2.2. Sounds of hesitation
The perhaps main purpose of sounds of hesitation is to prevent the other party from grabbing the turn. This is functionality that we want to support in our dialogue game. For example, if our user is not interested in receiving intermediate results, yet knows he is not able to speak with a pace fast enough to avoid that, he might instead say:
U: 23+30errrr+312 S: 365
In other words, the user produces a sound of hesitation – transcribed here as “errr” – in order to prevent the system from grabbing the turn and presenting the result of evaluating 23+30.
In general then, when a dialogue is in a state where a speaker induced pause would mean something, and what it would mean is not intended by that speaker, it is important for the speaker not to be silent and thus, as it were, ‘unintentionally’ produce a pause. We will assume that this is an important ‘rationale’ behind sounds of hesitation such as “err”. It is most likely not the whole story, but it is a mechanism that seems to do the job in our dialogue game. 2.3. Self-repair
The proposed dialogue game also supports a limited form of self-repair, i.e. the ability of the system to understand the speaker’s attempts to repair his own utterances, and to react properly. Consider the following example:
U: 2+2no3 2-3no+3 S: 5 5
Indeed, in the proposed game, utterances of the expressions 2-no2+3, 2-no+3, 2-3no2+3, 2-3no+3 and 2-3no+ all mean the same thing, and evaluate to the same answer, namely to the number 5.
Note that there is room for subtle forms of interaction between the processing of sounds of hesitations and the processing of self-repairs. Consider:
U: 1+2errrrrrno3 S: 4
What happens here is that when the user has uttered [tu:], he immediately realizes that this is not what he intended. However, as he is not yet certain about what to say instead, he produces – while thinking – a sound of hesitation. He thus prevents the system from taking the turn and answer the question not intended (something that would make subsequent straightforward self-repair impossible). Had the user been silent instead of generating this sound, the dialogue might have ended up in the following confused and clearly undesirable state:
U: 1+2 no3 S: 3
This concludes the description of our dialogue game design. We have not said anything about openings and closings of dialogues. In a realistic application, such things would also be important, but will be ignored here.
3. The Alice demonstrator A demonstrator and research tool has been implemented – nicknamed Alice – which allows a user to enter into conversations of the kind described above. The processing architecture of Alice is based on the notion of concurrent stream processing. A stream is an ordered, open-ended and potentially unbounded sequence of tokens. Stream processors are transducers that transform input streams into output streams. The following code, written in the Oz programming language [4], forms the top-level of the Alice system.
thread {Listen S0} end thread {FilterSoH S0 S1} end thread {Repair S1 S2} end thread {Chunk1 S2 S3} end thread {Chunk2 S3 S4} end thread {TakeTurn S4 S} end thread {Speak S} end
Here, FilterSoH, Repair, Chunk1, Chunk2, and TakeTurn are transducers, composed so that FilterSoH reads the stream S0 produced by Listen and creates another stream S1 which is read by Repair, and so on. The resulting stream S is eventually spoken by Speak. As a clear proof of modularity we note that this is the only point in the system where the modules communicate.
The transducers are run in parallel – each in its own thread. It means that the system is able to listen, speak, and ‘think’ – e.g. perform all the important language processing steps in between listening and speaking – at the same time (although it doesn’t mean that it always does).
The threads are so called dataflow threads, i.e. they suspend on the availability of data [5]. Given two transducers running in separate threads, the second one will suspend if and only if it needs some part of the output stream of the first which is not yet available. An interesting and extremely useful consequence of this setup is full incrementality: if input is given incrementally, then the output will be computed incrementally as well.
A comparison with ordinary (finite-state) transducers may be useful. Ordinary transducers transform predetermined input strings into output strings, shutting out the world during the process of computation. Our concurrent stream transducers are transducers of incrementally generated streams, which means that interaction with the external world during computation is possible. This, of course, is crucial when processing dialogue.
The Alice GUI contains two ‘musical score notation’ fields. The user inputs his contributions in the field marked “U:” and – while the user types – the system responds in the field marked “S:”
Figure 1: The Alice demonstrator GUI.

Proceedings of DiSS’03, Disfluency in Spontaneous Speech Workshop, 5–8 September 2003, Göteborg University, Sweden. Robert Eklund (ed.), Gothenburg Papers in Theoretical Linguistics 90, ISSN 0349–1021, pp. 59–62.
61
It is up to the user to indicate the passing of time by padding with space characters in the “U:” field as he sees fit.
By means of the Oz Browser the user is able to inspect the streams as they grow – a convenient feature when debugging.
Everything the user writes in the “U:” field is tokenized in an incremental fashion and each token is put in a stream. For example, if the user writes
3errrr+14 the stream will look as follows:
n(3)|e|r|r|r|r|op(+)|n(14)|s|_ The system is not yet able to take spoken input or produce spoken output, but this is planned for the future. 3.1. Processing sounds of hesitation
As noted in Section 2.2, the purpose of sounds of hesitation is to prevent the other party from grabbing the turn. We suggest that by just being uttered, they have already served their purpose, because it means that – by necessity – pragmatically significant pauses not intended by the speaker have not occurred, and this is all that is needed. Consequently, the proper way to deal with sounds of hesitation in the system is to treat them as noise and to remove them – to filter them out so as to stop them from reaching deeper into the cascade of transducers.
What this means in practice is that a stream such as
n(3)|e|r|r|r|r|op(+)|n(4)|s|_ is simply transduced into
n(3)|op(+)|n(4)|s|_
3.2. A rewrite model of self-repair
In Alice, the transduction relevant to self-repair is implemented as a sequence of rewrite rules, a selection of which is shown here:
n(_)|no|n(N) => n(N) n(_)|op(_)|no|n(N)|op(Op) => n(N)|op(Op) op(_)|n(N)|no|op(Op) => op(Op)|n(N)
A stream such as
n(3)|op(-)|no|n(3)|op(+)|n(4)|s|_ gets transduced into
n(3)|op(+)|n(4)|s|_
3.3. Parsing as two levels of chunking
In this section we consider the parsing problem as it manifests itself in our dialogue game. We want our parsing strategy to be incremental, and we want to resolve potential ambiguity in an intuitive way. Let us begin by reviewing our options.
With a mindset tuned to the parsing of written arithmetic expressions – and as victims of the “written language bias” in linguistics [3] – we might consider using a grammar such as
E -> E+E|E-E|E*E|E/E|N
to parse our arithmetic expressions.
However, it is easy to see that this is a bad idea. This grammar is highly ambiguous, and will produce numerous
parse trees for moderately complex expressions.1 There are two standard ways to avoid this ambiguity problem. One is to introduce parentheses into the language and have strict rules for writing arithmetic expressions ensuring that there are always a sufficient number of parentheses to determine the order of operations. The other is to have precedence rules which tell us how to evaluate an expression (e.g. multiplication and division are performed before addition and subtraction). These strategies can be – and often are – combined, e.g. in the form of a grammar such as
E -> E+E|E-E|F F -> F*F|F/F|(E)|N
We will use neither strategy. The user should not have to ‘speak’ parentheses, and the use of precedence rules alone is not flexible enough. The solution here is basically to throw away everything we have learned about parsing of written arithmetic expressions. We will suggest a very simple chunking approach instead, part of which can be paraphrased as follows: “Once you detect a short pause in the input stream of sounds, go ahead and evaluate the chunk that you have heard so far. Remember the result, because the user may soon want to be presented with it, and/or it may serve as an operand in a larger expression of which you have so far only heard a part.” It turns out that two levels of chunking, implemented by composing two simple stream transducers, are sufficient.
Figure 2 depicts the first transducer in the cascade.
Figure 2: Level one chunker. This transducer has three states. Each state has a dynamically changing value associated with it, either a number or a unary function from numbers into numbers.2 The transducer also has transitions, each of which is labeled with two pairs of the form
In:Out V1->V2
where In and Out are tokens and V1 and V2 denote the value of the leaving state and the arriving state, respectively. (Initially, the value of the start state (0) is the identity function.) The pair In:Out will map the token In in the input stream to Out in the output stream. In case Out is 0, In maps to nothing.
Processing works as follows. The transducer takes a stream of tokens as input, reads the stream one token at a time from
1 In fact, they are known to have a combinatorial (Catalan) number of
syntactic parses. E.g. 2+3*2+2*6+4 has 42 parses. 2 ^ is the lambda abstraction operator (e.g. n^n is the identity
function), and f(n) applies a function f to an argument n.

Lager
62
left to right, and writes corresponding tokens to an output stream.
Figure 3: Level two chunker. The result of running this transduction on the input stream
n(2)|op(+)|n(3)|s|op(*)|n(2)|s|s|_
is the output stream
n(5)|s|op(*)|n(2)|s|s|_ This implements the first level of chunking. The result of running the transducer depicted in Figure 3 on this output is the following stream:
n(5)|s|n(10)|s|s|_ and this completes the parsing process. 3.4. Turn-taking
The turn-taking mechanism of our system is based on the transducer in Figure 4.
Figure 4: Turn-taker. Given the stream
n(5)|s|n(10)|s|s|_
the turn-taking transducer produces
n(10)|_
and this is what is spoken to the user. Note that the intermediate result (5) does not pass through the filter and thus is not spoken. The pause is simply not long enough to allow the system to grab the turn.
4. Discussion Although the full validity of our approach can only be determined once speech has been added to the system, we like to think of the work reported in this paper as a first attempt to build a truly asynchronous dialog system based on concurrent stream processing techniques.
Our dialogue domain of choice – numbers and arithmetic operations on numbers – is undoubtedly very simple, and it would of course be interesting to try to build dialogue systems over more complex domains using our approach. Even so, despite the fact that a lot of pragmatics phenomena (presuppositions, implicature, etc.) do not show in our dialogues, there is still room for a fair amount of variation, which we have yet to explore fully. For example, there are feedback moves [1] that would be natural to have in our dialogue game. Let us close this paper by looking at a few of those, commented very briefly. User makes incomplete utterance. System prompts for completion:
U: 2+2+ 3 S: + what? 7
User does not hear, and therefore (twice) prompts for (rephrased) repetition:
U: 2+3 what? *2 what? S: 5 2+3=5 10 5*2=10
User’s query is ambiguous. System enforces disambiguation:
U: 2+3*2 yes S: 2 +3*2? 10
Presumably, these moves would lend themselves to straightforward implementations in our framework.
5. Acknowledgements Thanks to people in the Gothenburg Dialogue Applications Group for discussing these things with me, and in particular to Robin Cooper for reading and commenting on an earlier draft of the paper, and to Aarne Ranta for engaging me in an interesting email exchange concerning the mathematical properties of spoken mathematical language.
6. References [1] Allwood, Jens, Joakim Nivre & Elisabeth Ahlsén. 1992.
On the Semantics and Pragmatics of Linguistic Feedback. Journal of Semantics, vol. 9, pp. 1–26.
[2] Levinson, Stephen. 1983. Pragmatics. Cambridge University Press.
[3] Linell, Per. 1982. The Written Language Bias in Linguistics. Department of Communication Studies, University of Linköping, Sweden.
[4] The Oz/Mozart Consortium. 2003. See: http://www.mozart-oz.org
[5] van Roy, Peter & Seif Haridi. Draft. Concepts, Techniques, and Models of Computer Programming. See: http://www.info.ucl.ac.be/people/PVR/book.pdf
Proceedings of DiSS’03, Disfluency in Spontaneous Speech Workshop, 5–8 September 2003, Göteborg University, Sweden. Robert Eklund (ed.), Gothenburg Papers in Theoretical Linguistics 90, ISSN 0349–1021, pp. 63–66.
63
Memory-based disfluency chunking
Piroska Lendvai†, Antal van den Bosch† & Emiel Krahmer‡
† ILK Research Group, Faculty of Arts, Tilburg University, The Netherlands ‡ Communication & Cognition, Faculty of Arts, Tilburg University, The Netherlands
Abstract We investigate the feasibility of machine learning in automatic detection of disfluencies in a large syntactically annotated corpus of spontaneous spoken Dutch. We define disfluencies as chunks that do not fit under the syntactic tree of a sentence (including fragmented words, laughter, self-corrections, repetitions, abandoned constituents, hesitations and filled pauses). We use a memory-based learning algorithm for detecting disfluent chunks, on the basis of a relatively small set of low-level features, keeping track of the local context of the focus word and of potential overlaps between words in this context. We use attenuation to deal with sparse data and show that this leads to a slight improvement of the results and more efficient experiments. We perform a search for the optimal settings of the learning algorithm, which yields an accuracy of 97% and an F-score of 80%. This is a significant improvement of the baselines and of the results obtained with the default settings of the learner.
1. Introduction Disfluencies are a main stumbling block for automatic processing of spoken language. Hence a preprocessing module capable of automatically filtering out all kinds of disfluencies would be very useful to have, because it is likely to improve further processing such as parsing and interpretation.
Various researchers have worked on automatic disfluency detection in the past two decades, including, but not limited to, Hindle [8], Bear et al. [1], Nakatani & Hirschberg [11], Heeman & Allen [7], Oviatt [13], Shriberg et al. [16]. Most of this work is largely empirical and involves relatively small datasets, since annotating corpora for disfluencies is a difficult and time-consuming process. In addition, many of these studies tend to focus on a subset of disfluent phenomena, such as repairs or fragmented words, and are usually concerned with (American) English (exceptions include Eklund & Shriberg [6] on Swedish, Spilker et al. [17] on German, and Lendvai [10] on Dutch).
In this paper we follow a different route. We apply memory-based machine learning to automatically detect disfluencies in a large syntactically annotated corpus of spontaneous spoken Dutch. We take a broad conception of disfluency: everything that does not fit under the syntactic tree of a sentence, according to the syntactic annotators. This includes fragmented words, laughter, self-corrections, repetitions, abandoned constituents, hesitations and filled pauses. The learning task is defined as follows: given an utterance (i.e., a string of words), predict where disfluent chunks start and where they end. This approach may be likened to syntactic phrase chunking (e.g., Tjong Kim Sang & Buchholz [18]), where the chunker in our case marks whether a word occurs inside a disfluent chunk or outside it, rather than whether a
word occurs within or outside some syntactic constituent. As input to the learning task we only use low level, readily available features. No explicit feature selection is performed in the experiments since the memory-based learner is capable of determining which features are most beneficial for the learning task. We do perform an extensive search to estimate the optimal setting of the algorithm for our task, and investigate the usefulness of special attenuation techniques (Eisner [5], van den Bosch & Buchholz [2]) to compress the data set and avoid sparse data problems.
The rest of this paper is organized as follows. In Section 2 we describe the method, starting with a brief overview of the corpus we used (2.1), and the feature representations that we derived from it (2.2). In Section 2.3 we describe the memory-based classifier. The experimental set-up is outlined in 2.4. Special attention is paid to the attenuation method (2.5) and the parameter optimization routine (2.6). The baselines are given in 2.7. In Section 3 the results are presented. We end with some concluding remarks and pointers for future research in Section 4.
2. Method 2.1. Corpus Our experiments are based on the Spoken Dutch Corpus (Corpus Gesproken Nederlands, CGN, Release 5) that contains various kinds of discourses sampled from different regions of the Netherlands and the Flemish part of Belgium. The discourses are of various levels of spontaneity ranging from television broadcasts to telephone conversations, and the number of speakers spans from 1 (newsreading) to 7 (parliamentary sessions). For more information, see Oostdijk [12] and van der Wouden et al. [19]. For the machine learning experiments we used a representative sample of 203 full discourses from CGN, consisting of 340,545 lexical tokens in 44,939 sentences. In the corpus, sentence segmentation is done automatically, based on silence detection. The average sentence length is 7.6 words. The sentences are orthographically transcribed and morpho-syntactically tagged. In addition, a complete and corrected syntactic dependency tree is built manually for each utterance.
Figure 1 contains an example sentence from the CGN corpus with the complete morpho-syntactic analysis. Note that certain leaves are not incorporated in the syntactic analysis tree. By definition we consider all those as disfluencies. In Figure 1 we have three disfluent chunks: a false start (ik uh), a filled pause following the word “scepsis” (uh) and a repetition (zo’n). According to our criterion, 9.07% of all lexical tokens in the data set are part of a disfluent chunk. The number of disfluent chunks is 27,113.

Lendvai, van den Bosch & Krahmer
64
Figure 1: Example sentence (“ik uh ik heb met de nodige scepsis uh deze gang van zaken zo’n zo’n jaar aangekeken”; I have followed this process with a certain amount of skepticism for about a year) from the CGN corpus with full morpho-syntactic analysis.
2.2. Feature representations Each of the 340,545 words is represented as a vector (or an instance) of 31 features that we extracted automatically from the corpus. The set of features can be grouped into two. One group consists of nine lexical string features that represent the focus word itself, plus its four left and right neighbors. Thus, we use a context window of length nine. In line with earlier work on disfluencies, for instance Heeman & Allen [7], we assume that local context is sufficient for detecting most speech repairs. We do not use part-of-speech tags and other syntactic information from the gold-standard corpus, nor from any part-of-speech tagger or parser. The second group of features consists of 22 binary overlap features. Of these, 20 record overlap between words within the window, the remaining two record overlap in the initial letters between the focus word and its left and right neighbors respectively. Matching words or word-initial letters are often to be found at the onset of a reparandum and/or a repair part of a disfluency.
Finally, for each word in the data set we record whether it is inside a disfluent chunck (I-DISFL) or outside of it (O-DISFL), i.e., whether it is part of the syntactic structure for the entire utterance or not. This is the class to be predicted by the machine learner.
2.3. Classification: Memory-based learning We worked with a memory-based learning (MBL) algorithm based on the classical k-nearest neighbor approach to classification (Cover & Hart [3]). The k-NN algorithm looks for those instances among the training data that are most similar to the test instance according to some distance function ∆ between two instances X and Y,
∆(X,Y) = Σni=1 wi δ (xi, yi),
where n is the number of features in X and Y, wi is the weight of feature i and δ gives the difference between two values of the ith feature. The classes of the k nearest neighbors are then extrapolated to predict the test instance’s class. Memory-based learning is often called “lazy” learning, because the classifier simply stores all training data in memory, without abstracting away from individual instances in the learning process. We use the TiMBL 4.3 software package (Daelemans et al. [4]) for the experiments.
2.4. Experimental set-up Training and testing is done by 10-fold cross-validation (CV), where re-sampling draws on discourse-based partitioning, thereby assuring that no material from the same discourse could be part of both the training and the test set.
The performance of the learner is evaluated in terms of four measures: accuracy (the overall percentage of correctly predicted I-DISFL and O-DISFL class labels), precision, recall and F-score. The F-score represents the harmonic mean of precision and recall. We use the unweighted variant of the F-score that is defined as 2PR/(P+R), where P is precision and R is recall (see e.g., van Rijsbergen [15]). We would like to stress that precision, recall and F-score apply to entire chunks in our evaluation. Thus: in the example sentence in Figure 1 both words in “ik uh” need to be classified as I-DISFL to count as a correct classification of the chunk.
2.5. Attenuation Infrequent or unknown words are often problematic for machine learning techniques since the occurrence statistics of such items are unreliable. At the same time, the word form may contain useful information; for instance, a capitalized word is likely to be a named entity, a word that contains a number is usually either a number or the name of a number, a hyphen tends to indicate compounding. In addition, the final letters of a word may give away morphological clues, e.g., -ly (adverb) in English, or -dt (verb) in Dutch. Attenuation is a technique for words occurring below a certain frequency threshold to make such information explicit while masking the actual expression. Besides addressing the sparse data problem, another advantage of this technique is that the search space is reduced since the number of different feature values that needs to be checked becomes much smaller.
Our attenuation method is a simplified version of van den Bosch & Buchholz [2] (which was in turn based on a proposal by Eisner [5]):
IF a word occurs less than 100 times in the training data, THEN • Convert it to MORPH • If it contains a number, add –NUM • If it contains a hyphen, add –HYP • If its first letter is a capital, add –CAP • If none of these three tests apply, add the last two
letters of the word. ELSE retain the original word.

Proceedings of DiSS’03, Disfluency in Spontaneous Speech Workshop, 5–8 September 2003, Göteborg University, Sweden. Robert Eklund (ed.), Gothenburg Papers in Theoretical Linguistics 90, ISSN 0349–1021, pp. 63–66.
65
For the (English) example sentence in Figure 1 this strategy produces the sequence “I have MORPH-ed this MORPH-ss with a certain amount of MORPH-sm for about a year”. The attenuation method is applied to each train/test split, creating attenuated versions of both. We hypothesize that for the current learning task attenuation will not have a negative effect (and might even have a positive effect) since the binary overlap features, which are not based on the attenuated words, are likely to compensate for some of the potential information loss.
2.6. Parameter optimization by iterative deepening Like most other machine learning techniques, the MBL algorithm has various parameters that may bias its performance. Since it is unknown beforehand which parameter setting is most likely to yield the best results, and since it would be bad practice to make this estimation using the test data, we performed parameter optimization experiments on the training material itself. More precisely, we ran 10-fold CV experiments on each of the 90% training sets within the basic 10-fold CV experiment. Parameter settings were tested according to a procedure called iterative deepening, which is a combination of classifier wrapping and progressive sampling (Kohavi & John [9], Provost et al. [14]).
The iterative deepening search algorithm automatically constructed a large number of different learners by varying the parameters of MBL and systematically trained these learners on portions of the 90% training set, starting with a small sample and doubling it over the iterative optimization rounds. In the iterating rounds of the search process the combinations of parameter settings were recursively estimated by maximizing the F-score performance on the I-DISFL class. The learner with the highest F-score on disfluency chunking (i.e., the one with the highest estimated generalization performance) was then selected and applied to the full 90% training set and subsequently tested on the as yet unseen 10% test set.
The learners were created by combining the following parameters (the default setting in TiMBL are shown in brackets):
• The value of k could be 1, 3, 5, 7, 9, 11, 13, 15, 19, 25, or 35. (Default: 1)
• The distance weighting metric ∆ was majority class voting, linearly inversed distance weighting, inverse distance weighting, or exponential decay distance weighting with α set to 1, 2 or 4. (Default: majority class voting)
• The distance δ between feature values was computed using either the overlap function or the modified value difference metric. (Default: overlap)
• The weighting function w ―which estimates the importance of attributes― was either information gain, gain ratio, χ2, shared-variance or no weighting. (Default: gain ratio)
For details about the parameters see Daelemans et al. [4].
2.7. Baselines To quantify the performance of the learning method we need to define a baseline. The most straightforward baseline is to always predict the majority class. Since most words in the corpus are not disfluencies, this baseline amounts to always predicting class O-DISFL. This would result in a correct prediction in 90% of the cases. However, for the class of interest (I-DISFL) this strategy leads to a recall of 0 (all disfluencies are missed) and an undefined precision and hence an undefined F-score.
Table 1: Majority class and filled pause (FP) baselines. Standard deviations are given between brackets.
Acc. PPrreecc.. RReecc.. FF Majority baseline 90.0 (1.6) N/A 0 N/A
FP baseline 92.9 (1.5) 76.4 (3.1) 28.5 (5.8) 41.2 (6.7)
A somewhat more intelligent baseline is the following. The most frequent kind of easily detectable disfluencies are basic filled pauses (FPs, transcribed as uh, uhm, hu, and hm in the CGN corpus). We define a FP-baseline that predicts that all filled pauses are disfluencies and everything else is not. This baseline has an accuracy of 92.9%, a relatively high precision (not 100%, since one in four filled pauses is part of a larger disfluent chunk), a relatively low recall (it misses most disfluent chunks) and an overall F-score of 41.2%. Table 1 summarizes the baselines.
3. Results Table 2 shows the average performance of MBL in three series of 10-fold CV experiments. In the first series we tested the default settings of the TiMBL implementation of MBL. This resulted in a 95.7% accuracy and a 72.3% F-score, which is a clear improvement of both baselines in Table 1. When the default settings of TiMBL were applied to the attenuated data, we observed a slight, overall improvement. The increase in accuracy is not significant, but the increase in F-score is, on a one-tailed t-test (t = 1.96, p < .05). Thus, attenuation indeed does not degrade performance while reducing the number of different feature values. Table 2: Results of the three series of learning experiments. Standard deviations are given between brackets.
Acc. PPrreecc.. RReecc.. FF Default MBL 95.7 (0.5) 69.0 (3.0) 76.0 (1.6) 72.3 (1.8)
Attenuation + Default 96.0 (0.5) 71.7 (3.0) 76.3 (1.6) 73.9 (1.8)
Attenuation + Optimization 97.0 (0.5) 79.9 (3.1) 80.2 (5.8) 80.0 (1.8)
The third experiment series involved both attenuation and parameter optimization. This approach resulted in 97% accuracy in disfluency chunking, which is a substantial improvement over both baselines. With respect to the sharp FP-baseline this amounts to an error reduction of 58%. There is a 1-point increase in accuracy with this technique compared to the default learner applied to attenuated data. The difference is statistically significant (t = 4.29, p < .001). In addition, the F-score obtained in this experiment is almost twice as high as for the FP-baseline, and reaches a 7.7 points increase in F-score compared to the default learner, primarily due to an improved precision.
The settings resulting from the optimization process slightly differed for the ten folds. Namely, the optimal value of k ranged from 11 to 35, the distance metric chosen was either linearly inversed or inverse distance weighting, the distance between feature values was best computed using the modified value difference metric, and for feature weighting the learners mainly used shared variance, although gain ratio for two folds led to better results. The most reliable features for the learners were the focus word itself, as well as information on the focus word‘s overlap with the immediate right or second right word in the context window.

Lendvai, van den Bosch & Krahmer
66
4. Discussion We set out to investigate the usefulness of memory-based machine learning techniques for automatic disfluency chunking in transcriptions of spontaneous speech. We took a broad conception of what counts as a disfluency, namely everything that does not fit under the syntactic tree of a sentence according to a human annotator. This includes, among other things, filled pauses, false starts, repetitions, abandoned constituents, and fragmented words. We extracted simple, low level features that keep track of the local context, the focus word, and potential overlaps between words in the context window. It turned out that the best results were obtained using attenuated data and iterative deepening parameter optimization. We saw that optimization led to a significant improvement over the baselines and over the results obtained with the default TiMBL settings, yielding an accuracy of 97% (an error reduction of almost 60% with respect to the highest baseline) and an F-score of 80%. An obvious limitation of the current study is that it is based on orthographic (correct) transcriptions. It would be highly interesting to see what happens if we first put the speech data through an automatic speech recognizer, and perform the learning experiments on its output (which is more than likely to contain a lot of recognition errors). It seems a safe bet that this will lead to a significant drop in performance. However, we believe that the basic approach followed in this paper will still be useful. For instance, overlap features may still be informative, even if entire words are misrecognized.
In addition, we conjecture that the use of additional features may compensate for some of the loss in performance. This would hold in particular for prosodic features, which have been shown to be indicators of certain kinds of disfluencies. One portion of the CGN data used here is currently being prosodically annotated, assigning pitch accents and breaks to the corpus material. We plan to redo the machine learning experiments described here using recognized words and prosodic information, and hope to be able to report on the results in a sequel to this paper.
5. References [1] Bear, John, John Dowding & Elizabeth Shriberg. 1992.
Integrating multiple knowledge sources for detection and correction of repairs in human computer dialog. Proceedings ACL, pp. 56–63.
[2] van den Bosch, Antal & Sabine Buchholz. 2002. Shallow parsing on the basis of words only: A case study. Proceedings ACL, pp. 433–440.
[3] Cover, Thomas & Peter Hart. 1967. Nearest neighbor pattern classification, IEEE Transactions on Information Theory, vol. 13, pp. 21–27.
[4] Daelemans, Walter, Jakub Zavrel, Ko van der Sloot & Antal van den Bosch. 2002. TiMBL: Tilburg memory based learner, version 4.3, reference guide, Tilburg University, available from http://ilk.uvt.nl.
[5] Eisner, Jason. 1996. An empirical comparison of probability models for dependency grammar. Technical report IRCS 96–11, Institute for Research in Cognitive Science, University of Pennsylvania.
[6] Eklund, Robert & Elizabeth Shriberg. 1998. Crosslinguistic Disfluency Modelling: A Comparative Analysis of Swedish and American English Human–Human and Human–Machine Dialogues. Proceedings ICSLP, Sydney, vol. 6, pp. 2631–2634.
[7] Heeman, Peter & James Allen. 1994. Tagging speech repairs. ARPA Workshop on Human Language Technology, pp. 187–192, Princeton.
[8] Hindle, Don. 1983. Deterministic Parsing of Syntactic Nonfluencies. Proceedings ACL, pp. 123-128.
[9] Kohavi, Ron & George John. 1997. Wrappers for Feature Subset Selection, Artificial Intelligence, vol. 97(1–2), pp. 273–324.
[10] Lendvai, Piroska. 2003. Learning to identify fragmented words in spoken discourse, Proceedings EACL-2003 Student Research Workshop, pp. 25–32.
[11] Nakatani, Christine & Julia Hirschberg. 1993. A Speech-First Model for Repair Detection and Correction. Proceedings ACL, pp. 46–53.
[12] Oostdijk, Nelleke. 2002. The design of the Spoken Dutch Corpus. In: New Frontiers of Corpus Research, P. Peters, P. Collins & A. Smith (eds.), Rodopi, Amsterdam, pp. 105–112.
[13] Oviatt, Sharon. 1995. Predicting spoken disfluencies during human-computer interaction, Computer Speech & Language, vol. 9, pp. 19–36.
[14] Provost, Foster, David Jensen & Tim Oates. 1999. Efficient Progressive Sampling, Knowledge Discovery and Data Mining, pp. 23–32.
[15] van Rijsbergen, Keith. 1979. Information Retrieval. Buttersworth, London.
[16] Shriberg, Elizabeth, Anderas Stolcke & Don Baron. 2001. Can prosody aid the automatic processing of multi-party meetings? Evidence from predicting punctuation, disfluencies and overlapping speech. Proceedings ISCA workshop on Prosody in Speech Recognition and Understanding, pp. 139–146.
[17] Spilker, Jörg, Anton Batliner & Elmar Nöth. 2001. How to repair speech repairs in an end-to-end system. Proceedings of Disfluency in Spontaneous Speech, pp. 73–76.
[18] Tjong Kim Sang, Erik & Sabine Buchholz. 2000. Introduction to the CoNLL 2000 shared task: Chunking. In: Proceedings of CoNLL-2000 and LLL-2000, pp. 127–132.
[19] Wouden, Ton van der, Heleen Hoekstra, Michael Moortgat, Bram Renmans & Ineke Schuurman. Syntactic Analysis in the Spoken Dutch Corpus. In: M. González Rodriguez & C. Paz Suárez Araujo, Proc. Third International Conference on Language Resources and Evaluation, pp. 768–773.

Proceedings of DiSS’03, Disfluency in Spontaneous Speech Workshop, 5–8 September 2003, Göteborg University, Sweden. Robert Eklund (ed.), Gothenburg Papers in Theoretical Linguistics 90, ISSN 0349–1021, pp. 67–70.
67
A disfluency study for cleaning spontaneous speech automatic transcripts and improving speech language models
Martine Adda-Decker, Benoît Habert, Claude Barras, Gilles Adda, Philippe Boula de Mareuil & Patrick Paroubek
LIMSI-CNRS Orsay France
Abstract
The aim of this study is to elaborate a disfluent speech model by comparing different types of audio transcripts. The study makes use of 10 hours of French radio interview archives, involving journalists and personalities from political or civil society. A first type of transcripts is press-oriented where most disfluencies are discarded. For 10% of the corpus, we produced exact audio transcripts: all audible phenomena and overlapping speech segments are transcribed manually. In these transcripts about 14% of the words correspond to disfluencies and discourse markers. The audio corpus has then been transcribed using the LIMSI speech recognizer . With 8% of the corpus the disfluency words explain 12% of the overall error rate. This shows that disfluencies have no major effect on neighboring speech segments. Restarts are the most error prone, with a 36.9% within class error rate.
1. Introduction
Within the Human-Machine Communication department at LIMSI, we experiment with combining skills and techniques in audio document transcription and in text processing, in order to improve both domains.
A first step consists in processing texts and audio documents belonging to the same topic, as such ‘sibling’ resources become more and more within reach (for instance broadcast news and newspaper articles about the same event). Using such resources to improve speech transcription and structuring represents a first direction. These texts can simply share the topic of the audio documents. In the present study, however, they consist in relatively close transcriptions. For instance, these texts can help to define the language model (topic-centered models, specific lexica). A better knowledge of spontaneous speech then becomes necessary to also improve modeling along the relatively topic-independent dimension of spontaneous speech phenomena.
A second direction consists in enhancing speech transcriptions so as to input them to taggers, parsers and indexing tools. As these softwares may require punctuation marks to facilitate sentence, clauses and phrases identification, linguistic models of punctuation and acoustic hints such as break length, inspirations, intonation can be used to complete the transcriptions in this area. On the other hand, disfluencies (DFs in the sequel) must be edited to get text-like input or to improve the readability of an automatic transcription.
This study makes use of 10 hours of French radio archives, recorded about 10 years ago (we will refer to this corpus as the archive corpus). In each one hour show a major personality from either political or civil society (e.g. nonprofit humanitarian organizations) undergoes a detailed questioning by quite a few journalists. The setting of the chosen interviews favors the production of disfluencies. One of the reporters acts as chairman. He monitors the repartition of time between the reporters and the before-hand chosen topics; he often
interrupts the interviewee or the reporter: overlaps are frequent. Each reporter has a ‘slot’ for prepared questions on a given topic; even the interviewee’s answers are not entirely spontaneous: most questions are obvious ones and trigger prepared answers. The interviewee has often been coached before the show. Therefore, in our data, speech is neither entirely spontaneous nor totally planned. It is better described as constrained. These constraints yield numerous disfluencies. Only part of them reveal information about the planning problems of the speaker [5]. The rest of them resorts to the ‘struggle for speech’ between interviewer and interviewee, or between interviewers, even though reporters probably do not “jump in” at random locations [6].
For each show we have both the audio data and press-oriented transcripts. These press-oriented transcripts (TPress henceforth) are intended to be rather close to the audio (as quotations are being extracted from them for other media) while lying somewhere in between written text and exact transcript: they stick to implicit conventions for speech rendering. As a matter of fact most disfluencies and linguistic errors have been discarded or edited. We produced as well an exact audio transcription (TExact) for 10% of the data: all audible phenomena in particular disfluencies (for spontaneous speech modeling studies) and overlapping speech are manually transcribed. We relyed on standard automatic transcripts (TReco) to tune the exact transcripts: it is indeed easy to ‘miss’ some disfluencies and to inconsciously edit them.
The comparison of the TPress, TExact and TReco transcripts allows us to investigate the following questions: what is the overall proportion of DFs observed? Within DFs, what is the repartition between the different types? Is this repartition correlated with sociological features of the speakers or with competition for “foreground” speech? Are the different DF classes more or less error prone? Are they difficult to take into account using conventional word N-grams?
2. Spontaneous speech annotations Spontaneous speech, with its hesitation phenomena, repetition of function words and other false starts, has hosted a great deal of interest from several French teams. Morel & Danon-Boileau [4] who especially studied intonation (in particular that of parentheticals), addressed these “little words” typical of spoken language, which they call “ligators”: e.g. quoi, ben, enfin (“well”), donc, alors (“so”), genre, style (“kind of”).
The GARS, in Aix-en-Provence [2] worked for years on the problems raised by transcribing speech. The choices, which written representations assume, with a grammatical exploitation of spoken corpora in view, are a trade-off between faithfulness and legibility: a transcription in standard orthography is given, without “faking” — no transcription under the morpheme level is foreseen. No punctuation marks are specified since they yield an a priori segmentation into phrases or sentences, which prejudges the analysis. Another project, PFC (Phonologie du Français contemporain) [3], in a

Adda-Decker, Habert, Barras, Adda, Boula de Mareuil & Paroubek
68
socio-phonological framework aiming at covering a vast geographical area, recently started to take prosody into consideration. The objective is to align the spoken data with written texts as easily as possible: hence the choice for an orthographic transcription which includes standard punctuation marks. Background manifestations such as hum are ignored and not transcribed. Hesitations are transcribed by euh, even when it is difficult to distinguish them from the pronunciation of a schwa.
The annotations adopted in our work partially rely on the LDC’s metadata annotation guidelines [7] used for the Rich Transcription evaluations conducted by NIST (http://www.nist.gov/speech/tests/rt/rt2003/). These guidelines aim at producing maximally readable transcripts: “[...] annotators will identify fillers, depods (the deletable portion of an edit disfluency), and SUs (‘semantic units’). Transcripts [...] can be cleaned up for readability; for instance, depods and fillers must be removed and each SU presented as a separate line within the transcripts”. We chose these guidelines because they are consistent with our own objectives and represent the current result of a vast discussion.
SUs are coarsely defined as ‘units within the discourse that function to express a complete thought or idea on the part of the speaker,’ with a pragmatic aim in mind: ‘[...] the goal of SU labelling is to improve transcript readability by creating a transcript in which information is presented in small, structured, coherent chunks rather than long turns or stories.’
Fillers are divided between filler words (FW: like um), discourse markers (DM in the sequel: ‘a word or a phrase that functions primarily as a structuring unit of spoken language’), explicit editing terms (EET: ‘overt statement from the speaker recognizing the existence of disfluency’), asides (AS: ‘the speaker utters a short comment on a new topic then returns to the main topic being discussed’), parentheticals (PA: ‘the remark is on the same topic as the larger utterance’). Edit disfluencies (ED) are divided between repetitions (RP in the sequel), revisions (RV in the sequel), restarts (RS: ‘the corrected portion that replaces the depod modifies its meaning’), and complex disfluencies.
For the annotation of the archive corpus, we decided to follow as much as possible the LDC guidelines and to adapt them to French with some simplifications. We marked PA and AS in the exact transcriptions, but we do not comment on them. We merged RV and RS under the heading RS, as it is not always easy to assess the intended modification of meaning between the depod and what follows it.
3. Corpus and transcriptions 3.1. Corpus and exact transcription In the sequel, each speaker is given an ID (from 1 to 20), followed by letters refering to some of his/her sociological features as shown in the table below. Letters are necessarily one of J or I. If not more specified a speaker is by default a French adult man. There is just one woman among the interviewees. Interviewees are by default politicians.
code meaning #spk code meaning #spk J journalist 9 I interviewee 11 C chairman 1 w woman 1 e English native 1 o elderly 1 r region. accent 1 c Civil society 2 f francophone 2
One of them is an English native speaker, two persons are French native speakers from African francophone countries.
For our study, an exact audio transcription has been produced manually on 10% of the corpus: 2 excerpts of approximately 3 minutes, selected randomly in each show, have been split in SUs and all disfluencies have been explicited and annotated according to the previously detailed guidelines.
The range of words per SU is between 8.6 and 20.8 (median: 12.8, mean: 13.7). Median and mean are greater for interviewees than for journalists (median: 13.9/11.6, mean: 14.9/12.2). Interviewees make longer SUs than journalists.
In order to characterize the speakers according to their disfluencies, Correspondence Analysis (CA) was being used for features DM, RP, RS, FW (see Figure 1). CA provides the best fit, in the least squares sense, relative to the chi-squared distance, to both the speaker points and the disfluencies points. It yields a sequence of orthogonal axes. We show the two first axes. The projection of the points shows no obvious clustering, neither of journalists, nor of interviewees. The first axis opposes dominance of RS (16-Io, 19-If, 20-Ie) to dominance of DM (12-I, 10-Iwc). The second axes contrasts the association of FW and RP (1-JC, 17-Ir, 3-J) to the important use of DM (6-J, 13-I).
Figure 1: Proportions of DFs (FW,RP,RS) in the TExact transcripts for each speaker.
Even though CA provides no clear opposition between journalists and interviewees as such, the balance between RP and RS seems to correspond to different ‘choices’.
02468
1012141618
1-JC 2-J 3-J 4-J 5-J 6-J 7-J 8-J 9-J
10-Iw
c11
-Ic 12-I
13-I
14-I
15-I
16-Io 17
-Ir18
-If19
-If20
-Ie
FW RP RS
Figure 2: Proportions of DFs (FW,RP,RS) in the TExact transcripts for each speaker.
As shown in Figure 2, within DFs, for 13 speakers (7
journalists: 1-JC, 3-J, 4-J, 5-J, 7-J, 8-J 9-J; 6 interviewees: 10-Iwc, 12-I, 13-I, 14-I, 17-Ir, 18-If), the proportion of RP is greater than the proportion of RS. 5 interviewees (11-Ic, 15-I, 16-Io, 18-lf, 20-Ie) and one journalist (6-J) show the opposite situation. The use of RP is clearly dominant within journalists, possibly because of the difficulties journalists meet while trying to interrupt interviewees. On the opposite, RS have the

Proceedings of DiSS’03, Disfluency in Spontaneous Speech Workshop, 5–8 September 2003, Göteborg University, Sweden. Robert Eklund (ed.), Gothenburg Papers in Theoretical Linguistics 90, ISSN 0349–1021, pp. 67–70.
69
first role for half of the interviewees: in spite of journalists interviewees seem to have real opportunities in tuning their words.
3.2. Automatic audio transcription The audio corpus has been transcribed using the LIMSI speech recognizer resulting in the TReco transcripts.
3.2.1. Recognition system description
The LIMSI standard broadcast news transcription system for French [1], was used for transcribing the one-hour subset of the corpus. The acoustic models were trained on about 100 hours of French broadcast news data; they consist in context-dependent models of 33 French phonemes, plus 3 generic models for silence, filler words and breath noises. The standard language model (LM) is an interpolation of 4-gram back off language models trained on different data sets. Three different sources were used: press-oriented transcriptions of various broadcast shows (48M words), exact transcriptions of broadcast news (BN) data, mainly radio shows (0.95 M words) and newspapers texts (311M words). The lexicon contains 65k words, chosen for optimizing the coverage of broadcast news development data (very different in date and source from the archive corpus). The pronunciations are derived from grapheme-to-phoneme rules and manually checked. The system runs at about 10 times real-time on a standard PC.
Using the press-quality transcriptions provided with the corpus (about 580k words), an “informed” LM was designed by interpolation with the standard n-gram LM; the lexicon contains only the 26k most frequent words from the standard sources, together with all the 19k words contained in the press-oriented transcripts, resulting in a 30k words lexicon.
3.2.2. Standard and informed recognition results Performance of automatic speech transcription was evaluated using NIST sclite tool, by counting the percentage of word differences relative to the TExact transcription. Disfluencies were tagged in the reference as optional words, i.e. no error was counted if a filled pause or a word involved in a repetition or a revision was ignored by the system. Most of the overlapping speech, where the speakers clearly speak in synchrony, has been discarded from the evaluation. However a non-negligible amount of overlapping speech remains as speech on background noise: the 2nd speaker uttered just one or two words over a sentence of the 1st speaker (back-channel), the background speech is not intelligible. These speech on speech background noise segments are the most error prone.
Using the standard French transcription system, an average word error rate of 24% could be measured. The relatively high word error rate on this data should be compared with two other figures: our standard word error rate on other BN data in French (about 20%) and our current result on the last RT03 evaluation on American English broadcast news data (11.7%). From this comparison, we may expect improvements from:
1. working on French specificities: recently, we have focussed our work on American English. If similar efforts are done for French [1], we may expect to reduce the gap between French and English systems to less than 5%. In particular, we may increase the quantity of data used to build the language model: we currently use 5 times less data for BN French than for BN English.
2. developing specific acoustic models for the archive corpus, to reduce the gap with our standard word error rate in French BN.
In a second transcription experiment, the informed LM was used: the resulting word error rate is 14.5%, a 40% relative reduction as compared to the 24% obtained with the standard system. One purpose of our experiments with informed transcriptions was to test if accurate transcriptions can be obtained starting with fast-to-produce press-quality transcriptions. The high word error rate shows that simply feeding the press-quality transcripts into the language model is not enough for producing high quality transcripts. By contrast, it also shows errors, which mainly stem from acoustic problems. Per-speaker results are given Table 1 and show a large inter-speaker variability.
Table 1: word error rates of the standard system (WER-S) and informed system (WER-I).
Journalist
WER-S WER-I Interviewee WER-S WER-I
1-CJ 33.0 22.7 10-Iwc 24.2 14.2 2-J 19.7 13.3 11-Ic 25.5 13.6 3-J 16.9 10.1 12-I 17.4 4.9 4-J 23.7 11.2 13-I 19.8 10.3 5-J 25.8 17.1 14-I 16.6 8.6 6-J 18.8 6.0 15-I 16.7 9.8 7-J 36.2 23.8 16-Io 35.0 21.2 8-J 24.6 23.8 17-Ir 27.8 16.7 9-J 14.0 3.0 18-If 28.4 15.5
19-If 32.7 24.4 All (I+J) 24.0 14.5 20-Ie 28.7 22.5
4. Comparison of manual transcripts The press-oriented transcripts are fairly close to the audio data. To get an idea of the differences between both TPress and TExact versions, sclite is used again, with, as a reference, the TExact version where all disfluencies have been filtered out. Word difference rate amounts to 9%. Disfluencies are obviously not the only reason of differences between the two versions.
4.1. TExact vs TPress: deletions, insertions substitutions
A more detailed study of differences between both versions showed the following:
Deletions other than disfluencies occur and are mainly due to omitted parentheticals, asides or DM sequences. Example:
oui mais je pense qu’aujourd’hui si vous voulez l’économie du monde a commencé à changer dans les années soixante.
In press transcripts overlapping speech is considered as two consecutive flows whenever possible: this generates a significant part of word insertions and highlights the problem of overlapping speech in this kind of data. Other more French specific phenomena entail insertions: reductions like “y a”, “c’est pas”, which correspond to the effectively produced speech, are transcribed in correct written French as “il y a”, “ce n’est pas”. As this kind of reductions appear (as in other languages), on the most frequent word sequences, their global impact on insertion rates is significant.
Substitutions are also often due to reduction phenomena: the pronounced word “ça” (Engl. “it”, reduced form) is most often transcribed using its canonical form “cela” . Other reasons are verb tense or mode (voulais vs voudrais), gender (nous l’avons établi vs nous les avons établis), interrogative forms (est-ce qu’on doit vs doit-on), numbers (un milliard huit vs. un virgule huit milliards). Very few differences are due to human errors (e.g. date of an historical event).
4.2. Typology of observed disfluencies
In the following we consider the 3 main disfluency types: filler words (FW), repetitions (RP) and restarts (RS) including revisions here. The FW class contains a single element euh.

Adda-Decker, Habert, Barras, Adda, Boula de Mareuil & Paroubek
70
The major part of RPs are of the simplest form: two consecutive monosyllabic words. Good candidates for repetitions are articles, pronouns, prepositions, adverbs. The most observed items are: le, de, un, à, et, qui, que, les, très, pas. Of course more complex repetition structures are observed ( beaucoup de, beaucoup de ; peut-être alors peut-être ; et et et et et et le plus et le plus …), but they account only for a low percentage of repetitions.
The RS class is the most heterogeneous one. Revisions can simply be due to an anticipated erroneous form or gender determination (pour le pour l’événement), which needs correction. Beyond this simple category, any phrase can be revised or restarted and no synthetic overview can be given.
About 8% of the TExact words are in the three FW, RP or RS classes (with 2.5, 3.2, 2.3% of the words respectively).
In addition 6.3% of the words correspond to discourse markers (DM). DMs are not really disfluencies, but specific events of spontaneous speech. Their role is more or less to introduce speech or to glue speech sequences together. They seem particularly useful in the struggle for speech situation. A limited number of words are generally observed as DM: alors, et, mais, donc, bon, voilà, oui, hein. However each speaker may have its own preferences and habits of DMs.
5. Disfluencies and recognition errors The TReco form of the corpus contains 9400 words (approx. 1 hour of speech) and 1365 errors (14.5%). We are interested in measuring the contribution of disfluencies to the overall error rate. Table 2 shows the major error sources, starting with the introduced disfluency classes and the discourse marker class. Beyond disfluencies and spontaneous speech specific words like DMs, pronunciation reductions (PR) on common words and word sequences are a serious source of errors. Whereas disfluencies alone account for about 12.5% of the observed errors, DMs produce 8.2% of errors. A more important contribution of 25.1% comes from the reduced pronunciations.
Table 2: Number of errors observed in different classes. The first classes correspond to disfluencies. The last class focuses on pronunciation reductions, fast and badly articulated speech (PR). For each class its contribution to the overall error rate is given.
Class #errors % overall error FW+RP+RS 171 12.5% FW+RP+RS+DM 283 20.7% PR 347 25.1%
It is also interesting to know whether disfluencies are significantly more error prone than other words.
Table 3: Within class and overall error rates for the main DF classes. Class #errors/#total % errors in class %overall error FW 45 / 231 19.5% 3.0% RP 46 / 300 15.3% 3.0% RS 80 / 217 36.9% 6.5% DM 112 / 593 19.3% 8.2%
Table 3 shows for each class the number of errors and the
total number of words observed in this class and the corresponding within class error rate.
Whereas all the class-specific error rates are above the average corpus error rate, some classes are seen to be more difficult to handle than others: 36.9% errors for RS vs. 15.3% for RP. Significant differences are also observed between speakers. Among the interviewees a non-native person produces half of all the errors on repetitions (23 errors). By just excluding this speaker from the counts, the repetition error
rate falls to 8.8%, which is far less than the average error rate (13.8% without the non-native speaker).
6. Discussion In this study we have compared different types of audio transcripts with, as objectives, a better modeling of spontaneous speech specifities and their appropriate rendering in audio transcripts.
The comparison of press-oriented and exact audio transcripts showed that disfluencies explain only about half of the observed differences. Discourse markers, parentheticals, rewording and overlapping speech transcriptions are the main factors for the additional differences. Whereas many disfluencies may simply be filtered out in the transcriptions, others carry some information: hesitations may indicate syntactic disfluencies and keeping some marks increase readability and acceptability.
Concerning automatic transcription we investigated the impact of disfluencies on word error rates. With 8% of the corpus the disfluency words explain 12% of the overall error rate. This shows that disfluencies have no major effect on neighboring speech segments. Restarts are the most error prone, with a 36.9% within class error rate. However dealing with restart phenomena on a simple lexical level appears to be insufficient: including morpho-syntactic information may provide a useful modeling level here. If overlapping speech is held out, reduced pronunciations appear to be the major error source: results may be significantly improved if these phenomena are better taken into account, in both the pronunciation dictionary and the acoustic models.
Another aim concerns the automatic production of exact audio transcipts using press-oriented corpora. Even if improvements are still in reach using standard developments, more spontaneous speech specific research seems required given the relatively high error rates observed with informed language models.
7. References [1] Adda-Decker, Martine, Gilles Adda, Jean-Luc Gauvain &
Lori Lamel. 1999. Large vocabulary speech recognition in French , Proc. IEEE ICASSP’99, I, Phoenix, AZ, March 1999, pp. 45–48.
[2] Blanche-Benveniste, Claire. 1990. Le français parlé, études grammaticales, Éditions du CNRS, Paris.
[3] Delais-Roussarie, Elisabeth & Jacques Durand. 2003. Corpus et variation en phonologie du français:méthodes et analyses, Presses Universitaires du Mirail, Toulouse.
[4] Morel, Marie Annick & Laurent Danon-Boileau. 1998. Grammaire de l’intonation. L’exemple du francais, Éditions Ophrys, Paris.
[5] Plauché, Madelaine & Elizabeth Shriberg. 1999. Data-Driven Subclassification of Disfluent Repetitions Based on Prosodic Features. Proc. International Congress of Phonetic Sciences, San Francisco, vol. 2, pp. 1513–1516.
[6] Shriberg, Elizabeth, Andreas Stolcke & Don Baron. 2001. Can Prosody Aid the Automatic Processing of Multi-Party Meetings? Proc. ISCA Tutorial and Research Workshop on Prosody in Speech Recognition and Understanding, Red Bank, NJ, pp. 39–146.
[7] Strassel, Stephanie. 2003. Simple Metadata Annotation Specification Version 5.0 – May 14, 2003. http://www.ldc.upenn.edu/Projects/MDE

Session V: Repeats and Repairs in Different Languages

72

Proceedings of DiSS’03, Disfluency in Spontaneous Speech Workshop, 5–8 September 2003, Göteborg University, Sweden. Robert Eklund (ed.), Gothenburg Papers in Theoretical Linguistics 90, ISSN 0349–1021, pp. 73–76.
73
Repairs and repetitions in spontaneous Mandarin
Shu-Chuan Tseng
Institute of Linguistics, Academia Sinica, Taipei
Abstract 246 overt repairs, 653 complete repetitions and 475 partial repetitions were identified in an annotated corpus of spontaneous Mandarin conversations. On the basis of the data, this paper investigates Mandarin repairs and repetitions by segmenting them into the reparandum part, the editing part and the reparans part and by tagging them using the CKIP automatic word segmentation and tagging system. Results of the use of editing term, the distribution of part of speech and syllables in the reparandum are presented. Semantic differences and similarity in the discrepancy of tagging results of the reparandum and the reparans are also discussed.
1. Introduction Speech repairs and repetitions are typical phenomena in disfluent spontaneous speech. Different from other disfluency such as pauses and fillers, repairs and repetitions have relatively complex context in syntax, semantics and lexis. Psycholinguistic studies and conversational analyses have long noticed repairs and repetitions in narratives and conversations ([5] and [7]). Repairs and repetitions show regular syntactic patterns and reflect pragmatic functions. From another point of view, most of the established speech recognition and parsing systems nowadays can successfully process well-formed and well-spoken utterances, for instance clearly read speech. But for the rest of “ill-formed” and “not properly spoken” utterances found in spontaneous conversation, no satisfying solutions have been found yet. All these fragmentary, incomplete or sometimes even regarded as incorrect speech stretches are by no means marginal phenomena. A number of empirical studies on repairs, pauses and repetitions for different languages have been done in the past years on different spoken corpora such as the Map Task Corpus, the TRAIN Corpus and the Switchboard Corpus ([1, 3, 4, 8]).
This paper studies features of repairs and repetitions produced in spontaneous Mandarin on the basis of eight hours of conversations. In modern Mandarin, the number of monosyllabic words decreases, whereas di- and trisyllabic words clearly increase. Our spoken data supports this notion; the average number of syllables per word is 1.65. The process of making new words in Mandarin involves compounding and abbreviating; lexical components of words may come from different syntactic categories first and new words are then created by abbreviating the compounded words. For instance, in the partial repetition gao1 [pause] gao1yi1, gao1 means high and gao1yi1 means the first year in senior high school, an abbreviated form of gao1zhong1 (senior high school) yi1nian2ji2 (the first year). The former gao1 is an adjective independently, where the latter gao1 in “gao1yi1” is a morphemic component of a noun. The position in which the process of compounding and abbreviating takes place could be possibly the position where the restart of a repetition may prefer. Mandarin examples are written in Pinyin and the numerals following each syllable are lexical tones. 1, 2, 3, 4, and 5 represent high flat, rising, contour, falling tones and the neutral tone.
2. Repairs and word repetitions in spontaneous Mandarin
The corpus data we used in this paper is extracted from the Mandarin Conversational Dialogue Corpus. This section will briefly introduce the corpus. Then the criteria of identifying repairs and word repetitions will be clarified and some statistics of the data will be presented and discussed.
2.1. Mandarin Conversational Dialogue Corpus Mandarin Conversational Dialogue Corpus was collected from 2000 to 2001 at the Institute of Linguistics in Academia Sinica. It consists of 30 digitized conversational dialogues of a total length of 27 hours. 60 subjects were randomly chosen from Taipei, the capital city of Taiwan. Eight conversations spoken by nine female and seven male speakers were annotated by adopting a taxonomy scheme of four groups of spontaneous speech phenomena: 1) disfluency, 2) sociolinguistic phenomena, 3) particular vocalisation and 4) unintelligible and non-speech sounds. Disfluency includes for instance prosodic discontinuity such as breaks and word fragments, constructions not in agreement with the standard grammatical rules such as sentence fragments and speech repairs. Sociolinguistic phenomena are code switching (use of a foreign language or a Chinese dialect) and invented new words. Phonemic assimilations, syllable reductions, lengthening are some of the typical particular pronunciations in rapid and casual speech. Five human annotators transcribed the conversations in Chinese characters and in Pinyin, aided by interface “TransList” [9] to insert annotation tags and convert the horizontally arranged transcripts to a character-based and vertically presented database in Access format. Eventually, 53,225 annotation tags were used to annotate totally 140,579 transcribed syllables.
2.2. Repairs Repairs must have a clearly identifiable reparandum item and a reparans item. That is to say, only disfluent sequences in which we can clearly identify what is to be corrected and what is the correction are annotated as repairs. In Example 1, jin4kou3 is the reparandum and chu1kou3 is the reparans. Also found in this example, EN (In our transcription system, all discourse particles are written in capital Latin letters) is an editing term, often used to bridge the gap between the reparandum and the reparans.
Example 1: overt repair shi4 jin4kou3 EN chu1kou3 ma1? is import [discourse export [interrogative particle] particle] Do you import uhn export products?
2.3. Repetitions Repetitions in Mandarin are in a lot of cases perfectly legal syntactic constructions to put emphasis on particular components or to express subtle semantic nuance, for instance da4da4de5 and da4de5 both mean big, but having different discourse implications (da4da4de5 has an emphasized effect).

Tseng
74
Repetitions in this context are disfluent repetitions, which cannot be explained or justified by Mandarin grammatical rules. Complete repetitions are defined as fully repeated word sequences, for instance the repetition of the disyllabic word yin1wei4 (because) in Example 2. Quite often, complete repetitions repeat words more than once. In partial repetitions only part of a word sequence is repeated, e.g. kan4dian4 kan4dian4shi4 (watch tele- watch television) in Example 3.
Example 2: complete repetition yin1wei4 yin1wei4 ta1 you3 jian4shen1 zhong1xin1 because because it has fitness center Because because it has a fitness center.
Example 3: partial repetition kan4 dian4 kan4 dian4shi4 zui4jin4 you3 watch electricity watch television recently has xin1 dian4ying3 new movie On the tele- on the television, there is a new film recently.
2.4. Repair and Repetition Sequences We introduce the concept of a quasi-phrase to help the annotators dealing with spontaneous Mandarin. As mentioned above, due to some essential features of Mandarin such as free word order, no morphological markings at the surface level and the large number of variations of compounding and abbreviating words, it is hard to have a clear cut between morphology and syntax in Mandarin. A quasi-phrase is a part of a sentence representing a piece of information which itself is an undividable unit for listeners irrespective of syntactic structures. This is a more or less subjective judgment, but it is necessary, because there are no clear morphological markings helping the annotators dividing sentences consistently. Besides, the human annotators have detailed discussions prior to the annotations, so that the perceptual judgment should be to a certain extent consistent.
Chu1kou3 (export) is a verb. Cong2tou2dao4jiao3 (from head to feet, meaning every part of the body) is an idiom. They are both quasi-phrases, although they contain different numbers of morphemes and they involve different syntactic levels of a sentence. A repair sequence is annotated from the site of the nearest quasi-phrasal boundary before the reparandum item to the site of the nearest quasi-phrasal boundary after the reparans item. Example1 is a simple case; the annotated repair sequence is jin4kou3ENchu1kou3. Similarly a repetition sequence is annotated from the site of the nearest quasi-phrasal boundary before the to-be-repeated item to the site of the nearest quasi-phrasal boundary after the repeated item. So in the idiom case above, cong2tou2dao4 cong2tou2dao4jiao3 is annotated as a partial repetition sequence.
2.5. Data Annotated data is summarized in Table 1. One thing to note is that the discourse marker dui4 (right) is often repeated in spoken discourse. Sometimes it functions as a hesitation marker; sometimes it is repeated several times to win time for the speaker. They are used very often and it will influence the interpretation of the statistics. So we excluded all repetitions of dui4 in the statistics. Furthermore, in Table 1 the number of the to-be-repeated syllables is not equivalent to that of the repeated syllables, because some of the occurrences were repeated more than once.
Table 1 shows that complete repetitions are the least likely to be accompanied by an editing term because of the smallest
ratio of occurrences with an editing term over occurrences without an editing term. This result illustrates that complete repetitions, where no new information is produced, do not need an editing phase that much as partial repetitions and repairs do, where new information is uttered after the to-be-repeated and –repaired parts. It is surprising that more than the half (54%) of all occurrences of repairs and repetitions were identified together with an editing term. The editing terms counted here include perceivable paralinguistic sounds such as breathing, inhalation or short break. It will be interesting to examine the acoustic measurements of these editing terms to determine whether occurrences of repairs and repetitions are actually identifiable in terms of their acoustic features [6].
Table 1: Repairs and Repetitions in Mandarin Conversations.
Repair Complete Repetition
Partial Repetition
Total
Occurrences 246 (17.9%)
653 (47.5%)
475 (34.6%)
1374 (100%)
Occurrences with an Editing Term
157 (63.82%)
298 (45.64%)
287 (60.42%)
742 (54%)
With / Without an Editing Term
17.6:10 8.4:10 15.3:10
Reparandum Syll. Involved in Repair
663
Reparans Syll. Involved in Repair
1039
To-be-Repeated Syll. Involved in Repetition
1043 680
Repeated Syll. Involved in Repetition
1149 1590
Total Involved Syll. 1702 2192 2270 6164 Moreover, within identified repair and partial repetition sequences the number of syllables involved in the reparandum part is about the half of the number of syllables involved in the reparans part. This implies that after correcting/repeating the actual reparandum item a continuation directing the utterance to a meaningful unit is needed. In our definition of repair and repetition sequences, a meaningful unit is a quasi-phrase. We will examine the length of quasi-phrases in later analysis.
3. Tagging experiment In order to obtain consistent tagging results, we adopted the automatic word segmentation system developed for modern Mandarin by CKIP at Academia Sinica [2] to tag all identified occurrences of repair and repetition sequences by their part of speech (POS). Manual corrections of tags were necessary after the automatic tagging system was executed due to two main reasons. The tagging program was originally designed for written Mandarin, so a certain number of usages in spontaneous speech utterances are actually unknown words to the program. And our data of repairs and repetitions for parsing are themselves irregularities relative to standard Mandarin grammars, so some of the wrong parsing results were to be expected.
3.1. Tagged Results After human annotators marked up all sequences of repairs, complete and partial repetitions, they furthermore segmented the sequences into three phases: the reparandum part, the editing part and the reparans part. The reparandum part contains all items before the editing term and the reparans part contains all items after the editing term. The editing term forms the editing part itself. The data was then processed by the CKIP tagging program. Because the sequences are quasi-phrases, they cannot directly reflect what exactly is repeated or

Proceedings of DiSS’03, Disfluency in Spontaneous Speech Workshop, 5–8 September 2003, Göteborg University, Sweden. Robert Eklund (ed.), Gothenburg Papers in Theoretical Linguistics 90, ISSN 0349–1021, pp. 73–76.
75
repaired. Thus, we narrowed down the items to the first tagged POS of the reparandum item and the reparans item. The reason why only the first POS was considered is that the majority of repetitions involve only one POS (details cf. Section 4.2.). Table 2 shows the numbers of occurrence and the percentage of 1) the first reparandum and reparans POS in complete repetitions, 2) the first reparandum POS in partial repetitions, 3) the first reparans POS in partial repetitions, 4) the first reparandum POS in repairs, and 5) the first reparans POS in repairs. The POS categories are based on the CKIP tagging system. Predicative adjectives are included in the verb category. Foreign words and unrecognizable words are put into the category “foreign word”. In the case of repairs, word fragments are tagged by “foreign word”, too.
Table 2: POS in Repetitions and Repairs. Completely
Repeated POS
Partially Repeated
POS
Partially Repeated
Target POS
Repaired POS
RepairedTarget POS
Verb 102 (15.62%)
126 (26.53%)
101 (21.26%)
61 (24.80%)
66 (26.83%)
Preposition 82 (12.56%)
30 (6.32%)
21 (4.42%)
13 (5.28%)
9 (3.66%)
Noun 274 (41.96%)
189 (39.79%)
226 (47.58%)
107 (43.50%)
117 (47.56%)
Adverbial 152 (23.28%)
113 (23.79%)
106 (22.32%)
48 (19.51%)
49 (19.92%)
Conjunction 41 (6.28%)
15 (3.16%)
19 (4.00%)
6 (2.44%)
3 (1.22%)
Non-Predicative Adjective
2 (0.31%)
2 (0.42%)
2 (0.42%)
0 (0%)
0 (0%)
Foreign Word
0 (0%)
0 (0%)
0 (0%)
11 (4.47%)
2 (0.81%)
The first to note in Table 2 is that the distribution of the repeated POS in complete repetitions is very different from the other four cases. Prepositions are more often identified in complete repetitions (12.56%) than in partial repetitions (6.32% and 4.42% respectively) and repairs (5.28% and 3.66% respectively). Verbs are much less often completely repeated (15.62%) than partially repeated (26.53% and 21.26% respectively) and repaired (24.8% and 26.83%). However, partial repetitions and repairs show a symmetric similarity across reparandum and reparans.
Excluding complete repetitions, nouns are the most frequently repeated and repaired POS, then verbs and adverbials. More specifically, nominal, verbal and adverbial reparans makes up about 90% of the overall occurrences. Prepositions, conjunctions and non-predicative adjectives together are less than 10%. We notice that a number of the reparandum in repetitions and repairs are tagged differently from the reparans. This can reflect the discrepancy of the syntactic structure in disfluency and the morphological preferences of restarting in repetitions and repairs. In Section 5, we will look into the discrepancy by taking nouns as an example.
3.2. Number of POS Figure 1 shows the numbers of POS involved in the reparandum part in repairs, complete and partial repetitions. It looks like the distributions of complete and partial repetitions are quite similar, where between 70% and 80% of both types of repetitions involve only one POS. While repetitions are uttered, no matter complete or partial, preferably only one POS is repeated. But of what morphological length is the preferred POS? We will look into the syllabic length of POS
in the next section. Here we also observed that repetitions of a length of more than two POS are fairly rare (less than 5% of the overall repetitions).
0
10
20
30
40
50
60
70
80
90
6 5 4 3 2 1No. of POS in Reparandum
Perc
enta
ge
Repairs
Complete Repetitions
Partial Repetitions
Figure 1: Number of POS of Reparandum Part in Repairs, Complete and Partial Repetitions.
For repairs, the curve shown in Figure 1 is different from those for repetitions. The reparandum part is most frequently composed of one and two POS, 35.7% and 36.2% respectively. As Figure 1 illustrates, up to six POS can be included in the reparandum part according to the definition of a quasi-phrase. Presumed that the reparandum part of repetitions and repairs needs to be a completely meaningful information unit, not in an arbitrary way, our data supports the notion that repetitions prefer short quasi-phrases and repairs prefer long quasi-phrases.
3.3. Number of Syllable A single part of speech may include more than one morpheme. In Mandarin, morphemes are not as clearly defined as syllables, because a syllable is represented by a character in the written form. Thus, we examined the data from the perspective of syllabic size. And interestingly, the distribution is quite different from that of the POS size, as illustrated in Figure 2.
0
10
20
30
40
50
60
70
12 11 10 9 8 7 6 5 4 3 2 1No. of Syllables in Reparandum
Perc
enta
ge
repairs
complete repetitions
partial repetitions
Figure 2: Number of Syllables of Reparandum Part in Repairs, Complete and Partial Repetitions.
Figure 2 shows that di- and monosyllabic words, though tagged by one POS, are completely repeated equally frequently. The number of the most frequently repeated syllables in partial repetitions is the same as that of the POS, which is one. For repairs, the number of monosyllabic reparandum items drops, whereas the number of trisyllabic reparandum items increases. On the whole, Figure 2 demonstrates that the preferred positions to restart a repetition or a repair is after one repeated syllable in the case of partial repetitions; after one and two repeated syllables in the case of complete repetitions; after two and three repaired syllables in the case of repairs.

Tseng
76
4. Repetitions and repairs in nouns Nouns are the most often repeated and repaired content word POS, so we present some preliminary observations regarding the POS discrepancy of the reparandum POS and the reparans POS.
4.1. Differently Tagged Reparandum of Nominal Reparans In partial repetitions, among those reparans characters tagged as nouns (226 occurrences), only 168 of their reparandum characters were tagged as nouns (30 verbs, 9 prepositions and 17 adverbials etc.). Similarly, 97 of 117 targeting nouns in repairs were tagged as nouns (10 verbs, 3 prepositions and 3 adverbials etc.). In the examples given below, the POS tags in brackets are CKIP tags. Due to the lack of space, for further details please refer to [2].
Repeated Repeated Target hua4(VC) hua4mian4(Na) to draw picture ai4(VL) ai4xin1(Na) to love kindness, sympathy jiang1(P) jianglai2(Nd) with, by means of future na4(Dk) na4(Nep) ge1(Nf) therefore, then that CLASSIFIER
Repaired Repaired Target kong1(VHC) fei1xing2yuan2(Na) to be empty pilot dao4(P) xia4(Ncd) (arriving) at the lower side ben3lai2(D) yi3qian2(Nd) originally the past
Syllables are written in characters in Mandarin, so almost every character can be assigned a POS, because they all have certain meaning. Therefore, to detect repair or repetition patterns by means of syntactic categories may not be the ideal solution. As shown by our results, a mess of POS pattern is the unavoidable consequence. 4.2. Semantic Relation of Nominal Repairs Examining the reparandum items which were also tagged as nominal ones, we obtained some interesting clues of semantic relations of the reparandum and the reparans. On the basis of our data on nominal repairs, the following semantic relations can be preliminarily found: 1) substitutions of hyponyms: the reparans specifies the reparandum, 2) substitutions of similar denotations: the reparans and the reparandum share similar information domain and 3) substitutions of antonyms: the reparandum and the reparans are antonyms.
na4bian1 (Ncd) mei3guo2(Nc) over there USA (sub. of hyponyms) kao3shi4 (Na) lian2kao3 (Na) exam entrance exam (sub. of hyponyms) sui4 (Nf) nian2 (Nf) years-old years (sub. of shared deno.) jiao4shou4 (Na) bo2shi4 (Na) professor PhD (sub. of shared deno.) zi1xun4(Na) dian4nao3(Na) information computer (sub. of shared deno.) xian4shi2 (Na) shi4shi2 (Na) reality fact (sub. of shared deno.) she4hui4ke1(Na) zi4ran2ke1(Na) social sciences natural sciences (sub. of antonyms) zheng4fu3 (Na) ren2ming2 (Na) government people (sub. of antonyms)
The examples above show that semantic relations can be empirically observed by means of real spoken data of repairs. It is especially interesting in the case of Mandarin because of the wide variety of morphological compounding of words.
5. Conclusion This paper presented numeral preliminary results on Mandarin repairs and repetitions. Editing terms were found very frequently used in Mandarin repairs and repetitions. POS and syllabic features reflect different respects of the production. Disyllabic words are frequently repeated, although they are often tagged as one POS. The role POS plays in the production of repairs and repetitions does not imply that POS is also important in the detection. The discrepancy of tagged POS in the reparandum and the reparans due to the character-morpheme-syllable relation in Mandarin seems to prohibit detecting approaches based on POS patterns. Semantic differences of nominal reparandum and reparans were found in the data. It is an interesting issue worth further works, which can shed light on semantic relationships of Mandarin from a different point of view.
6. Acknowledgements Part of the study presented in this paper has been supported by the National Science Council (91-2411-H-001-043) and the Ministry of Education (91-E-FA-06-4-4) of Taiwan.
7. References [1] Carletta, Jean, Richard Caley & Stephen Isard. 1993. A
Collection of Self-Repairs from the Map Task Corpus. Tech. Rep. University of Edinburgh.
[2] Chen, Keh-Jiann, Chu-Ren Huang, Li-Ping Chang & H.-L. Hsu. 1996. ACADEMIA SINICA BALANCED CORPUS: Design Methodology for Balanced Corpora. PACLIC 11, pp. 167–176.
[3] Den, Yasuharu & Herbert Clark. 2000. Word Repetitions in Japanese Spontaneous Speech. Proc. ICSLP’00, 16–20 October 2000, Beijing, China, vol. 1, pp. 58–61.
[4] Heeman, Peter & Allen James. 1999. Speech Repairs, Intonational Phrases and Discourse Markers: Modelling Speakers’ Utterances in Spoken Dialogue. Computational Linguistics, vol. 25, no. 4, pp. 527–571.
[5] Levelt, Willem J. M. 1983. Monitoring and Self-Repair in Speech. Cognition, vol. 14. pp. 41-104.
[6] Nakatani Christine & Julia Hirschberg. 1994. A Corpus-Based Study of Repair Cues in Spontaneous Speech. Journal of the Acoustical Society of America, vol. 95. pp. 1603–1616.
[7] Schegloff, Emanuel, Gail Jefferson & Harvey Sacks. 1977. The Preference of Self-Correction in the Organization of Repairs in Conversation. Language, vol. 53, no. 2, pp. 361–382.
[8] Shriberg, Elizabeth. 1996. Disfluencies in SWITCHBOARD. Proc. of the International Conference on Spoken Language Processing, 3–6 October, 1996, Philadelphia, Pennsylvania, USA, addendum, pp. 11–14.
[9] Tseng, Shu-Chuan & Yi-Fen Liu. 2002. Annotation Manual of Mandarin Conversational Dialogue Corpus. Tech. Rep. CKIP-02-01. Academia Sinica.

Proceedings of DiSS’03, Disfluency in Spontaneous Speech Workshop, 5–8 September 2003, Göteborg University, Sweden. Robert Eklund (ed.), Gothenburg Papers in Theoretical Linguistics 90, ISSN 0349–1021, pp. 77–80.
77
Word fragments and repeats in spontaneous spoken French
Sandrine Henry† & Berthille Pallaud‡
† Équipe DELIC, Université de Provence, Aix-en-Provence, France ‡ CNRS, UMR 6057 Langage et Parole, Université de Provence, Aix-en-Provence, France
Abstract This paper presents the results of a study conducted on the interaction of two disfluencies: repeats and word fragments. It is based on 150 repeated word fragments (e.g., “on le re- re- revendique encore une fois”) extracted from a one-million-word corpus of spoken French. Word fragments such as: “notre métier spé- spécifique”, are, like repeats (e.g., “vous avez évalué le le montant des dégâts”), very frequent events in spoken language: on average, there is 1 word fragment every 50 seconds,1 1 repeat every 17 seconds. Speakers and listeners alike are generally unaware of these phenomena as if they were not part of the communication process. They seldom trigger a metalinguistic reaction from the speaker and are even more rarely acknowledged by the listener. These phenomena have sometimes been interpreted as ‘errors’ in the communication process, like slips of the tongue [6]. Word fragments and repeats encompass different categories of phenomena, and this enables us to define them as an heterogeneous group ruled by different types of constraints and mechanisms.2 This analysis rests on the following criteria: structural aspects of the repeat, types of word fragments, morphological and syntactic aspects. Analyses of these repeated of identical word fragments from two different angles – that of the repeats and then that of the word fragments – confirm the relevance of the distinction between these two types of disfluencies.
1. Introduction Disfluencies have often been considered as traces of the elaboration that encumber the oral utterance and have therefore long been ignored by the linguists. We contend that these performance phenomena are to be taken seriously into account for they reflect the production processes at work and can thus shed light on the planning of constituents.
1.1. Repeats Actually, previous studies [2, 3] have shown that these repeats, in French as in English, mostly concern function words. We have found that function words are five times more likely to be repeated than lexical words. And, among repeated words, 91.3% are function words whereas only 8.7% are lexical words. We have also classified the repeated function words according to word classes: 41.5% are determiners, 35.5% pronouns and 13.0% prepositions. As for lexical words, most of them (52%) are adverbs, then adjectives (25.0%) and verbs (11.0%).
Repeats tend to appear at major syntactic boundaries, as in the following example:
(1) “le le terrain commençait à glisser beaucoup”
1 With an average rate of 200 words/minute. 2 Recent neurophysiological studies [5] on detection of repeats and
false starts – i.e., syntactic interruptions – in utterances have shown that detection of these two types of disfluencies goes along with different event-related potentials (ERPs).
In (1), the determiner le is both at the left edge of the noun phrase le terrain and at the left edge of the clause le terrain commençait à glisser beaucoup. As repeats chiefly affect function words, it seems quite logical that repeats should occur at the beginning of phrases. However, a recent study [3] of le, a word that shows a multiple class membership (i.e. belongs to more than one word class: ‘le’ can be a determiner or a pronoun), has shown that only 1.33% of le as accusative pronoun are repeated vs 5.64% of le as determiner. It means that syntactic constraints – not to the morphological status of the repeated element – are responible for this tendency of repeats to appear at the beginning of phrases.
The structure of a repeat can be defined as follows:
“le {R0} le {R1} terrain commençait à glisser beaucoup”
repeat = R0 (‘repeatable element’) + R1 (‘repeated element(s)’) [2]
If we consider the larger description of disfluency phenomena provided by Shriberg [9], our term ‘repeatable’ (R0) corresponds to reparandum (RM) and ‘repeated’ (R1) to repair (RR). Shriberg has described an intermediate region in between the two, called interregnum (IM), that can remain empty (consecutive repeats, as can be seen in Figure 1) or can contain other disfluencies (for instance a filled pause), or editing terms [4], or again parenthetical clauses.
Interruption Point R 0 ↓ R1
le le terrain commençait à glisser beaucoup
↔ ↔ ↔
RM IM RR Figure 1: Structure of a repeat. We have retained three structural criteria as regards repeats: The number of elements composing the ‘repeatable’. The presence or absence of material in the interregnum. The span of the repeat, i.e. the number of ‘repeated
elements’. We have thus divided them into two categories: simple repeats (e.g. le le) or multiple repeats (e.g. le le le). Simple repeats are by far the most frequent (93.8%): in only 5.3% of cases words are repeated twice; and the rate becomes very low for three times or more (0.9%).
We have focused on the latter criterion, for we thought the first two were irrelevant to our point: first of all, repeated word fragments are rarely composed of more than one element,3 and secondly, our aim was to focus on the interaction of two disfluencies, and we thus could not refer to other types of combinations (such as with silent or filled pauses). That would demand another study.
3 17 occurrences for repeated word fragments composed of two
elements and only 1 composed of three elements in our one-million-word corpus.

Henry & Pallaud
78
1.2. Word fragments Three basic observations were made in previous studies [7, 8]: Contrary to repeats, word fragments mostly affect lexical
words (70%), as in the rather typical example that follows: “c’est vrai que c’est pas b- beau d’associer les deux choses”. If we examine the distribution of word fragments according to the type of constituent, we note that more than half of them (50.2%) are in the Object position, 35.1% in the Verb Position and 12.7% in the Subject position.
When the speaker produces a word fragment, he momentarily suspends his speech. What is at stake is to find out if the element that allows him to resume speaking belongs to the same syntactic locus as the word fragment.
Word fragments are either listing phenomena (corresponding to a lexical search on a given syntactic locus) or elements that trigger a syntactic breach (in cases where the context following the word fragment does not belong to the same syntactic unit). There are three categories of word fragments: - completed word fragments: the word fragment is
completed on the same syntactic locus: “c’est vrai que c’est pas b- beau d’associer les deux choses”
- modified word fragments: the fragment is not completed but replaced by another word belonging to the same syntactic unit: “on va + attaquer l’autre b- morceau l’autre moitié du dos”
- word fragments left incomplete: the word fragment does not initiate a listing phenomenon [1] and what follows belongs to another syntactic locus. It corresponds to what Levelt [4] calls a ‘fresh start’: “alors je vais euh faire un petite diver- on va diverger là pour expliquer ça euh au début”
Out of 948 word fragments, 59.6% were completed word fragments, 21.9% incomplete and 18.5% modified.
1.3. Repeated word fragments Repeated word fragments form a minor sub-category among ‘stumbling’ events: “il vaut mieux être ho- ho- honnête vis-à-vis des gens” “mais no- no- no- notre base politique veut le que ouais que la que le peuple ait souvent son + son mot à dire”
2. Method 2.1. Corpus Our corpus is composed of 1,000,382 words,1 it corresponds to 283 situations of spontaneous speech and involves 794 different speakers.
2.2. Extracting the data First of all we selected the repeats, word fragments and repeated word fragments using a program (script in Perl language, application under Linux). We then proceeded to a manual sifting of the data.
Repeated word fragments are only a minor phenomenon among word fragments and repeats. On a total of 6 094 word fragments, we found only 150 repeated word fragments, that is to say 2.4%. On a total of 16 135 (repeated word fragments included), only 0.93% are repeated word fragments. 1 It is composed for the main part of Corpaix, (a numerical corpus
that took shape thanks to the work of the GARS team in the past 25 years, currently DELIC). All the transcriptions conform to the conventions established by the GARS.
The frequency of repeated word fragments is low: 1.5 every 10,000 words that is – with an average rate of 200 words/minute – one repeated word fragment every 33 minutes.
3. Results
3.1. Structural aspects of repeats Validating our hypothesis of an interaction between the two phenomena, we first notice that, much in the same way as repeated words [3], simple repeats of word fragments are the most common occurrences (84.7%), way before double (14.0%) and triple (1.3%). The likelihood of having a repeat grows smaller as the number of repeated elements rises, and this applies to the two phenomena.
3.2. Repeated word fragments and categories of word fragments
The type of word fragment is another criterion in our analysis, what is at stake here is to find out whether repeats of word fragments abide – or not – by the rules of word fragments. Table 1: Numbers and percentages of repeated word fragments according to the type of word fragment.
Repeated word fragments
Word fragments
Completed 123 (82.0%) 565 (59.6%) Modified 7 (4.7%) 175(18.5%) Incomplete 20 (13.3%) 208 (21.9%) ΣΣ 150 (100.0%) 948 (100.0%) As with previous results on word fragments, we note important differences in the frequencies of the three categories of repeated word fragments (completed, revised or incomplete). Among them, completed word fragments are by far the most frequent. Repeated word fragments are rarely incomplete or modified.2 This difference in distribution between word fragments alone and repeated word fragments shows that the repeat phenomenon affects word fragments and confirms our hypothesis of the word fragment phenomenon as a ‘stumbling’ event which is the site of a lexical search. The repeat sustains this search for, in most cases, the truncated word is completed. This interdependence of repeats and word fragments suggests that these repeated word fragments work like filled pauses, and from a wider perspective, like a filler: the speaker suspends his speech – there is thus a ‘stagnation’ on the syntagmatic axis – and then he goes on.
3.3. Repeated word fragments and word classes An analysis of repeats of word fragments according to their morphological status has also been conducted. The results appear in tables 2, 3 and 4. Table 2: Distribution of repeated word fragments according to the morphological status of the repeatable element. Repeated word
fragments Repeated
words Word
fragments Function words 100 (66.7%) 14 594 (91.3%) 151 (30.1%) Lexical words 46 (30.7%) 1 391 (8.7%) 350 (69.9%) Misc. 4 (2.6%) – – ΣΣ 150 (100%) 15985 (100%) 501 (100%)
Function words account for most cases of repeated word fragments. That is also the case for repeats, with an even 2 Repeats of incomplete word fragments compared to completed +
modified: chi-square = 5.83 ; d.d.l. = 1 ; p < .02. Repeats of modified word fragments compared to completed +
incomplete: chi-square = 17.81 ; d.d.l. = 1 ; p < .001.

Proceedings of DiSS’03, Disfluency in Spontaneous Speech Workshop, 5–8 September 2003, Göteborg University, Sweden. Robert Eklund (ed.), Gothenburg Papers in Theoretical Linguistics 90, ISSN 0349–1021, pp. 77–80.
79
higher rate (90%). The two phenomena tend to follow more or less the same trends, but there are considerable differences in the distribution of lexical words: they amount to only 8.7% of repeats, vs. 30.7% of repeated word fragments. Lexical words are thus more sensitive to an interaction between the repeat and the word fragment, and the corollary of this is that function words – massively present in repeats – are much less involved when the word fragment phenomenon is added to the repeat. The repeat phenomenon inverts the distribution of function and lexical words for word fragments. Table 3: Repeated word fragments: a distribution according to function word class.
Repeated word fragments
Repeated words
Pronouns 61 (61%) 5 181 (35.5%) Determiners 22 (22%) 6 057 (41.5%) Prepositions and complex prepositions
9 (9%) 1 897 (13.0%)
Conjunctions (subordinators and coordinators)
5 (5%) 1 021 (7.0%)
Auxiliaries 3 (3%) 146 (1.0%) Misc. – 292 (2.0%) ΣΣ 100 (100%) 14 594 (100%) Two grammatical categories are prevalent in both types of repeats: pronouns and determiners. The table above nevertheless shows a significant1 difference in the distribution of these grammatical categories according to the type of repeat involved: in the case of word fragments, determiners outweigh pronouns (61% vs 22%), whereas the latter prevail in the case of repeats (41.5% vs 35.5%). Table 4: Distribution of repeated lexical word fragments according to lexical word class. Repeated word
fragments Repeated words
Verbs 26 (56.5%) 153 (11.0%) Adverbs 11 (23.9%) 723 (52.0%) Nouns 6 (13.1%) 167 (12.0%) Adjectives 3 (6.5%) 348 (25.0%) ΣΣ 46 (100%) 1 391 (100%) There are few repeats of lexical word fragments: actually, out of the 150 word fragments in our corpus, 46 of them are lexical words. Hence, the following figures are but trends. These repeats chiefly involve verbs (56.5%), whereas repeats of lexical words are mostly adverbs (52.0%). Moreover, if we set aside the noun class which shows identical proportions whatever the type of repeat, we notice that adjectives, which were one fourth of the repeated lexical words, only represent a very small part of the repeated lexical word fragments. There is thus a strong co-relation between the type of repeat and the lexical words.
3.4. Syntactic analysis of repeated word fragments The distribution of repeated word fragments according to the type of word fragment on the one hand and to syntactic constituents (Subject, Verb, Object) on the other enables us to examine if these two variables are interacting.
1 Chi-square = 24.86 ; d.d.l. = 1 ; p < .001.
Table 5: Distribution of repeated word fragments according to the type of word fragment and to syntactic constituents. Completed Modified and
Incomplete ΣΣ
Subject 65 (52.8%) 6 (22.2%) 71 (47.3%) Verb 17 (13.8%) 9 (33.3%) 26 (17.3%) Object 32 (26.0%) 8 (29.6%) 40 (26.7%) Misc. 9 (7.3%) 4 (14.8%) 13 (8.7%) ΣΣ 123 (100%) 27 (100%) 150 (100%) Concerning completed repeated word fragments, no interaction was observed between the type of word fragment and the syntactic constituents. Actually, completed word fragments in a Subject position remain prevalent (52.8%), followed by word fragments in Object position (26%) and Verb position (13.8%). This distribution is equivalent to the one observed in all repeated word fragments (chi-square = 0.93 ; d.d.l. = 2 ; N.S.).
As concerns the category of modified and incomplete word fragments, the distribution according to the type of constituent seems to occur at random, all types of constituents appear more or less equally in repeats. However, the scarcity of this type of data does not allow us to form any definite judgement in that case.
Table 6: Distribution of word fragments according to the type of word fragment and to syntactic constituents. Completed Modified and
Incomplete ΣΣ
Subject 92 (15.4%) 29 (8.2%) 121(12.7%) Verb 188 (31.3%) 147 (41.5%) 335 (35.1%) Object 306 (51.0%) 173 (48.9%) 479 (50.2%) Misc. 14 (2.3%) 5 (1.4%) 19 (2.0%) ΣΣ 600 (100%) 354 (100%) 954 (100%) This interaction does not show for word fragments [7]: their distribution depends on the syntactic locus, not on their category. Half the word fragments are in Object position, 35% on the Verb position and only 13% in the Subject position.
Therefore, on the syntactical level, there seems to be an interaction between repeats and word fragments only as regards modified and incomplete word fragments. Table 7: Distribution of repeated word fragments according to the type of word class and the syntactic constituent. Repeats of
lexical word fragments
Repeats of function word
fragments
ΣΣ
Subject 3 (6.5%) 68 (68.0%) 71 (48.7%) Verb 21 (45.7%) 5 (5.0%) 26 (17.8%) Object 16 (34.8%) 23 (23.0%) 39 (26.7%) Misc. 6 (13.0%) 4 (4.0%) 10 (6.8%) ΣΣ 46 (100%) 100 (100%) 146 (100%) The table above proves the state of dependency between the morphological status of repeated word fragments and their syntactic situation.
In the case of repeated lexical word fragments, repeats mainly occur on the Verb (45.7%) and Object (34.8%) positions. When it comes down to function word fragments, the distribution is completely different: 5% for the Verb position and 23% for the Object. In the Subject position, repeats of function word fragments and repeats of lexical word fragments follow completely opposite trends: 68% for the first, 6.5% for the last.

Henry & Pallaud
80
4. Discussion This study brings to light the co-relation that exists between repeats and word fragments.
As far as the span of the repeat is concerned, the same trends emerge for repeats of words and repeats of word fragments. If we consider the type of word fragment involved in repeat, the prevalence of completed word fragments proves that the repeat phenomenon fuels the lexical search the word fragment expresses.
On the morphological level, repeated word fragments abide by the constraints of repeat phenomena, not by those of word fragments, for repeats of word fragments involve function words for the main part. According to the class of the function words, there is a significant difference between repeats of word fragments and repeats.
On the syntactic level, the distribution of repeated word fragments turns out to depend on the constituent (Subject, Object or Verb). Word fragments in Subject position represent only 12.7% of word fragments, whereas they account for half of the repeated word fragments. The repeat further also accentuates the trend towards completion in Subject positions (52.8% for repeated word fragments vs 15.4% for fragments words). On the contrary, the distribution of repeated word fragments seems to occur at random when the word fragment is modified or incomplete, which is not the case when the word fragment is not repeated. Repeats of lexical word fragments especially occur in Verb (45.7%) or Object (34.8%) positions, whereas repeats of function words mostly appear in Subject position (68%).
5. Acknowledgements Thanks to Jean Véronis, Sandrine Henry’s dissertation tutor for his comments and reviews, and to Daniel Hirst. We are both indebted to Sophie Girardin for the translation into English.
6. References [1] Blanche-Benveniste, Claire. 1987. Syntaxe, choix de
lexique et lieux de bafouillage. DRLAV, vol. 36–37, pp. 123–157.
[2] Candéa, Maria. 2000. Contribution à l’étude des pauses silencieuses et des phénomènes dits “d’hésitation” en français oral spontané. Étude sur un corpus de récits en classe de français. Thèse d’État, Université Paris III (Sorbonne Nouvelle).
[3] Henry, Sandrine. 2002. Étude des répétitions en français parlé spontané pour les technologies de la parole. Actes de la 6ème Rencontre des Étudiants Chercheurs en Informatique pour le Traitement Automatique des Langues (RECITAL’02), 24–27 June 2002, Nancy, France : ATALA, pp. 467–476.
[4] Levelt, Willem J. M. 1989. Speaking. From Intention to Articulation. Cambridge, Massachusetts: MIT Press.
[5] McAllister, Jan, Cato-Symonds, Susan & Blake Johnson. 2001. Listerners’ ERP Responses to False Starts and Repetitions in Spontaneous Speech. Proc. DISS’01, 29–31 August 2001, Edinburgh, Scotland, pp. 65–68.
[6] Pallaud, Berthille. 2001. Les lapsus: des pierres dans le champ linguistisque. In M. Arrivé & C. Normand (eds.), Linguistique et psychanalyse. Colloque de Cerisy-la-Salle, 1–8 September 1998, IN Presse, pp. 47–66.
[7] Pallaud, Berthille. 2002. Les amorces de mots comme faits autonymiques en langage oral. RSFP, vol. 17, pp. 79–102.
[8] Pallaud, Berthille. 2003. Achoppements dans les énoncés de français oral et sujets syntaxiques. In J.M. Merle (ed.), Le Sujet, Paris: Éditions Ophrys, Faits de Langue, pp. 91–04.
[9] Shriberg, Elizabeth. 1994. Preliminaries to a theory of speech disfluencies. Ph.D. thesis, University of Berkeley, California.
Proceedings of DiSS’03, Disfluency in Spontaneous Speech Workshop, 5–8 September 2003, Göteborg University, Sweden. Robert Eklund (ed.), Gothenburg Papers in Theoretical Linguistics 90, ISSN 0349–1021, pp. 81–84.
81
Phonetic correlates of self-repair involving word repetition in German spontaneous speech
Ramona Benkenstein & Adrian P. Simpson
University of Jena, Jena, Germany
Abstract A phonetic description of self-initiated self-repair sequences involving the repetition of words in German spontaneous speech is presented. Data are drawn from the Kiel Corpus of Spontaneous Speech. The description is primarily impressionistic auditory, but it also employs acoustic records to verify and objectify the impressionistic findings. A number of different patterns around cut-off are identified. The comparison of phonetic differences between reparandum and repair tokens is used to argue that repair sequences can also provide an interesting insight into the way in which fluent stretches of spontaneous speech are phonetically organized.
1. Introduction One of the most important aspects of disfluency in spontaneous speech is the phonetic management of self-initiated self-repair. Previous work has investigated aspects of pitch, tempo, duration, coarticulation, and phonatory patterns prior to cut-off, in pausal behaviour between reparandum and repair, and at the beginning of the repair proper (e.g. [11, 12, 14, 15]).
From an analytical point of view, self-repairs involving word-repetition represent a set of repair sequences of particular interest as they allow for a direct analysis of the phonatory and articulatory differences in the production of identical lexical material in reparandum and repair by the same speaker.
While the detailed phonetic analysis of repair sequences involving word repetition is required to give us a better understanding of the strategies speakers employ when dealing with repair, this subset of disfluencies is also of more general phonetic interest. Analyses of phonetic change in lexical material across different styles or at different tempos is generally elicited using spoken prose with speakers being instructed to speak faster or slower. Leaving aside the problems of the elicitation procedures themselves, it is always difficult to know the extent to which the results of a study done on prose can be transferred to spontaneous talk. An insufficient number of tokens of the same lexical word or phrase in comparable contexts is undoubtedly one of the main reasons why phoneticians have only slowly been drawn away from the controlled elicitation of prose to the analysis of spontaneous speech.
Word repetition in repair sequences seems to provide an interesting place for solving some of these problems. Within a very short time a speaker repeats the same lexical material, but does so using different phonetics. Although some of the differences can be accounted for in terms of the typical variance inherent in such a complex system, we must assume that any auditory impressionistic differences we can observe and verify acoustically are due to immediate or longer domain contextual differences. Regularities arising from the differences observed in a number of cases can begin to provide an account of what the different factors are.
This study describes some of the detailed impressionistic and acoustic phonetic patterns observed in word-repetition repair sequences in German, and attempts to account for the patterns we describe.
We will show, in common with work carried out on English and Dutch cited above, that speakers of German exhibit a number of articulatory and phonatory patterns which, even in the absence of explicit editing terms, serve to demarcate the reparandum and indicate the initiation of the repair proper. Furthermore, by looking in detail at individual repair sequences we will begin to substantiate the claim made above that the subset of repairs containing word repetition is of more general phonetic interest.
Besides being a contribution to the analysis of repair in general, it is also a contribution to repair in German, something which has received relatively little attention ([9, 13]).
2. Method
2.1. Data collection Volumes 1–3 of the Kiel Corpus of Spontaneous Speech [5] contain mixed and same sex dialogues from 18 female and 24 male speakers with a North German linguistic background. The data were collected as part of the Verbmobil project [6].
One condition imposed on the recordings was maximum channel and turn separation. Channel separation was achieved by seating subjects in separate sound-treated rooms and having them communicate via headsets. Turn separation was achieved using a technical setup akin to an intercom. Subjects could only speak and be heard by their partner when pressing a button. This simultaneously blocked the channel for the other speaker. The state of the buttons was indicated to each of the speakers by means of lights.
The dialogues were elicited using an appointment-making scenario in which speakers had to arrange fictitious meetings and trips over a two month period. Each speaker had a sheet covering the same two month period, but with different days shaded in. Speakers were instructed not to make appointments on the shaded days on their calendar sheets. Six of these dialogues, one for each two month frame, were collected from each speaker group. One further dialogue was elicited using a more immediate time frame (the following seven days). This was designed to get speakers using deictic time expressions.
Although the dialogues are spontaneous the technical imposition of turn separation makes them unsuitable for the investigation of many aspects of conversational interaction. However, the dialogues are a rich source of the phenomenon under investigation here, namely self-initiated self-repair.
Turns from the dialogues will be referred to using the same nomenclature as they have in the Kiel Corpus, e.g. g125a004, which refers to the fourth turn from the fifth task in dialogue g12.

Benkenstein & Simpson
82
2.2. Segmentation and annotation The dialogues were transliterated and manually segmented and phonetically annotated. A number of disfluencies were marked in the transliteration, including pauses, editing terms (“uh(m)”), truncations, etc. The reparanda of overt self-repair sequences involving repetition with and without insertions were parenthesized in the transliteration.
For a complete description of the elicitation, transliteration, segmentation and annotation of the dialogues in the Kiel Corpus see Kohler et al. [8].
2.3. Analysis The dialogues contain some 400 self-initiated, overt self-repair sequences. Of these a subset involving clear cases of word and phrase fragment repetition was selected for impressionistic phonetic and acoustic analysis. Typical examples of such repair sequences are given in Table 1.
Table 1: Examples of self-initiated self-repairs involving word repetition from the corpus. Example Gloss ja das ist- das ist ideal ‘yes that’s- that’s ideal’ auf- auf fünf Tage ‘to- to five days’ nehmen wir doch den- gleich den ersten ‘let’s take the- ADV the
first’
In the impressionistic analysis the same word sequences in reparandum and repair were compared. Attention was paid to a number of segmental and suprasegmental parameters. Our principle assumption, following Kelly & Local [7], is that if we can hear a phonetic difference we must assume that it has relevance for speaker and hearer.1
The main objective of the acoustic analysis was to illustrate and attempt to quantify the impressionistic auditory observations.
3. Description of repair 3.1. General Table 2 shows the distribution of the items at cut-off across different word classes. The most significant finding which emerges from the table is that in the vast majortiy of the cases the item directly adjacent to cuf-off in the subset of repair sequences analyzed here belongs to the class of function words,2 i.e. prepositions, articles, pronouns, modals. This seems to be at odds with the findings from English, in studies such as Fox & Jasperson [3], who present many examples with content words at cut-off.
Table 2: Frequency of occurrence of items at cut-off across different word classes. Functional Words N Content Words N
Preposition 26 Noun 2 Pronoun 11 Adjective and Numeral 3 Article 10 Verb 1 Auxiliary 2 Adverb 6 Conjunction 2 ∑ 51 12
1 Phoneticians have long been aware of our acuteness to relative
detail: “The difference between vowel sounds separately pronounced, will sometimes appear so slight that the ear may be perplexed to discriminate them; but in the compounds of speech the minutest shades of elementary variety create unmistakeable distinctions.” [1].
2 At least from a traditional perspective, since most contemporary theories treat some prepositions as content words.
The first observation one can make when comparing the shape of the same word material in repair and reparandum appears at first to be almost trivial: phonetic identity in reparandum and repair is seldom.
In comparing the phonetic shapes of the same item in reparandum and repair we observed differences in vowel quality, vocalic quality (secondary resonance) of consonantal portions, tension, voice quality, length of vocalic and consonantal strictures, tempo and pitch. Furthermore, there were also differences in the ways in which the cut-off and subsequent pause was produced.
The differences observed in repetitions of the same item in reparandum and repair can be summarized in general terms as follows. The phonetic shape of the repair item is appropriate to the phonetics of the stretch it is situated in; the phonetic shapes of item in the reparandum, are not consistent with the same stretch as that in the repair and hence are different.
This leaves open two interpretations for the phonetics of the reparandum:
a) they are appropriate to a stretch which was not completed, but was broken off when an error had been detected or a change in plan occurred.
b) they are designed to initiate the repair sequence and project the cut-off itself.
3.2. Repair types On the basis of a bundle of phonetic features located primarily around the location of the cut-off we make a tentative grouping into three different types of repair sequence, the first two sharing many of features found in different pause types by Local & Kelly [12].
The first, most common, type can loosely be described as lax. The item at cut-off and in particular the final vocalic or consonantal portion is long, there may be a drop in pitch, voicing is breathy, and the glottis opens into the subsequent pause, which may contain an audible inbreath. Friction occurring at cut-off, although longer, is often laxer than the corresponding portion in the repair token. Acoustically, the laxer friction in the reparandum token is lower in intensity, the spectrum more diffuse. Articulatorily, this could be due to a wider stricture of close approximation. Interestingly, increased nasality was not a feature found at cut-off. In fact, the vocalic portion preceding a nasal at cut-off (e.g. article den) was generally found to be less nasalized than the vocalic portion of the corresponding item in the reparandum. This was also the case when there was little durational difference between the vocalic portions. [Example: g072a008, das ist- (P) das ist leider].
In the second type, which can loosely be described as tense, the cut-off was initiated with glottal closure, possibly accompanied by creak.3 Glottal closure was maintained for the duration of the subsequent pause. There was no pitch drop. Minimally, if there was no pause following cut-off, creak could accompany the final portion of the reparandum item before the subsequent start of the repair item. The reparandum item at cut-off could be longer. There were no noticeable tension differences between corresponding fricatives in reparandum and repair items. This type of repair seems to be similar to Local & Kelly’s [12] turning holding pauses in English. [Example: g375a002, die- die Zeit] 3 Glottalization element at cut-off in the same data set is described
acoustically by Kohler et al. [9].

Proceedings of DiSS’03, Disfluency in Spontaneous Speech Workshop, 5–8 September 2003, Göteborg University, Sweden. Robert Eklund (ed.), Gothenburg Papers in Theoretical Linguistics 90, ISSN 0349–1021, pp. 81–84.
83
In the third type, the repair proper followed directly on from the reparandum without there being any break or change in phonation, or pitch. The reparandum item could be longer. [Example: g376a006, der- der]
In an attempt to find a systematic qualitative differences between the vowel qualities of the reparandum and repair tokens, such as centralization, F2 at vowel midpoint for a number of front vowel categories was estimated. It was hypothesized that if the vowel tokens of the reparandum were consistently more centralized, F2 should be lower. As can clearly be seen from Figure 1 this was not the case. We will offer a possible account for this in the next section.
Figure 1: Difference between F2 of reparandum and F2 of repair as a function of the F2 of reparandum for front vowels.
3.3. Observations on individual repair sequences Figure 2 contains the spectrogram of a portion from a repair sequence containing repetition of the definite article den. From an impressionistic point of view the token in the reparandum has a slightly fronter vocalic portion, the vocalic quality of the plosive release is clearer.
Figure 2: Repeated tokens of the definite article den, from the repair sequence den- den Wochenplan. Arrows at A and B are placed during plosive release and at the first period of the vocalic portion. [Ref: g215a004]
These auditory differences can also be seen in the acoustic representation. Two horizontal lines intersecting the frequency axis at 2 kHz and 2.5 kHz facilitate a comparison of the positions of F2 and F3 during plosive release, and during the subsequent vocalic portion. As we can see, both F2 and F3 in the reparandum token are higher than in the repair token.
The backer quality of the repair token is consistent with the phonetic shape of the initial stressed syllable [vɔ χ] of the following noun. Notice, however, that the qualitative differences between these two tokens cannot be accounted for in terms of undershoot arising from duration differences. While the final nasal in the reparandum is longer, the vocalic portions are almost identical in duration.
An example of a two-word repetition is shown in Figure 3. As in the previous example, the two das ist tokens exhibit subtle phonetic differences which are compatible with the repair token harmonizing with the initial syllable of the following adjective ideal. Noticeable auditory differences between the two tokens are the relative openness of the vocalic portion in the reparandum das, a more central vocalic portion in ist together with a darker vocalic quality of the final alveolar friction.
Figure 3: Repeated tokens of the fragment das ist from the repair sequence das ist- das ist ideal. Arrows at A and B are centred on the vocalic portions of das and ist. Formant track visibility has been enhanced by using a LPC spectrogram (order: 30, window: 10 ms). [Ref: g117a007].
Of the auditory differences, it is again the height of F2 which is most apparent in the acoustic record. In Figure 3 a horizontal line has been drawn to coincide with the F2 minimum in the vocalic portion in the reparandum das. The left arrow at B in Figure 3 indicates the centre of the vocalic portion in the repair das, and, as we can see, F2 is greater than the F2 minimum of the reparandum das throughout.
Differences in the shape of the formant tracks in diphthongs have typically been related to temporal differences, (e.g. [4]). Repairs containing repeated items with diphthongs indicate that additional factors need to be considered when determining diphthongal quality. The correlate of coda r in many varieties of German is a central vowel of variable height between mid and half-open. This gives rise to a range of diphthongal vowel qualities. Figure 4 contains repetition of the prepositional phrase bei mir with the pronoun mir at cut-off. Comparison of the diphthongs (at A and B) reveal interesting auditory and acoustic differences.
Figure 4: Portion of the repair sequence bei mir- ginge bei mir. The diphthongal portion of the repeated pronoun mir is at A and B. The vertical block indicates a deleted part of the pause in the repair. [Reference: g421a001]
1000 1250 1500 1750 2000 2250 2500-400
-300
-200
-100
0
100
200
300
F2 in the reparandum [Hz]
F2(r
epar
andu
m)-
F2(r
epai
r) [H
z]

Benkenstein & Simpson
84
Auditorily, the diphthong of the reparandum token (A) begins more centralized and ends more open than the repair token (B). From an acoustic point of view, differences in the duration of the mir tokens is attributable solely to the longer initial nasal of the repair item; the vowels themselves have approximately the same duration of 280 ms. The qualitatively closer end to the repair token, visible in the higher F2 and lower F1 might be expected as a local coarticulatory effect due to the close vowel in im which directly follows. The more open end of the reparandum, in its turn, can be seen as appropriate to the cut-off context. However, the differences in the formant tracks are not restricted to the ‘ends’ alone. In the repair token F2 remains high for at least 100 ms before beginning its fall, at least twice as long as it does in the repair token.
We can propose position in repair sequence or stress (the repair token is stressed) to account for these differences, but interestingly these clear audible and acoustically visible differences cannot be attributed to duration. Indeed, one possibility for the different patterns is that these pronoun tokens are durationally similar for different reasons. While in the stressed repair item it is the correlate of the vocalic nucleus which is long, in the reparandum it is the correlate of the coda r, appropriate to its pre-cut-off position, which is longer. In sum, this gives rise to similar durational, but quite different formant patterns.
4. Discussion In the previous section we have looked at some of auditory and acoustic phonetic detail that can be observed in a subset of self-repairs involving the repetition of words and phrase fragments. The phonetic detail which can be observed throughout such repair sequences is revealing for the way speakers handle this type of disfluency. In phonetic terms, it is possible in many cases to identify that a speaker is producing phonetics appropriate to an upcoming cut-off [15]. Such information is crucial to our understanding of the cognitive processes which underlie the detection and management of repair ([2, 10]).
However, we have also seen that word repetition across repair sequences can offer us a way of looking at how speakers phonetically organize ‘normal’ stretches of utterance in spontaneous talk. The subtle patterns we have described suggest that coarticulation is long-domain, rather than the local phenomenon, restricted to adjacent segments, which it is often treated as.
5. References [1] Bell, Alexander M. 1881. Sounds and Their Relations.
Salem, Massachusetts: Burbank. [2] Blackmer, Elizabeth R. & Janet L. Mitton. 1991.
Theories of monitoring and the timing of repairs in spontaneous speech. Cognition, vol. 39, pp. 173–194.
[3] Fox, Barbara A. & Robert Jasperson. 1995. A syntactic exploration of repair in English conversation. In: Philip W. Davis (ed.), Alternative linguistics. Descriptive and theoretical modes. Amsterdam/Philadelphia: John Benjamins, pp. 77–134.
[4] Gay, Thomas. 1968. Effect of speaking rate on diphthong formant movements. JASA, vol. 44, pp. 1570–1573.
[5] IPDS 1995–97. The Kiel Corpus of Spontaneous Speech, vols. 1–3. Kiel: Institut für Phonetik und digitale Sprachverarbeitung.
[6] Karger, Reinhard & Wolfgang Wahlster. 1995. Verbmobil Handbuch – Version 3. Verbmobil Technisches Dokument 35. Saarbrücken: DFKI.
[7] Kelly, John & John K. Local. 1989. Doing Phonology. Manchester: Manchester University Press.
[8] Kohler, Klaus J., Matthias Pätzold & Adrian P. Simpson. 1995. From scenario to segment: the controlled elicitation, transcription, segmentation and labelling of spontaneous speech. AIPUK 29. Kiel: IPDS.
[9] Kohler, Klaus J., Benno Peters & Thomas Wesener. 2001. Interruption glottalization in German spontaneous speech. Proceedings of the ISCA Workshop Disfluency in Spontaneous Speech, August 29–31 2001, Edinburgh, pp. 45–49.
[10] Levelt, Willem J. M. 1989. Speaking: From intention to articulation. Cambridge, Massachussetts: MIT Press.
[11] Levelt, Willem J. M. & Anne Cutler. 1983. Prosodic marking in speech repair. Journal of Semantics, vol. 2, pp. 205–217.
[12] Local, John K. & John Kelly. 1986 Projection and ‘silences’: notes on phonetic detail and conversational structure. Human Studies, vol. 9, pp. 185–204.
[13] Selting, Margret. 1995. Prosodie im Gespräch. Aspekte einer interaktionalen Phonologie der Konversation. Tübingen: Niemeyer.
[14] Shriberg, Elisabeth E. 1994. Preliminaries to a theory of speech disfluencies. Ph.D. thesis, University of California at Berkeley.
[15] Shriberg, Elisabeth E. 2001. To ‘errrr’ is human: ecology and acoustics of speech disfluencies. J. Int. Phon. Assoc., vol. 31, pp. 153–169.

Session VI: Phonology and Prosody

86
Proceedings of DiSS’03, Disfluency in Spontaneous Speech Workshop, 5–8 September 2003, Göteborg University, Sweden. Robert Eklund (ed.), Gothenburg Papers in Theoretical Linguistics 90, ISSN 0349–1021, pp. 87–90.
87
Some strategies in prolonging speech segments in spontaneous Japanese
Yasuharu Den
Faculty of Letters, Chiba University, Japan
Abstract In this paper, we investigate segmental prolongation in a corpus of spontaneous Japanese monologues consisting of over 700,000 words. We examine effects on the rate of prolongation of various factors including speech types, the genders of speakers, word classes, word positions in the phrase and in the inter-pausal unit, and the presence of preceding fillers. Based on the empirical findings, we state some strategies in prolonging speech segments used by Japanese speakers.
1. Introduction In spontaneous speech, speakers may prolong their speech segments anywhere in an utterance. They may prolong a filler placed at the beginning of an utterance or the initial phoneme immediately after starting a major constituent. Or, they may prolong a phoneme at a clause final position. Some of them serve as a signal to forthcoming problems in communication. For instance, Den [1] showed that when the first token involved in a word repetition is disrupted in the middle, the phoneme at the disruption point is considerably prolonged, which would inform listeners of speaker’s difficulty in producing the rest of the constituent. Although several researchers focused on the phenomena with limited interests, prolongation in general has not been fully studied so far (for notable exceptions, see [2, 3, 4]).
This paper investigates segmental prolongation in the Corpus of Spontaneous Japanese (CSJ) [6], which is a huge-sized corpus (ca 740,000 words) of spontaneous monologues in Japanese. Watanabe and Den [7] have already reported their analysis on prolongation in the CSJ. They assumed that prolongation, as well as suspension and restart, is a device for speakers to inform listeners of foreseeable troubles in communication. They found that (i) speakers are most likely to prolong a filler before initiating a constituent, next most likely to prolong a vowel within the initial word of it, and less likely to prolong after an initial word, and that (ii) the more complex a constituent is, the more likely speakers are to prolong their speech segments in an initial commitment to it. They, however, analyzed only prolongations in utterance-initial noun phrases and did not look at prolongations at other places or in words of other syntactic classes. The current paper aims at investigating all occurrences of prolongation in the CSJ, without adopting particular hypotheses, to obtain basic facts about the phenomena.
2. Method
2.1. Corpus We analyzed the Corpus of Spontaneous Japanese (CSJ, Monitor Version 2002) [6], that is being developed at the National Language Research Institute as a part of their five-year Spontaneous Speech Project (fiscal years of 1999–2003). It comprises speech, transcripts and morphological analyses of 134 academic presentations and 189 simulated public speech. The former is live recordings of researchers’ presentations in
meetings of several academic societies, while the latter is short speech spoken specifically for the purpose of the data collection by paid non-professional speakers mostly in recording studios. The speakers include both females and males (33 females and 101 males for academic presentations, and 120 females and 69 males for simulated public speech), and their ages range between early thirty and early eighty with the average and the median at mid sixty. Some speakers engaged in more than one session, but we disregard variation within speakers across sessions. The speech data amounts to 70 hours, and the morphological data to 740,000 words excluding fillers. Table 1 shows the summary statistics of the corpus for each combination of speech type and the gender of the speaker. Table 1: Summary statistics of the CSJ.
Academic Simulated Female Male Female Male TToottaall # of sessions 33 101 120 69 323Duration 9.2hrs 26.6hrs 21.4hrs 12.9hrs 70.2hrs# of words 98141 285640 221911 136199 741891# of morae 199034 588032 427084 259335 1473485
2.2. Changes made to the corpus In the transcripts, speech segments are divided into basic units according to the following criteria: a stretch of speech either (i) delimited by silent pauses longer than 200ms or (ii) ending with sentence final elements such as verbs in finite form and final particles [5]. Since there is no indication of whether or not the second criterion could also be applied when the first one was applied, we cannot precisely know whether or not a unit boundary coincides with a syntactic boundary. Thus, we decided to use, for uniformity, inter-pausal units (IPUs) determined by the first criterion only, discarding the boundaries at which only the second criterion was applied, i.e., the boundaries followed by silent pauses shorter than 200ms.
The transcripts also include the information about the boundaries of basic syntactic phrases, i.e., bunsetsu phrases, and occurrences of prolongation. Prolongations of vowels are marked by an <H> tag in the transcripts.1 Although the assignment of <H> tags is based on the transcribers’ intuition, we accepted all of them as instances of prolongations.
For word fragments, which are marked by a <D> tag in the transcripts, <H> tags are never used; that is, for those sounds, long vowels are transcribed using standard orthography. Since they may include instances of prolonged word fragments involved in word repetitions [1], we checked all occurrences of them and substituted long vowels with <H> tags when the intended word was reliably recovered and prolongation could be supposed there.
Fillers such as “eto” and “ano” are treated as genuin words in the morphological analyses of the corpus, but we changed this treatment. We attached fillers to the succeeding words 1 Prolongations of consonants are not marked, but they are rare in
Japanese.

Den
88
regarding their presence as a property of the succeeding words. Thus, fillers per se were never counted as words. For instance, when an IPU begins with “Ee Nihon de-wa” (um in Japan), “Nihon” (Japan) is considered as the initial word with a property of being preceded by a filler.
2.3. Classification The positions of morae in the word were classified into ‘Single’, ‘Initial’, ‘Medial’, or ‘Final’. The class ‘Single’ was used for words consisting of a single mora, i.e., mono-moraic words, and the other classes were used for words consisting of more than one mora. Similarly, the positions of words in the phrase and in the IPU were classified into ‘Single’, ‘Initial’, ‘Medial’, or ‘Final’. Words were classified into content words or function words, in a traditional grammatical sense, or word fragments. They were also classified according to the presence of the preceding disfluent items: `Fillers’ when preceded by one or more fillers, ‘Fillers + Pause’ when preceded by fillers and intervening or following silent pauses, and ‘None’ when preceded by no fillers.
3. Results
3.1. PR rates Table 2 shows the rate of prolongations in the CSJ. Table 2: The rates of prolongations.
Academic Simulated Female Male Female Male TToottaall # of PRs 335 1542 4313 2202 8392% PRs/words 0.34% 0.54% 1.94% 1.62% 1.13%% PRs/morae 0.17% 0.26% 1.01% 0.85% 0.57%
The overall PR rate of 1.13% per word is comparable to the PR rate of 1.27% reported for Swedish [3]. There is, however, an obvious speech type difference. The PR rates are much greater in simulated public speech than in academic presentations both for female and male speakers. This is mainly because academic presentations are pre-planned and sometimes rehearsed, and thus more trouble-free than simulated public speech, which is usually improvisational.
3.2. PR position in the word Table 3 shows a breakdown of prolongations according to their positions in the word.
Table 3: The positions of prolongations in the word.
Academic Simulated Female Male Female Male TToottaall # of Single PRs % per word % per mora
114 0.12% 0.06%
5770.20%0.10%
2738 1.23% 0.64%
10950.80%0.42%
45240.61%0.31%
# of Initial PRs % per word % per mora
17 0.02% 0.01%
630.02%0.01%
159 0.07% 0.04%
990.07%0.04%
3380.05%0.02%
# of Medial PRs % per word % per mora
13 0.01% 0.01%
450.02%0.01%
97 0.04% 0.02%
630.05%0.02%
2180.03%0.01%
# of Final PRs % per word % per mora
191 0.19% 0.10%
8570.30%0.15%
1319 0.59% 0.31%
9450.69%0.36%
33120.45%0.22%
As can be seen, about a half of the prolongations occur in mono-moraic words. Word initial and medial prolongations are rare in general, and the ratio among initial, medial, and final positions is approximately 10–5–85, excluding mono-
moraic words. This ratio is quite different from the 30–20–50 ratio reported for Swedish [2]. These tendencies do not depend on speech type or the gender of the speaker, although the prolongations of mono-moraic words are relatively infrequent in academic presentations compared to simulated public speech. 3.3. Word classes Table 4 shows the rates of prolongations relative to word classes. Table 4: The rates of prolongations relative to word classes.
Content Function Fragment # of words 369189 361986 10716 # of morae 1003479 455971 14035 # of PRs 4116 4211 65 % PRs/words 1.11% 1.16% 0.61% % PRs/morae 0.41% 0.92% 0.46% The distribution is more or less 50-50 between the content and the function word classes. The PR rate per word is also nearly the same between these two classes. The PR rate per mora, however, is much greater in the function word class than in the content word class. This is because function words are in general short, in Japanese typically consisting of a single mora (277829 out of 361986 words, or 76.8%) such as grammatical particle ga, conjunctive particle te, sentence final particle ne, and copula da. The PR rate of word fragments is less than the PR rate of complete words, but it is still considerable.
3.4. Word classes and PR position Table 5 shows a breakdown of Table 4 according to PR positions. Table 5: The positions of prolongations in the word relative to word classes.
Content Function Fragment # of Single PRs % per word
10780.29%
3400 0.94%
46 0.43%
# of Initial PRs % per word
2920.08%
42 0.01%
4 0.04%
# of Medial PRs % per word
2150.06%
3 0.00%
0 0.00%
# of Final PRs % per word
25310.69%
766 0.21%
15 0.14%
As was mentioned above, the majority of the function words are mono-moraic words. The PR rate for this class (Function-Single) is high. Other classes with a high PR rate are the final positions of content words (Content-Final) and word fragments resulting in a single mora (Fragment-Single). The Fragment-Single class is particularly important, since it, together with the Fragment-Final class, comprises prolongations at the disruption point of word cut-off. Interestingly, in the two-thirds (41 out of 61) of the instances of these classes, the prolonged word fragment was followed by a word whose initial part phonetically matches or similar to (e.g., su vs. so)1 the fragment. These can be seen as instances of prolonged word fragments involved in word repetitions [1].
1 The phonetic transcripts in the CSJ are written in Katakana, and
there is no way to describe word cut-off at a consonant. But, si and su at the disruption point are likely to be describing cut-off at a consonant [s], since high vowels like [i] and [u] are usually devoiced between a voiceless consonant and a silence. If this is the case, a word fragment transcribed as su or si phonetically matches the initial so or sa of the following word like “sore (it)” or “san (three)”.

Proceedings of DiSS’03, Disfluency in Spontaneous Speech Workshop, 5–8 September 2003, Göteborg University, Sweden. Robert Eklund (ed.), Gothenburg Papers in Theoretical Linguistics 90, ISSN 0349–1021, pp. 87–90.
89
3.5. Word positions in the phrase Now we turn to the analysis of syntactic factors. First, we calculated PR rates considering word positions in the phrase. The PR rates relative to word positions in the phrase for the content word class and for the function word class are shown in Tables 6 and 7, respectively. Table 6: The rates of prolongations relative to word positions in the phrase for the content word class.
Single-W Initial-W Medial-W Final-W # of words 59974 217603 75103 16509# of morae 162080 631722 172578 37098# of PRs 2298 1448 255 115% PRs/words 3.83% 0.67% 0.34% 0.70%% PRs/morae 1.42% 0.23% 0.15% 0.31% Table 7: The rates of prolongations relative to word positions in the phrase for the function word class.
Single-W Initial-W Medial-W Final-W # of words 3189 8276 141759 208762# of morae 3587 11437 203814 237132# of PRs 89 27 878 3217% PRs/words 2.79% 0.33% 0.62% 1.54%% PRs/morae 2.48% 0.24% 0.43% 1.36% The PR rate is particularly high in the Single-W class, which is a class of words solely comprising a phrase. The PR rate is relatively high in the phrase-final word class. There tendencies apply to both content and function word classes. Next, we make breakdowns of these tables according to PR positions in the word. The results are shown in Tables 8 and 9, respectively. Table 8: The positions of prolongations in the word relative to word positions in the phrase for content word class.
Single-W Initial-W Medial-W Final-W # of Single PRs % per word
981 1.64%
53 0.02%
31 0.04%
130.08%
# of Initial PRs % per word
191 0.32%
88 0.04%
8 0.01%
50.03%
# of Medial PRs % per word
89 0.15%
115 0.05%
8 0.01%
30.02%
# of Final PRs % per word
1037 1.73%
1192 0.55%
208 0.28%
940.57%
Table 9: The positions of prolongations in the word relative to word positions in the phrase for function word class.
Single-W Initial-W Medial-W Final-W # of Single PRs % per word
78 2.45%
19 0.23%
722 0.51%
25811.24%
# of Initial PRs % per word
0 0.00%
2 0.02%
24 0.02%
160.01%
# of Medial PRs % per word
0 0.00%
0 0.00%
2 0.00%
10.00%
# of Final PRs % per word
11 0.34%
6 0.07%
130 0.09%
6190.30%
In general, for mono-moraic words solely comprising a phrase (Single-W-Single), the PR rate is very high. For content words, the PR rate for the word-final position is also high when the word solely comprises a phrase (Single-W-Final), and relatively high when the word is at a phrase boundary (Initial-W-Final/Final-W-Final). Function words consisting of a single mora are frequently prolonged when it appears at a phrase boundary (Final-W-Single). The PR rates for non-word-final positions are very low.
3.6. Word positions in the inter-pausal unit We conducted an analysis similar to the previous section considering word positions in the IPU. The PR rates relative to word positions in the IPU for the content word class and for the function word class are shown in Tables 10 and 11, respectively. Table 10: The rates of prolongations relative to word positions in the inter-pausal unit for the content word class.
Single-W Initial-W Medial-W Final-W # of words 4753 70360 282122 11954# of morae 11921 197310 760698 33550# of PRs 544 1404 1791 377% PRs/words 11.45% 2.00% 0.63% 3.15%% PRs/morae 4.56% 0.71% 0.24% 1.12% Table 11: The rates of prolongations relative to word positions in the inter-pausal unit for the function word class.
Single-W Initial-W Medial-W Final-W # of words 669 6851 289275 65191# of morae 787 8849 365886 80448# of PRs 32 66 2023 2090% PRs/words 4.78% 0.96% 0.70% 3.21%% PRs/morae 4.07% 0.75% 0.55% 2.60% Breakdowns of these tables according to PR positions in the word are shown in Tables 12 and 13, respectively. Table 12: The positions of prolongations in the word relative to word positions in the inter-pausal unit for content word class.
Single-W Initial-W Medial-W Final-W # of Single PRs % per word
3126.56%
603 0.86%
137 0.05%
260.22%
# of Initial PRs % per word
90.19%
86 0.12%
178 0.06%
190.16%
# of Medial PRs % per word
60.13%
60 0.09%
138 0.05%
110.09%
# of Final PRs % per word
2174.57%
655 0.93%
1338 0.47%
3212.69%
Table 13: The positions of prolongations in the word relative to word positions in the inter-pausal unit for function word class.
Single-W Initial-W Medial-W Final-W # of Single PRs % per word
263.89%
58 0.85%
1728 0.60%
15882.44%
# of Initial PRs % per word
00.00%
2 0.03%
25 0.01%
150.02%
# of Medial PRs % per word
00.00%
0 0.00%
2 0.00%
10.00%
# of Final PRs % per word
60.90%
6 0.09%
268 0.09%
4860.75%
We can observe tendencies similar to those observed in Tables 6–9. Besides these tendencies, we can see in Table 12 that the PR rates for mono-moraic words and for the word-final position are relatively high when the word is a content word and appears at the initial position in the IPU (Initial-W-Single/Initial-W-Final).
In Table 12, we can see that for mono-moraic words solely comprising an IPU (Single-W-Single), the PR rate is particularly high. Since we employ IPUs, not syntactic units, for the unit of analysis, this can be interpreted in the following way: When a mono-moraic word at the initial position in an utterance is prolonged, it is usually followed by a pause (hence, by an IPU boundary). A typical example is the prolongation of discourse markers such as de and zya. For

Den
90
example, in the CSJ, there are 288 instances of prolonged de followed by a pause longer than 200ms.
3.7. Preceding fillers Finally, we examine the effect of fillers on PR rates. The PR rates for words with one or more preceding fillers, with preceding fillers plus intervening or following silent pauses, and with no preceding fillers, indicated by `Fillers’, `Fillers + Pause’, and ‘None’ classes, respectively, are shown in Table 14, and its breakdown according to RP positions in the word is shown in Table 15. Table 14: The rates of prolongations relative to preceding disfluent element classes.
None Fillers Fillers+Pause# of words 695966 37490 8435# of morae 1339380 109685 24420# of PRs 7701 537 154% PRs/words 1.11% 1.43% 1.83%% PRs/morae 0.57% 0.49% 0.63% Table 15: The positions of prolongations in the word relative to preceding disfluent item classes.
None Fillers Fillers+Pause# of Single PRs % per word
4474 0.64%
40 0.11%
100.12%
# of Initial PRs % per word
311 0.04%
18 0.05%
90.11%
# of Medial PRs % per word
185 0.03%
26 0.07%
70.08%
# of Final PRs % per word
2731 0.39%
453 1.21%
1281.52%
Table 15 shows that the PR rate becomes higher when the word is preceded by more disfluent items. This tendency is conspicuous in the word-final prolongation as in Table 15. It, however, is not observed for mono-moraic words. When these words are preceded by fillers, the PR rate remarkably decreases. This would suggest that the prolongation of mono-moraic words and the production of fillers are complementary.
4. Discussion Based upon the empirical findings shown in the previous section, we can now state several strategies in prolonging speech segments used by Japanese speakers.
1. From the results of Sections 3.6 and 3.7: Japanese speakers frequently prolong utterance initial, mono-moraic words. These are typically discourse markers such as de and zya, and distribute complementarily with fillers. This usage might have the same function as fillers.
2. From the results of Section 3.6: Japanese speakers sometimes prolong the final vowels of utterance initial content words. These also include discourse markers, but nouns, including demonstrative nouns, are another typical example of this pattern. We conjecture that these nouns serve a topic of an utterance, since demonstrative nouns are often used as anaphoric expressions. This usage might be related to the information structure of the utterance.
3. From the results of Sections 3.5 and 3.6: Japanese speakers sometimes prolong the final vowels of phrase-final content words. These are mainly common nouns, but details are unclear.
4. From the results of Sections 3.5 and 3.6: Japanese speakers often prolong the final vowels of phrase-final function words, especially immediately before a silent pause. Typical examples include conjunctive particle te, politeness marker masu, copula da, and topic particle mo. These would be accounted for from a phonological point of view, i.e., as instances of pre-pausal lengthening.
5. From the results of Section 3.4: Japanese speaker sometimes prolong the vowels, and probably consonants like fricatives, at the disruption point of word fragments. In many cases, the disrupted word is immediately restarted from the beginning, resulting in a word repetition involving prolongation of the word fragments. This could be a signal for speakers to inform listeners of difficulty in producing the rest of the constituent.
6. From the results of Section 3.2: Japanese speakers rarely prolong vowels in the middle of a word. This might be a morphological constraint which is typical of Japanese.
5. Conclusion In this paper, we have investigated segmental prolongation in the Corpus of Spontaneous Japanese, and stated, based upon the empirical findings, some strategies in prolonging speech segments used by Japanese speakers. We are planning to get into details of phonological aspects of prolongation in Japanese and to construct an integrated model of the phenomena taking into account phonological, morphological, and syntactic factors as well as discourse factors.
6. Acknowledgements This research is funded by the CREST/ESP Project of Japan Science and Technology Corporation.
7. References [1] Den, Yasuharu. 2001. Are word repetitions really
intended by the speaker? Proc. ISCA tutorial and research workshop on Disfluency in Spontaneous Speech, Edinburgh, UK, pp. 25–28.
[2] Eklund, Robert. 2000. Crosslinguistic disfluency modeling: A comparative analysis of Swedish and Tok Pisin human–human ATIS dialogues. Proc. ICSLP’00, Beijing, vol. 2, pp. 991–994.
[3] Eklund, Robert. 2002. Prolongations: A dark horse in the disfluency stable. Proc. ISCA tutorial and research workshop on Disfluency in Spontaneous Speech, Edinburgh, UK, pp. 5–8.
[4] Eklund, Robert & Elizabeth E. Shriberg. 1998. Crosslinguistic disfluency modeling: A comparative analysis of Swedish and American English human–human and human–machine dialogues. Proc. ICSLP’98, Sydney, pp. 2631–2634.
[5] Koiso, Hanae. 2001. Transcription criteria for the Corpus of Spontaneous Japanese. Proc. Spontaneous Speech Science and Technology Workshop, Tokyo, pp. 13–20.
[6] Maekawa, Kikuo. 2002. Compilation of the Corpus of Spontaneous Japanese: A status report. Proc. 2nd Spontaneous Speech Science and Technology Workshop, Tokyo, pp. 7–10.
[7] Watanabe, Michiko & Yasuharu Den. 2003. When and why do speakers prolong their speech segments? Proc. 1st JST/CREST International Workshop on Expressive Speech Processing, Kobe, Japan, pp. 71–74.
Proceedings of DiSS’03, Disfluency in Spontaneous Speech Workshop, 5–8 September 2003, Göteborg University, Sweden. Robert Eklund (ed.), Gothenburg Papers in Theoretical Linguistics 90, ISSN 0349–1021, pp. 91–94.
91
Prosodic features of four types of disfluencies
Guergana Savova† & Joan Bachenko‡
† Medical Informatics Research, Mayo Clinic, Rochester, Minnesota, USA ‡ Linguistech Consortium, Oxford, New Jersey, USA
Abstract We present a corpus-based approach for using intonation and duration to detect disfluency sites. The questions we aim to answer are: What are the prosodic cues for each disfluency type? Can predictive models be built to describe the relationship between disfluency types and prosodic cues? Are there correlations between the reparandum onset and offset and the repair onset and offset? Is there a general prosodic strategy? Our findings support four main hypotheses: 1) The Combination Rule: A single prosodic feature does not uniquely identify disfluencies or their types. Rather, it is a combination of several features that signals each type. 2) The Compensatory Rule: If there is an overlap of one prosodic feature, then another cue neutralizes the overlap. 3) The Discourse Type Rule: Prosodic cues for disfluencies vary according to discourse type. 4) The Expanded Reset Rule: Repair onsets are dependent on reparandum onsets and reparandum offsets. The limitation of the current study is the relatively small corpus size. Further testing of our proposed hypotheses is needed.
1. Introduction and background Disfluencies have been studied from different angles – across several languages, domains (human–human and human–computer interaction), degrees of planning (spontaneous vs. read speech), from production or perception point of view, from a theoretical or application-oriented perspective. Our goal is to add to this body of research by reporting results on a corpus of semi-spontaneous, medical dictation speech by investigating basic prosodic characteristics (duration and intonation) of four disfluency types. Prosodic studies of disfluency center on three acoustic features: intonation (fundamental frequency or F0), segment duration and pause duration. Lickley [6] shows in a controlled study that humans recognize a disfluency by the end of the first correct word even before accessing the semantic and syntactic information. Lickley comes to the conclusion that humans use prosodic information to detect disfluent speech. Oviatt et al. [9] propose a comprehensive prosodic model for disfluencies in human-computer interaction, the Computer-Elicited Hyperarticulated Model (CHAM). CHAM predicts that when the overall error rate of the system is low, the correction of the misrecognized word will involve only durational changes. When the overall error rate of the system is high, the prosodic characteristics of the correct word will have durational, articulatory (hyperarticulation), intonational and amplitude changes from its first occurrence. Hindle [2] relies on an abrupt cut-off signal to detect disfluencies and trigger his parser for disfluency correction.
The terminology used in our study follows the Repair Interval Model proposed by Nakatani & Hirschberg [7]. Each repair interval consists of three parts: a reparandum, which is the part to be repaired; a repair site, which provides the “new” material that corrects the reparandum; and the disfluency site, which contains any silences and filled pauses that may occur between the reparandum and repair site.
We propose four main hypotheses for the investigation of prosodic characteristics: 1) The Combination Rule: A single prosodic feature does not uniquely identify disfluencies or their types. Rather, it is a combination of several features that signals each type. 2) The Compensatory Rule: If there is an overlap of one prosodic feature, then another cue neutralizes the overlap. In other words, if one prosodic feature is strongly indicated suggesting multiple possibilities for prosodic boundaries (e.g. prolongation occurs at utterance boundaries, but also at utterance internal repetition sites), then another feature will disambiguate the final choice (e.g. prolongation with an utterance final tone indicates an utterance boundary vs. prolongation with sustained or repeated contour indicates an utterance internal repetition). 3) The Discourse Type Rule: Prosodic cues for disfluencies vary according to discourse type, e.g. human–human vs. human–machine interaction. 4) The Expanded Reset Rule (based on Pike [12]): Repair onset F0 values are dependent on the F0 values of reparandum onsets and reparandum offsets. The main research questions suggested by the hypotheses are: What are the prosodic cues for each disfluency type? Can predictive models be built to describe the relationship between disfluency types and prosodic cues? Are there correlations between the reparandum onset and offset and the repair onset and offset? Is there a general prosodic strategy or is it discourse-dependent?
2. Method 2.1. Corpus description and disfluency tagging Our study is data-driven and based on a corpus collected by Linguistic Technologies, Inc. (LTI), a company that applied automatic speech recognition to medical dictations. There are 21 talkers yielding 32,122 words approximately evenly distributed among the talkers. The speaking style is classed as quasi-spontaneous. The physicians have notes and templates to follow but fill in template sections with spontaneous discourse.
To categorize disfluencies, we use the classification scheme described in Page [10] motivated by the two criteria: the categories must be mutually exclusive and must allow for cross-comparison and further subclassification. Three undergraduate linguistics students from University of Minnesota tagged the disfluencies. Sites where the classification decisions differed were discussed and a final tag was agreed upon. The disfluency types are: • Exact repetitions (type 1): single or multiple word
repetitions separated optionally by filled pauses, silence, editing expressions, or any combination of these, e.g. “the um | the” (88 sites).
• Exact substitution (type 2): single or multiple word substitutions, separated optionally by silence, filled pauses, editing expressions, or any combination of these, e.g. “five correction | seven” (182 sites).
• Repetition and substitution (type 3): substitution with repeated material to the left or the right, e.g. “does not | did not” (72 sites).

Savova & Bachenko
92
• Repetition and insertion (type 4): repetitions with a new word inserted before or medially, e.g. “to clean | to try to clean.” (20 sites).
• Repetition and deletion (type 5): repetitions with a word omitted either at the start of the repeat or medially, e.g. “no spotting dysuria or abnormal | no spotting or dysuria” (4 sites).
Unlike other research [1], fragments are not classified as a completely separate group; instead, they are treated as words. We report results on the first 4 disfluency types as type 5 occurs infrequently in our corpus. Also, our study excludes sites with editing expressions, e.g. “five correction | seven”. Exact substitutions were further broken down into subgroups by 3 subclassification features to allow comparisons with Levelt & Cutler [5], a study suggesting that syntactic and phonetic errors do not receive any prosodic marking, but semantic errors form a separate group and tend to be prosodically marked: • Feature 1 – What does the repair fix? Pronunciation, e.g. “sci- | scaling” (109 sites) Semantics, e.g. “throat | lungs” (32 sites) Syntax, e.g. “he | his” (11 sites) Semantics/syntax, e.g. “is appa- | somehow got lost” (13
sites) • Feature 2 – Is there a fragment at the reparandum? Yes, e.g. “sci- | scaling” (108 sites) No, e.g. “a | what” (57 sites)
• Feature 3 – how can the reparandum be described in regard to the repair? Mispronunciation, e.g. “ma- | mycitracin” (31 sites) Repeat, e.g. “ec-“ | “exercises” (42 sites) Semantic error, e.g. “throat| lungs” (51 sites) Syntactic error, e.g. “one | once” (15 sites) Semantic/syntactic error, e.g. “talk | thinking” (13 sites) Needed elaboration, e.g. “ec- | low back exercises” (12
sites) Multiple corrections needed, e.g. “she’s had ah ah he
sen- | ah she is” (1 site)
2.2. Research variables A number of studies investigate duration and F0 contours as the most salient prosodic features for disfluency modeling. Our study focuses on these features as well and describes them in the context of disfluency types 1–4 — exact repetitions, exact substitutions, repetitions with substitutions and repetitions with insertions.
The raw duration values are normalized by two formulas and comparisons are done with normalized values:
deviationstmeandurationrawvaluenorm
._1_ −=
meandurationrawvaluenorm _2_ =
Small size samples (N<15) were excluded from the study as the standard deviation for those would exhibit a large spread. Segmental durations were obtained by force-aligning audio files with their respective text using the speech recognizer developed at Entropic Cambridge Research Laboratory. The alignment was hand-checked for correctness. F0 tracks and values were extracted using the Entropic XWAVES+ software. All the values for the entire repair interval were checked for spurious doubling and halving, and,
where needed, the values were hand-corrected. Samples with vocal fries were excluded from the study because their F0 values are unusually low [8]. Glottalization, on the other hand, does not appear to be associated with a sustained decrease in F0 [3]. Sites with word-medial voiceless fricatives were excluded from the analyses as they introduce spurious F0 values. The F0 contours (onset, max or min, offset) are taken over the reparandum and repair words only, not the entire sentence or prosodic phrase. The contours are represented as sequences of low (L) and high (H) tones, based on the F0 values for the given word. The contours reflect the onset, peak, valley and offset F0 from the word in focus. The contours are a simplified version of Pierrehumbert’s [11] intonational system and are taken over the word excluding the accented (*) tone and phonological analyses of the tones. Thus, only the overall F0 movement over the repair interval is recorded. The intonation data is presented in graphs regardless of durational characteristics at equal intervals between points. For the intonation analyses, disfluencies were further subdivided according to the presence/absence of silences at the left and/or right edge of the repair interval and the disfluency site. Because of the shrinking sample size, intonation results are reported only for exact repetitions and exact substitutions.
3. Results and discussion The results for the four disfluency types are graphed in Figures 1, 2, 3 and 4. Due to space limitations we do not report the results for the disfluency site silences and their embedding in the discourse hierarchy as compared to silences at utterance boundaries and boundaries at bigger discourse segments. These can be found in Savova [13]. The current figures represent the tendencies for exact repetitions and exact substitutions in two layers. The lower part reports segmental durations for reparanda, disfluency sites and repair sites. Each group above the fluent speech band shows scores significantly different from the fluent speech means (p<0.05). Each group represented by a separate curve exhibits results significantly different from the other groups (p<0.05). The upper part of the diagram reports the generalized tendency of the intonational contours along with the F0 range in Hz and the starting point of the repair as compared to the reparandum onset. Due to the small sample size for the intonational analyses, we report only durational results for type 3 and type 4 disfluencies. Detailed scores from the statistical tests can be found in Savova [13]. Correlations between reparandum F0 onsets and offsets and repair F0 onsets and offsets are strong (range is 0.62–0.99) providing a basis for predictive statistical models to be included in a disfluency detection algorithm. The lower correlation values are for repair intervals surrounded by silences. The correlation results need to be compared against fluent speech relations to find the uniqueness when a disfluency is present. Such a comparison is left for future research. Our data supports only partially Pike [12] as there are tokens whose repair starts at F0 values lower than those of the reparandum onsets. The strong correlations between the reparandum offset values and repair onset/offset values hint of dependencies that go beyond reparandum onset values, which supports our proposed Expanded Reset Rule.
Exact repetitions and exact substitutions show unique intonation patterns – matching intonational contour for the repetitions and a final low tone for the substitutions. According to the central tendencies presented in the figures, the substitution repair has larger F0 range in comparison to its reparandum and the repetition (type 1) repair.

Proceedings of DiSS’03, Disfluency in Spontaneous Speech Workshop, 5–8 September 2003, Göteborg University, Sweden. Robert Eklund (ed.), Gothenburg Papers in Theoretical Linguistics 90, ISSN 0349–1021, pp. 91–94.
93
Figure 1: Summary of the results for exact repetitions (type 1) – duration and intonation.
duration
intonation
Fluent speechvalues not-final multi-constituent
conjunction, demonstrative, preposition,pronoun, "other", last-of-many
definite article, indefinite article,copula
Reparandum site Disfluency site
initial silences,
Repair site
perc
enta
ge c
hang
e in
dura
tion
for r
epet
ition
s
sites with fragmentssilence after fragments
non-initial silencessemantic silences,
non-final constituentrepairing fragment
mono-constituents, last-of-many
indicates reparandum and repair onset and offset points
reparandum intonational contourends in a low tonerange: 33.28 HZ
repair intonational contourrange: 37.47 Hzonset: 10.29 Hz higher than reparandum onset
cliticizedfilled pauses
cliticizedfilled pauses
Figure 2: Summary of the results for exact substitutions (type 2) – duration and intonation.
Figure 3: Summary of the results for repetitions with substitutions (type 3) – duration.
Figure 4: Summary of the results for repetitions with insertions (type 4) – duration.
Fluent speechvalues
prepositions, "other" ,multi-constituents (rm/rr ratio 1.3)
conjunction (rm/rr ratio 1)
possessives (rm/rr ratio 1)
definite/indefinite articles, copulas(rm/rr ratio 1.3)
Reparandum site Disfluency site
initial silences, filledpauses
non-initial silences
prepositions, "other",conjunction, multi-constituents
possessives
definite/indefinite articles,copulas
Repair site
perc
enta
ge c
hang
e in
dura
tion
for r
epet
ition
s
reparandum intonationalcontour
range: 31.31 Hz
repair intonation contour:repeats reparandum intonational contour
range:29.56 Hzonset 9.66 Hz higher than rm_onset
cliticizedfilled pauses
cliticizedfilled pauses
indicates reparandum and repair onset and offset points
duration
intonation
Fluent speechvalues not-(first-or-last)
Reparandum site Disfluency site Repair site
perc
enta
ge c
hang
e in
dura
tion
for r
epet
ition
s
first-of-manysilences after reparandi
with fragmentsnon-initial constituents
initial constituentslast-of-manyinitial silences
non-initial silences
Fluent speechvalues multi-constituent
Reparandum site Disfluency site Repair site
perc
enta
ge c
hang
e in
dura
tion
for r
epet
ition
s
non-initial constituents, repeated constituents
initial constituents, inserted constituentsmono-constituent
mono-constituent silences
multi-constituent silences
Note: none of the differencesare statistically significant

Savova & Bachenko
94
Larger F0 ranges are one of the methods for prosodic marking (Pierrehumbert [11]). Durational analyses show that mono-constituent reparanda are consistently longer than reparanda consisting of many words (multi-constituent reparanda) across the disfluency types studied. Fragments have a contracting effect on the duration of the reparanda and of the disfluency site components. Comparing by subclassification features for exact substitutions did not provide consistent results, thus only partial support for Levelt & Cutler’s proposal [5]. Our result is in accord with Hokkanen [4] who also reports only partial support for Levelt & Cutler [5]. It must be noted that the methods in the studies differ – [5] uses subjective judgements for prosodic marking, while [4] and the current study use F0 measures. Future research must include converging methodologies.
We found initial support for the Discourse Type Rule. Oviatt’s CHAM [9] is only partially supported by our study giving additional ground to believe that disfluencies differ by type of discourse – Oviatt’s study was done on forced errors in a human-computer interaction, while our study deals with spontaneous disfluencies in monologue-like speech. There is good initial support for the Compensatory Rule – no two features are overly emphasized as that might lead to confusion with other discourse segment boundaries. For example, in the case of definite/indefinite article repetition, there is considerable prolongation, but the F0 fluctuations are moderate which rules out a possible utterance boundary. The Combination Rule also found good initial support. One signal or “an abrupt cut-off” as Hindle [2] defined it, does not uniquely identify the right edge of the reparandum. Hence, our proposal is to exploit prosodic combinations as they naturally occur in speech. For example, mono-constituent repetition reparanda are prolonged, but so are mono-constituent substitutions. Repetition reparanda have a falling contour, but so do substitution reparanda. The feature that is closest to being type unique is the duration of the disfluency site silence, but it is not present at all sites. If layers of prosodic information and placement within the overall prosodic discourse structure are combined, the uniqueness of disfluency prosodic characteristics might emerge.
4. Conclusions Future research will investigate the inclusion of the disfluencies in the overall discourse hierarchy. Based on the combined results, our goal is to offer a computationally viable algorithm for disfluency detection via prosodic characteristics. For that, we need to further study the relations between fluent and disfluent speech and expand the corpus size which is the limitation of the current study.
5. References [1] Clark, Herbert & Thomas Wasow. 1998. Repeating
words in spontaneous speech. Cognitive Psychology. vol. 37, pp. 201–242.
[2] Hindle, Donald. 1983. Deterministic parsing of syntactic non-fluencies. Proc 21st ACL. pp. 123–128.
[3] Hirschberg, Julia. 2000. A corpus-based approach to the study of speaking style. Prosody, Theory and Experiment. Kluwer Academic Publ. ISBN 0-7923-6579-8.
[4] Hokkanen, Tapio. 2001. Prosodic marking of self-repairs. Proc DiSS’01. University of Edinburgh. Sept 2001. pp. 37–40.
[5] Levelt, Willem & Anne Cutler. 1983. Prosodic marking in speech repairs. Journal of Semantics, vol. 2, no. 2, pp. 205–217.
[6] Lickley, Robin. 1994. Detecting disfluency in spontaneous speech. PhD dissertation, University of Edinburgh.
[7] Nakatani, Christine H. & Julia Hirschberg. 1994. A corpus-based study of repair cues in spontaneous speech. JASA, vol. 95(3), pp. 1603–1616.
[8] Olive, Joseph, Alice Greenwood & John Coleman. 1993. The acoustics of American English speech: a dynamic approach. New York: Springer.
[9] Oviatt, Sharon, Margaret MacEachern & Gina-Anne Levow. 1998. Predicting hyperarticulate speech during human–computer error resolution. Speech Communi-cation, vol. 24, pp. 1–23.
[10] Page, Sherri. 1999. Use of a postprocessor to identify and correct speaker disfluencies in automated speech recognition for medical dictations. Proc. DiSS’99. San Francisco. July 1999. pp. 27–30.
[11] Pierrehumbert, Janet. 1980. The phonology and phonetics of English intonation. PhD dissertation. MIT.
[12] Pike, Kenneth. 1945. The intonation of American English. Ann Arbor, MI: University of Michigan Press.
[13] Savova, Guergana. 2002. Disfluencies, prosody and discourse in quasi-spontaneous speech. Unpublished PhD dissertation, University of Minnesota.

Session VII: Corpus and Annotation

96

Proceedings of DiSS’03, Disfluency in Spontaneous Speech Workshop, 5–8 September 2003, Göteborg University, Sweden. Robert Eklund (ed.), Gothenburg Papers in Theoretical Linguistics 90, ISSN 0349–1021, pp. 97–100.
97
Acoustically verifying speech repair annotations
Fan Yang, Peter A. Heeman & Susan E. Strayer
Computer Science and Engineering OGI School of Science and Engineering
Oregon Health & Science University, USA
Abstract Identifying speech repairs is a critical part of annotating spontaneous speech. DialogueView is an annotation tool that provides visual and audio supports for directly annotating speech repairs. In this paper, we report the usability of clean play, a special feature implemented in DialogueView, which cuts out the annotated reparanda and editing terms and plays the remaining speech. We find that although clean play does not help users detect repairs, it does help them determine the extent of repairs. We also find that clean play improves users’ confidence because they have another way to verify their annotations.
1. Introduction The on-line nature of dialogues makes speech repairs prevalent. Speech repairs are a type of disfluency where speakers go back and modify or repeat something that they just said. Below is an example of a speech repair.
Speech repairs tend to have a standard structure [8, 13], consisting of a reparandum, an optional editing term, and an alteration. The reparandum is the stretch of speech being replaced or cancelled. It is followed by the interruption point. The optional editing term consists of filled pauses (e.g. ‘um’) and cue words (e.g. ‘I mean’). The alteration is the replacement for the reparandum. By removing the reparanda and editing terms, we arrive at the intended utterance of the speaker.
Speech repairs are a common phenomenon in spontaneous speech. Heeman & Allen [8] reported that 23% of speaker turns contain at least one speech repair, and 10% of the words in the Trains corpus [7] are in the reparandum or editing term of a speech repair. Shriberg [17] reported a higher disfluency rate of 57% in the Switchboard corpus. Identifying speech repairs is a critical part of annotating spontaneous speech, as repairs impact utterance boundary and dialogue act coding decisions. Moreover, since utterances containing speech repairs are usually syntactically or grammatically ill-formed, repair annotations are also useful for training the language model of a speech recognizer to improve recognition rate [6, 18] and for building a parser for spontaneous speech [4, 5].
Although a number of tools can be used to directly or indirectly annotate speech repairs, DialogueView [9] provides better visual and audio supports for this task. DialogueView has a graphical means for annotating and displaying repairs, even embedded repairs. We are also experimenting with audio support, which is the subject of this paper.
By removing the reparandum and editing term, the intended utterance becomes syntactically well-formed at the interruption point (cf. [4, 10]). This “well-formedness” has
been used by several researchers. Bear et al. [2] used a two-step process in which pattern matching techniques first identify the reparanda and editing terms of potential repairs. The second step tests potential repairs by removing their reparandum and editing term, and seeing if the result is parsable. Kikui & Morimoto [12], as one source of evidence, judged whether the speech that precedes the reparandum can be syntactically followed by the alteration. The syntactic well-formedness was based on the part-of-speech tags. This technique was expanded upon by Heeman & Allen [8].
Just as the intended utterance is syntactically well-formed, it might also be intonationally well-formed. The prosody of the speech of the alteration might follow the prosody of the speech before the reparandum, just as if the reparandum and editing term had not been said. Hence, after users mark up a potential speech repair, they could listen to the intended utterance to help them decide the plausibility of the repair. We have built this clean play mechanism into DialogueView. We have personally found it helpful in choosing between alternative speech repair interpretations. To ascertain the usability of this clean play feature, we ran a controlled experiment. We find that although the clean play does not help in detecting repairs, it helps users in identifying the extent of repairs once they are detected. Also clean play improves users’ confidence because they have another way to verify their annotations.
In section 2, we describe how speech repairs are annotated in DialogueView. In section 3, we describe the human-subject experiment in which we evaluate the clean play. In section 4, we give the conclusion.
2. Annotating repairs in DialogueView Even though repairs are a normal part of spontaneous speech, annotation tools have yet to address them adequately. For example, Transcriber [1] allows word and utterance transcription, but has no direct means for annotating speech repairs. Mate workbench [15] can be used for annotating speech repairs only at the word-level.1 It does not show the structure of speech repairs, especially the embedded ones.
DialogueView is a multi-level annotation tool. It can be used for annotating speech repairs, utterance boundaries, communicative status (such as overlapping, abandoned, incomplete, and uninterpretable), dialogue acts, and discourse structure. The interface of DialogueView consists of three views. The word view shows the exact timing of speech. The utterance view shows the dialogue as a sequence of utterances, as if it were a script for a movie. The intention view shows the dialogue as a hierarchy of discourse segment summaries and purposes. Two levels of abstraction are presented.
1 The SRI annotation scheme [3] can be used for word-level repair
annotation.

Yang, Heeman & Strayer
98
Figure 1: Interface of word view.
The utterance view abstracts away from the exact timing of the words and can even omit words that do not contribute to the content of the dialogue. The intention view abstracts away from the exact utterances that were said. Users get a general idea of what is happening in the dialogue from the higher level yet can view the lower level for details.
Users annotate speech repairs, along with utterance boundaries and communicative status, in the word view. Speech repairs should be annotated at the same time as utterance boundaries and communicative status since repairs have strong interactions with utterance segmentation and abandoned speech [9]. The word view takes as input the words said by each speaker and their start and stop times, and shows them time-aligned with the original audio signal. To annotate a repair, the user highlights a sequence of words and then tags it as a reparandum or as an editing term of a repair. The user can also specify the type of repair. Figure 1 shows how speech repairs are displayed in the word view. The words in the reparandum and editing term are underlined and displayed in a special color. Repairs can also be embedded. Figure 1 also shows an example where the speaker made a fresh start embedded in another fresh start.
In addition to visually displaying the scope of each repair, DialogueView also provides several audio playback options to help annotate speech repairs. Users can play each speaker channel individually or both combined (the Play Both, Play System and Play User buttons in Figure 1), which we refer to as full play since it plays everything that happened in the dialogue. Moreover, a special feature, clean play (the Play System Cleanly and Play User Cleanly buttons in Figure 1), is offered to let users hear the effect of their repair annotations. The clean play cuts out the stretch of speech annotated as reparandum and editing term and pastes the remaining speech together. If the repairs are correctly annotated, the clean play should sound fairly natural.
3. Evaluation of clean play We conducted a human-subject experiment to investigate the usability of clean play. It was expected that people with the clean play feature would do better than people without it in annotating speech repairs. 3.1. Dialogue excerpts
Eight dialogue excerpts were taken from the Trains corpus [7]. Two were used for practice. The other six were used as material for the subjects to annotate speech repairs. Our experts annotated speech repairs for all eight dialogue excerpts. The last one proved too difficult, as there was a lot of self-talk. Hence it was excluded in the analysis of result. Table 1 shows details for these excerpts.
Table 1: Details of eight excerpts for coding speech repairs. ID Use Number of repairs Length Tr1 demonstration 5 14 sec Tr2 exercise 3 12 sec 1 subject coding 3 10 sec 2 subject coding 3 10 sec 3 subject coding 2 7 sec 4 subject coding 1 8 sec 5 subject coding 5 12 sec 6 subject coding 6 19 sec
3.2. Subjects
Thirteen subjects participated in the experiment. All were native English speakers. They were randomly divided into two groups: the control group had 3 females and 2 males, and the clean group had 4 females and 4 males. Subjects in the control group had only access to full play, which plays the original audio. Subjects in the clean group had the functionalities of both full play and clean play. We had more subjects in the clean group because we were interesting in observing how people used the clean play function. 3.3. Experiment tool
A special version of DialogueView was built for subjects to annotate speech repairs. This special tool is self-contained, with instructions and exercises. Subjects were first taught the concept of speech repairs and how to code them using the annotation tool. Several examples were presented to familiarize subjects with speech repairs. The clean group subjects had the opportunity to listen to the intended utterances of the examples. Both groups of subjects were then given a dialogue excerpt (Tr1) and a list of steps to annotate the speech repairs. This gave subjects real experience in interacting with our tool, such as adding repairs, deleting repairs, and listening to the full and intended utterances (clean group only). The final phase of training is an exercise (Tr2) in which subjects annotated speech repairs on their own and then compared their annotation with our expert annotation.
After the training, subjects were given the six dialogue excerpts to annotate one by one in the same order. The tool prohibits subjects from going back to previous excerpts. Subjects’ interactions with the tool, including adding and deleting speech repairs, and audio playback with full play and clean play, were all automatically logged. 3.4. Procedure
Subjects completed the training and annotation by themselves in a private room without any interference. They could call the tester at any time to answer questions about using the tool.

Proceedings of DiSS’03, Disfluency in Spontaneous Speech Workshop, 5–8 September 2003, Göteborg University, Sweden. Robert Eklund (ed.), Gothenburg Papers in Theoretical Linguistics 90, ISSN 0349–1021, pp. 97–100.
99
After the experiment, subjects filled in a questionnaire to give their feedback, such as degree of confidence on their annotation. 3.5. Results
Our expert annotation serves as the gold standard for evaluating subjects performance. We adopt detection and correction to evaluate subjects performance.1 We use a less restricted definition of detection than what is typically used. If the reparandum or editing term of a repair annotated by a subject overlaps the reparandum or editing term of a repair in the gold standard, we say that the gold standard repair is detected by the subject. A repair in the gold standard is missed if it is not detected by the subject. If the words in the reparandum and editing term of a gold standard repair are the same as the words in the reparandum and editing term that the subject annotated, we say that this repair is corrected by the subject. A corrected repair implies that it is detected. A detection means the subject was aware of a disfluency and a correction means the subject located the extent of the disfluency. Figure 2 shows some examples of detection and correction.
Figure 2: Examples of detection and correction. Figure 3A shows the performance of both groups in detecting each of the 14 repairs. Overall, the mean detection rate for the control group is 88.6% (62/70), and for the clean group is 89.3% (100/112). Statistically, we don’t see a significant difference in the detection rate between the two groups (pairwise signtest, p = 1). This is not surprising because we expect clean play to help correct speech repairs, not detect them, as we will explain in the discussion.
Figure 3B shows the performance of both groups in correcting each of the repairs. Overall, the mean correction rate for the control group is 67.1% (47/70), and for the clean group is 72.3% (81/112). This suggests that the clean group subjects are doing a little better than the control group in correcting repairs.
Due to the small performance improvement, we also examine how clean play was used. First, we find that all clean group subjects verified every repair they annotated with clean play. Second, in nine cases, they changed their annotation after using clean play. In eight of the cases, they changed from a wrong corrected repair (but correctly detected) into a correction. In the ninth case, a subject deleted a correct annotation. Hence, the clean group improved their rate in correcting repairs from 66.0% (74/112) before using clean play to 72.3% (81/112). This suggests that it is the use of clean play that accounts for the improvement of the clean group over the control group. Overall, clean play reduced the correction errors of detected repairs from 26.7% (27/101) to 19.0% (19/100), giving a relative improvement of 28.8% in correcting repairs.
1 We report recall only. From our data we only see three cases of false
positive, two in the clean group and one in the control group. We believe that those are minor and can be ignored.
Figure 3: Performance on each repair: black for the control group and white for the clean group.
There are a couple of repairs where the control group did better than the clean group. For repair 3, although the control group has a higher correction rate, the correction rate over detected repairs is almost the same for both groups. This means that the difference in repair correction rate is due to the difference of subjects’ capability in detecting repairs, instead of the use of clean play. The utterance of for repair 8 is “E two and E three are both8 want to leave Elmira at the same time”, where the reparandum and editing term are in italics followed by the repair number as a subscript. Both groups have similar detection rate, but vastly different correction rates. In fact, the clean group mistakenly thought that the interruption point was after the word “are” rather than the word “both” which is followed by a short silence. More work is needed to explain this negative result.
Repairs 7 and 13 show limitations of clean play. The utterance of repair 7 is “yes the7 the problem here is that ...” If subjects mistakenly coded the words “yes the” as the reparandum, the remaining speech still sounds fluent. The clean play does not help in finding this mistake. The utterance for repair 13 is “how long would it take to get13 to take engine well let’s see14 engine number two...” One clean group subject annotated it as “how long would it take to get to take13 engine well let’s see14 engine number two...” This annotation under clean play sounds as good as the correct annotation. Just as a spell checker can not distinguish between “out” misspelled as “our”, clean play can not catch all incorrect annotations.
We also asked subjects for their degree of confidence on their annotation (on a scale from 1 to 5). The clean group subjects reported higher confidence (mean = 3:5; σ = 0:53) than the control group (mean = 2:8; σ = 0:84). Our clean group subjects were satisfied with the clean play: they ranked the clean play as useful as the full play. Interestingly, one subject in the control group mentioned that he would like to listen to the intended utterance. 3.6. Discussion
It is not surprising that our tool does not help in detecting speech repairs because there are strong acoustic cues around the interruption point. Levelt & Cutler [14] reported the correlation between error repairs (repairs of erroneous information) and increased intonational prominence at the beginning of an alteration. This result was confirmed by Howell & Young [11]. They found that some repairs tend to

Yang, Heeman & Strayer
100
have a pause around the interruption point and have a strong accent at the onset of alteration. Nakatani & Hirschberg [16] found that the reparanda often end in word fragments (73.3%) and are often accompanied with glottalization and coarticulation, especially for those ending in fragments. They also found that filled pauses and cue phrases occur significantly more often in non-fragment repairs than in fragment repairs. These cues can be heard in full play, which subjects in both groups had access to.
The clean play makes the assumption that the intended utterance should sound “fluent”. Although a strong accent at the onset of alteration is found at some repairs, many repairs do not have this feature [11, 14]. Our positive results suggest a thorough investigation of prosodic cues between the speech before the reparandum and the onset of the alternation is warranted.
Our results show that overall people with the clean play do a little better than people without it in correcting speech repairs. When users have access to a transcription of the words, including word fragments, giving them clean play only gains a modest improvement. This is because a lot of repairs can be detected and corrected by just looking at the words. To get results that are statistically significant, a much larger sample size is needed. An area that we have not investigated is the advantage of our tool when multiple repairs occur in a short stretch of speech. The clean play will play the effect of current annotation, hopefully allowing the user to catch the remaining repairs.
4. Conclusion In this paper, we described our annotation tool, DialogueView, which provides visual and audio support for annotating speech repairs. We find that although our clean play feature, which plays the speech left after cutting out speech repair reparandum and editing term, does not help people detect repairs, it does help people identify the extent of repairs, reducing their error rate by 28.8%, and improves their confidence in their speech repair annotations.
5. Acknowledgements The authors acknowledge funding from the Intel Research Council. We also thank members of CSLU and CHCC for helpful discussions.
6. References [1] Barras, C., E. Geoffrois, Z. Wu, & M. Liberman. 2001.
Transcriber: Development and use of a tool for assisting speech corpora production. Speech Communication, vol. 33(1–2), pp. 5–22.
[2] Bear, John, John Dowding & Elizabeth Shriberg. 1992. Integrating multiple knowledge sources for the detection and correction of repairs in human–computer dialogue. Proceedings of 30th ACL.
[3] Bear, John, John Dowding, Elizabeth Shriberg & Patti Price. 1993. A system for labeling self-repairs in speech. Technical Report 522, SRI, February 1993.
[4] Charniak, Eugene & Mark Johnson. 2001. Edit detection and parsing for transcribed speech. Proceedings of 2nd NAACL, 2001.
[5] Core, Mark G. & Lenhart K. Schubert. 1999. A syntactic framework for speech repairs and other disruptions. Proceedings of 37th ACL.
[6] Heeman, Peter A. 1999. Modeling speech repairs and intonational phrasing to improve speech recognition. In Automatic Speech Recognition and Understanding Workshop, Keystone Colorado, December 1999.
[7] Heeman, Peter A. & James F. Allen. The Trains spoken dialogue corpus. CD-ROM, Linguistics Data Consortium, 1995.
[8] Heeman, Peter A. & James F. Allen. 1999. Speech repairs, intonational phrases and discourse markers: Modeling speakers’ utterances in spoken dialogue. Computational Linguistics, vol. 25(4).
[9] Heeman, Peter A., Fan Yang & Susan E. Strayer. 2002. DialogueView: A dialogue annotation tool. Proceedings of 3rd SIGDial workshop on Dialogue and Discourse, Philadelphia.
[10] Hindle, Donald. 1983. Deterministic parsing of syntactic non- fluencies. Proceedings of 21st ACL.
[11] Howell, P. & K. Young. 1991. The use of prosody in highlighting alteration in repairs from unrestricted speech. The Quarterly Journal of Experimental Psychology, vol. 43A(3).
[12] Kikui, Gen-ichiro & Tsuyoshi Morimoto. 1994. Similarity based identification of repairs in Japanese spoken language. Proceedings of 3rd ICSLP.
[13] Levelt, Willem. 1983. Monitoring and self-repair in speech. Cognition, vol. 14, pp. 41–104.
[14] Levelt, Willem & Anne Cutler. 1983. Prosodic marking in speech repair. Journal of Semantics, vol. 2, pp. 205–217.
[15] McKelvie, D., A. Isard, A. Mengel, M. B. Moeller, M. Grosse & M. Klein. 2001. The MATE Workbench – An annotation tool for XML coded speech corpora. Speech Communication, Special issue, “Speech Annotation and Corpus Tools”, vol. 33(1–2), pp. 97–112.
[16] Nakatani, Christine H. & Julia Hirschberg. 1994. A corpus-based study of repair cues in spontaneous speech. Journal of the Acoustical Society of America, vol. 954, pp. 1603–1616.
[17] Shriberg, Elizabeth. 1996. Disfluencies in Switchboard. Proceedings of 4th ICSLP.
[18] Stolcke, Andreas, Elizabeth Shriberg, Dilek Hakkani-Tür & Gökhan Tür. 1999. Modeling the prosody of hidden events for improved word recognition. Proceedings of 6th Eurospeech, 1999.

GOTHENBURG PAPERS IN THEORETICAL LINGUISTICS
GÖTEBORG UNIVERSITY, DEPARTMENT OF LINGUISTICS, BOX 200, SE–405 30 GÖTEBORG, SWEDEN
101
44. Sven Strömqvist. Lexical Search Games in Adult Second Language Acquisition. A Model and Some Results. May, 1983.
45. Jens Allwood, Sven Strömqvist & Kaarlo Voionmaa. Ecology of Adult Language Acquisition – A Psycholinguistic Research Project. 1983.
46. Sven Strömqvist. An Initial Investigation into Gaze Aversion, Code-Switching and Search Activities in Discourse. December, 1983.
47. Jean-Michel Saury. Polarity and the Morpheme – A New Analysis of the Morphemes -lös and -fri in Swedish. September, 1984.
48. Elisabeth Ahlsén. The Nonverbal Communication of Aphasics in Conversation. January, 1985.
49. Dora Kós-Dienes. Fillmore’s Case Theory and Thematic Roles in GB Theory – A Comparison and Criticism. February, 1985.
50. Dora Kós-Dienes. The Semantics of Tense Morphemes in an English Narrative. January, 1986.
51. Jens Allwood & Elisabeth Ahlsén. Semantic Aspects of Aphasic Word Substitutions. January, 1986.
52. Beatriz Dorriots. How to Succeed with Only Fifty Words–Analysis of a Role-Play in the Frame of Adult Language Acquisition. November, 1986.
53. Joakim Nivre. Grammatical Functions in GB. September, 1988.
54. Sofia Hörmander. The Problems of Learning a Lexicon with a Prolog Based Grammar. November, 1988.
55. Sven Strömqvist. Perspectives on Second Language Acquisition in Scandinavia – with Special Reference to Sweden. January, 1989.
56. Sven Strömqvist & Dennis Day. The Development of Discourse Cohesion – An Asymmetry between Child L1 and Adult L2 Acquisition. January, 1989.
57. Sven Strömqvist. Chaotic Phases in Adult Second Language Acquisition – Evidence from Speech Planning and Monitoring Phenomena. January, 1989.
58. Jens Allwood, Joakim Nivre & Elisabeth Ahlsén. Speech Management – On the Non-Written Life of Speech. October, 1989.
59. Kim Plunkett & Sven Strömqvist. The Acquisition of Scandinavian Languages. March, 1990.
60. Jens Allwood. On the Role of Cultural Content and Cultural Context in Language Instruction. April, 1990.
61. Anders-Börje Andersson & Sven Strömqvist. Adult L2 Acquisition of Gender – A Cross-Linguistic and Cross-Learner Types Perspective. August, 1990.
62. Joakim Nivre. Feedback and Situation Theory. April, 1991.
63. Sally Boyd & Paula Andersson. Linguistic Change Among Bilingual Speakers of Finnish and American English in Sweden – Background and Some Tentative Findings. April, 1991.
64. Jens Allwood, Joakim Nivre & Elisabeth Ahlsén. On the Semantics and Pragmatics of Linguistic Feedback. October, 1991.
65. Jens Allwood. On Dialogue Cohesion. May, 1992. 66. Sven Strömqvist, Ulla Richtoff & Anders-Börje
Andersson. Strömqvist’s and Richtoff’s Corpora – A Guide to Longitudinal Data from Four Swedish Children. February, 1993.
67 Jens Allwood. The Academic Seminar as an Area of Conflict and Conflict Resolution. February, 1993.
68. Jens Allwood. Feedback and Language Acquisition. April, 1993.
69. Jens Allwood, Bo Ralph, Paula Andersson, Dora Kós-Dienes & Åsa Wengelin (eds.). Proceedings of the XIVth Scandinavian Conference of Linguistics and The VIIIth Conference of Nordic and General Linguistics. August 16–21 1993. General Session. Volume 1 & Volume 2. May, 1994.
70 Anders Holmberg & Cecilia Hedlund (eds). Proceedings of the XIVth Scandinavian Conference of Linguistics and The VIIIth Conference of Nordic and General Linguistics. August 16–21 1993. General Session on Scandinavian Syntax. May, 1994.
71. Kristina Jokinen (ed). Proceedings of the XIVth Scandinavian Conference of Linguistics and The VIIIth Conference of Nordic and General Linguistics. August 16–21 1993. Special Session on Pragmatics in Dialogue Management. May, 1994.
72. Jens Allwood, Frans Gregersen, Jussi Niemi, Dennis Day & Sture Ureland (eds). Proceedings of the XIVth Scandinavian Conference of Linguistics and The VIIIth Conference of Nordic and General Linguistics. August 16–21 1993. Special Sessions on Spoken Language, Neuro-linguistics, Anthro-pological Linguistics and Language Contacts across the Baltic. 1994.
73. Karin Junefelt (ed). Proceedings of the XIVth Scandinavian Conference of Linguistics and The VIIIth Conference of Nordic and General Linguistics. August 16–21, 1993. Special Session on Activity Theory. 1994.
74 Sven Strömqvist (ed). Proceedings of the XIVth Scandinavian Conference of Linguistics and The VIIIth Conference of Nordic and General Linguistics. August 16–21, 1993. Special Session on Language Development. May, 1994.
75 George Miller. Virtual Meaning. The Gustaf Stern Lectures. 1994.
76 Jens Allwood. An Activity Based Approach to Pragmatics. 1995.
77 Elisabeth Ahlsen. Pragmatics and Aphasia - An Activity Based Approach. 1995.
78. Sven Strömqvist. Discourse Flow and Linguistic Information Structuring: Explorations in Speech and Writing. 1996.
79 Biljana Martinovski. Speech and Activity Style. November. 1996.
80. Hrafnhildur Ragnarsdottir & Sven Strömqvist (eds.). Learning to Talk about Time and Space. Proceedings from the 3rd Nelas Conference. February, 1998.
81. Proceedings FONETIK 99. The Swedish Phonetics Conference. June 2–4 1999.
GOTHENBURG PAPERS IN THEORETICAL LINGUISTICS
GÖTEBORG UNIVERSITY, DEPARTMENT OF LINGUISTICS, BOX 200, SE–405 30 GÖTEBORG, SWEDEN
102
82. Jens Allwood. The Structure Of Dialog. 1999. 83. Sven Strömqvist & Elisabeth Ahlsén. The Process of
Writing - A progress report. October, 1998. 84. Jens Allwood. Cooperation and Flexibility in
Multimodal Communication. 1999. 85. Jens Allwood (ed.). Dialog Coding – Function and
Grammar. 2001. 86. Jens Allwood et al. Transliteration between Spoken
Language Corpora: Moving between Danish BySoc and Swedish GSLC. 2001.
87. Åsa Abelin & Jens Allwood. Cross-Linguistic Interpretation of Emotional Prosody. 2003.
88. Peter Juel Henrichsen. Some frequency based differences between spoken and written Danish. 2002.
89. Jens Allwood. Meaning potentials: Some consequences for the analysis of variation in meaning. 2003.
90. Robert Eklund (ed.). Proceedings of DiSS’03, Disfluency in Spontaneous Speech. 2003.

This page intentionally left blank.
