this page is left intentionally blank - pwcs.edu · resulting 2.7% pay hike will keep us...
TRANSCRIPT


This page is left intentionally blank

Prince William County Public Schools - Executive Summary FY 2019 Budget
i
To Our Community:
I am pleased to propose a fiscal year 2019 budget that devotes every available funding dollar to meeting the needs and aspirations of our diverse and growing student community.
It will fund continuation of all existing PWCS programs and services supporting student success, from pre-K through graduation. The proposal also maintains educational efforts that have boosted on-time graduation rates to all-time highs, while fueling ongoing work to eliminate gaps between the performance of differing demographic groups.
This proposal includes my third-consecutive recommendation of a full-step increase for all eligible employees. The average resulting 2.7% pay hike will keep us competitive in recruiting and retaining the great teachers and staff who are essential for student success.
It funds the education and housing of a projected 1,119 new students above September 30, 2017, enrollment. It also enables the opening of the new Independence Nontraditional School, and conversion of Washington-Reid into a preschool for the youngest learners served by our growing commitment to pre-K.
The proposal permits completion of additions at Lake Ridge Middle and Pattie Elementary Schools, and renewals at seven others. Additions and new construction promise more progress in eliminating classroom trailers, while upgrading schools based on infrastructure needs and the time since the last renovations, reflects our commitment to quality schools for all.
By law, the proposal balances spending with the total revenue we expect from the Board of County Supervisors, the Virginia budget, and the federal government. However, while total funding has increased year after year, the inflation-adjusted revenue supporting the FY 2019 budget still limits per-pupil spending to levels comparable to 2006.
Millions in cuts from federal Title I funding and state payments for the Special Education Regional Schools required the reallocation of previous budget expenditures to close financial gaps, limiting the extent of new investments.
Included new spending, such as funds for extra services to economically disadvantaged students, enhanced gifted education programs, and others to serve the full range of learners, are listed in the proposed budget summary and detail. Like other new investments in new school social workers and mental health professionals, they stem from a list of more than 150 critical and costly needs identified by principals and school leaders. Selections were driven by known School Board, educator, and community concerns. Think how much more we might do, if more funds were available.
For now, the proposal balances a wide range of programs and services that people want, with the reality of what we need and can afford to deliver for everyone.
We look forward to working with the School Board to refine this proposal into the best possible budget for serving our students and community. Let's reaffirm that Providing A World-Class Education is more than just our mission statement. It’s what we do!
Sincerely,
Steven L. WaltsSuperintendent of Schools
i

This page is left intentionally blank

Prince William County Public Schools - Executive Summary FY 2019 Budget
iii
Prince William County Public Schools FY 2018 Budget
1
The School Board
Mr. Ryan SawyersChairman
Mrs. Lillie G. JessieVice Chairman
Occoquan District
Mr. William J. DeutschColes District
Mrs. Diane L. RaulstonNeabsco District
Mr. Gil TrenumBrentsville District
Ms. Kate ArnoldStudent Representative
Mrs. Alyson A. SatterwhiteGainesville District
Ms. Loree Y. WilliamsWoodbridge District
Mr. Justin WilkPotomac District

Prince William County Public Schools - Executive Summary FY 2019 Budget
iv
This page is left intentionally blank
Prince William County Public Schools - Executive Summary FY 2019 Budget
v
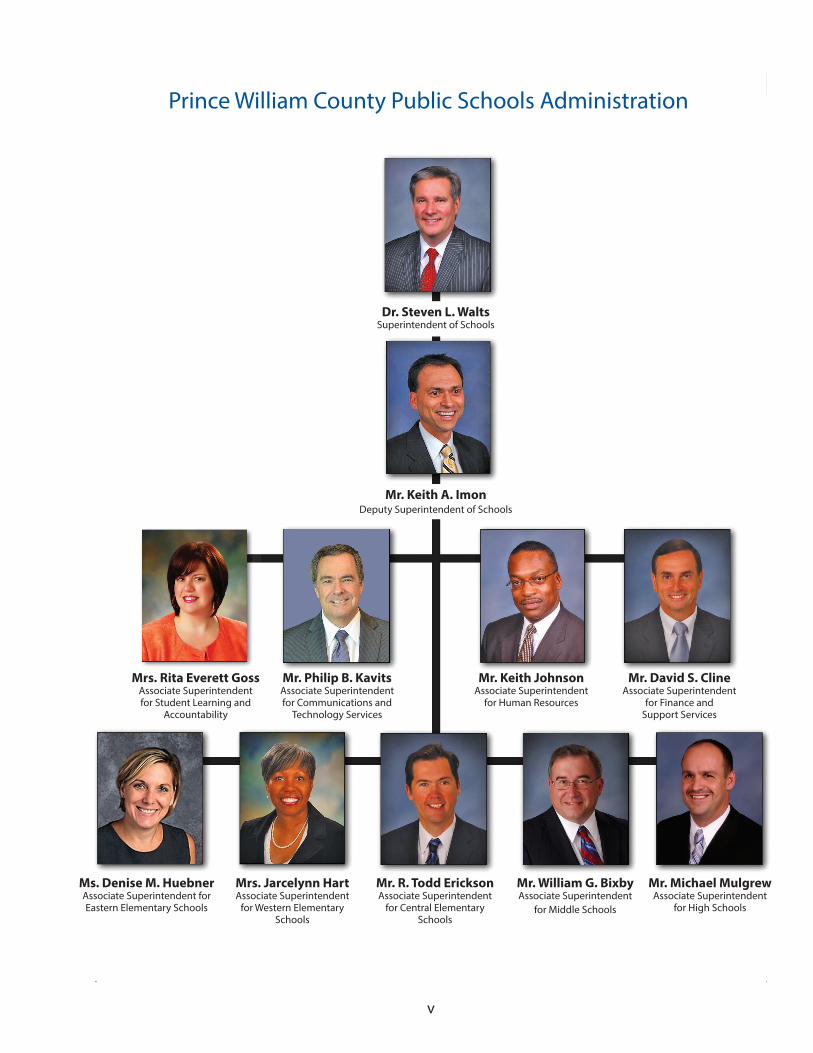
Prince William County Public Schools Administration
Mr. Keith A. ImonDeputy Superintendent of Schools
Mr. David S. ClineAssociate Superintendent
for Finance andSupport Services
Mr. Keith JohnsonAssociate Superintendent
for Human Resources
Mr. Philip B. KavitsAssociate Superintendent for Communications and
Technology Services
Mrs. Rita Everett Goss Associate Superintendent for Student Learning and
Accountability
Ms. Denise M. HuebnerAssociate Superintendent for Eastern Elementary Schools
Mr. Michael MulgrewAssociate Superintendent
for High Schools
Mr. William G. BixbyAssociate Superintendent
for Middle Schools
Mr. R. Todd EricksonAssociate Superintendent
for Central Elementary Schools
Mrs. Jarcelynn HartAssociate Superintendent
for Western Elementary Schools
Dr. Steven L. WaltsSuperintendent of Schools

Prince William County Public Schools - Executive Summary FY 2019 Budget
vi
This page is left intentionally blank

Prince William County Public Schools - Executive Summary FY 2019 Budget
vii
Achievements 2013-17• Divisionwide on-time graduation rate of 91.8 percent, up
from 83 percent in 2008, and places PWCS seventh among the nation’s 50 largest school districts.
• More than one-third of PWCS graduates in 2016-17 received at least one qualifying score on an Advanced Placement, International Baccalaureate, or Cambridge examination, exceeding the national and state averages.
• In addition, 11 percent of graduates in 2016-17 received dual enrollment credit, up from 7 percent in 2015-16.
• According to reports published by the College Board, 85% of seniors in PWCS achieved their college readiness benchmark score on the Evidence-based Reading and
Writing portion, and 59 percent of seniors achieved the college readiness benchmark score on the Mathematics portion.
• 2017 graduates were awarded $57 million in scholarships.• PWCS student average SAT score exceeds national
average and has increased by 17 points since 2011-12.• PWCS is working to close the SAT performance gap,
with black students outperforming counterparts state and nationwide in reading, writing, and math.
• The Division is increasing bandwidth from 2 to 10 GB, enhancing communication and access to internet resources during the 2017-18 school year.
Major Awards:• National Distinguished Principal for Virginia, Virginia
Association of Elementary School Principals, 2017• National Title I Distinguished School, 2017• National Outstanding High School Principal of the Year,
Virginia Association of Elementary School Principals, 2017
• National Outstanding Assistant Principal, Virginia Association of Elementary School Principals, 2015, 2016, 2017
• Finalist for Presidential Award for Excellence in Mathematics and Science Teaching, 2016
• Parkside Middle School approved first U.S. Cambridge International Professional Development site, 2016
• Woodbridge Middle School re-designated a Breakthrough School by National Association of Secondary School Principals, 2017
• Virginia Region IV Superintendent of the Year, 2016• STEM Excellence Award to Mountain View Elementary,
National Future of Education Technology Conference, 2017
• Top 30 Technologists, Transformers & Trailblazers Award, Center for Digital Education, 2015
• All PWCS high schools continue to be ranked among the top nine percent in the United States in “The Washington Post” “America’s Most Challenging High School List,” 2017
• Milken Educator Award, 2001, 2003, 2007, 2009, 2011, 2015, 2016
• Virginia Board of Education Index of Performance Awards, 2009, 2011, 2015-17

Prince William County Public Schools - Executive Summary FY 2019 Budget
viii
This page is left intentionally blank
Prince William County Public Schools - Executive Summary FY 2019 Budget
ix
This Report Prepared by:
Associate Superintendent for Finance and Support Services
David S. Cline
Office of Financial Services14715 Bristow Road
Manassas, Virginia 20112703.791.8753
Director of Financial ServicesJohn M. Wallingford
Budget SupervisorKathleen Addison
Budget StaffAmber BergerBeth Beyene
Khanie McDuffieBarbara RobinsonNatasha Valencia

This page is left intentionally blank
Prince William County Public Schools - Executive Summary FY 2019 Budget
xi
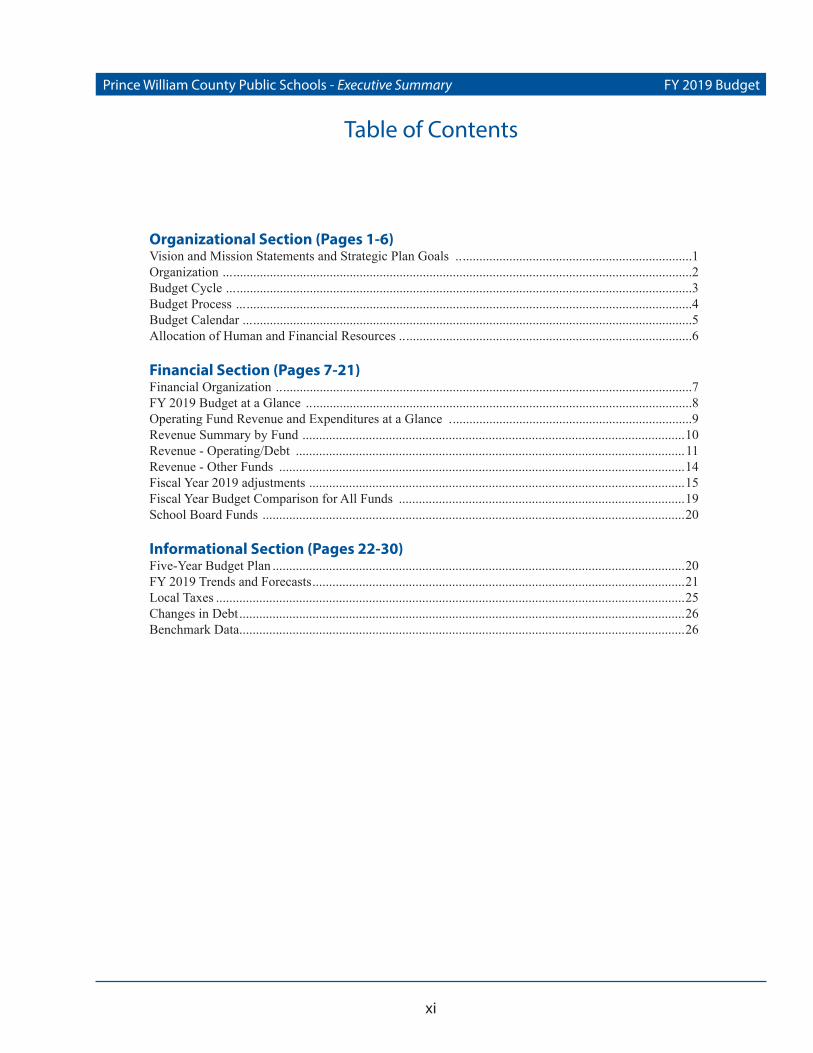
Organizational Section (Pages 1-6)Vision and Mission Statements and Strategic Plan Goals .......................................................................1Organization .............................................................................................................................................2Budget Cycle ............................................................................................................................................3Budget Process .........................................................................................................................................4Budget Calendar .......................................................................................................................................5Allocation of Human and Financial Resources ........................................................................................6
Financial Section (Pages 7-21)Financial Organization .............................................................................................................................7FY 2019 Budget at a Glance ....................................................................................................................8Operating Fund Revenue and Expenditures at a Glance .........................................................................9Revenue Summary by Fund ...................................................................................................................10Revenue - Operating/Debt .....................................................................................................................11Revenue - Other Funds ..........................................................................................................................14Fiscal Year 2019 adjustments .................................................................................................................15Fiscal Year Budget Comparison for All Funds ......................................................................................19School Board Funds ...............................................................................................................................20
Informational Section (Pages 22-30)Five-Year Budget Plan ............................................................................................................................20FY 2019 Trends and Forecasts ................................................................................................................21Local Taxes .............................................................................................................................................25Changes in Debt ......................................................................................................................................26Benchmark Data ......................................................................................................................................26
Table of Contents

Prince William County Public Schools - Executive Summary FY 2019 Budget
1
Organizational SectionVision StatementIn Prince William County Public Schools (PWCS), all students will learn to their fullest potential. The education of each student will be individualized and developmentally appropriate. Student learning will be enhanced by national, global, and multicultural perspectives.
Students who graduate from Prince William County Public Schools will possess the basic knowledge and skills that will assure their proficiency in problem solving and the use of technology. Graduates will have a desire to learn and the skills to be life-long learners. They will be responsible citizens. All graduates will be competent to enter the work world and prepared to pursue advanced educational opportunities.
Mission StatementProviding A World-Class EducationProviding A World-Class Education means….
• The focus is on all students learning and achieving high standards.
• Instruction is engaging and rigorous.
• Reading and writing literacy is taught in all content areas.
• We support the academic, social, and emotional needs of all students.
• Schools and offices are inviting, welcoming, and customer oriented.
• We will accomplish our Strategic Plan by working together.
Strategic Plan GoalsGoal 1: All students meet high standards of performance.
Goal 2: The teaching, learning, and working environment is safe, caring, healthy, and values human diversity.
Goal 3: Family, community, and employee engagement create an environment focused on improved student learning and work readiness.
Goal 4: Employees are highly qualified (as defined by VDOE), high performing, and diverse.
Goal 5: The organizational system is aligned and equitable.
Prince William County Public Schools (PWCS) does not discriminate in employment nor in its educational programs, services and activities on the basis of race, color, religion, national origin, sex, gender identity, sexual orientation, pregnancy, childbirth or related medical conditions, age, marital status, veteran status, disability, or any other basis prohibited by law. The following individual will handle inquiries regarding nondiscrimination policies, including Section 504 and Title IX: Associate Superintendent for Human Resources, Prince William County Public Schools, P.O. Box 389, Manassas, VA 20108.

Prince William County Public Schools - Executive Summary FY 2019 Budget
2
School and DepartmentImprovement PlanningThe PWCS Strategic Plan is a roadmap for the School Division and schools to achieve the vision of Providing a World-Class Education. The Strategic Plan includes five goals, with the primary goal focused on student achievement and the others all supporting this goal. The Strategic Plan for 2016-20 also includes the “20/20 Vision for Graduates,” which is a statement of expectations PWCS has for graduating students. Beyond goal statements, the comprehensive Strategic Plan includes objectives and measures that articulate the ways PWCS measures progress. The Division Strategic Plan is used as the basis for each School Improvement Plan. The Office of Accountability produces Balanced Scorecards that show progress toward meeting the objectives of the Strategic Plan. Central office
OrganizationTo focus on meeting the needs of its projected 91,054 students while managing 96 schools, PWCS is an efficient and well-managed organization of more than 11,000 employees.
Eight elected School Board members govern PWCS. Each member serves four-year terms. One member represents each of the county’s seven magisterial districts with the chairman serving at-large. The School Board is charged by Virginia law and the regulations of the Virginia Board of Education to establish guidelines and rules that guide the proper administration of the county’s school programs.
The Superintendent works closely with the Deputy Superintendent and the associate superintendents to oversee the day-to-day operations of the schools and support services. Principals and support department heads report to the associate superintendents.
The School Division operates under a site-based management philosophy. Schools and departments have significant authority to plan and budget resources to meet the Division’s goals and objectives. Each school and department is accountable for successfully meeting goals and objectives.
leaders also connect the improvement plans for their offices and staff to the Strategic Plan.
School leaders develop their individual School Improvement Plans based on an analysis of their data and in collaboration with their School Advisory Councils. Using the Plan-Do-Study-Act planning cycle, principals and leadership teams conduct root cause analysis and needs assessment and set targets accordingly at the school level. School Improvement Plans are reviewed annually by the level associate superintendents. These plans are currently completed using the Adaptive System of School Improvement Support Tools (ASSIST), a web-based tool that PWCS uses as part of the continuous improvement and external accreditation process with AdvancED. An annual report on the progress made toward the goals of the Strategic Plan is presented to the School Board at a public meeting and then published on the PWCS website.
Citizens
Superintendent
DeputySuperintendent
Human Resources
School Board
Division Counsel Internal Audit
Communications & Technology
Services
Student Learning &
Accountability Finance &Support ServicesAccountability
English Learner Programs & Services
Student Management & Alternative Programs
Professional Learning
Special Education
Student Learning
Student Services
Facilities Services
Financial Services
Food & Nutrition Services
Risk Management& Security
Transportation Services
ElementarySchools
MiddleSchools
HighSchools
Communications
Information Technology
Community & BusinessEngagement
Benefits
Human Resources

Prince William County Public Schools - Executive Summary FY 2019 Budget
3
Budget CycleState LawBudget planning is now a year-round activity that includes preparation, adoption, reporting, monitoring, and adjusting. The "Code of Virginia" requires all officers, department heads, offices, divisions, boards, commissions, and agencies to prepare and submit to the governing body an estimate of the amount of money needed during the ensuing fiscal year. By April 1, the governing body must prepare and approve an annual budget for informative and fiscal planning purposes. The budget must contain an itemized and classified plan of all contemplated expenditures, in addition to all estimated revenues and borrowings for the locality. An approved budget and fixed tax rate must occur no later than the date on which the fiscal year begins and published annually on the locality’s website.
Superintendent’s Proposed Budget
The annual budget process commences in the fall of the preceding year with the establishment of a budget calendar that defines timelines including the dates and formats of staff meetings, dates of school and department budget submissions, work sessions, and the public hearings that lead to the final adoption of the proposed budget.
Staff prepares, for the School Board’s consideration, a forecast that serves as a guideline for the Superintendent of Schools and the School Board in preparation of a proposed budget. A Joint Resolution between the School Board and the Prince William Board of County Supervisors (BOCS) supports the PWCS budget development process. In the resolution, the BOCS acknowledges the need for adequate local funding to support the operation of PWCS and the need for a commitment from both Boards to develop “five-year budget plans” to address major issues. Working cooperatively, the School Board and the BOCS agreed to develop and implement five-year budget plans. Under this agreement, the School Division receives 57.23 percent of all general revenues available to the county each year. The Virginia Department of Education (VDOE) also supports the PWCS budget development process. In December, VDOE provides projected state revenues for the coming year based on projected student enrollment. Historical data and information available at the time of budget development provide support for the estimates of all other revenue.
Funds are then allocated to schools and central departments to support budgets for staffing, benefits, materials, supplies, and equipment. These allocations are based upon the number and type of projected students, and are delivered in the form of fixed and per-pupil allocations, replacement
equipment allocations, and supplemental allocations for specific programs. Individual school and department budgets, as well as some central account budgets, comprise the expenditure component of the Superintendent’s Proposed Budget.
Capital needs for the coming year are budgeted within the Construction Fund budget. The development of these budgets is supported by an Infrastructure Task Force and Joint County/School Capital Process Team.
The Infrastructure Task Force is comprised of citizen appointees who work with PWCS staff to review the features provided in new school facilities versus those available in existing schools in order to ensure consistency of educational opportunities provided within the School Division. It is the goal of the Task Force to provide the School Board with high-level recommendations relative to the equity of School Division-provided facilities and infrastructure for the education of students in Prince William County.
The Joint County/School Capital Process Team establishes more frequent contact and collaboration between the Prince William County School Board and the BOCS in order to discuss capital needs, enhance efficiency in planning processes, and improve service outcomes to the community.
Capital needs and the Technology Improvements Plan (TIP) are determined through the development of the Capital Improvements Program (CIP). Annually, the School Board reviews and approves the CIP. Projects required to maintain or to improve instruction are included in the Superintendent’s Proposed Budget. PWCS leadership presents the Superintendent’s Proposed Budget to the School Board in early February.
School Board’s Advertised Budget
The School Board meets with the Superintendent and departments during work sessions in February and March. As required by Virginia law, the School Board and Superintendent conduct a public hearing to obtain comments and recommendations from the public prior to April 1. The School Board presents its advertised budget to the BOCS.
Approved Budget
The BOCS holds budget work sessions and public hearings in conjunction with the School Board and appropriates a budget for the School Division by the end of April. The BOCS and the School Board appropriate the budget either by total amount or by state determined categories. The

Prince William County Public Schools - Executive Summary FY 2019 Budget
4
BOCS has historically appropriated the School Division’s budget by total amount. The School Board may make additional adjustments within fund totals until June 30. An approved School Board document for the fiscal year (July 1 – June 30) is then prepared, published, and distributed.
Budget Implementation
Once the BOCS adopts the budget, it becomes the basis for programs of each school and department during the fiscal year beginning on July 1. Fiscal accountability is at the budget appropriation code level. Budget holders may not expend or encumber more than the approved and appropriated budget authority. Financial and programmatic monitoring of department and school activities occurs throughout the year to ensure compliance. An amendment to the total amount requires approval from the BOCS via a resolution. Budget adjustments within individual funds do not require approval from the BOCS.
Budget ProcessThe budget process provides the capability for central office departments and schools to plan future operations in a manner to best serve the instructional and support needs of students. The budget process is a financial translation of the planning process. The budget process includes the following five basic components:
1. The establishment of an overall Division revenue target.2. The establishment of school allocations based on
projected enrollments and resources.3. The establishment of central office support costs.4. The development of budgets or expenditure plans for
each central office department and school.5. The assembly of individual budgets or expenditure
plans into a comprehensive budget in accordance with anticipated revenues.
An approved chart of accounts supports the development of school budgets. The line item budget proposal includes the anticipated costs for supplies, equipment, services, and salaries. All salaries listed are at the Divisionwide average for each employee classification. In order to develop a school budget, each school is provided with an estimate of the number and types of students to be accommodated, an estimated school resource allocation, a listing of average salaries for each classification of employees, a budget manual, and appropriate budget forms. Within the allocated resources, schools must plan for providing each student with an appropriate educational opportunity based on the needs of each student. Central office budgets adjust to reflect the changes in roles and responsibilities and the functions
assigned to the schools. Additional funding is included in some central office budgets to provide support services for increases in student enrollment.
School and central office budgets are assembled into a comprehensive School Division budget and presented for review and approval. Since allocations are based on projected revenues, some adjustments may be required if these revenues change during the budget process. Budget allocations and school budgets adjust based on the number and types of students enrolled on September 30.
Copyright ASCD

Prince William County Public Schools - Executive Summary FY 2019 Budget
5
Budget CalendarFor reference and planning purposes, below is a timeline outlining the budget process:
September–November Budget holders submit analysis of strategic programs and critical needsFebruary (First Week) Superintendent submits proposed budget to the School Board February (First Week) Budget holders receive allocations, projected student memberships, and budget materials to
complete proposed budget. Budget holders submit proposed budgetsFebruary (Mid-Month) Public Meeting on the proposed budget and Capital Improvements Program (CIP)February (Last Week) School Board work session on the Finance and Support Services, Human Resources, Executive
Administration, and School Board budgetsMarch (First Week) School Board work session on the Student Learning and Accountability, Communications and
Technology Services, Elementary School, Middle School, and High School budgetsMarch (Mid-Month) Work session/mark-up session on budget. Public Hearing/School Board approves budget and
submits to the Board of County SupervisorsApril (Last Week) Final date for Board of County Supervisors to approve School Board budgetMay (First Week) Budget holders receive allocations per School Board approved budget in order to complete
approved budgetsMay (Second Week) Budget holders submit their approved budgetsJuly 1 Beginning of Fiscal YearOctober Budget holders receive revised allocation based upon September 30 student membership Budget Office staff adjusts all budgets according to revised allocations

Prince William County Public Schools - Executive Summary FY 2019 Budget
6
Allocation of Human and Financial ResourcesIn order to allocate sufficient funds to each school and central office department, it is imperative that projections for the September 30 student membership are calculated. The forecasting methodology used to predict the number of students who enroll in PWCS is a combination of enrollment forecasting methods and attendance boundary analysis performed by the Office of Planning and Financial Services. PWCS receives funds through a variety of revenues to include federal, state, county, and local sources. In the fall of each year, estimates projecting the amount of expected funds for the next fiscal year occur. From these estimates, the available funding is allocated to each agency (school and central office department), then adjusted accordingly as information is updated at key points during the year.
To achieve equity, salaries exhibited are at the Divisionwide average and dealt with in terms of averages at the agency level only. The centrally administered budget demonstrates basic costs not related to a single agency. Although sometimes weighted by instructional need, the assignment of funds to agencies occurs on a per-pupil basis.
Both the State Board of Education and the School Board determine staffing ratios for schools. The Division has established the funding for staff ratios as follows:
• Kindergarten – Grade 3: 24:1• Grades 4 – 5: 25:1• Grades 6 – 8: 21:1• Grades 9 – 12: 21.3:1
PWCS recognizes that in some special situations a smaller class size needs consideration.
Divisionwide average salary for each position dictates the allocation of funds to agencies. All agencies (except grants) are required to budget using the Divisionwide average salary. By dealing only with average salaries, agencies can achieve synthesized staffing units of equalized value throughout the School Division. This method avoids issues of educational preparation, seniority, and wage levels of staff members assigned to each agency.
The basis of the allocation formula is on “average” program requirements; therefore, the funding received by the agency for a specific program may be slightly more or slightly less than needed; however, the “law of averages” states over-funded programs should offset the under-funded programs and the total agency allocation should be sufficient to fund all programs.
As the student body regulates, “Weighted-Student” index involves review and update. In short, a factor of 1.00 for a regular elementary school level student establishes a proportional ratio or index for all other student levels.

Prince William County Public Schools - Executive Summary FY 2019 Budget
7
Financial Section - Financial OrganizationThe budgeting and accounting systems of PWCS are organized and operated based on self-balancing accounts, which are comprised of assets, liabilities, fund balances, revenues, and expenditures. The School Division allocates and accounts for resources in individual funds based upon the purpose for which they are spent and the means by which spending activities are controlled. The School Division has three major kinds of funds outlined below:
Fund Classification Fund Type Description School Board Fund
Governmental Funds – account for operating and special activities.
Operating The School Operating Fund is the primary PWCS fund and accounts for the revenue and expenditures necessary for the day-to-day operation of PWCS. This fund accounts for all allocated financial resources except those accounted for in another fund as required.
001-Operating Fund
Debt The Debt Service Fund accounts for the transfers of funds, primarily from the coun-ty’s general fund, for the payment of general long-term debt principal and interest.
004-Debt Service Fund
Capital Projects
The Construction Fund accounts for restricted or assigned financial resources used for the acquisition, construction, or repair of PWCS major capital facilities.
007-Construction Fund
Special Revenue
Special Revenue Funds account for proceeds of specific revenue sources, other than ma-jor capital projects, in which expenditures are restricted for a specified purpose.
010-Food Services Fund018-Kelly Center Cafeteria Fund018-Facilities Use Fund
Proprietary Funds – account for business type activities.
Enterprise Enterprise Funds report any activity for which a fee occurs to an external user for goods or services.
024-School Age Child Care Program Fund 028-Aquatics Center Fund
Internal Service
Internal Service Funds report any activity that provides goods or services to other funds, departments, or agencies of the pri-mary government, or to other governments on a cost-reimbursement basis.
015-Distribution Center Fund 020-Imaging Center022-Self-Insurance Fund 023-Health Insurance Fund
Fiduciary Funds –account for resources held for others by PWCS as an agent or trustee.
Trust Trust Funds are custodial in nature and do not involve measurement of results of operations.
025-Regional School Fund 027-Governor’s School @Innovation Park Fund

Prince William County Public Schools - Executive Summary FY 2019 Budget
8
Revenue Highlights
• Total operating revenue will increase by about $37.9 million or 3.6 percent.
• County revenue to the Operating Fund will be about $18.2 million more than FY 2018 for an increase of 4.0 percent.
• State revenue will be about $19.6 million more than FY 2018 for an increase of 3.8 percent.
• Federal revenues reflect program estimates.• An increase of the use of beginning balance by
$3.4 million for one time expenditures in FY 2019.Cost Saving Actions
• Budget reductions of $2.2 million were required in order to balance the annual operating budget.
Expenditure Highlights
• 418 additional students over the FY 2018 budget at a cost of $8.2 million. Growth rates over the last several years have slowed from a range of 2 to 3 percent to approximately 1 percent. FY 2017, however, showed an up-tick in the growth rate resulting in 704 more students than expected. In 2018 there were 775 fewer students than expected. As a result, Division staff is monitoring enrollment changes very closely.
• Opening of the Independence Nontraditional School and startup funding for the new "Prince William Parkway" elementary school. There will be additions at Pattie Elementary and Lake Ridge Middle Schools. The Division
will also be commencing additions at Antietam, Lake Ridge, Springwoods, Leesylvania, and Minnieville Elementary Schools, as well as Stonewall Middle School
• An overall 6.6 percent increase in health insurance costs.• The Virginia Retirement System (VRS) employer rates
decreased from 16.32 percent in FY 2018 to 15.68 percent in FY 2019.
• Increase in debt service of $6.6 million.• Partial restoration of economically disadvantaged money
to all grade levels. This restoration adds approximately $1.5 million back to school's budgets to help fund services, that were reduced during the great recession, for economically disadvantaged students. While this restoration is very good news, the Division is still funded at half the level it was prior to FY 2007.
• Funding for middle and high school athletic trainers.• Increases for legal expenditures.• Increases for a School Board parliamentarian• Startup costs for 10 half-day pre-kindergarten programs to
be located at Washington Reid.• Funding for a new talent management system that will
make the efforts of managing human resources in the Division far more efficient and effective.
• The addition of two 195 day social workers, one mental health specialist, and one 195 day special education psychologist.
FY 2018 FY 2019 Change Percent
County 459,965,730 478,167,603 18,201,873 4.0%
State 511,507,537 531,145,227 19,637,690 3.8%
Federal 42,196,319 38,121,179 -4,075,140 -9.7%
Other 6,096,038 6,807,395 711,357 11.7%
Beginning Balance 23,013,491 26,439,634 3,426,143 14.9%
Total 1,042,779,115 1,080,681,038 37,901,923 3.6%
“This budget includes a 2.7 percent step increase. Overall health insurance rates will increase by 6.6 percent.”
Operating Fund at a Glance
FY 2019 Operating Budget at a Glance

Prince William County Public Schools - Executive Summary FY 2019 Budget
9
Operating Fund Revenue and Expenditures at a Glance
County Transfer: Includes real estate, personal property, BPOL, utility, and local sales taxes.
State Aid: Primarily includes Standards of Quality funding.Sales Tax: One and one-eighth cent of the state sales tax designation for education.Federal Aid: Includes Impact Aid, IDEA, and categorical grants.Other: Includes student fees and out-of-county tuition.Beginning Balance: Includes funds set aside in prior years to support ongoing reserve funds.
Instruction: Includes costs associated with providing instructional programs.Transportation: Includes bus driver salaries, replacement buses, new buses, bus operations, and maintenance.Facilities Services: Includes costs related to the operation and maintenance of school buildings and equipment.Central Support: Includes costs associated with support services for finance, personnel, data processing, purchasing, and central administration.General Reserves: Includes funds set aside for unanticipated costs.
7.70%7.22%
6.01%
0.67%
78.40%
Where it goes...
Instruction
Facilities ManagementCentral Support
Transportation
Reserves
44.25%
2.45%
40.56%
0.63%8.58%
3.53%
Where it comes from....
County Transfer
State Aid
Beginning Balance
OtherSales Tax
Federal Aid
Prince William County Public Schools - Executive Summary FY 2019 Budget
10
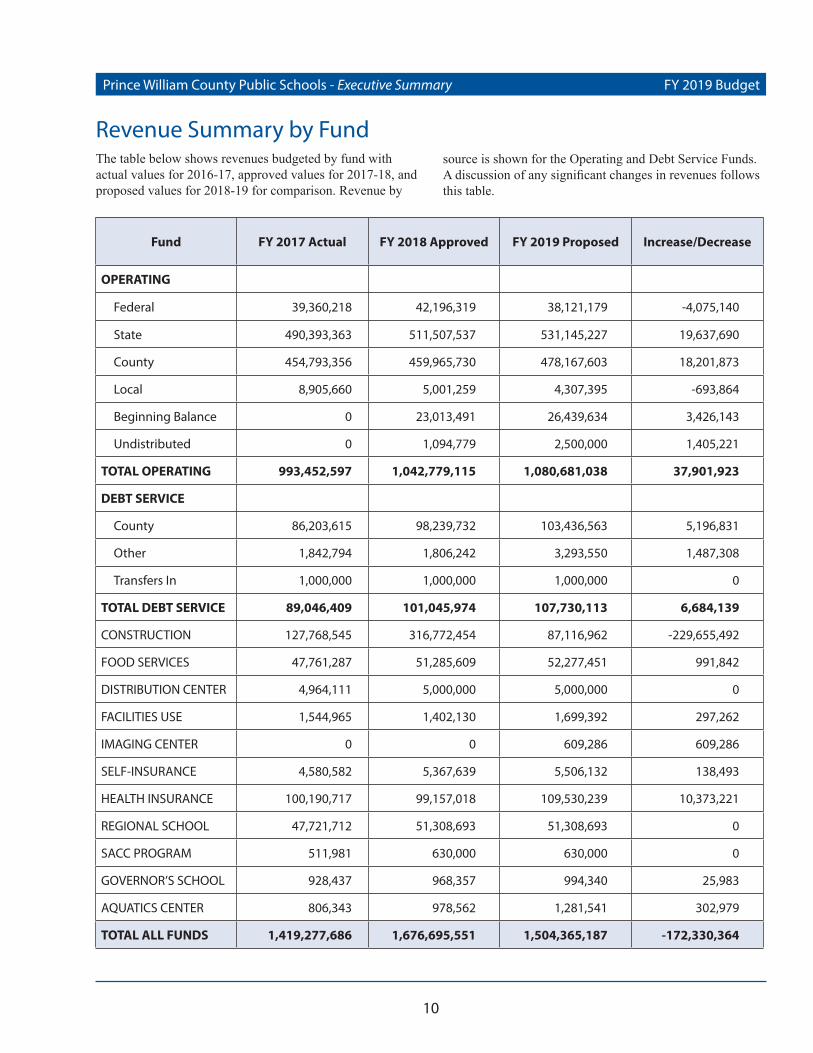
Revenue Summary by FundThe table below shows revenues budgeted by fund with actual values for 2016-17, approved values for 2017-18, and proposed values for 2018-19 for comparison. Revenue by
source is shown for the Operating and Debt Service Funds. A discussion of any significant changes in revenues follows this table.
Fund FY 2017 Actual FY 2018 Approved FY 2019 Proposed Increase/Decrease
OPERATING
Federal 39,360,218 42,196,319 38,121,179 -4,075,140
State 490,393,363 511,507,537 531,145,227 19,637,690
County 454,793,356 459,965,730 478,167,603 18,201,873
Local 8,905,660 5,001,259 4,307,395 -693,864
Beginning Balance 0 23,013,491 26,439,634 3,426,143
Undistributed 0 1,094,779 2,500,000 1,405,221
TOTAL OPERATING 993,452,597 1,042,779,115 1,080,681,038 37,901,923
DEBT SERVICE
County 86,203,615 98,239,732 103,436,563 5,196,831
Other 1,842,794 1,806,242 3,293,550 1,487,308
Transfers In 1,000,000 1,000,000 1,000,000 0
TOTAL DEBT SERVICE 89,046,409 101,045,974 107,730,113 6,684,139
CONSTRUCTION 127,768,545 316,772,454 87,116,962 -229,655,492
FOOD SERVICES 47,761,287 51,285,609 52,277,451 991,842
DISTRIBUTION CENTER 4,964,111 5,000,000 5,000,000 0
FACILITIES USE 1,544,965 1,402,130 1,699,392 297,262
IMAGING CENTER 0 0 609,286 609,286
SELF-INSURANCE 4,580,582 5,367,639 5,506,132 138,493
HEALTH INSURANCE 100,190,717 99,157,018 109,530,239 10,373,221
REGIONAL SCHOOL 47,721,712 51,308,693 51,308,693 0
SACC PROGRAM 511,981 630,000 630,000 0
GOVERNOR’S SCHOOL 928,437 968,357 994,340 25,983
AQUATICS CENTER 806,343 978,562 1,281,541 302,979
TOTAL ALL FUNDS 1,419,277,686 1,676,695,551 1,504,365,187 -172,330,364

Prince William County Public Schools - Executive Summary FY 2019 Budget
11
Revenues – Operating/Debt
PWCS receives revenue to support the Operating and Debt Service Funds from three primary sources: funds transferred by the BOCS, state aid, and federal aid. Additionally, summer school, adult education, other fees, and nonresident tuition accounts for a small amount of revenue. PWCS does not have taxing authority.
The FY 2019 county revenue forecasts, developed 12 months ago during the FY 2018 budget deliberations were the forecasts used to build this budget. State, federal, and local revenues were developed as they have been in prior years.
In FY 2019, it is projected PWCS will receive about $1.19 billion to support the School Division’s Operating and Debt Service Funds. This represents an increase of about $44.6 million or 3.9 percent more than budget estimates for FY 2018.
County Funds$583.7 million; $31.5 million more (5.7%)
Real property, personal property, and local sales taxes are the primary revenue sources for Prince William County. The BOCS approves a transfer to PWCS to finance much of the Operating Fund and the payment of debt service. Through a joint resolution, the School Board and BOCS agree that the School Division receives 57.23 percent of the general revenues available to the county in FY 2018. Based on revenue estimates developed during the FY 2018 budget process for FY 2019, the county transfer to the School Division is about $583.7 million. These numbers were developed as part of last year’s Five-Year Plan. About $478.2 million is to support the Operating Fund. The remaining $103.4 million is for the Debt Service Fund to pay debt service for previous and new school construction and capital improvement bonds.
FY 2018 FY 2019 Change Percent Change
County 552,205,462 583,697,716 31,492,254 5.7%
Proffers 6,000,000 0 -6,000,000 -100.0%
State 511,507,537 531,145,227 19,637,690 3.8%
Federal 42,196,319 38,121,179 -$4,075,140 -9.7%
Other 8,902,280 9,007,395 105,115 1.2%
Beginning Balance 23,013,491 26,439,634 3,426,143 14.9%
TOTAL 1,143,825,089 1,188,411,151 44,586,062 3.9%
Operating Fund & Debt Service Fund
County Proffers$0 million (moved to the Construction Fund)
Prince William County integrates developer contributions, or proffers, into the Construction budget. Proffers are contributions of land, capital improvements, and funding (monetary proffers) received from developers to help address the increased demand for community services created by new development. The inclusion of identified monetary proffers into the funding source for the construction budget reduces the level of general tax support that must go to support capital projects, freeing up this funding for other use. In FY 2019, this proffer funding will be recognized directly in the Construction Fund eliminating it from inclusion in the Operating Fund budget. This funding is subject to new legal requirements and will likely be decreasing over the next few years.
State Aid$531.1 million; $19.6 million more (3.8%)
State revenue includes two forms of funding: state aid and sales tax. State aid includes funding for basic aid to support the Standards of Quality (SOQ) and categorical aid for special programs and initiatives. Since the state operates under a biennial budget, state aid generally calculates for a two year period. FY 2019 is the first year of the biennium and, therefore, adjustments are made resulting from the re-benchmarking process, as well as for increases in enrollment. In the first year of a biennium, state revenue adjustments include updating SOQ amounts to reflect the prevailing costs for providing these services. State funding usually increases significantly in the first year of the biennium, while second year increases are limited to funding additional students.

Prince William County Public Schools - Executive Summary FY 2019 Budget
12
In the first year of the 2018-2020 Biennial Budget, (FY 2019) PWCS will receive about $531.1 million in state funding, an increase of $19.6 million. About $92.8 million of this amount is the School Division’s share of the one and one-eighth percent sales tax collected to support public education. While the state continues to provide funding from lottery proceeds, a reduction in funding has occurred. Most state funding for capital projects, used historically by the School Division to fund school renewals and renovations, has been eliminated.
For years, the state has attempted to distribute aid to education equitably by recognizing that some localities are more able to fund education than are others. This approach, known as equalization, applies a factor to adjust a locality’s state aid reimbursement to reflect the locality’s ability to pay for education. The factor, called the Local Composite Index (LCI), combines three separate measures of local fiscal capacity (assessed value of real property, adjusted gross income, and taxable retail sales) into a single index. Those school divisions with a low LCI receive the greatest amount of state aid per pupil while those with a high index receive less state support. The state minimum LCI is 0.2000 and the maximum is 0.8000. In FY 2019, the LCI for PWCS will be 0.3783. This means that Prince William County is required to pay about 37.8 percent of the cost of the minimum educational program set by the state SOQ. It is important to note that every school division, even the poorest, significantly exceeds the state minimum SOQ program requirements.
For the 2018-20 biennium, the LCI for PWCS will decrease from .3848 to .3783. This amounts to a relative increase to PWCS of approximately $3.5 million. The LCI ties to real estate values and the county has seen dramatic decreases in values in the past relative to the rest of the state. Residential property values in Prince William County have stabilized and have begun to increase. As a result, the LCI for PWCS will most likely increase in the future, resulting in decreased funding in the state formula.
Cost Of Competing Adjustment (COCA), Support Cap, and Inflation Factor
Over the past few years the General Assembly has made several decisions that affect the revenues that come to PWCS from state sources. These decisions occurred in the interest of balancing state budgets during, and just after, the great recession.
Most recently, the elimination of the COCA for support positions resulted in a funding reduction of $3.4 million to PWCS. Since the 1980’s, and as a part of the state funding formula, COCA and the resulting funds are built into the salary structure of the School Division. The COCA provides additional state funding to help school divisions in the higher cost Northern Virginia area, compete in the local labor market for support positions including security staff, bus drivers, custodians, HVAC mechanics, electricians, secretarial staff, accounting staff, administrative staff, technology support staff, etc. To some extent, COCA partially offsets another part of the state funding formula whose methodology underfunds salaries for Northern Virginia. Over the past three years, the elimination of COCA for support staff has cut $12.87 million for PWCS schools.
The General Assembly directed the Joint Legislative Audit Review Committee (JLARC) to assess COCA and provide a report prior to the opening of the 2013 General Session. Upon its completion, the JLARC report validated the use of COCA. However, this report also provided recommendations for changing the distribution of funds amongst the affected localities. Despite the JLARC validation of the underlying premise of COCA, the state budget for FY 2015 eliminated the funding for support staff.
The state budget also eliminated inflation factors from the non-personal component of Basic Aid for the 2014-16 biennium. Typically, as part of the biennial re-benchmarking process, the Department of Education updates non-personal inflation factors to adjust base year non-personal expenditures for inflation up to the start of the new biennium. This cut amounts to about $2.84 million to PWCS.
Finally, there was an adjustment to the state budget for FY 2015 that increases the ratio used in the support positions cap from 4.07:1 to 4.09:1. This saves $2.9 million statewide and costs PWCS approximately $175,000.
$4,000
$4,500
$5,000
$5,500
$6,000
$6,500
2012 2013 2014 2015 2016 2017 2018 2019
Enrollment Data is Actual Enrollment 2012-2017 & Estimated 2018-2019
State and County Per Pupil Funding by Fiscal YearState County

Prince William County Public Schools - Executive Summary FY 2019 Budget
13
Recent state level cuts amount to about $1.6 billion over a biennial period amounting to about $800 million per year, $683 million of which is in the SOQ. PWCS is generally about 6 percent of total state SOQ dollars. Therefore, PWCS lost a total of approximately $40.1 million annually because of these cuts.
As Virginia begins to recover from a long period of stagnant/moderating growth, and as revenue streams to the state recover, a reversal of previously necessary budget cuts over the past several years must occur.
Northern Virginia Regional Special Education Program (NVRSP)
Over 40 years ago (1977 General Assembly authorization) the Virginia Department of Education (VDOE) implemented regional special education programs. The purpose of these programs was to provide a mechanism to allow school divisions to cooperate and share resources to provide services to students with low incidence disabilities. The authorized disabilities for state reimbursement include: emotional disability, autism, multiple disabilities, hearing impairment, deaf/blindness, and traumatic brain injury. Enrollment in programs for students with autism spectrum disorder have increased by approximately 9.8 percent annually since fiscal year 2011. Other issues related to this topic are listed below.• State funding for the 11 regional programs that serve fewer
than 60 divisions state-wide is approaching $90 million in the coming fiscal year. Growth in these programs, combined with the pressure from non-participating divisions, has caused the VDOE to review the structure and purpose of these regional programs.
• PWCS currently enrolls just under 30 percent of the total regional programs' students state-wide.
• Changes are very likely that will impact revenues in FY 2018 and future years.• The total amounts that may be lost to PWCS could be
as much as $15 million to $19 million over the next five years.
• FY 2019 reductions may be as much as $3 million. This reduction has been taken into account when developing the FY 2019 revenue budgets.
• Staff continues to monitor developments regarding this revenue stream.
Federal Aid$38.1 million; $4.1 million less (-9.7%)
Federal aid derives from various entitled federal programs, specific grants, and Impact Aid. With the exception of Impact Aid, federal revenues are generally categorical and expended for specific purposes according to established
statutes and regulations. Federal funds supplement the costs of providing instructional services for students in vocational education, adult education, special education, and programs for educationally and/or economically disadvantaged students. In FY 2019, PWCS will receive about $38.1 million in “traditional” federal funding. This represents a decrease of about $4.1 million in federal grants for specific programs. The basis for a decrease in federal funding is from program estimates. The most significant decrease of approximately $4.8 million occurs within the Title I grant that funds programs for students from low-income families to help ensure all children meet the challenging state academic achievement standards. While this reduction is large ($4.8 million), the actual reduction to the programs in FY 2019 will only be $1.7 million. FY 2018 was budgeted with the expectation that there would be a much larger increase than was actually realized. Approximately $3.1 million in Title I programs were never implemented because staff became aware of the reductions in FY 2018 before programs were implemented. Other significant changes include an increase of $0.34 million for the 21st Century grant—a grant that provides support to after school programs in the Division. Title VI-B, a grant that funds programs for students with disabilities, will experience an increase of $.24 million
Other Revenue$9.0 million; $.10 million more (1.2%)
FY 2019 projects about $9.0 million in available revenues from various other sources. These include fees for student parking, tuition for adult education classes, summer school, investment income, revenue from small grants and awards, savings from the prior year, and some revenues related to debt service.
Because of the time lapse between the sale of construction bonds and the actual expenditure of the proceeds from the sale, investment interest is earned on the bond proceeds and placed in a capital reserve fund. About $1.0 million in interest from school construction bonds is available to offset the payment of debt service in FY 2019.
The budget also includes $2.5 million in an undistributed category. This provides budget capacity for revenue from various unbudgeted grants that individual schools or the School Division might receive during the fiscal year.
A beginning balance of $26.4 million is also budgeted. The Division has saved these funds from prior years. The School Division’s Five-Year Plan manages the budget impact of these one-time funds, and their impact on revenues in future budgets. These revenues help support reserves representing about one percent of the proposed operating budget and are the only funds available to cover student membership

Prince William County Public Schools - Executive Summary FY 2019 Budget
14
most significant of these issues is the continued growth in student enrollment during a period of slow economic recovery and limited revenues. Revenue is on a per pupil basis to enable effective comparisons between the trends for the state, county transfers to the Division, and enrollment growth. This graphical data illustrates that substantial reductions have occurred to balance budgets. The impact of these reductions in funding and the slow extent that they are recovering relative to the continued increase in enrollment is negative for both the classroom and the county. The chart below includes state and county revenue only and represents approximately 94% of total revenues for the School Division.
increases greater than projected or unexpected revenue shortfalls. This budget has no other increases in general fees and does not add additional fees to support budget reductions.
Revenues — Other FundsPWCS will increase breakfast and lunch prices by five cents for FY 2019.
In FY 2019, the Division will split the Imaging Center out of the Operating Fund and create a new internal service fund to track the financial results of the Imaging Center operation. This will increase transparency and enhance the Division's ability to manage this operation. The Imaging Center and the Imaging Center Fund provide support to the Division by providing printing services and other document production services. In prior years, internal transactions were treated as expenditure credits (reductions of expenditures) to the Imaging Department within the Operating Fund. In the future, these transactions will be treated as expenditures to the Operating Fund and revenues to the Imaging Center Fund. This will create a one time increase to total Division revenues.
The Construction Fund can have large swings in revenues (and expenditures) that are a result of timing of projects. During FY 2019 the Construction Fund will experience a revenue reduction that approaches $230 million. This is a function of projects in the CIP.
Revenue and Enrollment Trends
The charts below are indicative of the fact that the School Division continues to face fiscal challenges. One of the
76,000
78,000
80,000
82,000
84,000
86,000
88,000
90,000
92,000
$4,000
$4,500
$5,000
$5,500
$6,000
$6,500
2012 2013 2014 2015 2016 2017 2018 2019
Per Pupil Dollars vs. Total Student Enrollment
Revenue and Enrollment TrendsFY 2012 - FY 2019
State County Enrollment
Copyright ASCD

Prince William County Public Schools - Executive Summary FY 2019 Budget
15
Fiscal Year 2019 Proposed Budget
FY 2018 Approved Expenditures for Operating and Debt Service Funds $1,143,825,089Expenditure Changes for FY 2019
Baseline Adjustments $563,798Baseline Adjustments, Elimination of One-Time Costs $3,460,572Restore Holdback Allocation Reserve $2,673,986Reclassification of Nurses $840,000Actuary Adjustment to GASB 45 Funding $800,000Inflation (2.0%) on Supplies, Materials, Equipment $1,146,658State Reduction for Regional Special Education Program -$3,000,000Adjustments in Grants & Self-Supporting Programs -$5,357,418
Compensation $10,851,598Step Increase (2.7% Cost Increase) $20,087,768Reclassifications (Salary Study) $151,644Slippage in Compensation (Salary Vacancy Factor Plus Impact of Turnover) -$12,043,884Adjustment to Supplemental Pay Rates (2%) $105,954Adjustment for Substitutes/Temporary Pay Rates $561,012Virginia Retirement System (VRS) Rate Decrease 0.67% (17.55%=>16.88% ) -$4,160,929Short/Long Term Disability Costs (VRS Hybrid Requirement) $1,512,824Health Insurance Rate Adjustment (6.6% Increase) $4,637,209
New Students & Schools $18,305,598Funding for New Students (1,193 prj - 775 = 418) $8,190,787Startup Costs for New School - "PW Parkway" Elementary School (ES) $443,000Net Increase for Independence Nontraditional School (Total: $11,127,296) $2,317,216Restore 2 ITC positions from Independence Nontraditional School Conversion $185,436Net Increase to Transportation Costs for Independence Nontraditional School (Total: $1,764,033) $485,020Debt Service Net Increase $6,684,139
School Repairs & Renewals $500,000CIP - Increase Technology Improvement Projects (TIP) Funding $500,000
New Resources $16,571,357Maintain PWCS Regional Special Education Programs $3,000,000Economically Disadvantaged Funding K-12 (Remediation; Class Size Reduction) $1,522,911Preschool Teachers 5.0 FTE $475,122K-3 Class Size Grant Adjustments and Expanded Class Size Reduction (+16 classes) $1,445,576Infrastructure Task Force - ES Security Improvements (One-Time) $742,000Gifted Program Enhancements $414,348Additional Testing (AP, IB,…) Costs due Increased Participation $350,000Dance - Choreography, Master Classes (One-Time) $90,000Robotics VEX Equipment (One-Time) $30,000Mental Health Specialist 1 FTE $106,040Special Education School Psychologist 1 FTE $92,209School Social Workers 2 FTE $184,418Student Learning - Academic Improvement Support $25,475Instructional Coach 1 FTE $101,430HS Athletic Trainers 6 FTE; includes One-Time $120K $672,215MS Athletic Trainers Contract $180,143Language Arts Admin Coordinator 1 FTE $146,236HR - Employee Evaluation System Acquisition & Implementation (One-Time) $449,402HR - Employee Evaluation System 1 FTE $365,499School Board Parliamentarian $35,483Legal Services Cost Increases $250,000Summer Law Intern $10,008School Board Member Discretionary Funds (Approx. $1,000 per Member) $8,189Increased Cost of Information Technology Contracts (Includes 10G Upgrade) $2,189,913Mandated Web Accessibility 1 FTE $169,329Division Network Support 1 FTE $138,457Storm Sewer Systems Mandate 1 FTE $94,103Restoration of Funding for 7 & 14 Year School Maintenance including 0.5 FTE Gr 11 250 day $1,160,191Supervisor Elementary Personnel 1 FTE Support Costs $184,849Title IX Compliance Officer (Admin Coord Gr 14 250 Day) $138,134Transportation Lead Dispatcher 1 FTE $77,433Division Bookkeeper Support 1 FTE $90,366Fields/Grounds Contract to Enhance School Opening (One-Time) $100,000Accountability - Support for Ongoing Strategic Planning $25,475Educator Rising Supplement ($500 + FICA for 12 HS) $6,403Additional High School Artificial Turf Stadium Field - Stonewall HS (One-Time) $1,500,000
Reductions -$2,206,289Conclusion of Energy Management Contract -$2,206,289
FY 2019 Projected Expenditures $44,586,062 $1,188,411,151FY 2019 Projected Revenues (Operating & Debt Service) $44,586,062 $1,188,411,151Estimated FY 2019 Surplus/(Deficit) $0
Debt Service Fund $107,730,113Operating Fund $1,080,681,038

Prince William County Public Schools - Executive Summary FY 2019 Budget
16
Baseline Adjustments$0.6 million
Baseline adjustments represent the costs of personnel, materials, equipment, and services to continue current programs and services in FY 2019. This normally includes increases in selected accounts for inflation, adjustments in other accounts to reflect the cost of doing business, and the elimination of nonrecurring costs budgeted in previous years.
Baseline adjustments include such items as updating schools for replacement equipment funding based upon the passage of another year, adjusting the K-3 class-size costs because of the change in the LCI, and school level staffing to remain in compliance with state staffing standards for Instructional Technology Coaches (ITC).
Salary and Benefits
The budget baseline has been adjusted to reflect approximately $6.9 million recognized because of the distribution of average salary and benefit costs fromFY 2018.
Inflation, Adjustments, and Replacements
This year there was an increase to school and departments budgets for inflation related to supplies, materials, and equipment. Funding has been provided to adjust for programmatic changes in replacement equipment and vehicles based on a 14-year schedule. This budget supports the replacement of 100 buses, six trucks, and seven cars. The replacement schedule for buses, was “flattened” in the FY 2016 budget process to smooth out the requirement to replace buses making the funding requirements easier to accommodate. A reduction occurred for the FY 2016 replacement number from the original amount of 151 in the proposed budget to 100 in the adopted budget. A modification to 100 replacements in each year occurred for FY’s 2017, 2018, and 2019. The number of required bus replacements will decrease naturally moving into future years.
Grants and Self-Supporting Programs
Grants and self-supporting programs are required to operate within the revenues available for these programs. Revenues for these programs will decrease by about $4.6 million in FY 2019 primarily due to general increases in funding for federal programs. The most significant decrease is funding for Title I. This budget includes about $48.5 million in revenues and expenditures for grants and self-supporting programs.
New Students and Schools$18.3 million
The FY 2019 budget includes about $8.2 million for per pupil allocations to schools and central support services to maintain current programs and services for the 418 new students projected in enrollment since the FY 2018 Approved Budget.
In September 2018, the School Division will open the new Independence Nontraditional School. The Construction Fund Budget provides funds for outfitting this facility and addresses the capital needs of the new school. The School Division provides initial operating funds for basic start-up costs such as staff (principal, bookkeeper) to facilitate the opening of the school and assist with the purchase of textbooks, library books, and other consumable supplies.
The Debt Service Fund expenditures will increase by $6.7 million over the FY 2018 Approved Budget. The increase is the difference between the debt service on bonds for new schools and the interest and principal retired on previous construction bonds.
Funding is included for the debt service for Virginia Public School Authority bonds issued in the spring of 2018 for the costs associated with funding for the construction of the new Independence Nontraditional School, the new PW Parkway Elementary School, the addition at Patti Elementary School, and the renovation at Washington Reid.
Funding is also included for debt supporting additions at Antietam, Lake Ridge, Springwoods, Leesylvania, and Minnieville Elementary Schools as well as, Stonewall Middle School. Also funded are the Western Bus Facility, and renewals at Leesylvania, Marshall, and Montclair Elementary Schools and funding for the 13th High School.
Other items funded here include transportation related to new schools and two ITC positions.
ExpendituresInstruction vs. Support
Schools &Instructional
Programs78%
Central Office & Support Services
22%

Prince William County Public Schools - Executive Summary FY 2019 Budget
17
Compensation$10.9 million
Salaries
Historically, salary increases occur in order to remain competitive in the Northern Virginia job market. This includes adjustments to the salary scale in the form of cost-of-living increases and salary-step increases. The current average step increase for eligible employees is about 2.70 percent each year it occurs until the employee reaches the top of the salary schedule. Only about one percent of employees are currently at the top of their pay scales.
This budget supports a step increase for eligible employees. Each one percent of salary and benefits costs about $7.5 million.
Several factors contribute to a “slippage” in the costs for providing step and salary scale adjustments each year. Slippage is the difference between the calculated cost of compensation and the actual cost. The Retirement Opportunity Program, salary placement policies, and the length of time positions are vacant all contribute to the actual cost for compensation being less than the calculated cost. Historically, the actual slippage in compensation has averaged about three percent of total compensation. The amount of slippage is also a function of the pay increases from the prior year. Typically, the amount of slippage realized decreases as pay raises decrease. The slippage from FY 2019 projects to be less than the historic norm. This is due to a higher retention rate of employees and a decrease in the rate of retirements. Therefore, the estimated slippage for next year has been budgeted at about 1.0 percent of estimated compensation. This means that $7.5 million may reduce the effective cost for the pay raise.
The Commonwealth of Virginia has required a shift in costs for the Virginia Retirement System (VRS). Over five years, starting in FY 2013, the School Division shifted costs from the employer to the employee in an amount equal to five percent of salary. The state also required that the School Division provide an offsetting pay raise for each one percent of cost that shifted. This is the second year in which there is no cost shift. The full five percent is now being paid by the employee.
Benefit Programs
In FY 2019, the average cost of benefits for a typical employee will be about 39.02 percent of salary. VRS costs are projected to decrease by $4.2 million due to the rate decrease from 16.32 percent in FY 2018 to 15.68 percent in FY 2019. The state group life insurance (GLI) rate is 1.31.
Health insurance premiums project to increase overall by 6.6 percent. The PWCS average increase for the past five years has been half the national average; increases in utilization are still the primary issue driving the cost increase this year. The rates also increased to offset mandatory fees required by the Affordable Healthcare Act.
School Repairs & Renewals$0.5 million
It is customary to fund a portion of an organization’s Capital Improvement Plan (CIP) with cash from the Operating Fund—sometimes referred to as “cash to capital” or “cash funding capital projects.” Cash to capital is one of the items that the three rating agencies typically look at to help determine the financial health of an organization.
In FY 2018, the Operating and Food Service Funds were budgeted to contribute approximately $8.7 million, in the form of a cash transfers to the Construction Fund, to support the CIP. $6.0 million in proffer funding also supported the CIP. in 2018
The FY 2019 budget will fund a cash transfer of approximately $18.3 million to support the CIP. PWCS will also use $6.0 million in proffer funding to expand Division capacity. Additional funds will come from the Food Service Fund ($0.50 M) and $19.2 from the sale of debt. Total funds available to support the CIP will be $44.0 million with only $18.3 million coming from Operating transfers.
CIP Technology Improvement Projects (TIP)
This marks the ninth year that there has not been sufficient budget to fund identified technology projects in the CIP. Additional information regarding technology projects is available within the CIP. Funding is needed to support projects such as: continued implementation of the voice over IP telephone system; LAN and WLAN upgrades and replacements; data center and school upgrades and replacements (e.g., servers, back-up systems, storage, disaster recovery); network infrastructure and bandwidth upgrades and replacements; computer refresh implementation; and replacement of the student information system. For the last several years, available end-of-year funds helped to address technology needs partially, including the purchase of additional interactive whiteboards for schools.

Prince William County Public Schools - Executive Summary FY 2019 Budget
18
New Resources$16.6 million
This budget identifies $16.6 million for new resources and allocations to existing programs and services.Additional funding for the following: • $3.0 million to maintain PWCS regional special education programs as state funding is decreased• $1.5 million to partially restore economically disadvantaged funding k-12 (remediation; class size reduction) • $475 thousand to add 5 preschool teachers• $1.4 million for k-3 class size grant adjustments and expanded class size reduction (+16 classes)• $742 thousand for infrastructure task force - es security improvements (one-time money)• $414 thousand for gifted program enhancements• $350 thousand for AP and IB testing increased costs associated with increased participation • $90 thousand for dance - choreography, master classes (one-time)• $30 thousand for robotics vex equipment (one-time)• $106 thousand for one mental health specialist to help meet increasing demands of the division• $92 thousand for one special education school psychologist to help meet increasing demands of the division• $184 thousand for two school social workers to help meet increasing demands of the division• $25 thousand student learning - academic improvement support• $101 thousand for one instructional coach• $672 thousand for 12 half time athletic trainers (includes one-time $120k)• $180 thousand for ms athletic trainers• $146 thousand for one language arts administrative coordinator• $449 thousand for an hr employee evaluation system to improve effectiveness of evaluation processes (one-time) • $365 thousand for staff and ongoing costs for employee evaluation system • $35 thousand for school board parliamentarian costs • $250 thousand for increased legal services cost increases • $10 thousand for summer law intern • $8 thousand for school board member discretionary funds• $2.2 million for increased costs of information technology contracts including the 10g upgrade• $169 thousand for mandated web accessibility• $138 thousand for one division network support person to support increasing division network requirements• $94 thousand for storm sewer systems mandate• $1.2 million for restoration of funding for 7 & 14 year school maintenance including• $184 thousand for one supervisor of elementary personnel including support costs• $138 thousand for one title ix compliance officer• $77 thousand for one transportation lead dispatcher to support increasing demands in transportation• $90 thousand for division bookkeeper support to support bookkeeper transition in schools• $100 thousand to support fields/grounds contract to enhance school opening (one-time) • $25 thousand for accountability - support for ongoing strategic planning• $6 thousand for educator rising supplement• $1.5 million to install a turf field on the Stadium Field - Stonewall HS (One-Time)

Prince William County Public Schools - Executive Summary FY 2019 Budget
19
Energy Initiatives
The School Division engaged a consultant to help with the development of a long-term program to manage the use of energy more effectively. While the contract has expired, The relationship has not. While the Division will no longer be paying the consultant there will be an ongoing relationship and continued collaboration on energy efficiency. This has allowed the Division to recover approximately $2.2 million. This $2.2 million has been dedicated to support the restoration of $1.5 million in funds for economically disadvantages students and $1.1 million for the 7/14 school maintenance programs.
800 MHz Radio Sinking Fund
The proposed sinking fund to save $333,000 a year for the next ten years in order to purchase the next generation of 800 MHz radios remains excluded from this budget. This will be a priority for funding if additional one-time funding becomes available at the end of the fiscal year.
Previous Reductions - FY 2008-14
While this proposed budget does not contain major reductions, it does not restore major cuts incurred in recent
years including, but not limited to:
Reductions of teacher staffing ratios (increases class size)• Middle school $4.3 million• High school $5.3 million• General Teachers $10.3 million• ESOL $5.9 million
Kindergarten Teacher Assistants $2.4 millionTransportation Services $8.7 millionCentral Office $22.8 millionTechnology Improvements $11.3 millionReserves $5.8 millionCapital Projects Deferral $20.8 millionSupplemental Retirement - 403(b) $6.0 millionEconomically Disadvantaged Funding - supported remediation efforts and reduced class sizes $9.2 million School Materials and Supplies $3.0 million
In addition, budgets have been impacted as a result of cost avoidance. For example, in FY 2011 employees did not receive merit or COLA, thus avoiding compensation costs amounting to about $6 million for each percent that might have been provided. From FY 2000 to FY 2007, total raises averaged about 6 percent. Since FY 2008, the average is less than 2.5 percent, resulting in major budgetary savings.
Fiscal Year Budget Comparison for All FundsThe table below includes the total budget by fund showing actual values for 2014-15, 2015-16, and 2016-17, approved values for 2017-18 and proposed values for 2018-19 for comparison.
Fund Actual2014-15
Actual2015-16
Actual2016-17
Approved2017-18
Proposed2018-19
Operating 906,217,008 928,838,089 981,419,084 1,042,779,115 1,080,681,038
Debt Service 77,277,706 84,523,659 89,713,615 101,045,974 107,730,113
Construction 129,861,699 135,579,983 157,703,561 316,772,454 87,116,962
Food Services 40,108,089 43,003,320 46,571,434 51,285,609 52,277,451
Imaging Center 0 0 0 0 609,286
Facilities Use 1,342,208 1,420,009 1,440,894 1,402,130 1,699,392
School Age Child Care Program 607,294 632,120 632,706 630,000 630,000
Distribution Center 4,531,450 4,864,480 4,983,943 5,000,000 5,000,000
Self-Insurance 4,610,286 4,441,268 3,392,836 5,367,639 5,506,132
Health Insurance 86,694,039 90,556,658 94,000,275 99,157,018 109,530,239
Governor’s School @ Innovation Park 796,927 874,846 841,786 968,357 994,340
Regional School 44,992,089 45,902,125 47,530,503 51,308,693 51,308,693
Aquatics Center 0 0 751,000 978,562 1,281,541
Grand Total 1,297,038,795 1,340,636,557 1,428,981,637 1,676,695,551 1,504,365,187

Prince William County Public Schools - Executive Summary FY 2019 Budget
20
School Board FundsOther than the Operating Fund, the budget includes funds for the management of special activities and functions. The FY 2019 budget consists of the fourteen funds under the control of the School Board.
Operating Fund$1,080,681,038; 11,761.07 positionsThis fund provides for the day-to-day operations and maintenance of the schools and is funded primarily by county, state, and federal funds.
Construction Fund$87,116,962; 7.0 positionsThis fund provides for all new facilities and most facility renovations and expansions. Funds are primarily from the sale of bonds.
Debt Service Fund$107,730,113 ; 0.0 positionsThis fund pays principal and interest on bonds and loans sold to finance capital projects in the Construction Fund. County funds almost entirely support this fund.
Food Services Fund$52,277,451; 654.86 positionsThis fund provides for all Food Services’ operating and administrative costs. Food sales and federal/state subsidies primarily support this fund.
Health Insurance Fund$109,530,239; 6.0 positionsThis fund pays claims and related expenses for the health care program. The primary sources of revenue are employer contributions paid by the other funds and employee contributions deducted from employee pay on a semi-monthly basis.
Kelly Center Cafeteria Fund$525,177; 5.0 positionsThis fund provides for the operating costs of the cafeteria in the Edward L. Kelly Leadership Center. The sale of food in the cafeteria and catering primarily support this fund.
Aquatics Center Fund$1,281,541; 5.5 positionsThe Aquatics Center Fund tracks costs associated to the operation of the aquatics center located on the same site as Colgan High School.
Facilities Use Fund$1,174,215; 1.0 positionThis fund accounts for revenues and expenditures collected from the use of schools by non-school organizations. Building rental fees support this fund. Revenue funds the position for managing the program and playground improvements at elementary schools.
Regional School Fund$51,308,693; 4.5 positionsThis fund provides for the operation of the Northern Virginia Regional Program jointly operated by PWCS, Manassas City Schools, and Manassas Park City Schools. Tuition from the three school divisions supports the program that provides certain special education services.
Governor’s School @ Innovation Park$994,340; 8.0 positionsThis fund provides for the operation of the Governor’s School jointly operated by PWCS, Manassas City Schools, Manassas Park City Schools, and George Mason University. The school offers selected juniors and seniors an advanced and intensive program in science, technology, engineering, and mathematics (STEM). Tuition from the three school divisions supports the school.
School Age Child Care Program Fund$630,000; 2.0 positionsThis program provides adult supervised, high quality, affordable, before and after school care by private child-care providers. A flat-fee charged to the providers funds the program oversight.
Self-Insurance Fund$5,506,132; 5.0 positionsThis fund pays claims and related expenses for workers’ compensation and self-insured losses. Transfers from the Operating Fund supports the fund.
Distribution Center Fund$5,000,000; 0.0 positionsThis fund tracks the purchase of warehouse stock items from vendors and the sale of items issued to schools and departments. Revenues and expenses are predominately a result of operations of the warehouse function.
Imaging Center Fund$609,286; 4.0 positionsThis fund tracks the sale, primarily to internal customers, of printed materials and printing services.

Prince William County Public Schools - Executive Summary FY 2019 Budget
21
Five-Year Budget PlanSince it is difficult, if not impossible, to address all county and School Division needs in a single year, a long-term approach to balance expenditures with anticipated revenues must occur. Working cooperatively, the School Board and the BOCS developed and implemented a five-year budget plan. Under this agreement, the School Division will receive 57.23 percent of all general revenues available to the county in FY 2019.
In developing criteria for expenditure projections, service level standards were determined for support and instructional programs. Staffing ratios, current costs, and student membership growth were the basis for service levels. The service level standards break down expenditures into three basic categories: fixed costs not driven by the number of students; per pupil costs for programs directly related to the number of students; and capital projects. Service level standards adjust each year to reflect inflation, compensation changes, and the change in student membership.
The five-year cost of maintaining these service levels for programs, providing for new students and schools, and maintaining competitive salaries and benefits are calculated using assumptions for inflation and growth. Five-year projections are also determined for revenues. The five-year budget plan incorporates these expenditures and revenues to show whether there is a balanced financial plan or not.
What Is Included in the Five-Year Plan?Current Programs and Services• Annual adjustments for new students.• A step or salary scale adjustment for employees
in each year as funding permits.• Funding for the 6,205 new students expected
during the next five years.
Repairs & Renewals• $270.9 million in funding for repairs and
renewals of older facilities.• Funding for the infrastructure needed for
technology improvements (Voice over IP phones, interactive whiteboards, radio upgrades) is inadequate.
• Reduced funding for the three-year renewal cycle of essential technology equipment used for instructional and support programs.
New SchoolsFunding for debt service on $607.4 million in con-struction bonds for new schools and renewals. Also included are start-up costs, and operating costs for new schools and additions:• Two elementary schools, one middle school, and
one high school.
Five-Year Plan Balanced in Accordance with School Board Guidance of September 19, 2012
Expenditure-Revenue Projections FY 2019 – FY 2023($ in millions)
Description FY 2019 FY 2020 FY 2021 FY 2022 FY 2023
Expenditures
Current Programs 1,142.7 1,150.8 1,171.0 1,187.3 1,210.5
New Students 12.0 18.6 27.9 46.1 59.5
Repairs & Renewals 26.5 37.5 38.8 39.6 31.5
New Schools 7.2 5.2 9.3 5.0 17.3
Total Expenditures 1,188.4 1,212.1 1,247.0 1,278.0 1,318.8
Revenues
State/Federal/Other 604.7 607.7 619.5 627.2 645.0
County Transfer 583.7 604.4 627.5 650.8 673.8
Total Revenue 1,188.4 1,212.1 1,247.0 1,278.0 1,318.8
Surplus/(Deficit) 0.0 0.0 0.0 0.0 0.0

Prince William County Public Schools - Executive Summary FY 2019 Budget
22
Informational Section – FY 2019 Trends and Forecasts Student EnrollmentPWCS is the second largest of 132 school divisions in Virginia and the 35th largest school division in the country. The School Division provides services to over seven percent of the state’s student enrollment.
Historical Enrollment Growth
The graph below depicts the 32-year enrollment history and five projected years of PWCS. The School Division has seen steady growth over the last 10 years, at a rate of about 2.15% annually. The calendar year 2017 (FY 2018) enrollment for the School Division was 89,861, a year-over-year growth rate of 1.1%.
Enrollment and Future Projections by Grade Level
Predicting future enrollment is important for long-range planning, budgeting, staffing, and predicting future building and capital needs. The forecasting methodology used to predict the number of students who will be enrolling in PWCS for the next 10 years is a combination of the Housing-Unit method and the Grade Progression Ratio method, along with judgmental adjustment to fine-tune the forecasts. This combination of methods is supported by industry best practices and scholarly literature and is relatively inexpensive to produce.
The table on the following page utilizes the enrollment projection tools to estimate the 2018-19 school enrollments for each grade level in the School Division.
0
20,000
40,000
60,000
80,000
100,000
Enrollment History and Projections

Prince William County Public Schools - Executive Summary FY 2019 Budget
23
To estimate the state revenues and to calculate the school and central office allocations for the FY 2018-19 budget, PWCS used the enrollment of 91,054 students.
Grade Span Grade Actual2016-17
Actual2017-18
Projected 2018-19
Change2018-19
Elementary School 40,569 40,482 40,646 164
K 6,256 6,435 6,504 69
1 6,611 6,548 6,773 225
2 6,778 6,675 6,648 (27)
3 6,783 6,860 6,794 (66)
4 7,071 6,862 6,985 123
5 7,070 7,102 6,942 (160)
Middle School 20,095 20,713 21,169 456
6 6,692 7,086 7,156 70
7 6,839 6,748 7,186 438
8 6,564 6,879 6,827 (52)
High School 26,923 27,261 27,879 618
9 7,514 7,192 7,580 388
10 6,957 7,291 6,998 (293)
11 6,350 6,470 6,807 337
12 6,102 6,308 6,494 186
Special Education 1,333 1,405 1,360 (45)
Total 88,920 89,861 91,054 1,193
Grade Span Projected 2018-19
Projected 2019-20
Projected 2020-21
Projected 2021-22
Projected 2022-23
Elementary 40,646 40,878 41,261 42,012 42,849
Middle 21,169 21,434 21,483 21,504 21,645
High 27,879 28,147 28,677 29,706 30,148
Special Education 1,360 1,376 1,392 1,408 1,423
Total 91,054 91,835 92,813 94,630 96,066
Annual Change 1.3% 0.9% 1.1% 2.7% 1.5%
Five-Year Enrollment Projections
Using enrollment projections models, the School Division projects a growth pattern over the next five years, at approximately 1.3 percent annually. The table above projects enrollment for the next five years by grade span.
Projected enrollments beyond 2018-19 allow for long-range capital planning, such as planning for construction of additional schools, or additions to existing schools.
Enrollment and Future Projections by Grade Level

Prince William County Public Schools - Executive Summary FY 2019 Budget
24
Demographic ChangesIn addition to the increased number of students, the composition of membership growth has added to the operating costs. In the past five years, increases in special education, and non-English speaking programs generally require specialized instruction and smaller class sizes.
Limited English Proficient (LEP) Students
During the past five years, the rate of growth for students
Note: LEP students are those who are receiving EL services. Those students in Post-Monitor status do not count as receiving services.
receiving English Learner (EL) services has been relatively flat at 2.0 percent. The influx of language-minority students has slowed significantly.
The graph below depicts LEP enrollments over the 1996 to 2017 period.
912
15,046
0
2,000
4,000
6,000
8,000
10,000
12,000
14,000
16,000
Enr
ollm
ent
School Year
LEP Enrollment
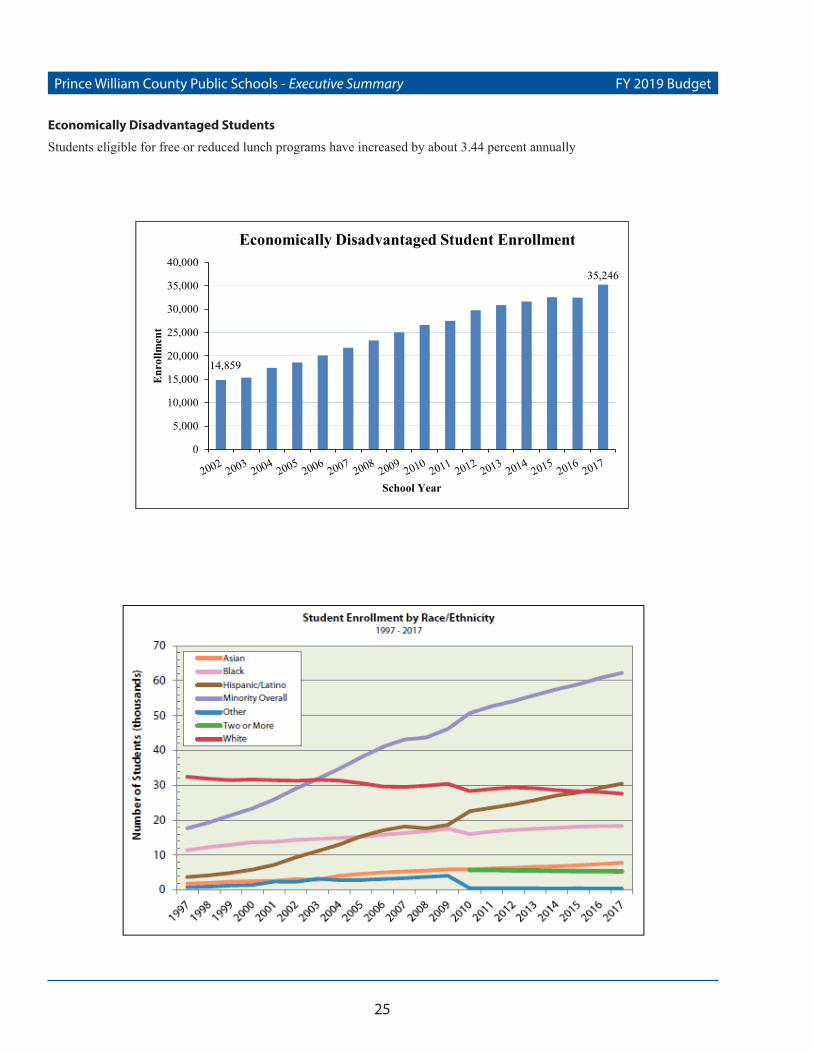
Prince William County Public Schools - Executive Summary FY 2019 Budget
25
Economically Disadvantaged Students
Students eligible for free or reduced lunch programs have increased by about 3.44 percent annually
14,859
35,246
0
5,000
10,000
15,000
20,000
25,000
30,000
35,000
40,000
Enr
ollm
ent
School Year
Economically Disadvantaged Student Enrollment
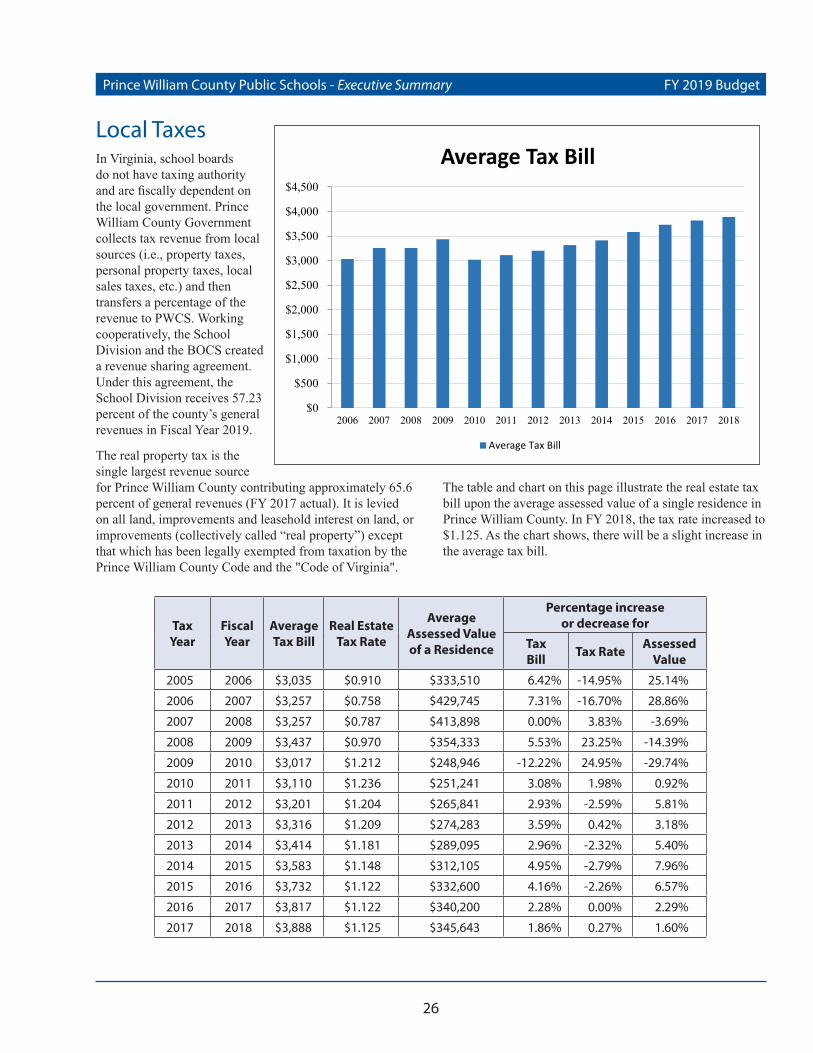
Prince William County Public Schools - Executive Summary FY 2019 Budget
26
Local TaxesIn Virginia, school boards do not have taxing authority and are fiscally dependent on the local government. Prince William County Government collects tax revenue from local sources (i.e., property taxes, personal property taxes, local sales taxes, etc.) and then transfers a percentage of the revenue to PWCS. Working cooperatively, the School Division and the BOCS created a revenue sharing agreement. Under this agreement, the School Division receives 57.23 percent of the county’s general revenues in Fiscal Year 2019.
The real property tax is the single largest revenue source for Prince William County contributing approximately 65.6 percent of general revenues (FY 2017 actual). It is levied on all land, improvements and leasehold interest on land, or improvements (collectively called “real property”) except that which has been legally exempted from taxation by the Prince William County Code and the "Code of Virginia".
TaxYear
Fiscal Year
Average Tax Bill
Real Estate Tax Rate
Average Assessed Value of a Residence
Percentage increaseor decrease for
TaxBill Tax Rate Assessed
Value
2005 2006 $3,035 $0.910 $333,510 6.42% -14.95% 25.14%
2006 2007 $3,257 $0.758 $429,745 7.31% -16.70% 28.86%
2007 2008 $3,257 $0.787 $413,898 0.00% 3.83% -3.69%
2008 2009 $3,437 $0.970 $354,333 5.53% 23.25% -14.39%
2009 2010 $3,017 $1.212 $248,946 -12.22% 24.95% -29.74%
2010 2011 $3,110 $1.236 $251,241 3.08% 1.98% 0.92%
2011 2012 $3,201 $1.204 $265,841 2.93% -2.59% 5.81%
2012 2013 $3,316 $1.209 $274,283 3.59% 0.42% 3.18%
2013 2014 $3,414 $1.181 $289,095 2.96% -2.32% 5.40%
2014 2015 $3,583 $1.148 $312,105 4.95% -2.79% 7.96%
2015 2016 $3,732 $1.122 $332,600 4.16% -2.26% 6.57%
2016 2017 $3,817 $1.122 $340,200 2.28% 0.00% 2.29%
2017 2018 $3,888 $1.125 $345,643 1.86% 0.27% 1.60%
The table and chart on this page illustrate the real estate tax bill upon the average assessed value of a single residence in Prince William County. In FY 2018, the tax rate increased to $1.125. As the chart shows, there will be a slight increase in the average tax bill.
$0
$500
$1,000
$1,500
$2,000
$2,500
$3,000
$3,500
$4,000
$4,500
2006 2007 2008 2009 2010 2011 2012 2013 2014 2015 2016 2017 2018
Average Tax Bill
Average Tax Bill

Prince William County Public Schools - Executive Summary FY 2019 Budget
27
Changes in DebtDebtDebt provides the current resources to build new schools, additions, and renovations, and repayment (with interest) must occur in the future. This debt (borrowing) commits future Operating Fund budget transfers to the Debt Service Fund (to pay the principal and interest). Long-term borrowing is appropriately done for long-life capital facilities since student enrollment growth requires expanded public-capital infrastructure (schools), often well before an associated expansion of revenues (tax collection).
Planning and AccountingThe School Division’s Capital Improvements Program (CIP) is the management tool used for planning the capital improvements projects needed to house students adequately. The School Division’s Construction Fund accounts for the resources used for the acquisition and construction of major capital facilities. The sale of bonds primarily funds the Construction Fund.
Changes in Debt ServiceThe structure of most debt service payments made by the School Division is over 20 years with level principal payments, thereby reducing the debt service for existing bonds annually. The sale of new bonds that require additional principal and interest payments and/or by the retirement (pay-off) of any existing bonds drives significant changes in debt service for any given fiscal year. To increase debt spending, the School Division needs the approval of BOCS. The BOCS also sets the debt capacity that limits the amount of funding available to the School Division for new schools and construction each fiscal year.
Debt Management PolicyProper debt management provides a locality and its citizens with fiscal advantages. The state does not impose a debt limitation on the county. However, the BOCS adopted a debt policy to ensure that no undue burden is placed on the county and its taxpayers. To manage the debt properly, the policy states in part, that the county will maintain a high credit rating in the financial community and will not use debt financing to fund current operations. These two policy statements are to assure the county taxpayers that the County government is well managed and financially sound, and to obtain the lowest possible borrowing costs (interest rates).
Existing DebtTotal existing debt prior to FY 2018 for the School Division was $815.2 million.
Future DebtBond sales not to exceed $130.3 million to finance new and renovated facilities to provide capacity needed to meet increased demands due to student population growth inFY 2018.
TrendsAccording to the Five-Year Plan, the School Division anticipates the bond sales at $684.5 million between FY 2019-23 to finance new schools, additions, replacements and renewal and repair projects. Prince William County and the School Division are constrained to limiting tax supported debt service expenditures for all debt at 10 percent of annual revenues. If current trends hold true, PWCS will not reach its county mandated debt service limit of 10 percent in the Five-Year Plan period. Management will maintain a close eye on rates and market conditions to ensure this debt limit is not exceeded.
Benchmark DataCost-Per-PupilCost-per-pupil calculations provide an overall view of the cost of programs used to compare how school divisions spend their funds. The division of the total operating budget by the number of students computes a Divisionwide cost-per-pupil, which includes both general and special education. For FY 2019, the average cost-per-pupil for PWCS will be about $11,869.
Per-pupil cost figures provide a good perspective of the cost of instructional programs as well as a measure of comparison to previous years, state and federal averages, and surrounding jurisdictions. PWCS has traditionally maintained a cost-per-pupil lower than many other school divisions. In FY 2018, the PWCS cost-per-pupil ranked tenth among the 10 reporting school divisions in the Washington Area Boards of Education (WABE).
The cost-per-pupil also compares the costs in PWCS to similar school divisions across the United States. The

Prince William County Public Schools - Executive Summary FY 2019 Budget
28
Teacher Cost ComparisonThe chart below compares the salary and benefits costs of a teacher position with a hypothetical salary of $65,000 plus benefits and the cost of a teacher using the actual average teacher salary plus benefits for PWCS and surrounding school divisions. Source: WABE Guide, FY 2018
Cost-Per-Pupil ComparisonFY 2018
Arlington County $19,340
Falls Church City $18,219
Alexandria City $17,099
Montgomery County (MD) $16,030
Fairfax County $14,767
Prince Georges County (MD) $13,816
Loudoun County $13,688
Manassas City $12,846
Manassas Park City $11,242
Prince William County $11,222
Source: WABE Guide, FY 2018
School DivisionFY 2018 Annual Employer Cost
for Hypothetical Teacher Salary of $65,000 plus district’s benefits
FY 2018 Annual Employer Cost for Average Teacher Salary plus
district’s benefits plan
Alexandria City $99,557 $114,650
Arlington County $94,783 $113,905
Fairfax County $99,699 $109,939
Falls Church City $102,473 $117,372
Loudoun County $102,984 $105,814
Manassas City $96,668 $97,174
Manassas Park City $94,304 $87,411
Montgomery County, MD $99,261 $120,757
Prince George’s County, MD $93,154 $98,657
Prince William County $98,013 $99,383
Educational Research Service (ERS) compiles a comparison of per-pupil costs for PWCS with similar reporting school divisions in the nation. The most recent comparison showed that PWCS commits more of its financial resources to instructional services and less of its resources to support operations than most school divisions.
Copyright ASCD

Prince William County Public Schools - Executive Summary FY 2019 Budget
29
Note: Chart excludes teachers and students in pre-K, kindergarten, alternative schools, and self-contained special education.Source: WABE Guide, FY 20181 Classroom teachers are positions used to determine class size.2 Students per teacher-scale positions include classroom teachers and other teachers such as ESOL/ESL, librarians, reading coaches, mentors, music, art, physical education, etc.3 Alexandria City Public Schools district's special placement, pre-K, and kindergarten student enrollments are not included.4 Fairfax County Public Schools district does not reflect additional funding to alleviate large class size in the elementary schools.5 Prince George’s County Public Schools district uses Student Based Budgeting (SBB) and student-classroom teacher ratios are not instituted. SBB gives principals the autonomy to allocate staff based on the students enrolled and the specific needs of those students.
Students per Classroom Teacher1 Students per Teacher-Scale Position2
School Division Elementary Middle High Elementary Middle HighAlexandria City3 15.6 24.6 25.4 9.9 15.0 13.2Arlington County 21.3 22.1 19.6 10.0 17.5 16.6Fairfax County4 22.9 25.1 26.0 14.8 20.8 21.4Falls Church City 22.9 23.5 20.1 11.9 16.9 14.2Loudoun County 23.2 21.7 23.7 14.7 18.8 20.4Manassas City 21.6 27.1 26.4 11.0 16.7 18.0Manassas Park City 21.4 26.4 28.3 11.7 19.3 20.5Montgomery County 19.0 25.1 26.2 13.8 21.7 23.3Prince George’s County5 21.9 19.8 26.1 16.1 17.9 22.2Prince William County 22.4 28.3 29.4 14.8 20.5 21.6
Average Class SizeThis chart compares the average class size for students per classroom teacher and students per teacher-scale position for PWCS and surrounding divisions.

Prince William County Public Schools - Executive Summary FY 2019 Budget
30
School Division Kindergarten Elementary Middle High
Alexandria City1 22.0 Grades 1-2: 24.0Grades 3-5: 26.0 n/a n/a
Arlington County 23.0Grade 1: 20.0Grades 2-3: 22.0Grades 4-5: 23.0
23.4 25.4
Fairfax County2 27.3 27.3 27.9 31.0Falls Church City 22.0 22.0 24.0 24.0Loudoun County 23.0 23.0 23.8 24.8
Manassas City 23.0 Grades 1-3: 23.0Grades 4-5: 28.0 28.0 28.0
Manassas Park City 19.0 Grades 1-3: 19.0Grades 4-5: 24.0 24.0 24.0
Montgomery County3 n/a n/a n/a n/aPrince George’s County4 n/a n/a n/a n/a
Prince William County 24.0 Grades 1-3: 24.0Grades 4-5: 25.0 21.0 21.3
1 Alexandria City Public Schools district does not allocate positions based on staffing ratios for middle and high school classrooms. Staffing is determined by course enrollment.2 Fairfax County Public Schools district's staffing ratios also take into account the number of students eligible for free and reduced priced meals and ESOL services. Additional teacher positions are allocated from the staffing reserve to help eliminate class size of 30 and above in elementary schools. For a complete listing of staffing formulas, see the appendix of the FY 2018 Approved Budget. 3 Montgomery County Public Schools district's numbers are maximum class size guidelines and not ratios or targets for class sizes. With guidelines for maximums, the actual numbers end up being less than the guideline.4 Prince George’s County Public School district uses Student Based Budgeting (SBB) and student-classroom teacher ratios are not instituted. SBB gives principals the autonomy to allocate staff based on the students enrolled and the specific needs of those students.
Student-Teacher RatioThis chart compares the Approved FY 2018 Budgeted Ratios of Students Per Teacher for PWCS and surrounding school divisions. Source: WABE Guide, FY 2018