this paper is in press for publication in electrochemical ...eprints.lincoln.ac.uk/11752/1/ghb...
TRANSCRIPT

1
This paper is in press for publication in Electrochemical Acta
Electrochemical behaviour of gamma hydroxybutyric acid (GHB) at a
platinum electrode in acidic medium
R. Jiménez-Pérezb, J.M. Sevillab, T. Pinedab, M. Blázquezb, J. González-Rodriguez*a
a School of Life Sciences, Faculty of Science, University of Lincoln, Brayford Pool, Lincoln, LN67TS, UK b Departamento de Química Física y Termodinámica Aplicada, Universidad de Córdoba, Campus de Rabanales, Ed. Marie Curie, E-14071 Córdoba, España.
Abstract.
Gamma Hydroxybutyric Acid (GHB), when studied in a platinum electrode using cyclic
voltammetry, presented three oxidation peaks in acid solutions that correspond to the
oxidation of the alcohol group to the corresponding aldehyde and carboxylic acid
(succinic acid). An anodic scan of GHB yielded two characteristic waves, which
indicates an oxidation process dependent on the chemical environment on the surface of
the electrode. The cathodic scan presented an inverted oxidation peak with an onset
partially overlapping with the tail of the cathodic peak for the reduction of the platinum
oxide formed initially during the anodic scan. This inverted peak can be observed at a
potential close to +0.2V (vs Ag/AgCl at pH 2) and separated 0.4 and 0.8 V from the two
other oxidation peaks obtained during the anodic scan and in such conditions that the
surface is particularly activated to favour this electrochemical process. The response
obtained in the electronic current for the different peaks when GHB concentration and
scan rate were changed allows inferring that these are the result of a potential dependent
mechanism.
Keywords: GHB, electrochemical oxidation, platinum electrode, Forensic Science.

2
1. Introduction
Gamma-hydroxy butyric acid (GHB) is a simple molecule with a four-carbon backbone
and two functional groups: a hydroxyl group and a carboxylic acid. The chemical
simplicity of the molecule highly contrasts with the complexity of its physiological
activity, the difficulties to detect it in the body and the almost inexistent literature
explaining its behaviour from an electrochemical point of view.
GHB, that can be found in the body naturally in varying concentrations and in urine
these values have been found to be between 1.46 mg/L [1] to 6.63 mg/L [2] . It can be
also present in alcoholic beverages and other foodstuff in small amounts [3] and it has
become sadly famous as it is frequently used as drug of abuse in clubs and pubs [4].
Used in low concentration (30-100 mg/L) this drug produces euphoria and lack of
inhibitions [5] but if the concentration exceeds 500 mg/L mg amnesia, drowsiness,
visual impairment and unconsciousness are obtained instead [6] and even death in the
most critical cases (over 500mg/L).
GHB has an average half-life of around 20–53 min, which seems to increase at higher
GHB concentration [7]. This means that after 3-9 hours (10 half-life) only 0.097% of
the original drug concentration remains. This narrow analysis window and the small
amounts occurring in the body naturally make very difficult a positive identification and
to document any potential offense if not recorded within the first 8 hours after
administration.
The most effective way to detect GHB in biological fluids (blood, plasma or urine) is by
means of gas chromatography-mass spectrometry with [8,9] or without derivatisation
[10] or using liquid chromatography mass spectrometry [11]. All these methods are
sensitive and provide with enough analytical power to detect the drug and its
metabolites but they are expensive to purchase and run and they are not portable.
New simple and portable methods are needed to detect GHB in situ and as quick as
possible. In this sense the only previously published qualitative method found in the
literature meeting these requirements is based on simple and quick microcrystalline tests
[12].
3
In this work an electrochemical study of GHB on a platinum electrode in acidic
solutions by cyclic voltammetry has been performed. To the best of our knowledge
there are no previous studies of the electrochemical behaviour of GHB in the literature.
This study opens a window of opportunity for the electrochemical study of this
molecule in order to understand its reactivity in experimental conditions close to
physiological ones and in aqueous solution. In this sense the data obtained will
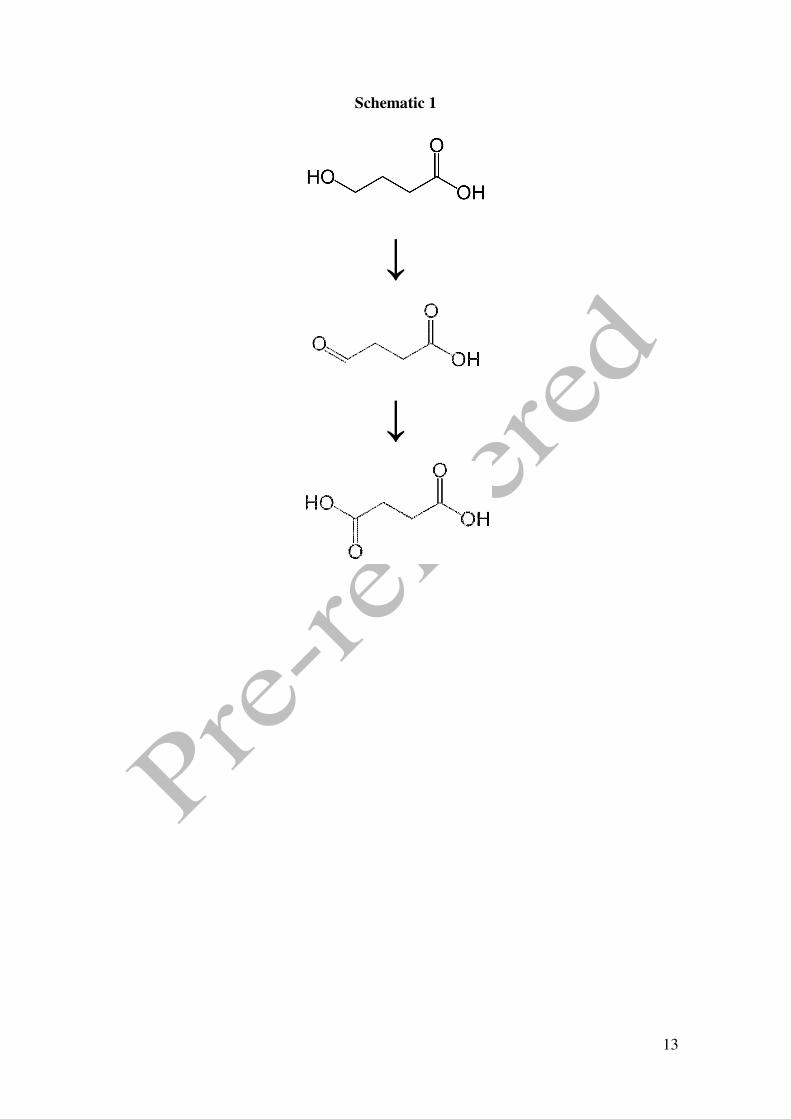
demonstrate that the hydroxyl group of the molecule (see schematic 1) is oxidised in an
acidic medium to succinic acid under a wide range of potentials. The electrochemical
characterisation of this process can be of great importance as it allows the detection of
this drug using electrochemical sensors in a quick and reliable way.
Schematic 1
2. Experimental
GHB was prepared by slow addition of freshly prepared 0.2 M aqueous solution of
NaOH (50 mL) to a commercial sample of Gamma-hydroxy butyric lactone (GBL
reagent, minimum 99% purity, 0.86 g, 0.01 mol) at 0ºC under magnetic stirring. The
solution was stirred at room temperature for 30 min. The product was concentrated and
recrystallized three times using hot ethanol. Identification by infrared measurements
using a Brucker Alpha T spectrometer showed the presence of GHB as the only product
of the reaction.
As supporting electrolyte, 0.1 M perchloric acid (Aldrich), 0.2 M sulphuric acid
(Merck) and and 0.1 M phosphoric acid (Merck) were used.
The absorbance spectra of the prepared solutions were recorded using a Jasco V-570
UV-vis spectrophotometer.
Cyclic Voltammetry (CV) analyses were performed with a Autolab (Ecochemie model
Pgstat3) instrument attached to a PC with proper software (GPES) for the total control
4
of the experiments and data acquisition. A three electrode configuration was used:
platinum electrode acting as working electrode, a Ag/AgCl used as a reference electrode
and a platinum electrode acted as a counter electrode. The working electrode used for
the different experiments were a 1.6 mm diameter platinum electrode from
Bioanalytical Systems (Kenilworth, UK). The working electrode was polished with 0.05
µm Al2O3 slurry, rinsed and sonicated in 18 MΩ Milli-Q water (Millipore, Maryland,
US) and dried before use. The area of the electrode was calculated experimentally by
CV using a K3Fe(CN)6 1mM solution in KCl 1 M obtaining a value of 0.0213±0.0017
cm2, which is in good agreement with the geometrical area of 0.0201 cm2. All the
intensity of current values given, normalized to consider the surface electrode, has been
calculated using the geometric area. Nitrogen was bubbled in the electrochemical cell
for 20 min before analysis.
3. Results and discussion.
3.1. General behaviour.
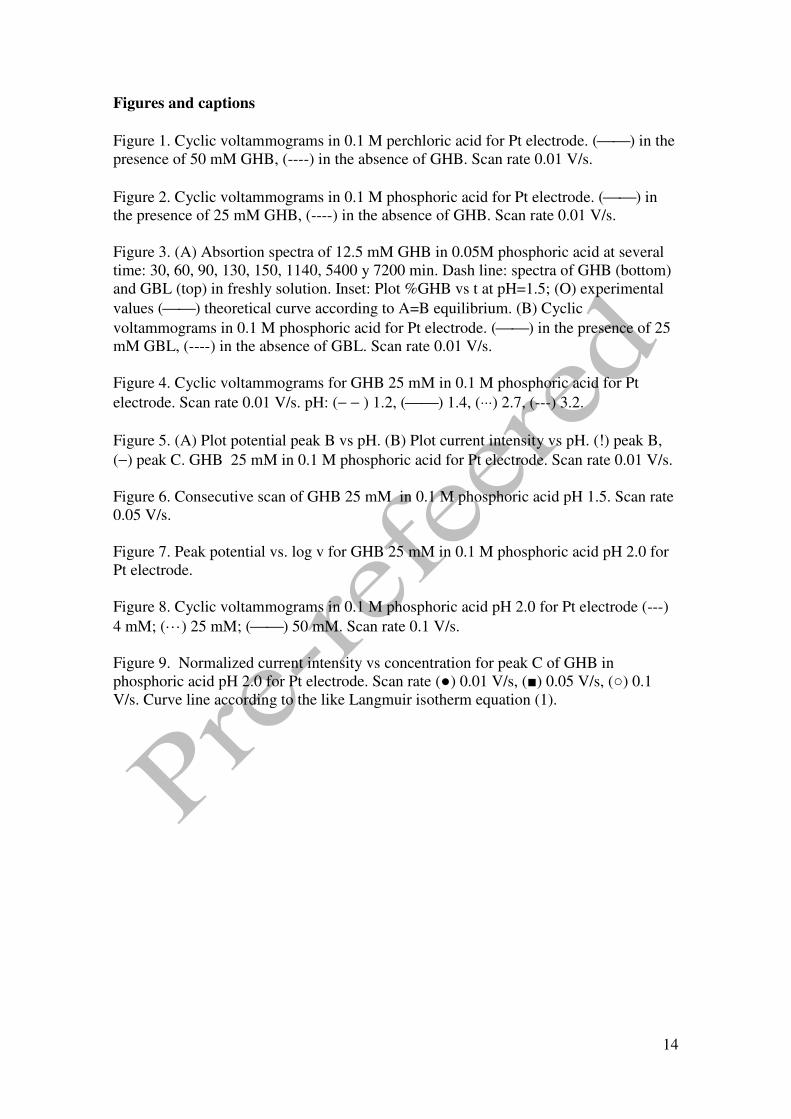
Figure 1 shows the cyclic voltammograms (CV) of 50 mM GHB in 0.1M HClO4
together with the curve in the absence of GHB at the scan rate of 0.01 V/s. The typical
CV for a polycrystalline platinum surface in 0.1M HClO4 shows three potential regions:
(a) the hydrogen region (-0.2 to +0.15 V) characterized by the presence of adsorbed
hydrogen on the electrode surface that shows peaks corresponding to the
adsorption/desorption of hydrogen atoms with different energies. At E < -0.2 V
hydrogen evolution occurs; (b) the platinum oxide region at E > 0.65 V where a
platinum oxide layer starts to form with increasingly positive potential; this layer is
subsequently electroreduced during the reverse sweep with the development of a peak
centred at 0.45 V and, (c) the double-layer region in the potential range of 0.15 - 0.65 V
during the positive run and narrower in the cathodic sweep. In this region neither Had
nor Oad species are present at the surface.
Some important changes in the CV are obtained in the presence of GHB. In the positive
going potential sweep (PGPS) a partial suppression of the desorption hydrogen peaks
that become at the same level of current in the double layer region, is observed. At E >
0.37 V, an onset of oxidation is seen (peak A) that is followed by a wave of higher
current intensity coinciding with the region of platinum oxide formation (peak B). It is

5
interesting to note that the threshold potential for oxidation is below the onset for
platinum oxide formation. In the negative going potential sweep (NGPS) the reduction
of the platinum surface oxide develops but, after reaching the maximum peak potential
the current suddenly drops up to values of positive currents higher than that obtained in
the PGPS producing an unique peak (peak C). This peak is observed in the potential
interval from 0.4 to 0.0 V and from this point a cathodic contribution develops. The
features observed in the CV are similar to those obtained for the electro-oxidation of 1-
butanol under the same experimental conditions [13-15]. The 1-butanol molecule has
the same chemical structure of GHB except for the carboxylic acid group in the position
4. Thus, in a first approximation we can expect that the oxidation process observed in
the present experiment corresponds to the alcohol group in the molecule. Moreover,
similar voltammetric features have been obtained for the oxidation of other aliphatic
mono- and di-alcohol derivatives of different chain length and the conclusions about the
mechanism are more o less the same, the differences being related with the higher or
lower oxidation currents and the preferred pathways [15-18].
Figure 1
Figure 2 shows the CV of 25 mM GHB in a 0.1 M phosphate buffer solution at the scan
rate of 0.01 V/s. It can be observed that the i-E profile is very similar to that of the
Figure 1. We have also recorded the CV in 0.2 M sulphuric acid with analogous results.
Though there is known that electrolytes like phosphate and sulfate adsorb on the surface
of platinum [19,20], our results indicate that the electrochemical response of
electrooxidation of GHB is not appreciably dependent on the nature of the electrolyte
and, thus, the GHB molecules adsorb to the platinum surface from the first contact at
negative potentials. This is evidenced by the important suppression of the hydrogen
adsorption/desortion peaks in the lower potential region.
Figure 2
The chemistry of GHB in aqueous solution is conditioned by a double equilibrium. On
one hand, the cyclization reaction to yield the lactone (GBL) and, on the other, the
acid/base equilibrium in which the carboxylic acid form is dissociated into the ionic
form with a pKa = 4.6 [21]. The conversion speed into lactone is a relatively slow

6
process in moderately acidic media and it requires a time frame of hours at pH ≥ 2 [22].
In highly acidic media the formation of the lactone in a homogeneous medium is
catalysed by H+
H
2GHB GLB H O+
→ +←
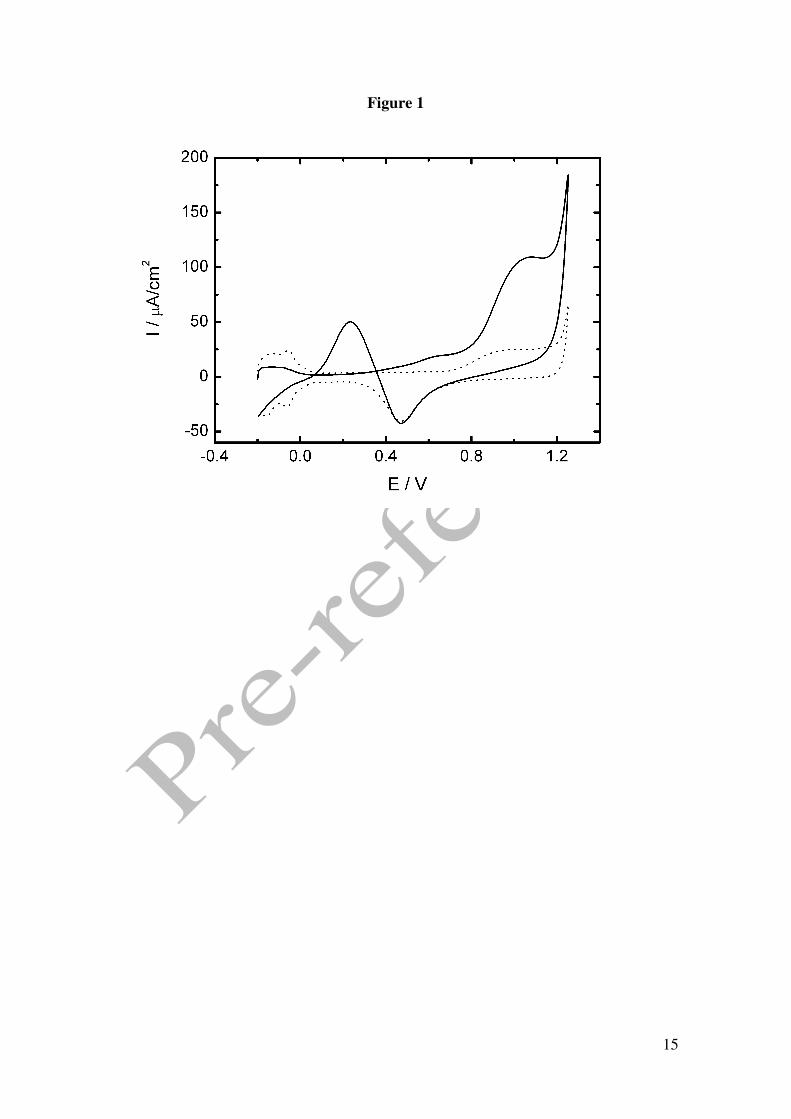
We have carried out a study of the ciclyzation kinetic of GHB in the pH interval
between 0.8 and 3 by UV-visible spectroscopy in order to establish the experimental
conditions for an unequivocal electrochemical characterization of GHB in acid
solutions. In the figure 3A we observe the evolution of the UV-visible spectra of GHB
with the time at pH 1.5 (in the inset the curve %GHB vs time is shown by
measurements at 192 nm corresponding to the maxima of the UV spectrum of GBL).
The main feature is that at pH 1.5 and on the other pH values the level of GHB within
of the two first hours is higher than the 98%. The figure 3B shows the i-E curves by CV
of blank electrolyte and GBL at pH 1.5 from solution freshly prepared. We can
conclude that GBL is electroinactive and that all the peaks described previously
correspond to GHB's oxidation.
Figure 3
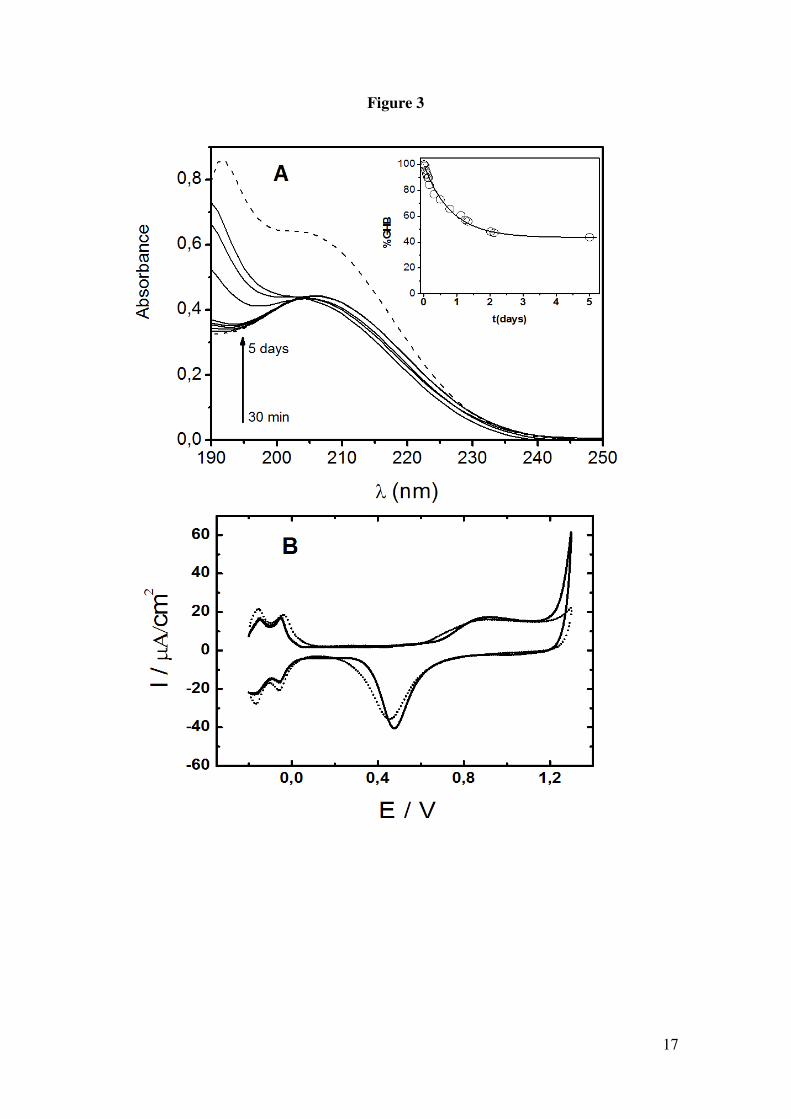
We have undertaken a study by CV in different pH aqueous solutions in 0.1M
phosphoric acid in the presence of 25mM GHB (solutions freshly prepared) and at the
scan rate of 0.01 V/s. For other scan rates, similar results were obtained.
As can be observed in Figure 4, peak B is very sensitive to the H+ concentration. The
shift towards lower potentials with increasing pH is compatible with the oxidation of
hydroxyl group in a dependent fashion. Alkyl alcohols y di-alcohols get oxidised to
yield the correspondent carboxylic acid according to the reaction [13-15]:
R-CH2OH + H2O → R-COOH + 4H+ + 4e-
Figure 4
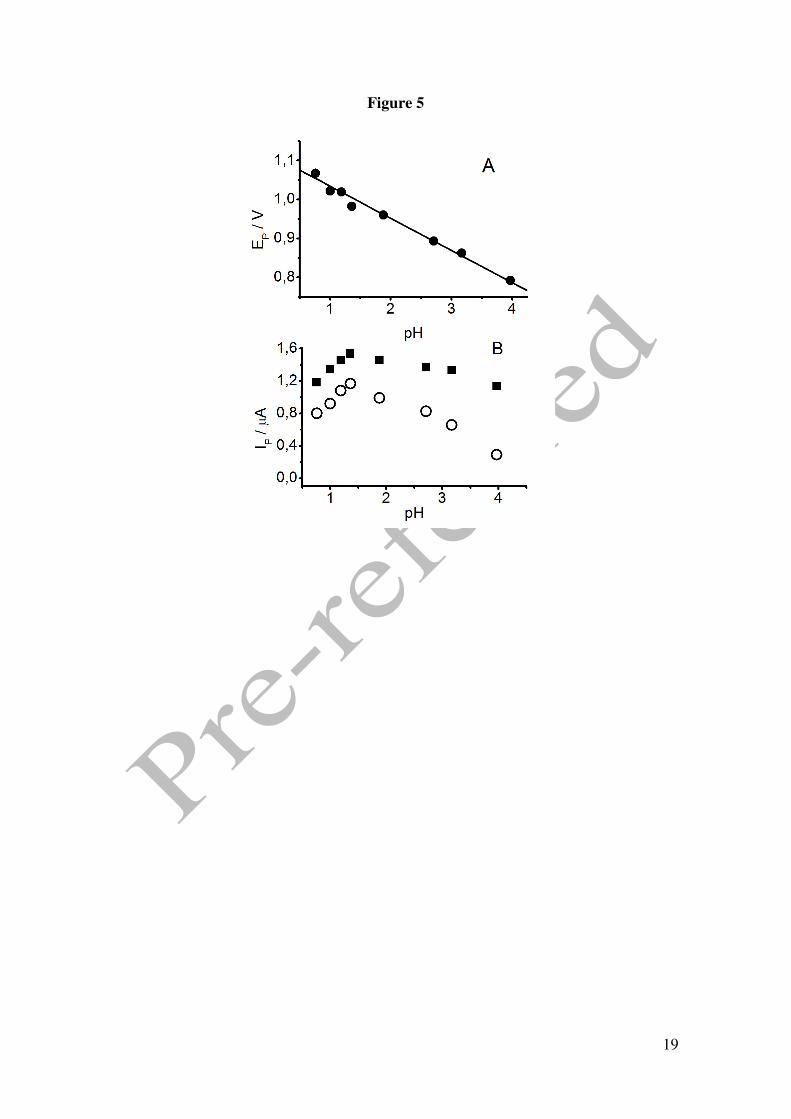
The peak potential follows a linear trend with a slope of -74mV/pH (Figure 5), which is
compatible with the oxidation scheme proposed previously for alcohols.
Peak C follows the same trend shifting towards more cathodic values (lower potentials)
with increasing pH. Peak potentials are influenced by the shift of the cathodic peak
7
associated with the reduction of the platinum surface oxide and follows a linear
representation with a slope of -61 mV/pH.
In Figure 5, the influence of pH in the current intensities associated to peaks B and C
are also plotted. For peak B the intensity does not change considerably at pH ≥ 1 and
only a slight drop can be observed at higher pH, which could be explained due to the
proximity to the pKa for GHB as the pH gets to pH = 4.6. In highly acidic media the
intensity diminishes due to the formation of the lactone in a homogeneous medium and
catalysed by H+ as we have shown above.
The current intensity of peak C is more influence by the pH. Again, this fact can be
explained by the strong influence of the peak associated to the platinum oxide
reduction. The optimum current is obtained at pH around 1.5, as a compromise between
the lactone formation and the apparition of negative charge in the carboxylic group.
Figure 5
An important finding in the electrooxidation of GHB in platinum is that the CV is
maintained invariant upon cycling and no decrease in current is observed after ten
potential scans (Figure 6). As observed there is no modification in any of the oxidation
peaks for GHB, which suggests that, under this scan rate and experimental conditions
(similar behaviour is observed at v ≤ 0.1 V/s and c ≤ 25 mM), an equilibrium controlled
by mass transport is reached. Moreover, it can be inferred that the kinetics of the
adsorption-desorption stages involved in the global electrochemical mechanism are fast
when compared to that of diffusion. This result contrast with the fact that the hydrogen
adsorption/desorption peaks are suppressed in the presence of GHB that means that the
molecule adsorbs to the surface at the initial potential of the scan. It has been described
that the alcohol group interacts with the platinum surface by a dissociative adsorption
process that produce COads and the alkane derivative molecule. The COads remains
adsorbed up to potentials positive enough to produce CO2. However, at higher
potentials the oxidation of the alcohol group to give either the aldehyde (peak A) or the
carboxylic acid takes place. Thus, it can be concluded that the anodic peak obtained in
the NGPS takes place in a clean platinum surface that is generated upon platinum oxide
reduction.
The current density for peak B is close to 50 µA/cm2, which is similar to that obtained
by other authors [16,17] in the oxidation of diols when studied under the same
8
conditions: 25 mM and v = 0.01 V/s (Figure 2). This fact also agrees with a very similar
electrochemical oxidation process for GHB corresponding with the oxidation of the
alcohol group to aldehyde and to the carboxylic acid to obtain succinic acid.
As general remark, the presence of three oxidation peaks in GHB on platinum electrode
can be the result of the different nature of metallic surface that is dependent on the
potential and the experimental conditions of solutions preparations.
Figure 6
3.2. Influence of the scan rate
The influence of the scan rate on the electrochemical oxidation processes was conducted
in the interval from 0.005 to 0.2 V/s. This study was also performed at different GHB
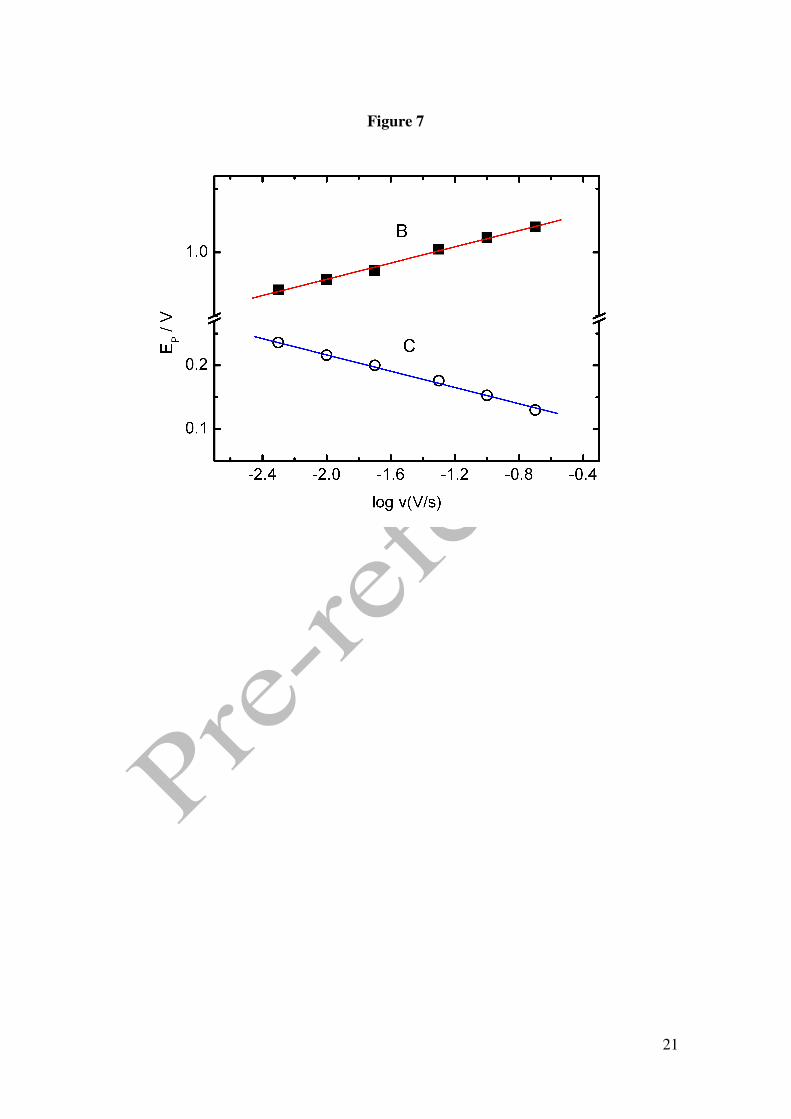
concentrations in 0.1M phosphoric acid buffered aqueous solutions. Figure 7 shows the
variation of peaks B and C with the scan rate. It can be appreciated that the potential of
peak B increases towards more anodic values with increasing scan rate with a slope of
64 mV/dec. This behaviour is compatible with an irreversible oxidation process with a
slow first electronic transfer. This value is similar for the different concentrations
examined, with a lower limit of 55 mV/dec at the lowest concentrations and a maximum
limit of 68 mV/dec at the highest concentration.
The potential trend observed for peak C in the cathodic scan is opposite to that for peak
B as the peak potential decreases with increasing scan rates with a slope of -54 mV/dec.
This behaviour is parallel to that of the peak assigned to the platinum oxide reduction.
Thus, peak C should have a strong influence from the later and the cathodic current
obtained in this reduction process.
The results for peak A are difficult to analyze due to the fact that it presents a low
intensity and also because it appears as a shoulder of the peak B.
Figure 7
Finally, the slope of the scan rate dependence for peak B current (logarithmic plots) is
0.63 and 0.56 at low and high GHB concentration, respectively, indicating that the
kinetic control is a mixture of diffusion and adsorption processes including of GHB
oxidation and platinum surface oxidation.
9
The typical current density values for an oxidative electrochemical process involving
the oxidation of an alcohol group to an aldehyde and to a carboxylic acid entirely
controlled by diffusion should be in the range from 1 to 100 mA/cm2 for a 25 mM
solution at the scan rates examined. The values obtained for GHB are much lower than
these, which seems to indicate that the GHB oxidation occurs through a complex
surface process where platinum hydroxides play an important role since has been
described by several authors (16, 17, 23-26).
Peak C current diminishes with increasing scan rates. We can explain this result by
taking into account that upon increasing the scan rate, the time window in which the
oxidation of GHB occurs is shorter giving the appearance of a slower process. This
means that, in this electrochemical process, the diffusion-controlled adsorption of GHB
on the platinum active surface is required.
3.3. GHB concentration influence.
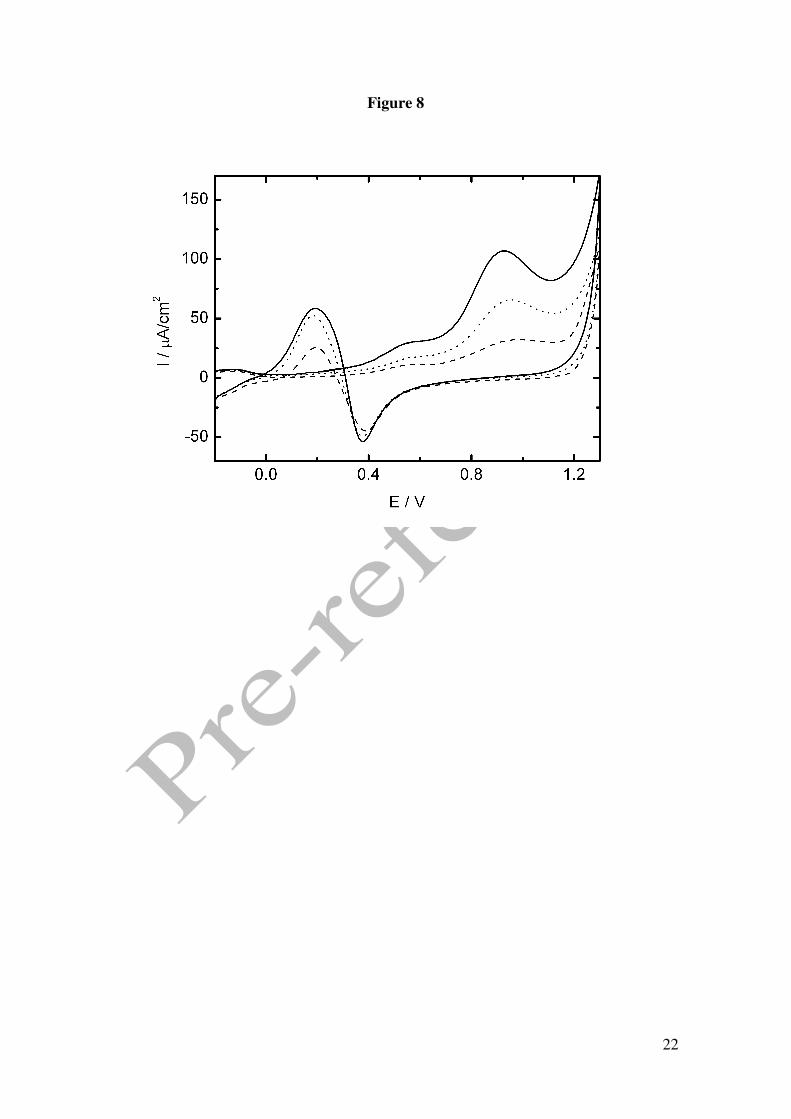
Figure 8 shows CVs at different GHB concentrations in 0.1M phosphoric acid pH 2 at
the scan rate of 0.01 V/s. As expected, all oxidation peaks of GHB increase with
increasing concentrations of the drug. The current densities corresponding to the peak
potential for peak B when plotted in a graph log IB vs. log c yields a linear
representation with a slope of 0.94 in agreement with a reaction order of one in respect
to GHB concentration. Increasing scan rates yield lower values indicating a greater
contribution of the wave of platinum oxidation in the observed current intensity
(analysing the results obtained at a scan rate of 0.1 V/s the slope is 0.87).
It is also important to point out that the current of peak C increases with GHB
concentration up to a saturation value, which confirms that the GHB oxidation at
potential values close to 0.2V is linked to an adsorption mechanism in which the active
surface produced by the reduction of the platinum oxide play an important role. This
behaviour can be observed at all the scan rates studied.
Figure 8
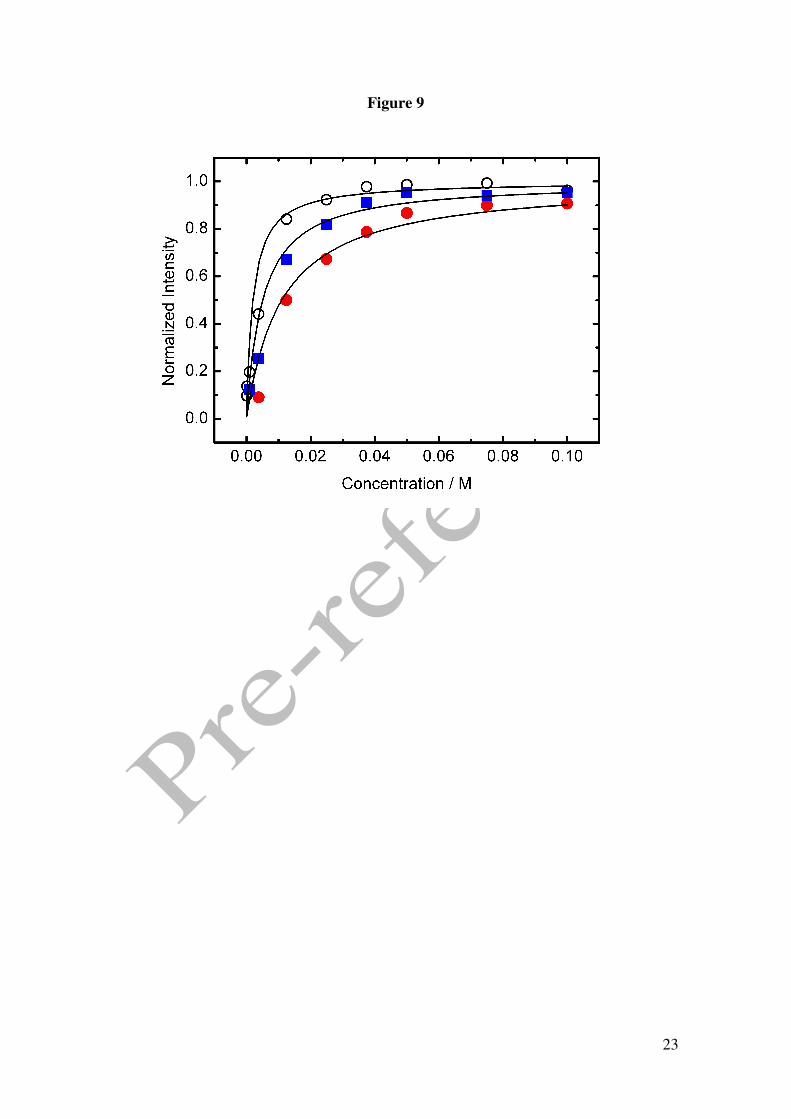
Figure 9 shows the variation of the normalised current intensity for peak C vs. GHB
concentration at three different scan rates, 0.01, 0.05 y 0.1 V/s. The current increases

10
sharply at lower concentrations reaching a limiting value at higher concentrations. This
behaviour is consistent with a like Langmuir isotherm giving by equation (1),
p
Lp
I Bc
1 BcI=
+ (1)
where Ip is the actual current at the GHB concentration c, and B and IpL are the apparent
adsorption coefficient and the limiting current value, respectively. The non-linear fits of
the experimental data to this equation give values for apparent adsorption coefficient of
peak B of 489, 203 and 79 M-1 for 0.01, 0.05 y 0.1 V/s, respectively. Also it was fitted
the IpL value respect of which the current intensity was normalized. The dependence of
B with the scan rate supports the hypothesis that the adsorption process, associated to
the GHB oxidation in peak C, is controlled by the diffusion of the electroactive species
to the electrode. The shortening of the time window limits the saturation process on the
electrode surface.
Figure 9
4. Conclusions
The GHB oxidation process in platinum electrodes at acidic pHs is a complex process
involving the interaction of the molecule with the surface of the electrode. An anodic
scan of GHB presents two characteristic peaks dependant on the chemical environment
on the platinum surface. The cathodic scan yields two main peaks: one corresponding
to the reduction of the platinum oxides formed during the anodic scan and one inverted
oxidation peak with an onset partially overlapping with the tail of the reduction peak
associated to the oxidation of the hydroxyl group of the GHB. This behaviour is similar
to the other alcohols as butanol and ethanol with mechanisms of oxidation reactions that
are still object of studies on platinum and modified Pt electrodes [15, 18, 23-26]. Also,
the oxidation process is influenced by pH and GHB concentration, which can be
potentially used for its identification and in sensor design.
The study of the electrochemical behaviour of GHB presented here will trigger
additional investigations of the electrocatalysis of this drug. In this sense, a study by
other complementary methods as espectroelectrochemical techniques that could give
11
information of the interaction of GHB with platinum are considered at present in our
laboratory.
Acknowledgments
We thank the Ministerio de Ciencia e Innovación (MICINN) (Project CTQ2010-16137)
Junta de Andalucía and University of Córdoba for financial support of this work. We
also thank the EC Long Life Programme (Erasmus) for financial support which made
this collaboration possible.
References
[1] Crookes CE, Faulds MC, Forrest ARW, Galloway JH. J Anal Toxicol., 2004;28(8) 644. [2] Sporer KA, Chin RL, Dyer JE, Lamb R., Ann Emerg Med. 2003;42(1):3–8 [3] Weil, Andrew; Winifred Rosen (1993). "Depressants". From Chocolate to Morphine (2nd ed.). Boston/New York: Houghton Mifflin Company. p. 77. [4] Gahlinger PM., Am Fam Physician. 2004 1;69(11):2619-26. [5] ElSohly MA, Salamone SJ., J Anal Toxicol 1999;23:141-146. [6] Sue Jickells, Adam Negrusz, Anthony C. Moffat, M. David Osselton, Brian Widdop. Clarke's Analytical Forensic Toxicology Pharmaceutical Press (2008) [7] Palatini P, Tedeschi L, Frison G, Padrini R, Zordan R, Orlando R, et al., Eur J Clin Pharmacol 1993;45:353-356. [8] Louaagie HK, Verstraete AG, De Stoete CJ, Baetens DG, Calle PA., Clin Toxicol 1997;35:591-594. [9] Elie MP, Baron MG, Birkett JW., Analyst. 2012, 7;137(1):255-62 [10] Damien Richard, Bing Ling, Nicolas Authier, Thierry W Faict, Alain Eschalier, François Coudoré, Anal. Chem. (2005) 77(5):1354-60. [11] Wood, M., Laloup, M., Samyn, N., Morris, M.R., de Bruijn, E.A., Maes, R.A., Young, M.S., Maes, V., De Boeck, G., J. Chrom.A Vol. 1056, No. 1, pages 83-90 (2004). [12] Elie MP, Baron MG, Birkett JW., J Forensic Sci. 2008 53(1):147-50.
12
[13] J.L. Rodriguez, R.M. Souto, L. Fernández-Mérida, E. Pastor, Chem. Eur. J., 8 (2002) 2134 [14] N.-H. Li, S.-G. Sun, J. Electroanal. Chem., 436 (1997) 65 [15] R.M. Souto, J.L. Rodriguez, E. Pastor, Chem. Eur. J., 11 (2005) 3309 [16] Hitmi, H., Belgsir, E.M., Léger, J.M., Lamy, C., J. Electroanal. Chem., 435 (1997) 69 [17] Dimos, M.G., Blanchard, G.J., J. Phys. Chem. C, 115 (2011) 11247 [18] Hitmi, H., Belgsir, E.M., Léger, J.M., Lamy, C., Lezna, R.O., Electrochimica Acta, 39 (1994) 407 [19] F.H. Nart, T. Iwasita, Electrochimica Acta, 37 (1992) 385 [20] F.H. Nart, T. Iwasita, J. Electroanal. Chem., 322 (1992) 289 [21] Cappell, J.S., A.W. Meyn, K.K. Ngim, J. Forensic Sci. 49 (2004) 1 [22] Ciolino, L.A., Mesmer, M.Z., Satzger, R.D., Machal, A.C., McCauley H.A., Mohrhaus, A.S., J. Forensic Sci, 46 (2001) 1315 [23] A.P.M. Camargo, B.A.F. Previdello, H. Varela, E.R. González, Electrochem. Commun. 12 (2010) 140 [24] S.C.S. Lai, S.E.F.Kleijn, F.T.Z. Öztürk, V.C.van Rees Vellinga, J. Koning, P. Rodriguez, M.T.M. Koper, Catal. Today., 154 (2010) 92. [25] M. Heinen, Z. Jusys, R.J. Behm, J. Phys. Chem. C., 114 (2010) 9850. [26] Y. Ma, Y. Du, W. Ye, B. Su, M. Yang, C. Wang, Int. J. Electrochem. Sci., 7 (2012) 2654
13
Schematic 1
↓
↓
14
Figures and captions
Figure 1. Cyclic voltammograms in 0.1 M perchloric acid for Pt electrode. () in the presence of 50 mM GHB, (----) in the absence of GHB. Scan rate 0.01 V/s. Figure 2. Cyclic voltammograms in 0.1 M phosphoric acid for Pt electrode. () in the presence of 25 mM GHB, (----) in the absence of GHB. Scan rate 0.01 V/s. Figure 3. (A) Absortion spectra of 12.5 mM GHB in 0.05M phosphoric acid at several time: 30, 60, 90, 130, 150, 1140, 5400 y 7200 min. Dash line: spectra of GHB (bottom) and GBL (top) in freshly solution. Inset: Plot %GHB vs t at pH=1.5; (O) experimental values () theoretical curve according to A=B equilibrium. (B) Cyclic voltammograms in 0.1 M phosphoric acid for Pt electrode. () in the presence of 25 mM GBL, (----) in the absence of GBL. Scan rate 0.01 V/s. Figure 4. Cyclic voltammograms for GHB 25 mM in 0.1 M phosphoric acid for Pt electrode. Scan rate 0.01 V/s. pH: (− − ) 1.2, () 1.4, (⋅⋅⋅) 2.7, (---) 3.2. Figure 5. (A) Plot potential peak B vs pH. (B) Plot current intensity vs pH. (!) peak B, (−) peak C. GHB 25 mM in 0.1 M phosphoric acid for Pt electrode. Scan rate 0.01 V/s. Figure 6. Consecutive scan of GHB 25 mM in 0.1 M phosphoric acid pH 1.5. Scan rate 0.05 V/s. Figure 7. Peak potential vs. log v for GHB 25 mM in 0.1 M phosphoric acid pH 2.0 for Pt electrode. Figure 8. Cyclic voltammograms in 0.1 M phosphoric acid pH 2.0 for Pt electrode (---) 4 mM; (·· ·) 25 mM; () 50 mM. Scan rate 0.1 V/s. Figure 9. Normalized current intensity vs concentration for peak C of GHB in phosphoric acid pH 2.0 for Pt electrode. Scan rate () 0.01 V/s, () 0.05 V/s, () 0.1 V/s. Curve line according to the like Langmuir isotherm equation (1).
15
Figure 1

16
Figure 2
17
Figure 3
18
Figure 4
19
Figure 5

20
Figure 6
21
Figure 7
22
Figure 8
23
Figure 9