this pdf is a selection from an out-of-print volume … · 2008-10-01 · 8 japan’s development...
TRANSCRIPT

This PDF is a selection from an out-of-print volume from the National Bureauof Economic Research
Volume Title: Growth Theories in Light of the East Asian Experience, NBER-EASEVolume 4
Volume Author/Editor: Takatoshi Ito and Anne O. Krueger, eds.
Volume Publisher: University of Chicago Press
Volume ISBN: 0-226-38670-8
Volume URL: http://www.nber.org/books/ito_95-2
Conference Date: June 17-19, 1993
Publication Date: January 1995
Chapter Title: Japan’s Development Cooperation and Economic Developmentin East Asia
Chapter Author: Hirohisa Kohama
Chapter URL: http://www.nber.org/chapters/c8550
Chapter pages in book: (p. 201 - 226)
8 Japan’s Development Cooperation and Economic Development in East Asia Hirohisa Kohama
8.1 Introduction: Japan’s Postwar Development Experience and Its Influence on Japan’s Aid Policy
An objective of this paper is to explain the characteristics of Japan’s official development assistance (ODA) and the philosophy behind it. Special attention will be paid to the question of whether Japan’s ODA is actually intended to foster the growth and development of recipient countries or whether it is moti- vated by the commercial goal of Japanese export promotion. I will outline the characteristics of Japan’s ODA program and its impact on East Asian countries and put forward the contention that Japan’s aid philosophy is based on its own development experience.
The Japanese ODA program started in 1954 when Japan joined the Colombo Plan, and the ODA loan program started in 1958. At that time Japan faced constraints on its balance of payments and export expansion was crucially im- portant; all ODA loans were tied loans intended to promote Japan’s exports to developing countries. This aim is clearly mentioned in the government docu- ment describing the program (Ministry of International Trade and Industry [MITI] 1959,129).
As it was starting its ODA program, Japan borrowed money from the World Bank throughout the 1950s, and even in the early 1960s. World Bank loans to Japan were for infrastructure and basic industry investments as shown in table 8.1.
I believe that the experience of economic development and the development policy in postwar Japan has had a substantial influence on Japan’s aid policy. The connection is not direct but is important in determining the Japanese gov- ernment’s basic aid policy.
Hirohisa Kohama is professor of economics at University of Shizuoka.
201

202 Hirohisa Kohama
Table 8.1 World Bank Loans to Japan
Year Project Loan
(thousand U.S. $)
1953
1956
1957
1958
1959 1960
1961
1962 1963 1964 1965
1966
Total
Power plant Power plant Power plant Steel plant Steel plant Machine tools for car plant Ship engine plant Ship engine plant Steel plant Agricultural land development Agricultural land development Non-project Non-project Irrigation Steel plant Power plant Power plant Steel plant Steel plant Power plant Steel plant Power plant Steel plant Steel plant Freeway Steel plant Steel plant Power plant Shinkansen (bullet train) Freeway Freeway Freeway Freeway Power plant Freeway Freeway Freeway
21,500 11,200 7,500 5,300 2,600 2,350 1,650 1,500
20,000 1,330 1,133
984 853
7,000 8,000
37,000 25,000 33,000 10,000 29,000 22,000 10,000 24,000 20,000 40,000 6,000 7,000
12,000 80,000 40,000 75,000 50,000 25,000 25,000 75,000 25,000
100,000
862,900
Source: World Bank (1991, 114-17).
Many observers outside Japan argue that the Japanese government, in partic- ular the MITI, played a crucial role in the rapid industrialization and export expansion in postwar Japan. It is true that the Japanese government (in particu- lar the MITI) implemented various postwar industrial and export promotion policy measures. For a comprehensive analysis of Japan’s industrial policy, see

203 Japan’s Development Cooperation and Economic Development in East Asia
Table 8.2 Investment Financing by Source in Postwar Japan (%)
~~ ~~
1952-54 1955-59 1960-64 1965-67
Bank loans 52.2 62.1 63.5 73.5 Government loans 28.4 20.5 15.0 16.8 Bond 5.6 3.4 5.6 5.5 Stock 13.8 14.1 15.9 4.1
Total 100.0 100.0 100.0 100.0
Source: Kodama (1994).
Komiya, Okuno, and Suzumura (1988) and Itoh et al. (1991). However, the MITI did not always lead the private sector, and private companies did not always respond as the MITI expected. Relevant anecdotes on Japan’s industrial policy are presented in Ohkawa and Kohama (1989, chap. 8).
The most important factor in explaining Japan’s rapid economic growth was not industrial policy but the dynamism of the private sector and the limited role played by the government. Industrial policy was successful only when it assisted the efficiency-oriented management of the economy based on the dynamism of the private sector, or, in other words, the market mechanism. The Japanese government simply provided the basic infrastructure and a competi- tive economic environment. This is the secret of Japan’s postwar economic success.
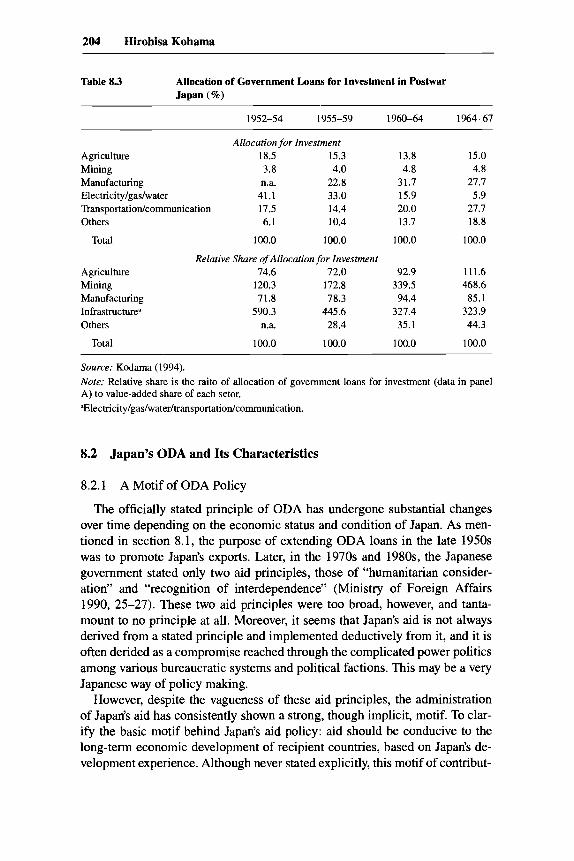
In order to realize the above-mentioned private initiatives, political stability, continuity of economic policy, and provision of basic infrastructure are indis- pensable. Table 8.2 shows investment financing by source. This table shows that the weight of government loans for investment was less than 20 percent during the postwar rapid growth period. Moreover government loans for fi- nancing manufacturing investment were relatively small compared with the government loans for infrastructure and mining (table 8.3). These figures indi- cate that government loans, one of the major tools of industrial policy, were used indirectly for industrialization through the provision of public goods. I think this fact is very important in understanding the role of government in the process of economic development.
In the following section, the characteristics of Japan’s ODA are outlined. In section 8.3, economic cooperation with East Asia and the expansion of Japan’s ODA are discussed. In section 8.4, I will outline my view of East Asian dyna- mism, and the role of development cooperation is presented. Major conclu- sions are summarized in the final section.
204 Hirohisa Kohama
Table 8.3 Allocation of Government Loans for Investment in Postwar Japan (%I
1952-54 1955-59 1960-64 1964-67
Allocarion for Invesrment Agriculture 18.5 15.3 Mining 3.8 4.0 Manufacturing n.a. 22.8 Electricity/gas/water 41.1 33.0 Transportationkommunication 17.5 14.4 Others 6.1 10.4
Total 100.0 100.0
13.8 15.0 4.8 4.8
31.7 27.1 15.9 5.9 20.0 21.7 13.7 18.8
100.0 100.0
Relarive Share of Allocarion for Invesfmenr Agriculture 74.6 72.0 92.9 111.6 Mining 120.3 172.8 339.5 468.6 Manufacturing 71.8 78.3 94.4 85.1 Infrastructure’ 590.3 445.6 321.4 323.9 Others n.a. 28.4 35.1 44.3
Total 100.0 100.0 100.0 100.0
Source: Kodama (1994). Nore: Relative share is the raito of allocation of government loans for investment (data in panel A) to value-added share of each setor. “Electricity/gas/water/transportation/communication,
8.2 Japan’s ODA and Its Characteristics
8.2.1 A Motif of ODA Policy
The officially stated principle of ODA has undergone substantial changes over time depending on the economic status and condition of Japan. As men- tioned in section 8.1, the purpose of extending ODA loans in the late 1950s was to promote Japan’s exports. Later, in the 1970s and 1980s, the Japanese government stated only two aid principles, those of “humanitarian consider- ation” and “recognition of interdependence” (Ministry of Foreign Affairs 1990, 25-27). These two aid principles were too broad, however, and tanta- mount to no principle at all. Moreover, it seems that Japan’s aid is not always derived from a stated principle and implemented deductively from it, and it is often derided as a compromise reached through the complicated power politics among various bureaucratic systems and political factions. This may be a very Japanese way of policy making.
However, despite the vagueness of these aid principles, the administration of Japan’s aid has consistently shown a strong, though implicit, motif. To clar- ify the basic motif behind Japan’s aid policy: aid should be conducive to the long-term economic development of recipient countries, based on Japan’s de- velopment experience. Although never stated explicitly, this motif of contribut-

205 Japan’s Development Cooperation and Economic Development in East Asia
ing to the recipient’s long-term development has comprised the background of Japan’s policy formation and seems to have been broadly accepted among policymakers in the Japanese government. The government announced the ODA Charter in June 1992.
8.2.2
Teranishi 1992):
The Relationship between ODA and Development Policy
Four basic characteristics of Japan’s ODA have been identified (Kohama and
1. low share of grants, 2. emphasis on project financing, although the share of policy-based lending
(PBL) is increasing, in cooperation with the World Bank adjustment lending, 3. emphasis on the request principle, or the principle of extending aid on a
request basis, and 4. emphasis on the self-help efforts of a recipient country. Needless to say, it is important to note that these characteristics stand in
close relationship to the Japanese view of economic development policy de- scribed in the previous section and, in a sense, could be regarded as logical consequences of it. The relationship is most apparent in the emphasis on the request principle. Since the degree of underdevelopment of markets and the accumulation of learning capability differs among countries for reasons other than their relative phases of development, Japan’s aid policy puts special em- phasis on maintaining a different approach for each recipient country. The pol- icy not only avoids the application of a uniform development strategy, it recom- mends that a recipient country devise its own methods of coping with obstacles to development. Consequently, emphasis on self-help constitutes another char- acteristic of Japan’s approach, and as for the choice of objectives of aid, the basic stance is passively reacting to the request emanating from the recipient’s own initiatives.
In this regard, Japan’s aid is expected to support the developing countries’ initiatives for development and is based on the understanding that economic development be promoted by self-help efforts. Therefore, it is implicitly under- stood among technocrats in Japan that it is not desirable to force policy reforms by placing conditions on the recipients of aid money. I am not saying that policy reforms are unnecessary. But compared with forced reforms without substantial policy dialogue, policy reform efforts following the recipient’s own initiatives are much more effective in promoting economic development.
The Japanese preference for project aid and reluctance to pursue PBL also reflect its views on development policy. From the viewpoint of organizational efficiency, project aid seems to be the most suitable instrument for the effective implementation of aid, since it contributes directly to the enhancement of indi- vidual organizations or production units, either by transferring technology or by breaking particular bottlenecks.
The high share of ODA loans from Japan also merits special attention. Com- pared with grants, recipient countries tend not to abuse ODA loans because

206 Hirohisa Kohama
they must be repaid in the future. From this viewpoint, the low share of grants in Japan’s aid is nothing to be ashamed of, but has its own positive effect in offsetting the shortcomings of grants.
8.3 Economic Cooperation with East Asia and Japan’s Presence: Description
8.3.1 Development Cooperation
Japan started giving aid in the 1950s. Japan’s ODA was less than $500 mil- lion in the 1960s but started to increase in the 1980s. It is reported that by 1992 Japan’s ODA had increased to more than $11 billion (for a per capita ODA budget of about $100).
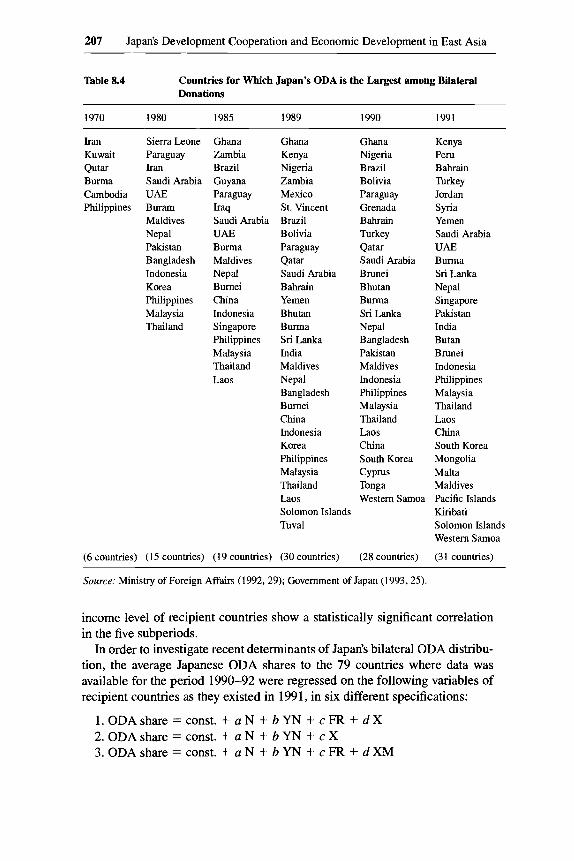
The presence of Japan’s ODA in developing countries is becoming more and more apparent. In 1970, there were six countries for which Japan’s ODA was the largest among bilateral donors. In 1991, there were 31 (table 8.4). In 1989 Japan was the top donor for 30 developing countries. Among these 30, Japan’s ODA was larger than the financial flow from international organizations, ex- cept in the cases of Ghana, Kenya, St. Vincent, India, Nepal, and Laos.
It is often suggested that the quality of Japan’s ODA is low. For example, DAC review of Japan’s ODA in 1993 stated that the terms of Japan’s ODA were more severe than those of other DAC member countries due to the low grant ratio. Indeed, Japan’s grant ratio and grant element (GE) are among the lowest of DAC member countries. The tied-aid ratio is also an indicator of aid quality. When Japan started giving ODA loans in the late 1950s, its tied-aid ratio was almost 100 percent, which meant all aid money was used to import Japanese goods. However, the ratio of tied aid among Japanese ODA loans has declined remarkably and is now one of the lowest of DAC member countries.
The geographical distribution of Japanese ODA is shown in table 8.5. The share of Japan’s ODA that went to Asian countries was more than 70 percent in the 1970s, but it decreased to 60 percent in 1990. This reflects the fact that Japan’s aid is extended to those countries with which it has close economic relations such as trade and direct investment.
Some economists have conducted regression analyses in order to find the determinants of Japan’s bilateral ODA distribution. Teranishi (1 983) investi- gated the determinants of Japan’s ODA distribution for 1975-79. He found that this distribution bears a strong relation to Japan’s exports to and the per capita GNP of recipient countries. Okamoto and Yokota (1992) also empirically ana- lyzed the determinants of Japan’s bilateral ODA distribution for the period 1975-89 with five subperiods. They found that the coefficients of Japan’s ex- ports to, income level of, and population of recipient countries show a statisti- cally significant correlation with expected signs for total ODA and grant distri- bution. But in the case of Japan’s ODA loan share, no estimated coefficients of
207 Japan’s Development Cooperation and Economic Development in East Asia
Table 8.4 Countries for Which Japan’s ODA is the Largest among Bilateral Donations
1970 1980 1985 1989 1990 1991
Iran Sierra Leone Kuwait Paraguay Qutar Iran Burma Saudi Arabia Cambodia UAE Philippines Buram
Maldives Nepal Pakistan Bangladesh Indonesia Korea Philippines Malaysia Thailand
Ghana Zambia Brazil Guyana Paraguay
Iras Saudi Arabia UAE Burma Maldives Nepal Bumei China Indonesia Singapore Philippines Malaysia Thailand Laos
Ghana Kenya Nigeria Zambia Mexico St. Vincent Brazil Bolivia Paraguay Qatar Saudi Arabia Bahrain Yemen Bhutan Burma Sri Lanka India Maldives Nepal Bangladesh Bumei China Indonesia Korea Philippines Malaysia Thailand Laos Solomon Islands Tuval
Ghana Nigeria Brazil Bolivia Paraguay Grenada Bahrain Turkey Qatar Saudi Arabia Brunei Bhutan Burma Sri Lanka Nepal Bangladesh Pakistan Maldives Indonesia Philippines Malaysia Thailand Laos China South Korea
Cyprus Tonga Western Samoa
Kenya Peru Bahrain Turkey Jordan Syria Yemen Saudi Arabia UAE Burma Sri Lanka Nepal Singapore Pakistan India Butan Brunei Indonesia Philippines Malaysia Thailand Laos China South Korea Mongolia Malta Maldives Pacific Islands Kiribati Solomon Islands Western Samoa
(6 countries) (15 countries) (19 countries) (30 countries) (28 countries) (31 countries)
Source: Ministry of Foreign Affairs (1992,29); Government of Japan (1993,25)
income level of recipient countries show a statistically significant correlation in the five subperiods.
In order to investigate recent determinants of Japan’s bilateral ODA distribu- tion, the average Japanese ODA shares to the 79 countries where data was available for the period 1990-92 were regressed on the following variables of recipient countries as they existed in 1991, in six different specifications:
1. ODAshare = const. + a N + b Y N + cFR + d X 2. ODA share = const. + a N + b YN + c X 3. ODAshare = const. + a N + bYN + cFR + d X M

208 Hirohisa Kohama
Table 8.5 Geographical Distribution of Japan’s ODA, 1990 (net disbursement; million U.S. $)
Financial Technical Grant Assistance ODA Loans ODA Total
Asia East Asia Southeast Asia South Asia Others
Middle East Africa Latin America Oceania Europe
Others Eastern Europe
Total
639.16 38.61
273.00 321.55
4.34 113.24 423.23 117.17 61.40 0.00 0.00
19.85
1,374.05
707.39 275.51 35 1.24 76.30 4.34
96.06 124.89 199.10 32.00 11.85 5.38
474.06
1,645.35
2,770.00 520.59
1,755.00 494.41
0.00 495.35 243.63 244.92 20.13
146.11 147.73
0.00
3,920.16
4.1 16.55 834.72
2,379.24 898.25
4.34 704.65 791.75 561.20 11 3.53 157.96 153.12 493.91
6,939.56
Source: Ministry of Foreign Affairs (1991).
4. ODA share = const. + a N + b YN + c XM 5. ODA share = const. + a N + b Y N + c F R + dXM + e AD 6. ODA share = const. + a N + b Y N + c X M + dAD
ODA share: Gross disbursement of Japan’s total ODA, or net disburse- ment of Japan’s total ODA
N: Population (million; 1991) YN: Per capita GNP (U.S.$; 1991) FR: Gross international reserves (months of import coverage;
1991) X: Japan’s exports (million U.S.$; 1991) XM: Japan’s exports to and imports from the recipient country
(million U.S.$; 1991) AD: Asian dummy (Asian developing countries = 1, other de-
veloping countries = 0)
Shares of Japan’s ODA categories (gross disbursement of total ODA, net disbursement of total ODA; 1990-92 average) are regressed in the six specifi- cations shown above. Estimated results for all specifications are presented in tables 8.6 and 8.7. Although all estimated coefficients of FR are not statisti- cally significant, other variables are significant. Income levels are all signifi- cantly negative, and foreign trade variables are significantly positive. Japan’s ODA shares are higher for lower-income countries and for countries with closer foreign trade relations. All Asian dummies except for technical assis- tance share are significantly positive. Japan’s ODA shares to Asian developing
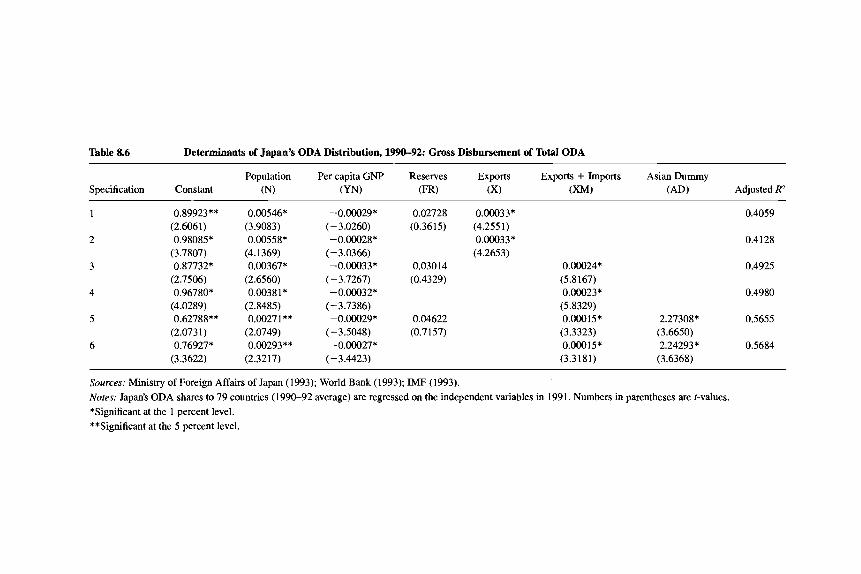
Table 8.6 Determinants of Japan’s ODA Distribution, 19!M-92: Gross Disbursement of Total ODA
Population Per capita GNP Reserves Exports Exports + Imports Asian Dummy Specification Constant (N) (YN) (W (X) (XM) (AD) Adjusted RZ
~~
1 0.89923**
2 0.98085*
3 0.87732*
4 0.96780*
5 0.62788**
6 0.76927*
(2.6061)
(3.7807)
(2.7506)
(4.0289)
(2.0731)
(3.3622)
0.00546* (3.9083) 0.00558*
(4.1369) 0.00367*
(2.6560) 0.0038 1 *
(2.8485) 0.0027 1 ** (2.0749) 0.00293**
(2.3217)
-0.00029* (- 3.0260)
(-3.0366)
(-3.7267)
(-3.7386)
(- 3.5048)
(- 3.4423)
-0.00028*
-0.00033*
-0.00032*
-0.00029*
-0.00027*
0.02728 0.00033* (0.3615) (4.2551)
0.00033* (4.2653)
0.03014 (0.4329)
0.04622 (0.7157)
0.00024* (5.8167) 0.00023* (5.8329) 0.00015* (3.3323) 0.00015* (3.3181)
0.4059
0.4128
0.4925
0.4980
2.27308* 0.5655 (3.6650) 2.24293* 0.5684
(3.6368)
Sources: Ministry of Foreign Affairs of Japan (1993); World Bank (1993); IMF (1993). Notes: Japan’s ODA shares to 79 countries (1990-92 average) are regressed on the independent variables in 1991. Numbers in parentheses are ?-values. *Significant at the 1 percent level. **Significant at the 5 percent level.

Table 8.7 Determinants of Japan’s ODA Distribution, 1990-92: Net Disbursement of Total ODA
Population Per capita GNP Reserves Exports Exports + Imports Asian Dummy (N) (FR) (XI (XM) (AD) Adjusted R2 Specification Constant
1 0.8401 8**
2 0.92590*
3 0.82069**
4 0.92140*
5 0.61053***
6 0.75462*
(2.4827)
(3.6383)
(2.579 1)
(3.8530)
(1.9692)
(3.2220)
0.00655* (4.7759) 0.00667*
(5.041 2) 0.00501*
(3.6359) 0.005 17*
(3.8720) 0.00420*
(3.1451) 0.00443*
(3.4270)
-0.00025** (-2.6296) -0.00024** (-2.6223) -0.00029* (-3.3437) - 0.00028 * (-3.3330) -0.00026* (-3.0897) -0.00025* (-3.0183)
0.02865 0.00022* (0.3871) (2.9169)
0.00022* (2.9089)
0.03355 (0.4830)
0.047 1 (0.7 124)
0.00018* (4.3997) O.O0018* (4.3965) O.o0010** (2.2874) 0.00010** (2.2692)
0.3936
0.4005
0.4641
0.4695
1.9 1505 * 0.5 169 (3.0163) 1.88433* 0.5201
(2.9848)
Sources: Ministry of Foreign Affairs (1993); World Bank (1993); IMF (1993). Notes: Japan’s ODA shares to 79 countries (1990-92 average) are regressed on the independent variables in 1991. Numbers in parentheses are t-values. *Significant at the 1 percent level. **Significant at the 5 percent level. ***Significant at the 10 percent level.
211 Japan’s Development Cooperation and Economic Development in East Asia
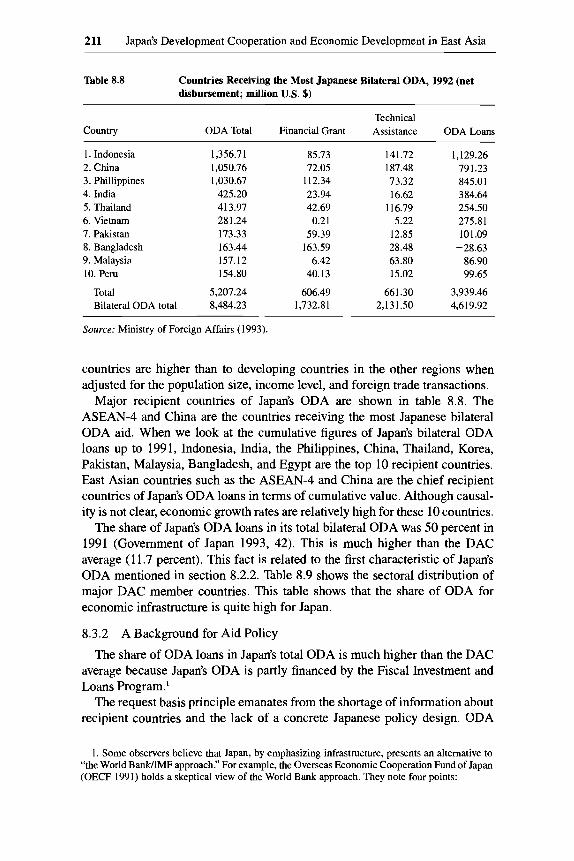
Table 8.8 Countries Receiving the Most Japanese Bilateral ODA, 1992 (net disbursement; million U.S. $)
Country Technical
ODA Total Financial Grant Assistance ODA Loans
1. Indonesia 2. China 3. Phillippines 4. India 5. Thailand 6. Vietnam 7. Palastan 8. Bangladesh 9. Malaysia 10. PeN
1,356.7 1 1,050.76 1,030.67
425.20 413.97 28 1.24 173.33 163.44 157.12 154.80
85.73 72.05
112.34 23.94 42.69
0.21 59.39
163.59 6.42
40.13
141.72 187.48 73.32 16.62
116.79 5.22
12.85 28.48 63.80 15.02
~
1,129.26 79 1.23 845.01 384.64 254.50 275.81 101.09
-28.63 86.90 99.65
Total 5,207.24 606.49 661.30 3,939.46 Bilateral ODA total 8,484.23 1,732.81 2,131.50 4,619.92
Source: Ministry of Foreign Affairs (1993).
countries are higher than to developing countries in the other regions when adjusted for the population size, income level, and foreign trade transactions.
Major recipient countries of Japan’s ODA are shown in table 8.8. The ASEAN-4 and China are the countries receiving the most Japanese bilateral ODA aid. When we look at the cumulative figures of Japan’s bilateral ODA loans up to 1991, Indonesia, India, the Philippines, China, Thailand, Korea, Pakistan, Malaysia, Bangladesh, and Egypt are the top 10 recipient countries. East Asian countries such as the ASEAN-4 and China are the chief recipient countries of Japan’s ODA loans in terms of cumulative value. Although causal- ity is not clear, economic growth rates are relatively high for these 10 countries.
The share of Japan’s ODA loans in its total bilateral ODA was 50 percent in 1991 (Government of Japan 1993, 42). This is much higher than the DAC average (1 1.7 percent). This fact is related to the first characteristic of Japan’s ODA mentioned in section 8.2.2. Table 8.9 shows the sectoral distribution of major DAC member countries. This table shows that the share of ODA for economic infrastructure is quite high for Japan.
8.3.2
The share of ODA loans in Japan’s total ODA is much higher than the DAC average because Japan’s ODA is partly financed by the Fiscal Investment and Loans Program.’
The request basis principle emanates from the shortage of information about recipient countries and the lack of a concrete Japanese policy design. ODA
A Background for Aid Policy
1. Some observers believe that Japan, by emphasizing infrastructure, presents an alternative to “the World BanklIMF approach.” For example, the Overseas Economic Cooperation Fund of Japan (OECF 1991) holds a skeptical view of the World Bank approach. They note four points:
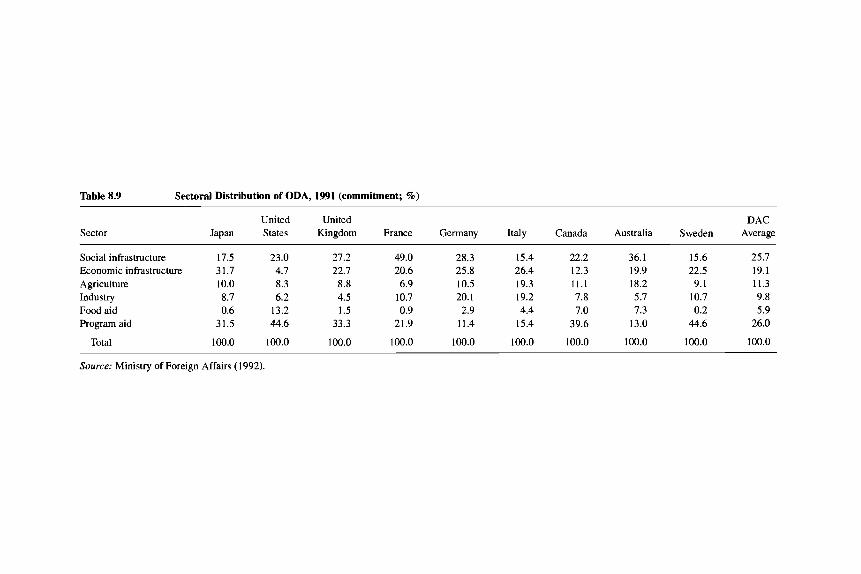
Table 8.9 Sectoral Distribution of ODA, 1991 (commitment; %)
Sector United United DAC
Japan States Kingdom France Germany Italy Canada Australia Sweden Average
Social infrastructure 17.5 23.0 27.2 49.0 28.3 15.4 22.2 36.1 15.6 25.7 Economic infrastructure 31.7 4.7 22.7 20.6 25.8 26.4 12.3 19.9 22.5 19.1 Agriculture 10.0 8.3 8.8 6.9 10.5 19.3 11.1 18.2 9.1 11.3 Industry 8.7 6.2 4.5 10.7 20.1 19.2 7.8 5.7 10.7 9.8 Food aid 0.6 13.2 1.5 0.9 2.9 4.4 7.0 7.3 0.2 5.9 Program aid 31.5 44.6 33.3 21.9 11.4 15.4 39.6 13.0 44.6 26.0
Total 100.0 100.0 100.0 100.0 100.0 100.0 100.0 100.0 100.0 100.0
Source: Ministry of Foreign Affairs (1992).

213 Japan’s Development Cooperation and Economic Development in East Asia
policy is determined through negotiation among four agencies (Ministry of Finance, Ministry of Foreign Affairs, MITI, and Economic Planning Agency) and, by and large, is a product of compromise among the interests of these agencies.
When things are determined by consensus among four agencies, aid policy of a controversial nature is not easily realized, and instead those policies that everyone agrees with tend to be chosen. Thus the above-mentioned humanitar- ian considerations are important in ODA policy in Japan since no one could effectively oppose this philosophy. A quarter of Japan’s bilateral ODA is issued to satisfy basic human needs (BHNs) or to alleviate poverty. The policy objec- tive of economic development in recipient countries is likewise easily accom- modated. Since this is related to improving the living standards of the poor, there would be no effective objection to this.
Moreover, the future of the Japanese economy depends heavily on the main- tenance of the free trade system and the expansion of world trade. ODA as a tool for expanding world trade as well as bringing about political stability in developing countries conforms, in this sense, with Japan’s “national interest.”
8.3.3
Although Japan’s ODA policy is based on the country’s past experiences with economic development, new important elements are emerging, reflecting the rapid changes in global conditions and in the Japanese position therein. Two topics will be taken up below: strategic aid and environmental considera- tions.
Current Issues in ODA Policy
Strategic Aid
There exists a movement in the Ministry of Foreign Affairs and in the former ruling Liberal Democratic party (LDP) to increase the emphasis on “strategic considerations” in ODA.
In a Diet debate on April 10, 1991, Toshiki Kaifu, then prime minister of Japan, announced the existence of ODA policy considerations relating to stra- tegic factors such as military expenditure in recipient countries. This is not a
1. Structural adjustment is not sufficient for sustainable development. It is necessary to intro-
2. It is necessary to protect the domestic industry to some extent to allow a viable export indus-
3. It is indispensable to have development financing institutions lending with a subsidized inter-
4. We must carry out privatization only when adequate conditions, such as the existence of
duce investment promotion measures.
try to develop.
est rate, under some circumstances, in order to maximize the social welfare.
well-functioning markets, are achieved.
However, emphasis on project financing does not imply that Japan has a well-defined alternative development model.
214 Hirohisa Kohama
new policy meant to replace the two basic philosophies of ODA mentioned in section 8.1 -humanitarian considerations and recognition of interdependence. However, the following four points were new considerations announced in April 1991. The Japanese government now takes the following into consider- ation in providing bilateral ODA:
1. military expenditure in recipient countries, 2. the development and production of arms in recipient countries, 3. exports and imports of arms in recipient countries, 4. the trend of democratization, introduction of a market-oriented economic
system, basic human rights, and freedom in recipient countries. Based on these four points, the ODA Charter, adopted by the Cabinet on
June 30, 1992, states four principles and geographical and sectoral priorities. The four principles of the ODA Charter are:
1. Environmental conservation and development should be simultaneously pursued.
2. Any use of ODA for military purposes or for aggravation of international conflicts should be avoided.
3. Full attention should be paid to trends of military expenditure and trade in arms of recipient countries for Japan’s aid giving.
4. Full attention should be paid to efforts for democratization and introduc- tion of a market economy of recipient countries for Japan’s aid giving.
Regional priorities for Asian developing countries are clearly stated in the ODA Charter. Five sectoral priorities are (1) environmental problems, (2) basic human needs, (3) human resource development, (4) infrastructure develop- ment, and (5) structural adjustment.
It is desirable to implement development aid based on an explicit policy. However, once the policy is announced, there should not be too many excep- tions. This poses interesting questions with regard to aid to China. Was resum- ing ODA to China consistent with the above four points? Is China not a large exporter of arms? Are human rights and freedom maintained in China?
Japan’s ODA by the Ministry of Foreign Affairs of Japan (1992, 30-34; 1993, chap. 2) discussed the issues related to the above four points and the ODA Charter. It pointed out various cases where ODA was stopped due to a coup d’etat or other human rights violations. But nothing is mentioned about China. If China’s case is to be an exception, the Japanese government should present the reasons for the exceptional treatment of China. Without explicit reasoning it is difficult to understand the inconsistency between China’s situa- tion and resumption of Japanese aid to China.
Environment and Development Aid
The OECD ministerial meeting on the environment and development was held in December 1991, and the U.N. Conference on the Environment and Development (UNCED) was held in Rio de Janeiro in June 1992. The central issue was how to balance economic development and environmental protec- tion, in other words, how to achieve sustainable development.

215 Japan’s Development Cooperation and Economic Development in East Asia
During the long process of economic development, people in industrialized countries paid little attention to environmental issues. For developing coun- tries, economic development is a policy of first priority. It is hard for such countries to pay more attention to environmental issues, but deterioration of the environment in developing countries has external diseconomies for everyone.
We should recognize the fact that industrialized countries have attained eco- nomic development without due consideration to environmental issues by present-day standards. Donor governments should make compensation. It is our view that, in order to cope with the issue of external diseconomies, we should provide more aid to a recipient country which plans to pay more atten- tion to environmental issues in its development planning.
8.3.4 Financial Flow to East Asia
As is well known, in its initial phase of industrialization Korea depended heavily on external financing. When Korea started its first five-year plan in 1962, nearly 80 percent of gross domestic fixed capital formation (GDFCF) was financed by external sources. Even in its third five-year plan period (1972- 76), which marked the start of heavy industrialization in Korea, the ratio of foreign capital to GDFCF was still higher than 20 percent.
Accumulated foreign borrowing in Korea was an important policy issue around 1980. In terms of external debt Korea was among the worst 10 in 1980. But nobody claims that Korea has an external debt problem now. Due to its high economic growth and export expansion, Korea’s external debt in relation to its economic size declined sharply. This is often attributed to the shift to an export-oriented development strategy in Korea. In certain phases of economic development, developing counties often depend on external sources for fi- nancing investment. The crucial point of external financing is how to use for- eign savings efficiently.
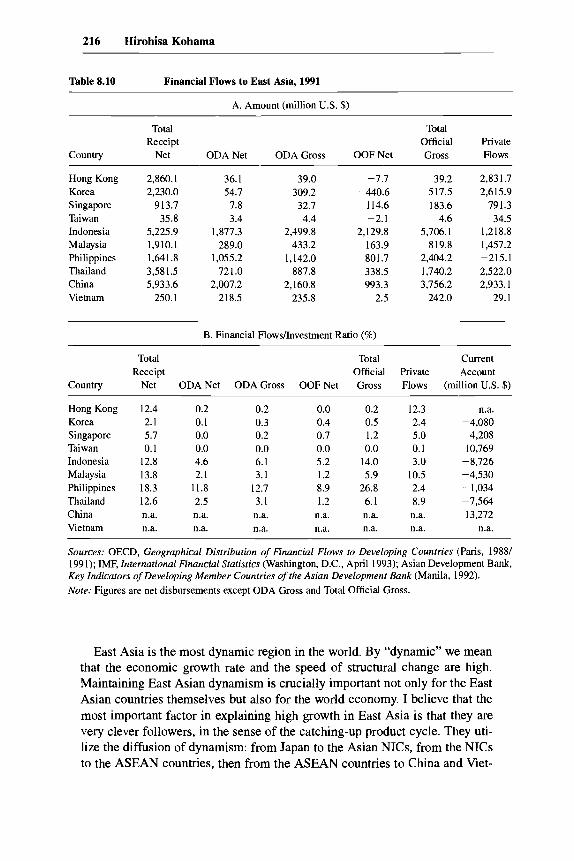
Financial flow to East Asian countries in 1991 is shown in Table 8.10. Panel A shows the absolute value of the selected categories of external financing, and Panel B compares the ratio of external financial flow to investment.
Ratios of financial flow to investment in Hong Kong and the ASEAN-4 were higher than 12 percent in 1991, higher than those of all Asian NICs, except Hong Kong. Dependence on official flow increased in the 1980s for East Asian countries. The figures in the table seem to suggest that external financing, both official and private, makes substantial contributions to capital accumulation and economic development in East Asia.
8.4 East Asian Dynamism and Development Cooperation
Some East Asian developing countries, such as Indonesia, China, and Viet- nam, are in the process of structural adjustment. Indonesia’s economy is shift- ing from oil-based to industry-based, by a series of deregulation policies. China and Vietnam are in the midst of the transition from centrally planned economies to market economies.
216 Hirohisa Kohama
Table 8.10 Financial Flows to East Asia, 1991
A. Amount (million U.S. $)
Total Total Receipt Official Private
Country Net ODA Net ODA Gross OOF Net Gross Flows
Hong Kong Korea Singapore Taiwan Indonesia Malaysia Philippines Thailand China Vietnam
2,860.1 2,230.0
913.7 35.8
5,225.9 1,910.1 1,641.8 3,581.5 5,933.6
250.1
36.1 54.7 7.8 3.4
1,877.3 289.0
1,055.2 72 1 .O
2,007.2 218.5
39.0 309.2 32.7 4.4
2,499.8 433.2
1,142.0 887.8
2,160.8 235.8
-7.7 -440.6
114.6 -2.1
2,129.8 163.9 801.7 338.5 993.3
2.5
39.2 517.5 183.6
4.6 5,706.1
819.8 2,404.2 1,740.2 3,756.2
242.0
2,83 1.7 2,615.9
791.3 34.5
1,218.8 1,457.2 -215.1 2,522.0 2,933.1
29.1
B. Financial Flowsfinvestment Ratio (%)
Total Total Current Receipt Official Private Account
Country Net ODA Net ODA Gross OOF Net Gross Flows (million U.S. $)
Hong Kong Korea Singapore Taiwan Indonesia Malaysia Philippines Thailand China Vietnam
12.4 2.1 5.7 0.1
12.8 13.8 18.3 12.6 n.a. n.a.
0.2 0.1 0.0 0.0 4.6 2.1
11.8 2.5 n.a. n.a.
0.2 0.3 0.2 0.0 6.1 3.1
12.7 3. I n.a. n.a.
0.0 -0.4
0.7 0.0 5.2 1.2 8.9 1.2
n.a. n.a.
0.2 0.5 1.2 0.0
14.0 5.9
26.8 6.1 n.a. n.a.
12.3 2.4 5.0 0.1 3 .O
10.5 -2.4
8.9 n.a. n.a.
n.a. -4,080
4,208 10,769
-8,726 -4,530 - 1,034 -7,564 13,272
n.a.
Sources: OECD, Geographical Distribution of Financial Flows to Developing Countries (Paris, 19881 1991); IMF, International Financial Statistics (Washington, D.C., April 1993); Asian Development Bank, Key Indicators of Developing Member Countries of the Asian Development Bank (Manila, 1992). Note: Figures are net disbursements except ODA Gross and Total Official Gross.
East Asia is the most dynamic region in the world. By “dynamic” we mean that the economic growth rate and the speed of structural change are high. Maintaining East Asian dynamism is crucially important not only for the East Asian countries themselves but also for the world economy. I believe that the most important factor in explaining high growth in East Asia is that they are very clever followers, in the sense of the catching-up product cycle. They uti- lize the diffusion of dynamism: from Japan to the Asian NICs, from the NICs to the ASEAN countries, then from the ASEAN countries to China and Viet-
217 Japan’s Development Cooperation and Economic Development in East Asia
nam. For China and Vietnam the shift from centrally planned economies to market economies and open economic policy are important to their becoming successful followers. They understand the mechanisms to promote develop- ment and the role of government. In spite of popular misunderstanding of Ja- pan’s industrial policy (Johnson 1982), technocrats in East Asia understand that the crucial point is to utilize private dynamism. The role of government is not to intervene in the market directly, but to maintain a competitive economic environment and provide basic infrastructure. Further, in East Asia, competi- tion among countries is quite fierce. When one country announces a deregula- tion policy for foreign direct investment, neighboring countries try to deregu- late their foreign investment policies as well.
Foreign direct investment played a crucial role in the diffusion of dynamism. Many companies from Japan, Korea, Taiwan, and other more developed coun- tries are rushing to Thailand, Indonesia, China, and Vietnam. For example, many export-oriented firms have rushed into Indonesia since the start of a se- ries of deregulation policies in the mid-1980s. Since then, the change in the Indonesian export structure has been remarkable. In 1985 more than two-thirds of Indonesia’s exports were oil and gas. By 1993, manufactured exports had increased sharply to more than 60 percent. Relatively open trade and foreign investment policies have become widespread in East Asian countries recently. However, the shortage of basic infrastructure, such as electricity and port facil- ities, is a serious problem for these countries.
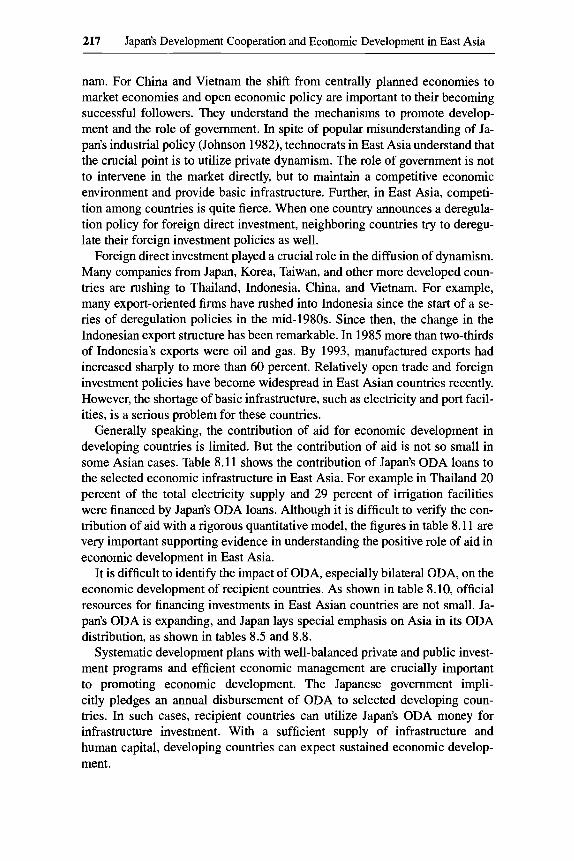
Generally speaking, the contribution of aid for economic development in developing countries is limited. But the contribution of aid is not so small in some Asian cases. Table 8.11 shows the contribution of Japan’s ODA loans to the selected economic infrastructure in East Asia. For example in Thailand 20 percent of the total electricity supply and 29 percent of irrigation facilities were financed by Japan’s ODA loans. Although it is difficult to verify the con- tribution of aid with a rigorous quantitative model, the figures in table 8.11 are very important supporting evidence in understanding the positive role of aid in economic development in East Asia.
It is difficult to identify the impact of ODA, especially bilateral ODA, on the economic development of recipient countries. As shown in table 8.10, official resources for financing investments in East Asian countries are not small. Ja- pan’s ODA is expanding, and Japan lays special emphasis on Asia in its ODA distribution, as shown in tables 8.5 and 8.8.
Systematic development plans with well-balanced private and public invest- ment programs and efficient economic management are crucially important to promoting economic development. The Japanese government impli- citly pledges an annual disbursement of ODA to selected developing coun- tries. In such cases, recipient countries can utilize Japan’s ODA money for infrastructure investment. With a sufficient supply of infrastructure and human capital, developing countries can expect sustained economic develop- ment.
218 Hirohisa Kohama
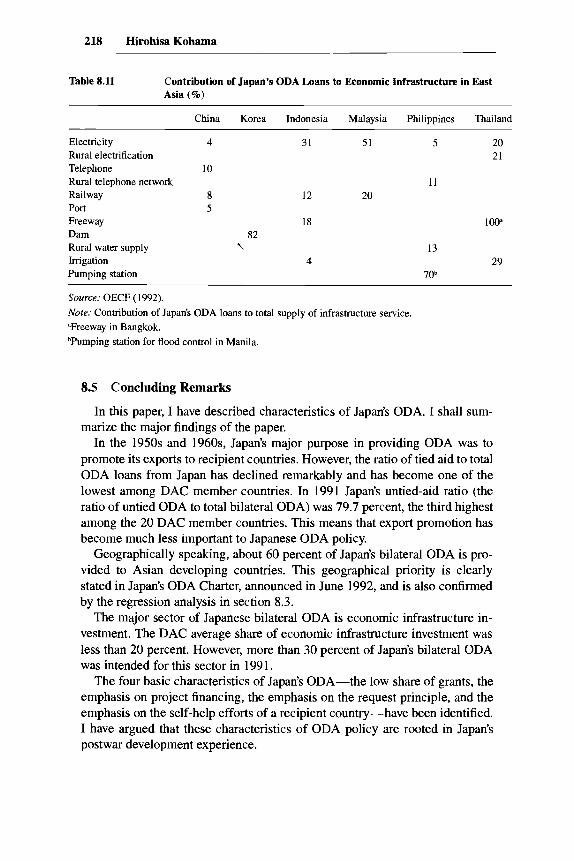
Table 8.11 Contribution of Japan’s ODA Loans to Economic Infrastructure in East Asia (%)
China Korea Indonesia Malaysia Philippines Thailand
Electricity 4 Rural electrification Telephone 10 Rural telephone network Railway 8 Port 5 Freeway Dam Rural water supply Irrigation Pumping station
82 \
31 51 5 20 21
11 12 20
18 loo’
4 13
70b 29
Source: OECF (1992). Note: Contribution of Japan’s ODA loans to total supply of infrastructure service. “Freeway in Bangkok. bPumping station for flood control in Manila.
8.5 Concluding Remarks
In this paper, I have described characteristics of Japan’s ODA. I shall sum- marize the major findings of the paper.
In the 1950s and 1960s, Japan’s major purpose in providing ODA was to promote its exports to recipient countries. However, the ratio of tied aid to total ODA loans from Japan has declined remarkably and has become one of the lowest among DAC member countries. In 1991 Japan’s untied-aid ratio (the ratio of untied ODA to total bilateral ODA) was 79.7 percent, the third highest among the 20 DAC member countries. This means that export promotion has become much less important to Japanese ODA policy.
Geographically speaking, about 60 percent of Japan’s bilateral ODA is pro- vided to Asian developing countries. This geographical priority is clearly stated in Japan’s ODA Charter, announced in June 1992, and is also confirmed by the regression analysis in section 8.3.
The major sector of Japanese bilateral ODA is economic infrastructure in- vestment. The DAC average share of economic infrastructure investment was less than 20 percent. However, more than 30 percent of Japan’s bilateral ODA was intended for this sector in 1991.
The four basic characteristics of Japan’s ODA-the low share of grants, the emphasis on project financing, the emphasis on the request principle, and the emphasis on the self-help efforts of a recipient country-have been identified. I have argued that these characteristics of ODA policy are rooted in Japan’s postwar development experience.

219 Japan’s Development Cooperation and Economic Development in East Asia
References Government of Japan. 1993. Wagakuni no Seiflr Kaihatsu Enjo no Jisshi Joky0 (Japan’s
ODA in fiscal year 1992). Tokyo: Government of Japan. Inoue, Ryuichiro, Hirohisa Kohama, and Shujiro Urata, eds. 1993. Industrial policy in
East Asia. Tokyo: Japan External Trade Organization. International Monetary Fund (Ih4F). 1993. Direction of trade statistics yearbook. Wash-
ington, D.C.: IME Itoh, Motoshige, Kazuharu Kiyono, Masahiro Okuno-Fujiwara, and Kotaro Suzumura.
1991. Economic analysis of industrial policy. San Diego: Academic. Johnson, C. 1982. MITI and the Japanese miracle: The growth of industrial policy,
1925-1975. Stanford, Calif.: Stanford University Press. Kodama, Toshihiro. 1994. Seifu no Yakuwari: Sangyo Seisaku (The role of government:
Industrial policy). In Meido in Japan (Made in Japan), ed. Hiroyuki Yoshikawa and Japan Commission on Industrial Performance. Tokyo: Daiyamondo-sha.
Kohama, Hirohisa, and Juro Teranishi. 1992. Japan’s ODA policy and economic devel- opment of recipient countries. Revised version of paper presented at conference on Development Cooperation Policies of Japan, the United States, and Europe, Institute of Developing Economies, Tokyo, January 29-30.
Kohama, Hirohisa, and Shujiro Urata. 1993. Industrial policy and development strategy in East Asia. In Industrialpolicy in East Asia, ed. R. Inoue, H. Kohama, and S. Urata. Tokyo: Japan External Trade Organization.
Komiya, Ryutaro, Masahiro Okuno, and Kotaro Suzumura, eds. 1988. Industrialpolicy of Japan. San Diego: Academic.
Ministry of Foreign Affairs of Japan. Annual. Wagakuni no Seifu Kaihatsu Enjo (Japan’s ODA). Tokyo: Association for Promotion of International Cooperation.
Ministry of International Trade and Industry of Japan (MITI). 1959. Keizai Kyoryoku no Genjo to Mondaiten (White Paper of Japan’s Economic Cooperation). Tokyo: MITI.
Overseas Economic Cooperation Fund of Japan (OECF). 1991. Issues related to the World Bank’s approach to structural adjustment-Proposal from a major partner. OECF Occasional Paper no. 1. Tokyo: OECF, October.
. 1992. ODA loans today (in Japanese). Tokyo: OECF. Ohkawa, Kazushi, and Hirohisa Kohama. 1989. Lectures on developing economies-
Japan’s experience and its relevance. Tokyo: University of Tokyo Press. Okamoto, Yumiko, and Kazuhiko Yokota. 1992. Nihon no Enjo Seisaku no Suryo
Bunseki (Empirical analysis of Japan’s aid policy). Kokusai Kaihatsu Kenkyu (Japan Society for International Development) 1, no. 2.
Teranishi, Juro. 1983. Wagakuni no Seifu Kaihatsu Enjo (ODA) Seisaku ni tsuite (On Japan’s ODA policy). Keizui Kenkyu (Institute of Economic Research, Hitotsubashi University) 34, no. 2.
World Bank. 1991. Segin Shakkan Kaiso (World Bank loans to Japan). Tokyo: World Bank.
. 1993. World development report. Washington, D.C.: World Bank. Yanagihara, Tom. 1990. Policy-based lending and Japanese policy. Paper presented at
the conference on Japan’s Surplus and Implications for Growth in Developing Coun- tries, Washington, D.C., March 9.
220 Hirohisa Kohama
Comment Chong-Hyun Nam
This is an interesting paper. I enjoyed it very much and I learned a lot from it. At the same time, I must say that I found it rather difficult to comment on, partly because it covers a wide range of issues and partly because it develops arguments based on facts about Japan’s postwar experience with which I am not too familiar. I will, however, talk about questions and issues that I would liked to have seen in a paper under the same title.
This paper gives a very good description of two major issues that are both important but only thinly related to each other. One concerns the development mechanism experienced by Japan during the postwar period, and the other con- cerns Japan’s development cooperation with developing nations in recent years.
I wholly agree with Kohama that Japan has been able to achieve its high degree of industrialization by finding the proper mix of infant-industry protec- tion and import liberalization during the postwar period, an extremely difficult task both in theory and in practice. Flexibility in the interaction mechanism between the private sector and the government and a preannounced liberaliza- tion plan have been effective in establishing a competitive environment.
I also agree with Kohama that developing nations are often burdened with underdeveloped domestic markets, lack of organizational efficiency, and so forth, and hence government intervention is often called for.
But Kohama goes one step further to claim that a competitive environment can be enhanced even in a protected and oligopolistic market such as postwar Japan’s because entrepreneurs will have a strong incentive to improve produc- tivity and international competitiveness under protection. Indeed, this may well be true in Japan, but I doubt the same argument will hold for other devel- oping nations. I wonder whether one might find counterexamples even in Ja- pan. It seems to me Japanese entrepreneurs did their best to improve productiv- ity and international competitiveness whether protection was given or not. This might have been especially the case when protection was perceived by entre- preneurs to be only a temporary measure. I hope there will be no misunder- standing on this point, especially in other developing nations who contemplate emulating Japan’s experience of import protection. In addition, I think Japan has become trapped by prolonged protection in agriculture, as well as in some service sectors such as the distribution system.
As for the second issue, that of Japan’s development cooperation with devel- oping nations, Kohama presents a rather lengthy description of the positive contribution of Japan’s official development assistance (ODA). No one can dis- pute the importance of ODA in terms of capital financing in developing na- tions. But it is also true that there are a number of issues of importance overrid- ing ODA in relation to Japan’s role in developing economic cooperation with developing nations. For example, I would liked to have seen a description of
Chong-Hyun Nam is professor of economics at Korea University.

221 Japan’s Development Cooperation and Economic Development in East Asia
the possibility of trade expansion, direct investment (including joint ventures), technology transfers, and the problem of leadership in the ongoing Uruguay Round negotiations for developing nations. But then that would be another paper.
Finally, Kohama addresses Korea’s development issues in one section of the paper. He talks about the importance of foreign capital in financing domestic investment and about Korea’s trade orientation with an ultra-export bias. This will be discussed more in detail in my paper presented in chapter 6 of this volume.
ConlIllent John Page
Careful analyses of the design strategies underlying bilateral aid and their pos- sible impact on the development strategies of recipient countries are rare. This is especially true in the case of the successful East Asian economies, where the focus of attention has been primarily on the roles of domestic resource accumulation and activist public policies in explaining their exceptional growth.’ Kohama’s paper is therefore welcome on two counts. First, it repre- sents an attempt to explain which elements of Japan’s own development experi- ence had the greatest impact on the design of aid strategy. And second, it tries to link aid strategy to some of the origins of success in other East Asian econo- mies. This is an ambitious task, and while the paper does not wholly succeed, it provides some interesting insights into a very poorly understood aspect of the Asian success story, regional contagion.
East Asia has a remarkable record of high and sustained economic growth. Most of this achievement is attributable to seemingly miraculous growth in just eight economies: Japan; the “four tigers,” Hong Kong, Republic of Korea, Singapore, and Taiwan; and the three newly industrializing economies (NIEs) of Southeast Asia, Indonesia, Malaysia, and Thailand. Since 1960, these eight have grown more than twice as fast as the OECD and the rest of East Asia, roughly three times as fast as Latin America and South Asia, and 25 times faster than sub-Saharan Africa. Between 1960 and 1985, real income per cap- ita increased more than four times in Japan and the four tigers and more than doubled in the Southeast Asian NIEs. If growth were randomly distributed, there is roughly one chance in 10 thousand that success would have been so regionally concentrated.
Relative geographical proximity is the most obvious shared characteristic of the successful Asian economies. East Asian economies have clearly benefited
John Page is chief economist of the Middle East and North Africa Region of the World Bank. 1 . See, e.g., World Bank (1993) which devotes little attention to the role of external assistance
in East Asia.

222 Hirohisa Kohama
from the kind of nonformal economic linkages geographic proximity encour- ages, including those in trade and investment flows. Despite the substantial development assistance flows to the region shown by Kohama, private capital flows dominate as a source of investment in all of the East Asian economies except Indonesia and the Philippines. Private capital flows have accelerated in the last decade, as northeast Asian manufacturers of labor-intensive exports moved their factories south to take advantage of lower wages. The share of foreign investment in total investment has increased over the decade, in con- trast to the share of development assistance. From the policy viewpoint, these linkages have been encouraged by macroeconomic stability and the generally liberal treatment of foreign investment. But even where foreign investment pol- icies have been restrictive, informal credit and information networks have helped investors to move capital relatively freely.
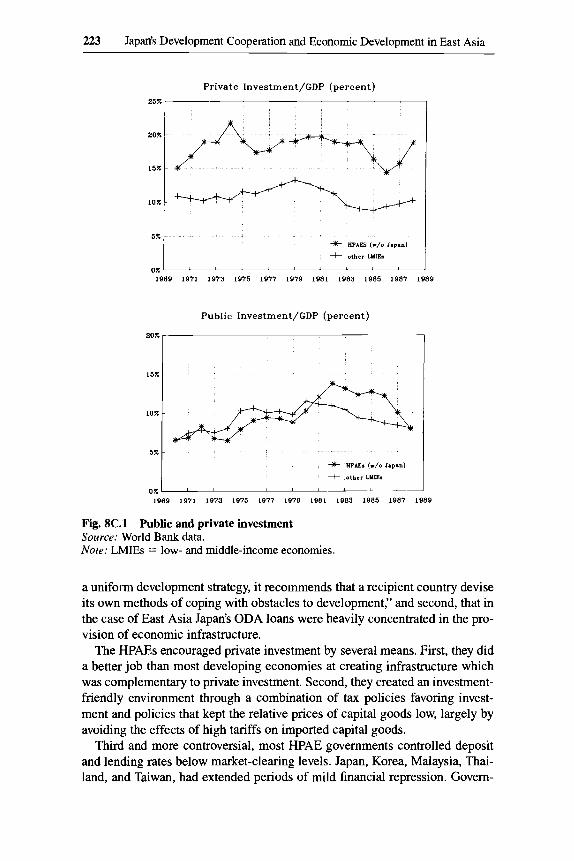
Kohama identifies one central factor, both as an essential principle underly- ing Japan’s aid strategy and as a major source of East Asia’s dynamism. In Kohama’s words, “technocrats in East Asia understand that the crucial point is to utilize private dynamism.” The extent to which the developing, high- performing Asian economies (HPAEs) have succeeded in tapping this dyna- mism is shown in figure 8C.1, which gives private and public investment as a share of GDP for a sample of 47 low- and middle-income economies (LMIEs) (including five of the developing country HPAEs).* Private investment is about 7 percentage points higher in the HPAEs than in other middle-income econo- mies. It rose from about 15 percent of GDP in 1970 to nearly 22 percent in 1974, then declined and held at about 18 percent between 1975 and 1984. Private investment contracted sharply between 1984 and 1986 reflecting the global recession, then recovered by 198K3 In contrast, private investment in other LMIEs has remained relatively stable at about 11 percent of GDP. In- deed, virtually all of the difference in investment rates between the HPAEs and other developing countries is due to differences in private investment.
The central unanswered question of Kohama’s paper is, To what extent was the aid design and strategy of Japan relevant to the widespread adoption of private investment-driven development strategies in other HPAEs? The basic characteristics of official development assistance (ODA) identified in the pa- per-low grant share, emphasis on project financing, emphasis on the “request basis” for lending, and emphasis on self-help-appear to differ little from the objectives expressed by many other bilateral and multilateral donors and to be tangentially related at best to the development of the high levels of private investment described above. The answer may lie in two seemingly unrelated observations in the paper: first, that Japan “not only avoids the application of
2. The data are drawn from Pfeffemann and Madarassy (1992). 3. This basic pattern is observed in four individual economies-Korea, Thailand, Singapore,
and Malaysia. The pattern for Indonesia differs; real private investment declined continuously during the 1980s from a peak of 20 percent of GDP to a low of 13 percent in 1989.
223 Japan’s Development Cooperation and Economic Development in East Asia
25%
20%
15%
10%
5%
0%
-
-
- ; -
+ HPAES (-/o Japan)
-t other WIIEs
20%
15%
lox
5%
0%
a uniform development strategy, it recommends that a recipient country devise its own methods of coping with obstacles to development,” and second, that in the case of East Asia Japan’s ODA loans were heavily concentrated in the pro- vision of economic infrastructure.
The HPAEs encouraged private investment by several means. First, they did a better job than most developing economies at creating infrastructure which was complementary to private investment. Second, they created an investment- friendly environment through a combination of tax policies favoring invest- ment and policies that kept the relative prices of capital goods low, largely by avoiding the effects of high tariffs on imported capital goods.
Third and more controversial, most HPAE governments controlled deposit and lending rates below market-clearing levels. Japan, Korea, Malaysia, Thai- land, and Taiwan, had extended periods of mild financial repression. Govern-
-
-
-
-
* HPAE. (*/o 1.p.n)
+ other WIIEe
224 Hirohisa Kohama
ments were able to mildly repress interest rates on deposits with a minimal impact on saving and pass the lower rates to final borrowers, thus subsidizing corporations. This transfer of income from households to firms may have in- creased the volume of savings. It also changed the form in which savings were held, from debt to corporate equity, increasing the risk-bearing capacity of the economy (Stiglitz 1993). Tests of the relationship between interest rates and growth suggest that in the cases of Japan, Korea, and Taiwan, the negative relationship between interest rate repression and growth found in cross- economy analyses is not present (World Bank 1993).
Finally some governments, especially in the northeastern Asian tier, spread private investment risks to the public. In some economies the government owned or controlled the institutions providing investment funds, in others it offered explicit credit guarantees, and in still others it implicitly guaranteed the financial viability of promoted projects. Relationship banking by a variety of public and private banking institutions in Hong Kong, Japan, Korea, Malay- sia, Singapore, Thailand, and Taiwan involved the banking sector in the man- agement of troubled enterprises, increasing the likelihood of creditor work- outs. Directed credit programs in Japan, Korea, and Taiwan signaled directions of government policy and provided implicit insurance to private banks.
At least some of these policy initiatives, while reflecting successful Japanese experience, were contrary to the lending criteria of multilateral institutions such as the World Bank and to those of many bilateral aid agencies. Seen in this light, the combination of lack of a prior model with regard to appropriate development policy and a focus on economic infrastructure which was comple- mentary to private investment led growth in the HPAEs. It is also likely that geography facilitated the adoption of imitative strategies, in both public and private-sector activity. Policy imitation-specifically of Japan’s industrial strat- egy-was an explicit objective in Korea, Indonesia, and Malaysia.
Some economists and political scientists have argued that the East Asian Miracle is due to the high quality and authoritarian nature of the region’s insti- tutions (Johnson 1982). They describe East Asian political regimes as “devel- opmental states” in which powerful technocratic bureaucracies, shielded from political pressure, devise and implement well-honed interventions. But Ko- hama asserts correctly that the most broadly applied lesson of Japan’s experi- ence “was not the industrial policy but the dynamism of the private sector.”
Developmental state models overlook the central role of government- private-sector cooperation. While leaders of the HPAEs have tended to be ei- ther authoritarian or paternalistic, they have also been willing to grant a voice and genuine authority to a technocratic elite and key elements in the private sector. Unlike authoritarian leaders in many other economies, leaders in the HPAEs realized that economic development was impossible without cooper- ation.
Leaders needed institutions and mechanisms to reassure competing groups that each would benefit from growth. The first step was to recruit a competent
225 Japan’s Development Cooperation and Economic Development in East Asia
and relatively honest technocratic cadre and insulate it from day-to-day politi- cal interference. The power of these technocracies has varied greatly. In Japan, Korea, Singapore, and Taiwan, strong, well-organized bureaucracies wield substantial power. Other HPAEs have had small, general-purpose planning agencies. But in each economy, economic technocrats helped leaders to devise a credible economic strategy.
Leaders in the HPAEs also built a business-friendly environment. A major element of that environment was a legal and regulatory structure which was generally hospitable to private investment, and the investment-friendly public policy framework outlined above. But beyond this, the HPAEs have with vary- ing degrees of formality and success focused on enhancing communications between business and government. Japan, Korea, Malaysia, and Singapore have established forums, called deliberation councils. These forums have en- abled private-sector groups to influence the formulation and implementation of government policies relevant to their interests.
In Japan and Korea, technocrats used deliberation councils to coordinate behavior among firms. Because the private sector participated in drafting the rules and because the process was transparent to all participants, private-sector groups became more willing participants in the leadership’s development ef- forts. One byproduct of this process was a tendency to minimize private re- sources devoted to wasteful rent-seeking activities rather than productive en- deavors. Deliberation councils also facilitated information exchanges between the private sector and government, among firms, and between management and labor. The councils thus supplemented the market’s information transmission function, enabling firms to respond more quickly than in other economies to changing markets. In Malaysia the councils appear to be increasing in impor- tance and scope. In Thailand the formal mechanisms of communication have generally been used to present businesses’ positions to government and reduce suspicion of the private sector.
Kohama notes that “the most important factor to explain high growth in East Asia is that they are very clever followers, in the sense of the catching-up prod- uct cycle.” Although he intends this to refer to the diffusion of technology, it could equally well be applied to the diffusion and adaptation of policies and institutions. Institutions of business-government communications were un- doubtedly due.more to the impact of geography promoting imitation-it is no accident that Prime Minister Mahatir of Malaysia calls his institution-building strategy “Look East”-than a conscious product of aid policy or institution building by Japan. The general model of Japanese success undoubtedly im- pressed policymakers throughout East Asia and provided a sense of the feasi- bility, as well as potential instruments, of growth. Aid policy, importantly how- ever, supported rather than suppressed local initiatives.
As Japan becomes more geographically diversified in its aid program, there will be new challenges for ODA policy. Japan is now the largest bilateral donor to Africa. To what extent can it rely on the “request principle” to guide aid
226 Hirohisa Kohama
allocations toward appropriate economic infrastructure outside of East Asia? Will policies to promote private investment work in the institutional settings of other developing countries? Does Japan need to play a more active role in institution building and development of the private sector? Will the lessons of Japan’s experience diffuse adequately without the benefit of geographical proximity? These are questions both Kohama and Japanese aid policy leave unanswered,
References
Johnson, Chalmers. 1982. MITI and the Japanese miracle. Stanford, Calif.: Stanford University Press.
Pfeffermann, Guy P., and Andrea Madarassy. 1992. Trends in private investment in de- veloping countries. IFC Discussion Paper no. 14. Washington, D.C.: World Bank and IFC.
Stiglitz, Joseph E. 1993. Some lessons from the Asian miracle. Background paper for The East Asian miracle, Policy Research Department. Washington, D.C.: World Bank.
World Bank. 1993. The East Asian miracle. New York Oxford University Press.