this presentation is created so that the content can be ... › cms › lib › nc01001395 ›...
TRANSCRIPT

This presentation is created so that the content can be presented in the event there is no internet access.
1
2

3
4

5
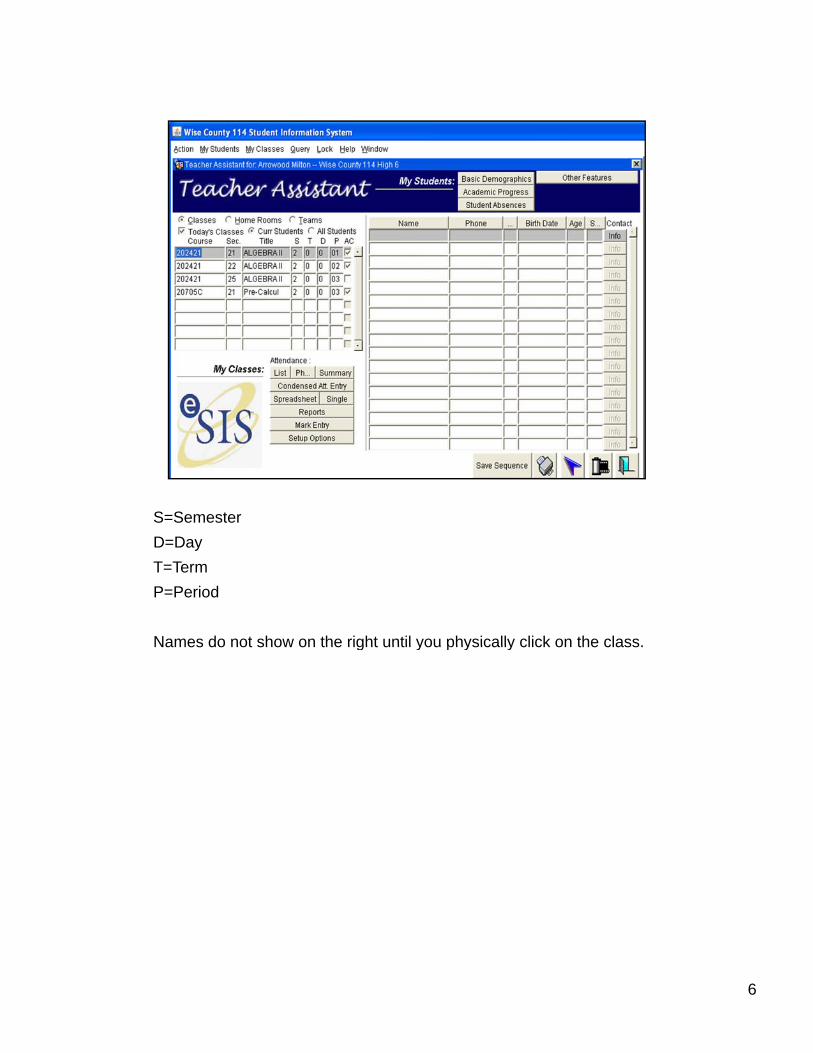
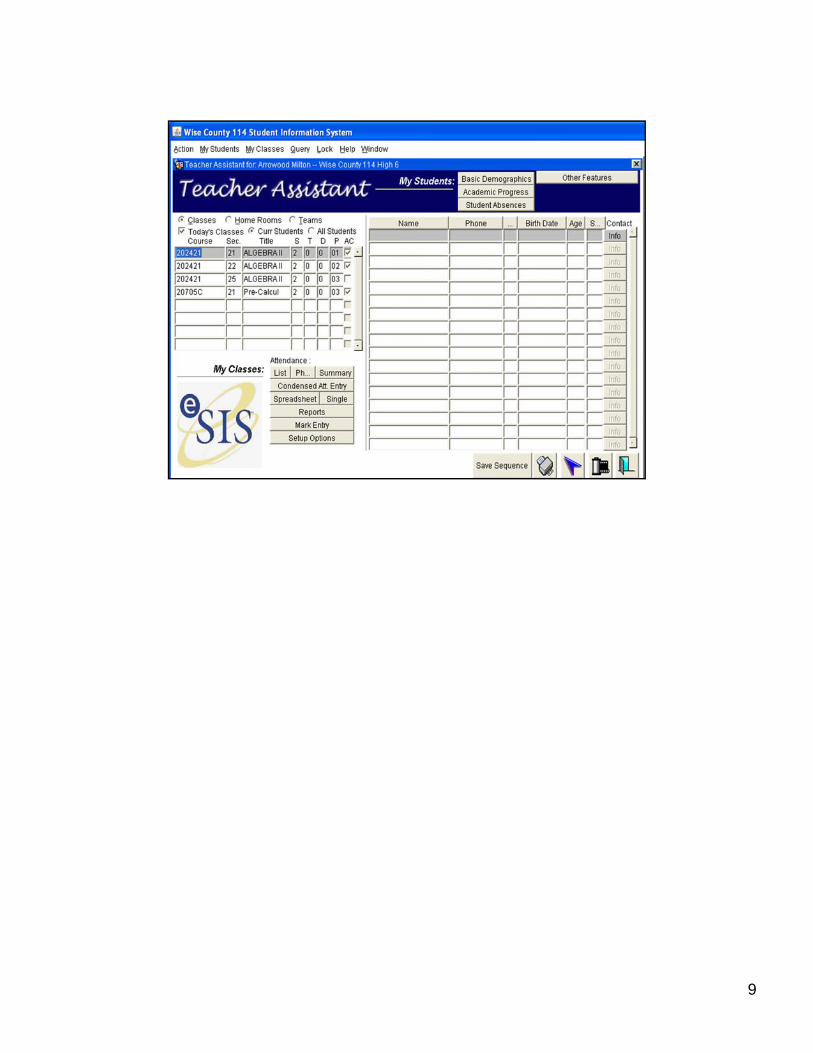
S=SemesterD=DayT=TermP=Period
Names do not show on the right until you physically click on the classNames do not show on the right until you physically click on the class.
6
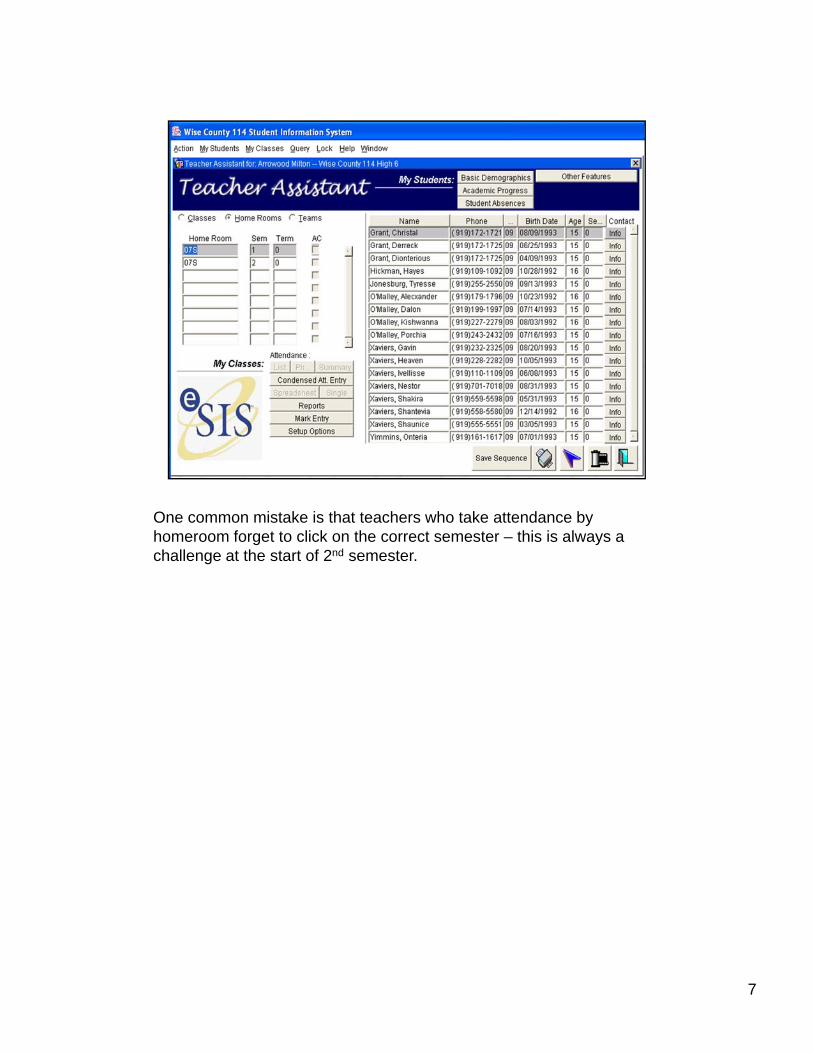
One common mistake is that teachers who take attendance byhomeroom forget to click on the correct semester – this is always a challenge at the start of 2nd semester.
7

Data managers set up and grant access to teams. Examples of teams: JV Football, Beta Club, ESL students, EC caseload.
8
9

10

11

Shows limited medical information, including allergies, and life-threatening illnesses.
12
13
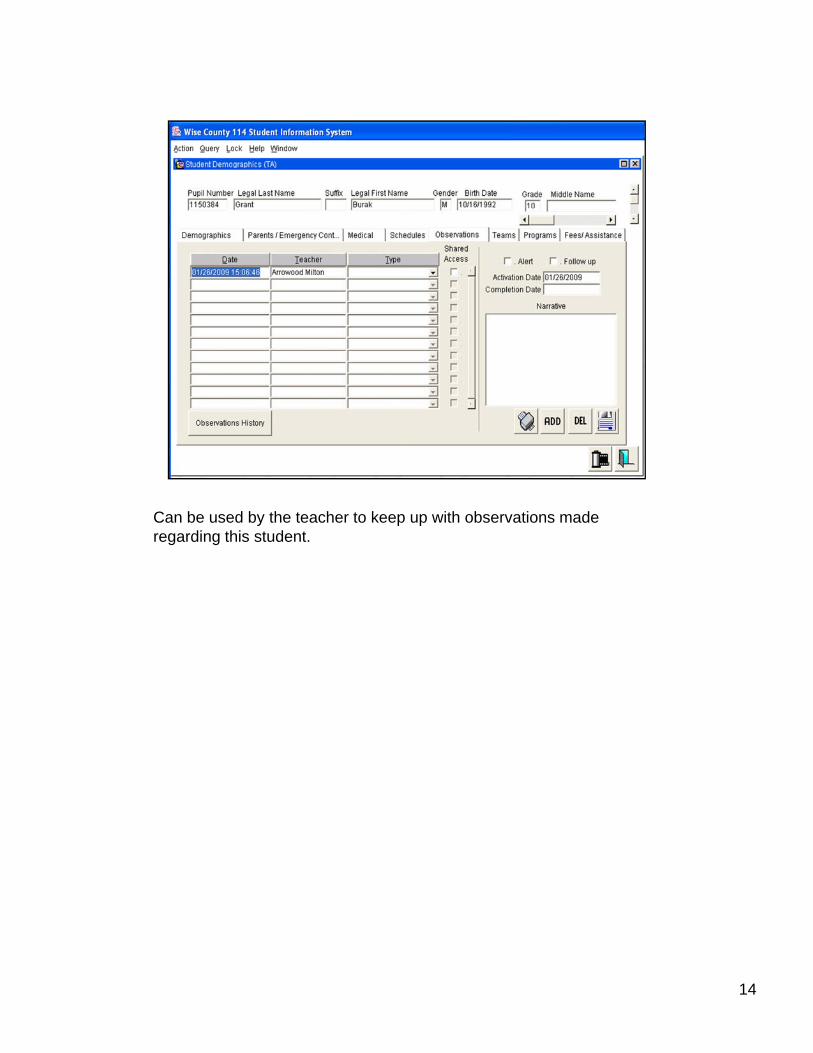
Can be used by the teacher to keep up with observations made regarding this student.
14

A list of teams that the student is assigned to and the faculty member who oversees the team.
15

Lists programs that student may be listed under in eSIS (dropout, etc.)
16
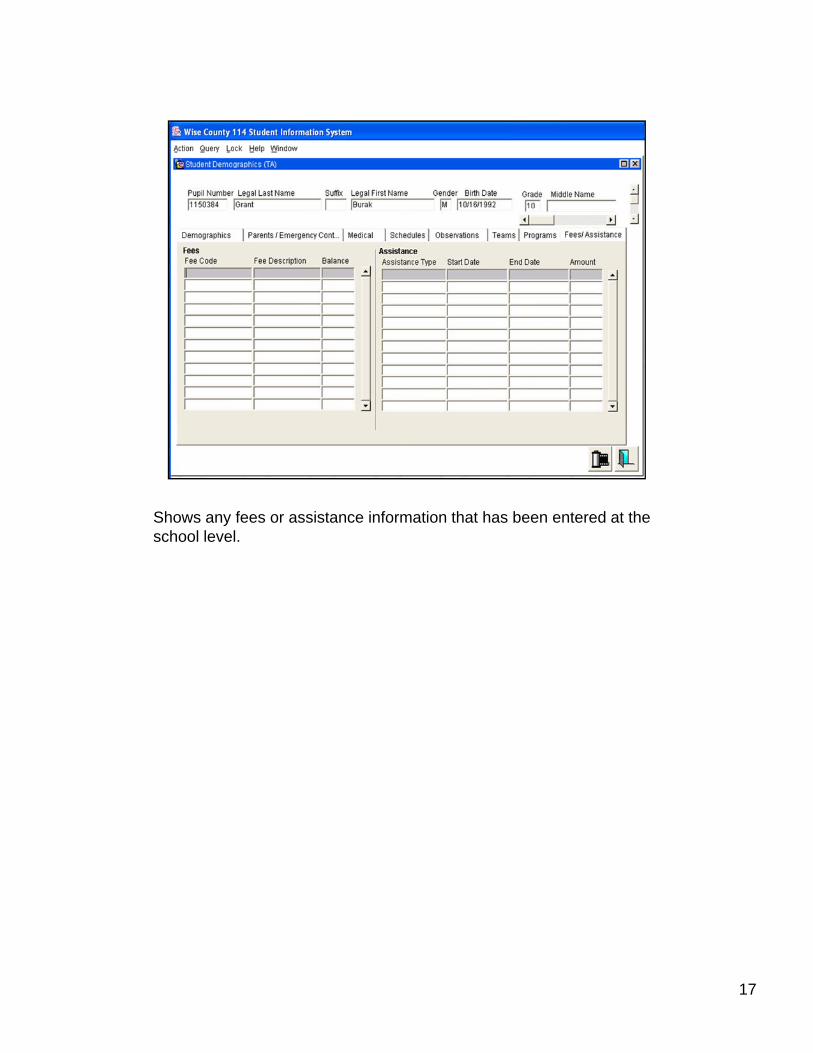
Shows any fees or assistance information that has been entered at the school level.
17

18

19
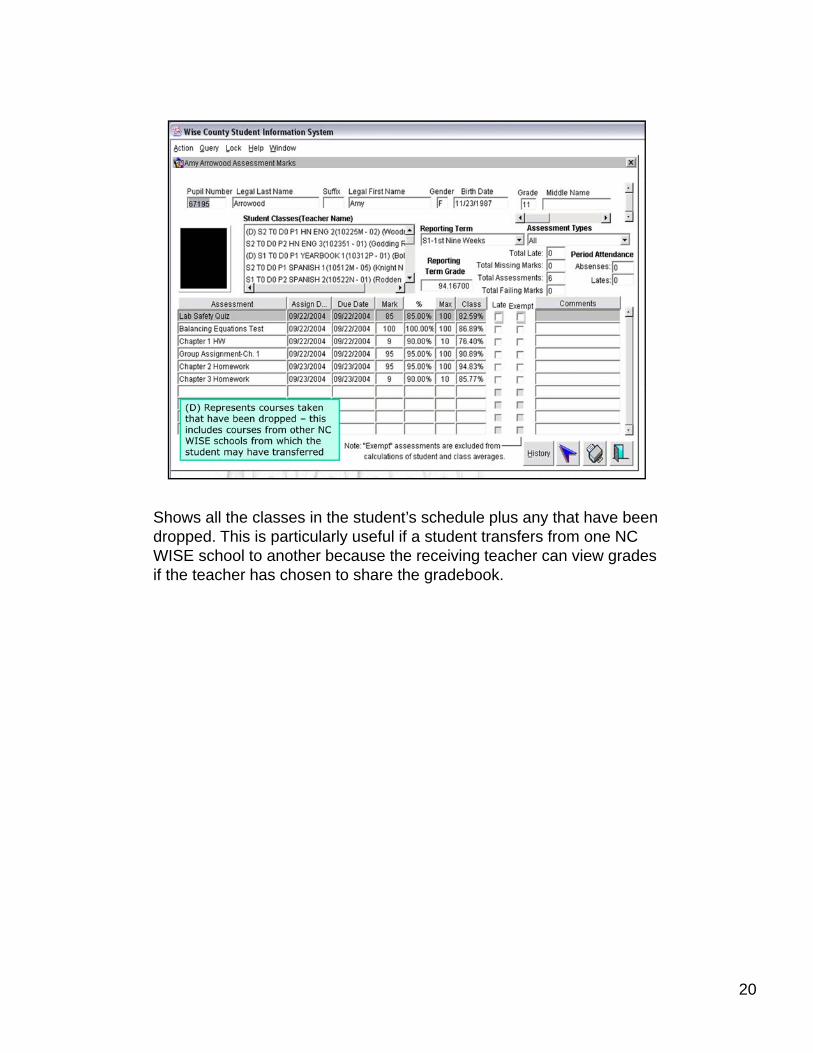
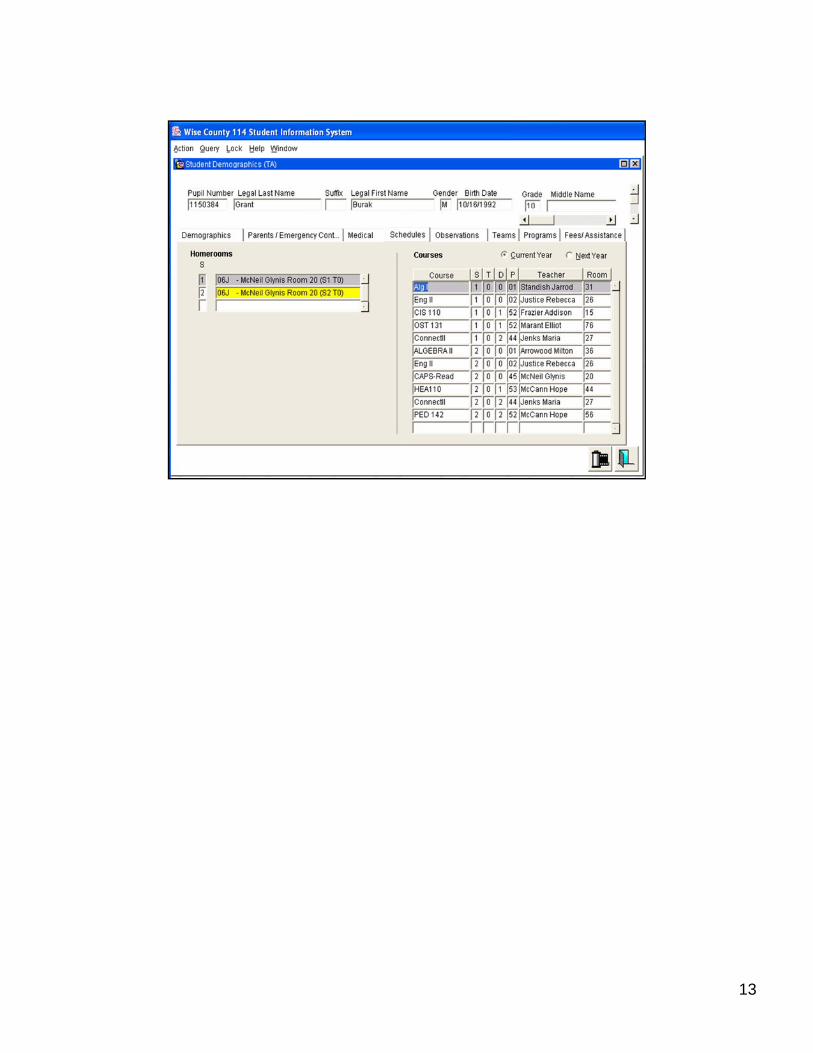
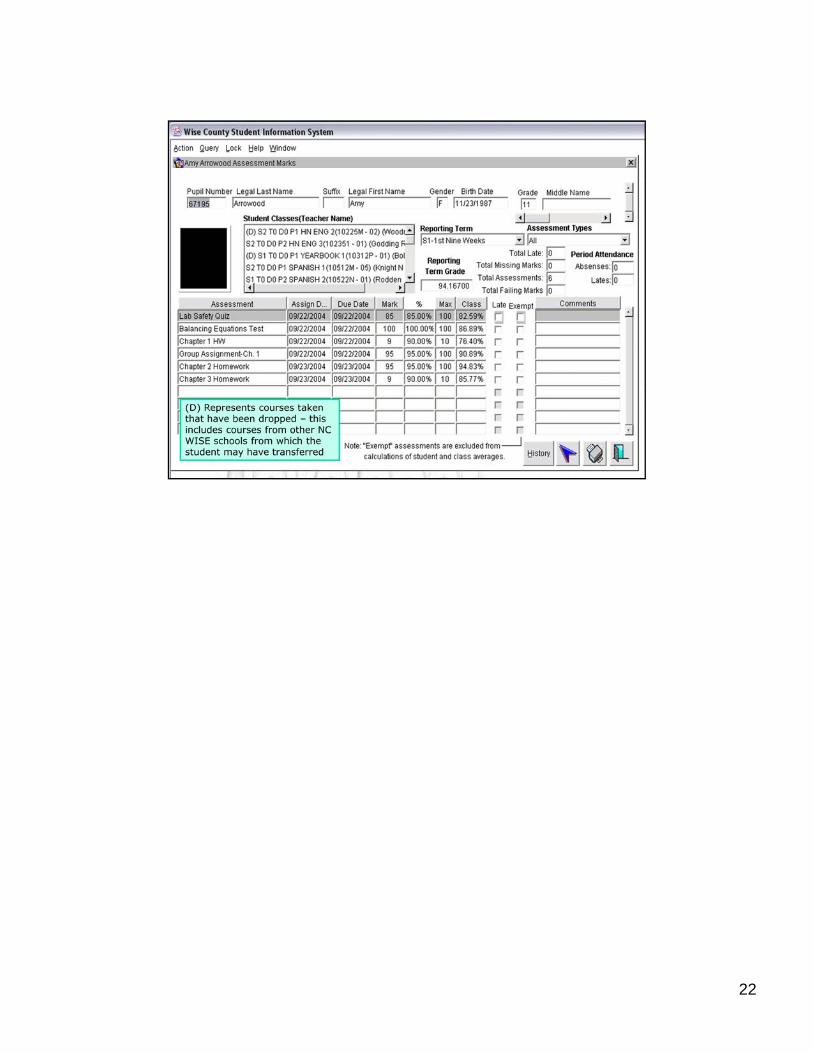
Shows all the classes in the student’s schedule plus any that have been dropped. This is particularly useful if a student transfers from one NC WISE school to another because the receiving teacher can view grades if the teacher has chosen to share the gradebook.
20
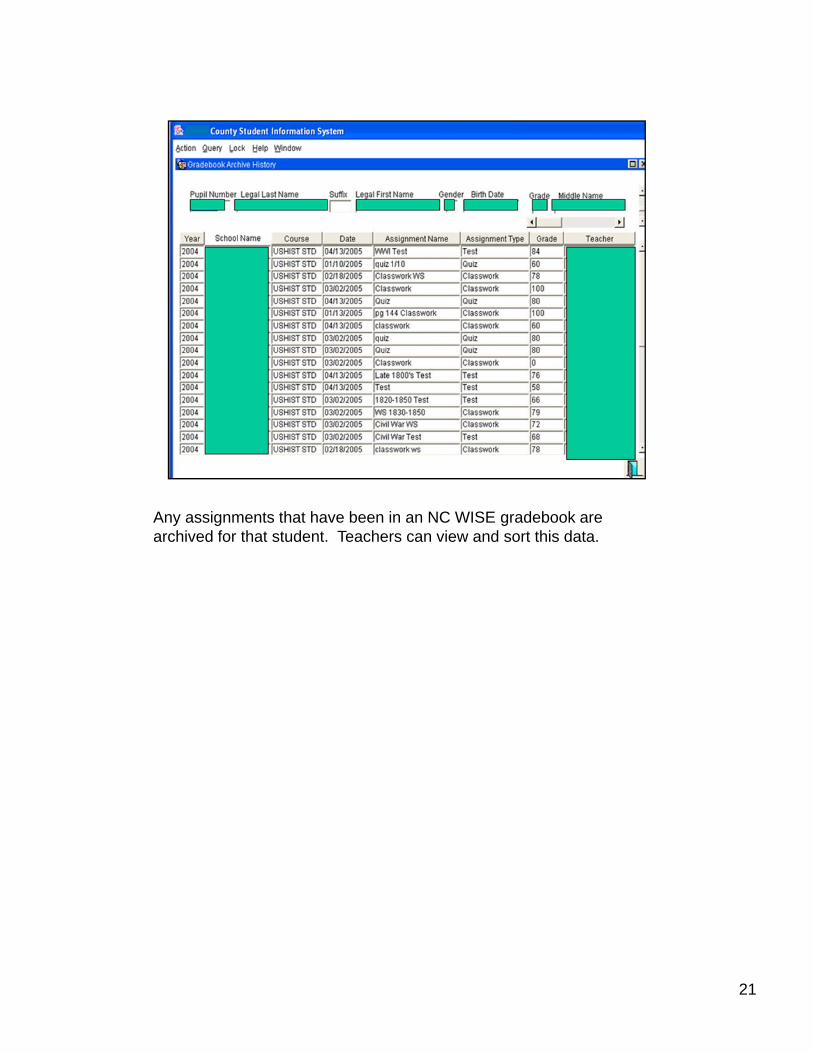
Any assignments that have been in an NC WISE gradebook are archived for that student. Teachers can view and sort this data.
21
22

23

This screen shot is from a period attendance school. Daily attendance looks very similar, except less tabs.
24

25

26

27

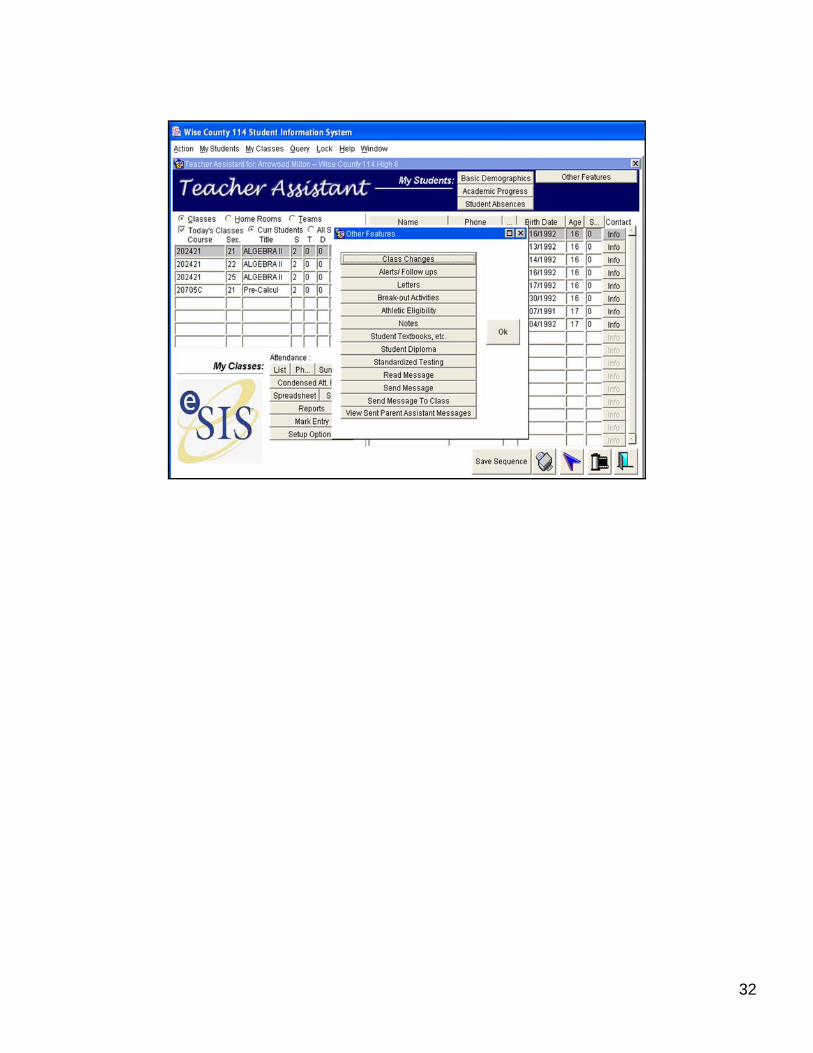
Not all of these buttons are available.
28

Brings up the class changes notification screen that shows when a teacher first logs in (if there have been class changes).
29

30

Shows any alerts or follow-ups entered by the teacher. In the Student Demographics screen, you only see for the selected student. This shows you a list for your class.
31
32

If the data manager has created any letters and assigned them to the teacher level, the teacher may select and print those letters here.
33

34

This is a place to keep up with time away from class for a student –perhaps to deliver yearbooks, for a counseling visit, or leaving early for a ball game.
35

36
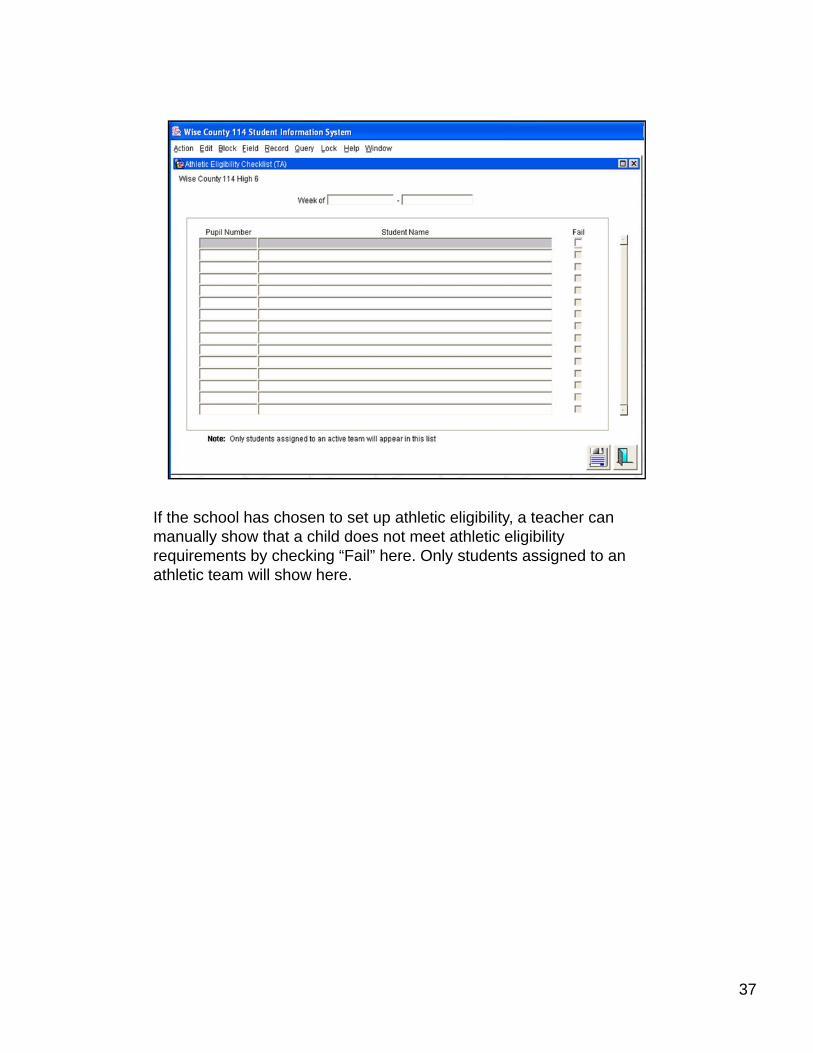
If the school has chosen to set up athletic eligibility, a teacher can manually show that a child does not meet athletic eligibility requirements by checking “Fail” here. Only students assigned to an athletic team will show here.
37

38

Teachers may keep up with notes on this screen.
39

40

Textbooks can be set up in eSIS and assigned to students. Fees can also be assigned if the student returns a damaged book or loses the book. No reports available for this module.
41

42

Teachers have access to the diploma screen showing basic diploma information.
43

44
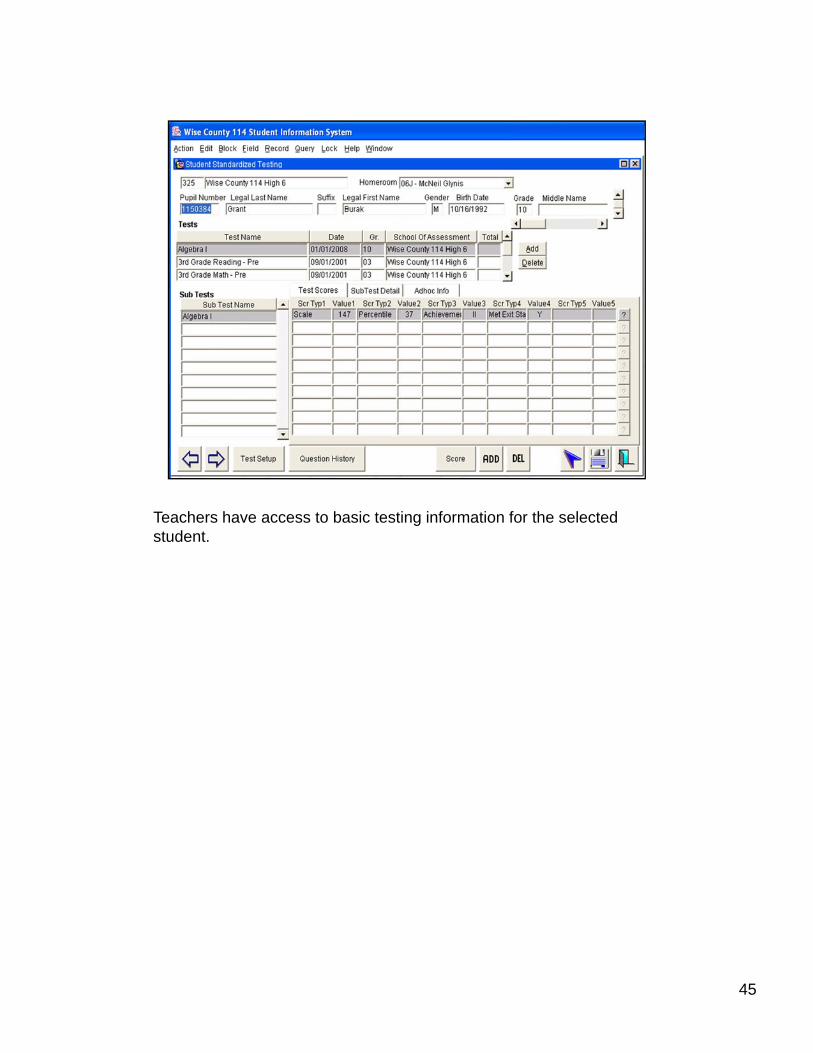
Teachers have access to basic testing information for the selected student.
45
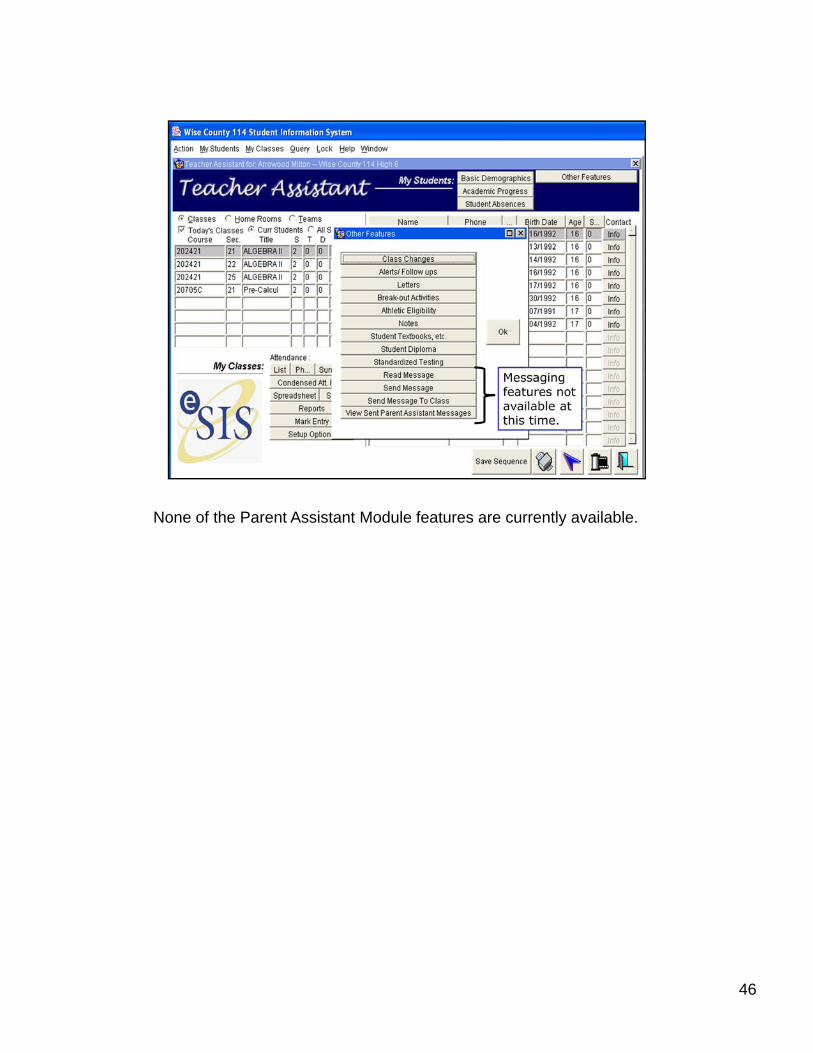
None of the Parent Assistant Module features are currently available.
46

47

48
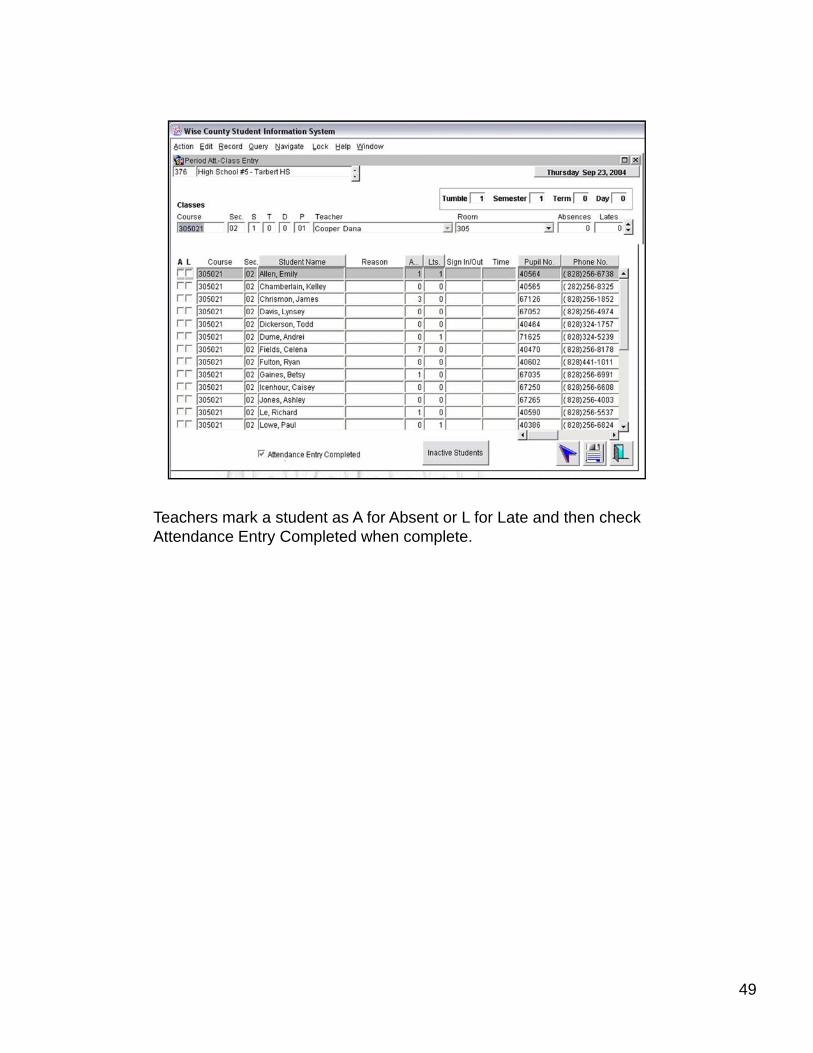
Teachers mark a student as A for Absent or L for Late and then check Attendance Entry Completed when complete.
49
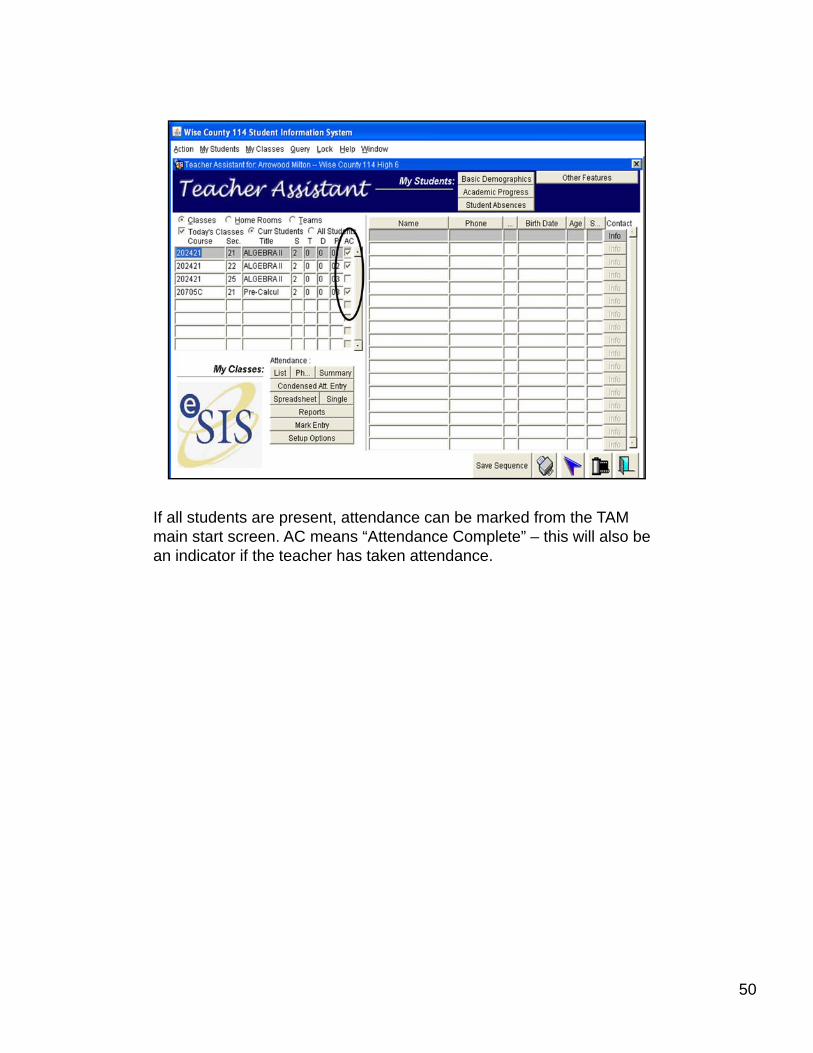
If all students are present, attendance can be marked from the TAM main start screen. AC means “Attendance Complete” – this will also be an indicator if the teacher has taken attendance.
50
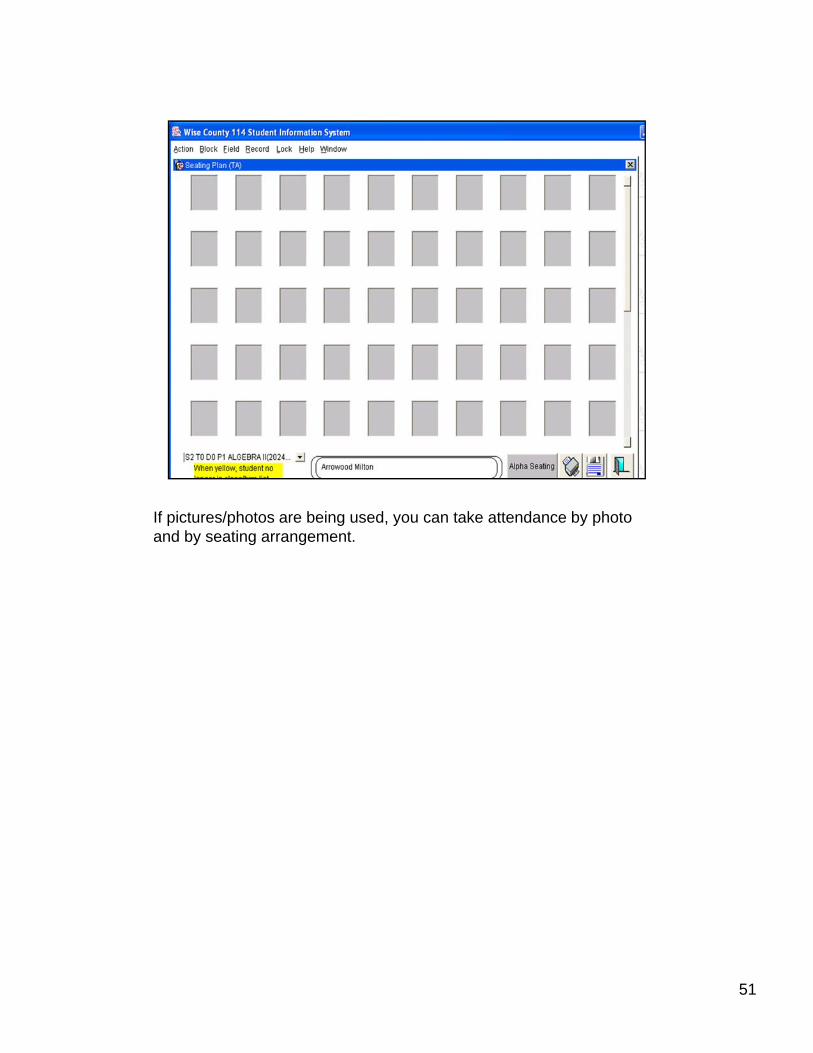
If pictures/photos are being used, you can take attendance by photo and by seating arrangement.
51

52
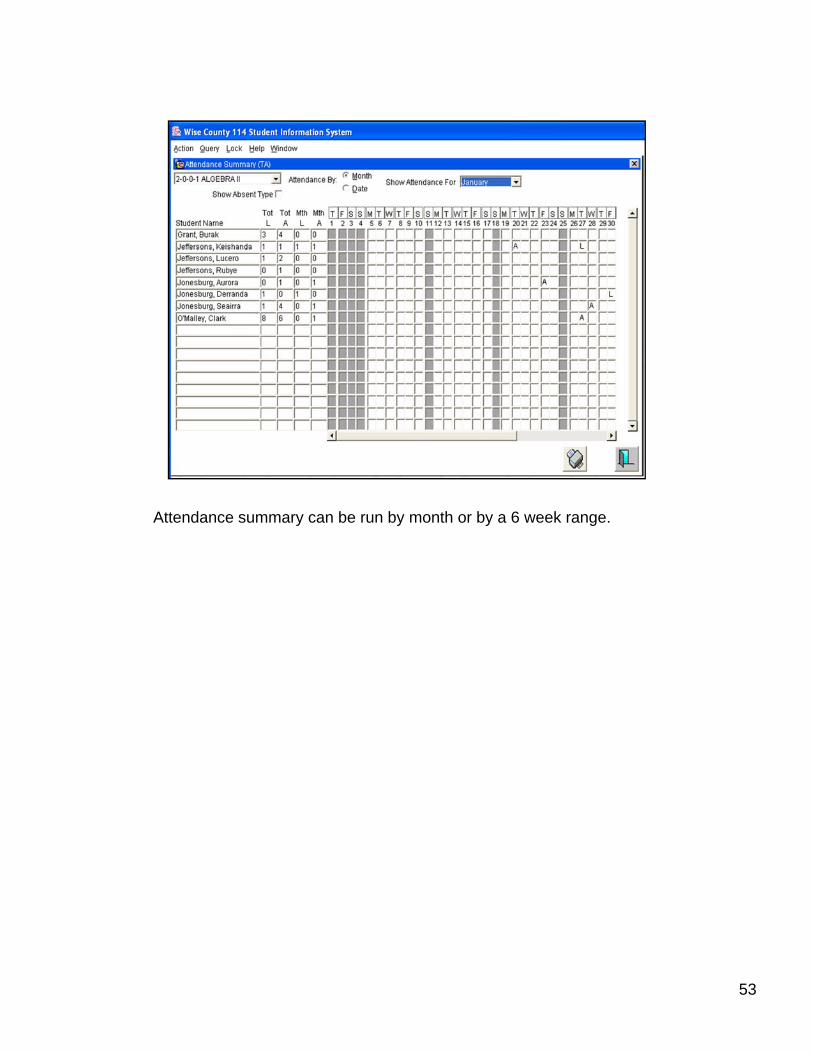
Attendance summary can be run by month or by a 6 week range.
53

Condensed Attendance Entry is not available.
54
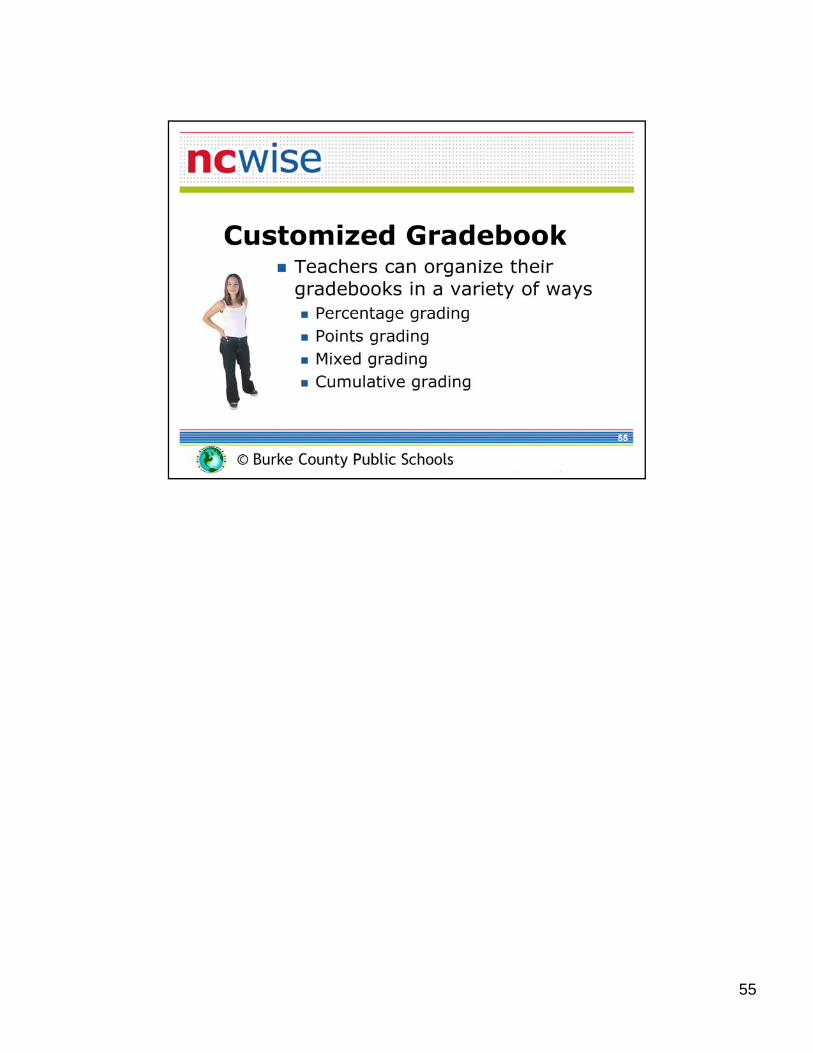
55

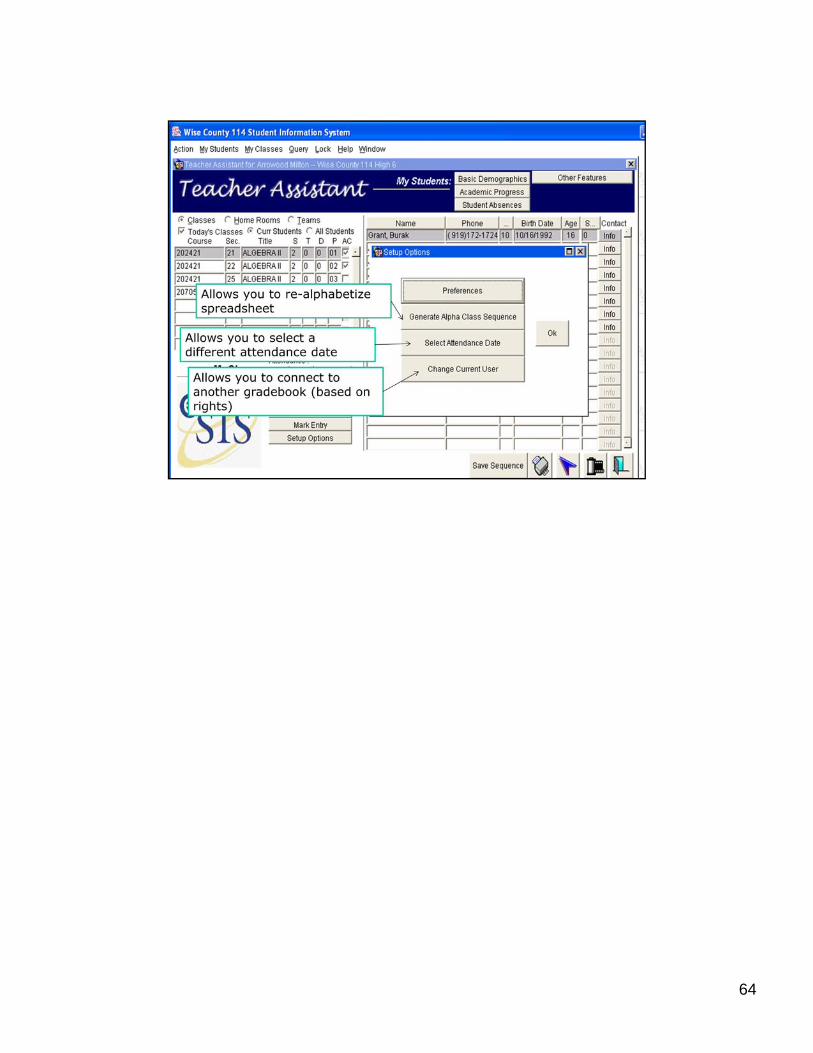
Setup Options
56

Mark Calculation MethodTotal Points – 99.9% of teachers need to use thisWeighted Percentages – takes the average of averages
Posting TypeReport Cycle = grades start over every 9 weeks – then each 9 weekReport Cycle grades start over every 9 weeks then each 9 week grade is averaged together for a final gradeCumulative = grades accumulate over the entire semester or year for a final grade (doesn’t start over every 9 weeks)
Use Assessment weights – allows the teacher to weight an individual assignment 1 time, .5 times, 2 times, 3 times, etc.
Use Assessment type weights – allows the teacher to weight a group of like assignments with a percentage – like tests count 40%, quizzes 20%, etc.
57
Use Category weights – needed for more complex grading; also used with cumulative grading to assure the exam is calculated correctly
View Report Cycle Weights – allows teacher to see what the report cycle weights are – allows changing only if set to allow this in School

Allows usage of my comments by category, subject, level – I believe this can be turned off at the school or district level
58

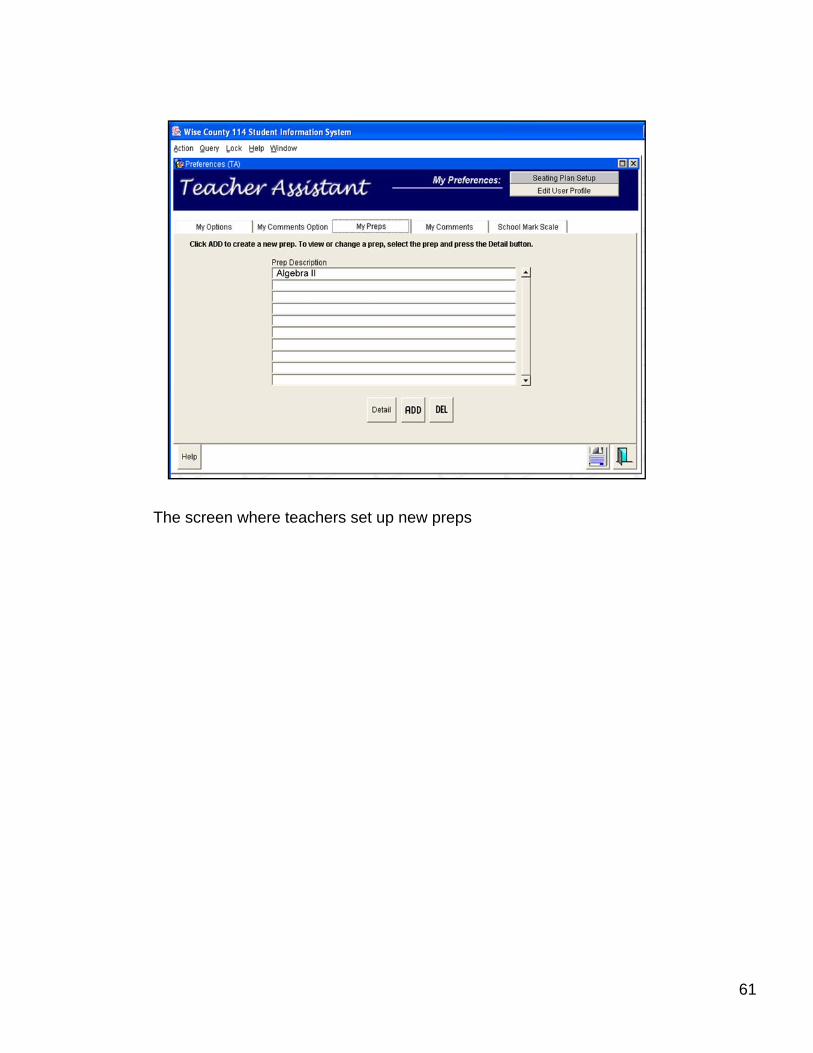
The screen where teachers set up new preps
59
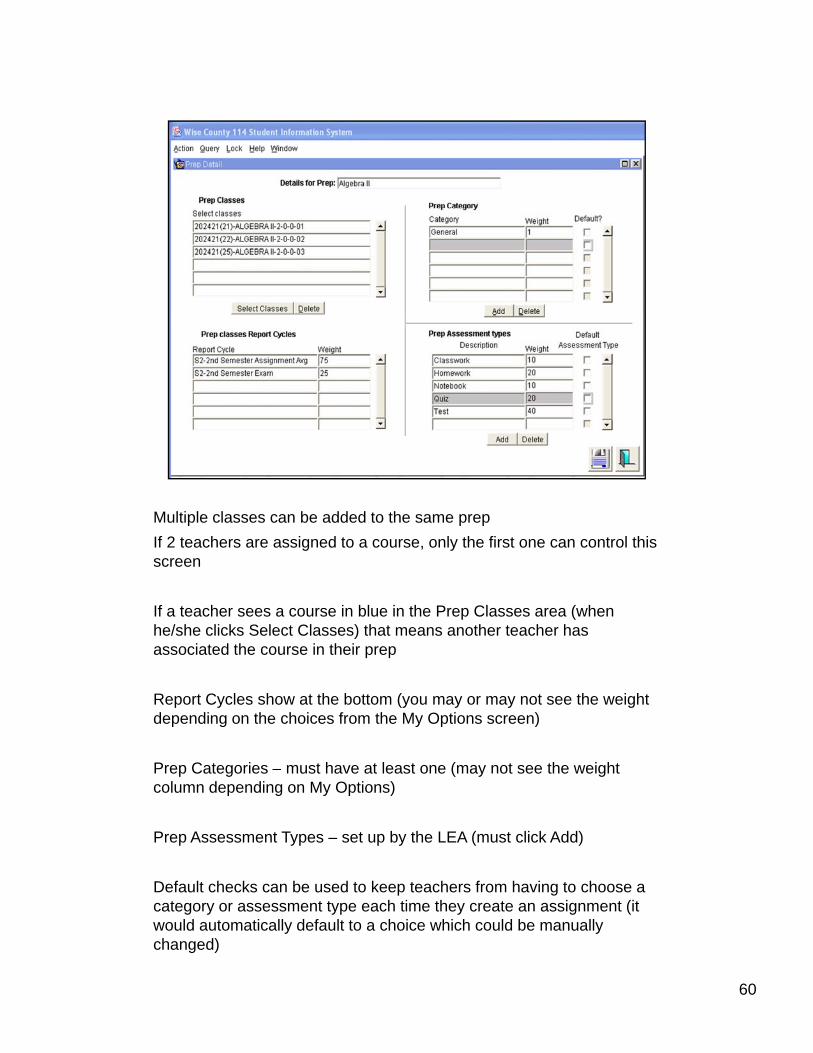
Multiple classes can be added to the same prep If 2 teachers are assigned to a course, only the first one can control this screen
If a teacher sees a course in blue in the Prep Classes area (when he/she clicks Select Classes) that means another teacher has
i t d th i th iassociated the course in their prep
Report Cycles show at the bottom (you may or may not see the weight depending on the choices from the My Options screen)
P C t i t h t l t ( t th i htPrep Categories – must have at least one (may not see the weight column depending on My Options)
Prep Assessment Types – set up by the LEA (must click Add)
Defa lt checks can be sed to keep teachers from ha ing to choose a
60
Default checks can be used to keep teachers from having to choose a category or assessment type each time they create an assignment (it would automatically default to a choice which could be manually changed)
The screen where teachers set up new preps
61
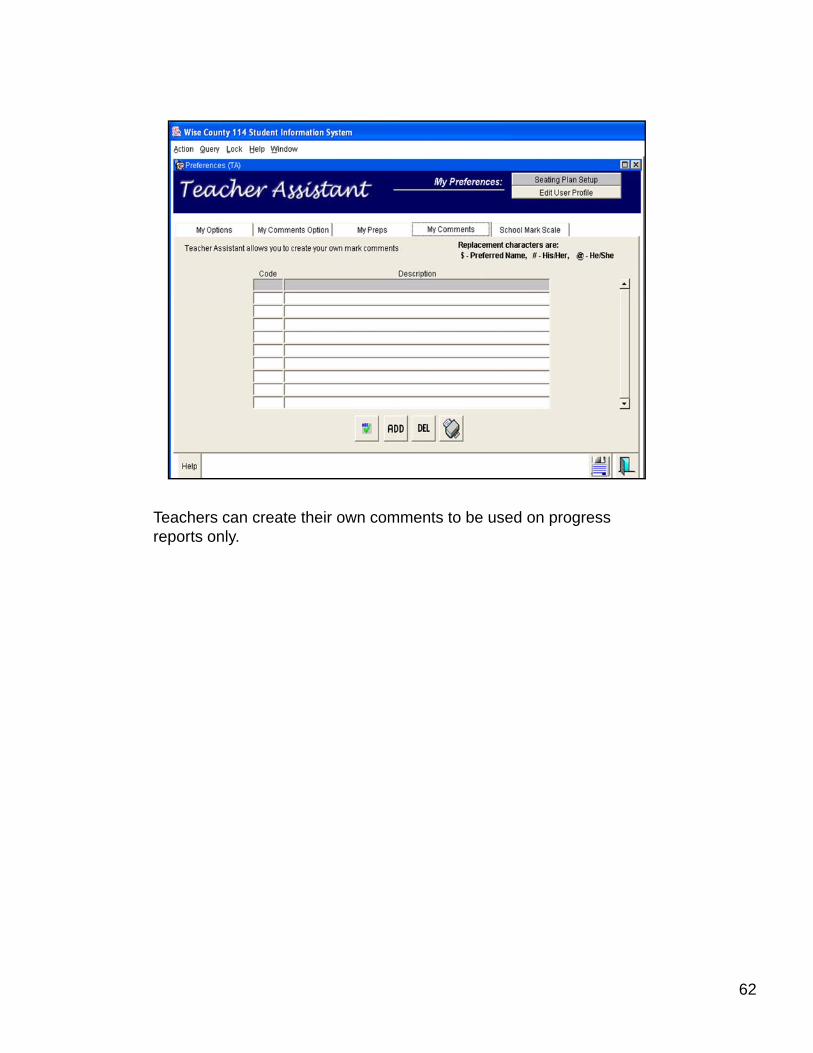
Teachers can create their own comments to be used on progress reports only.
62

Shows the school’s mark scale.
63
64

65

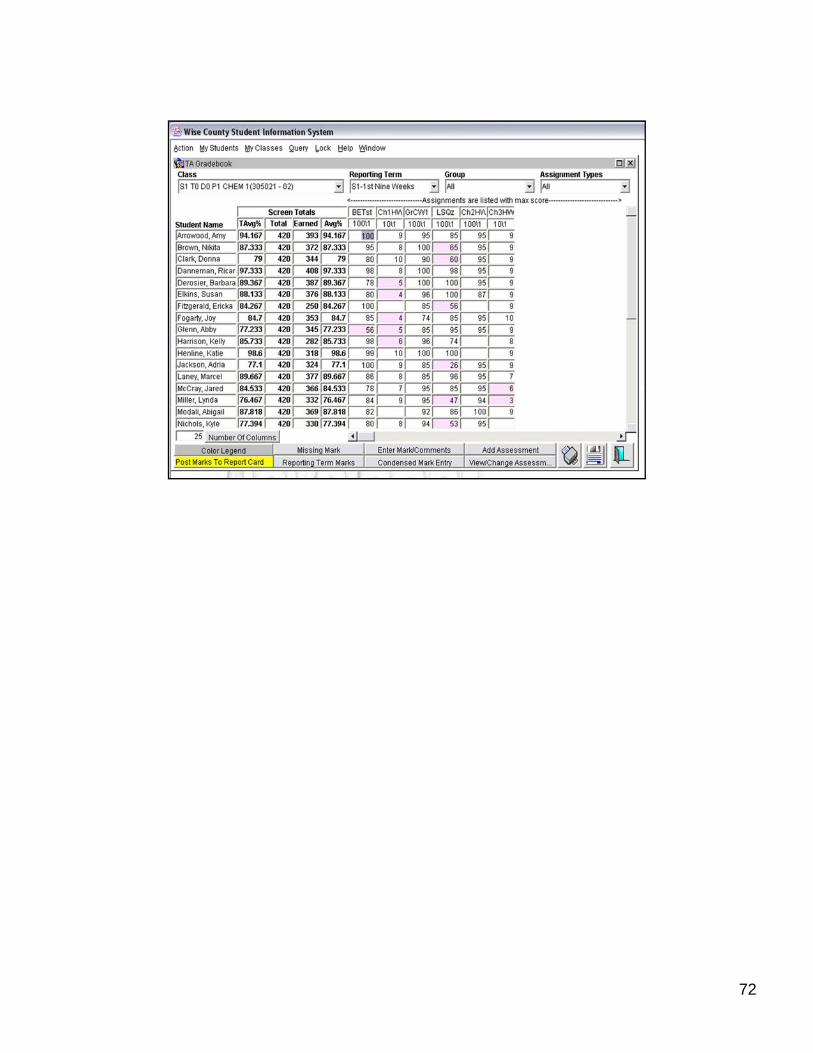
Grades can be entered directly on this screen or under Enter Mark/Comments or Condensed Mark Entry.
66

Can filter assignments to see only certain reporting terms, groups, or assignment types.
67
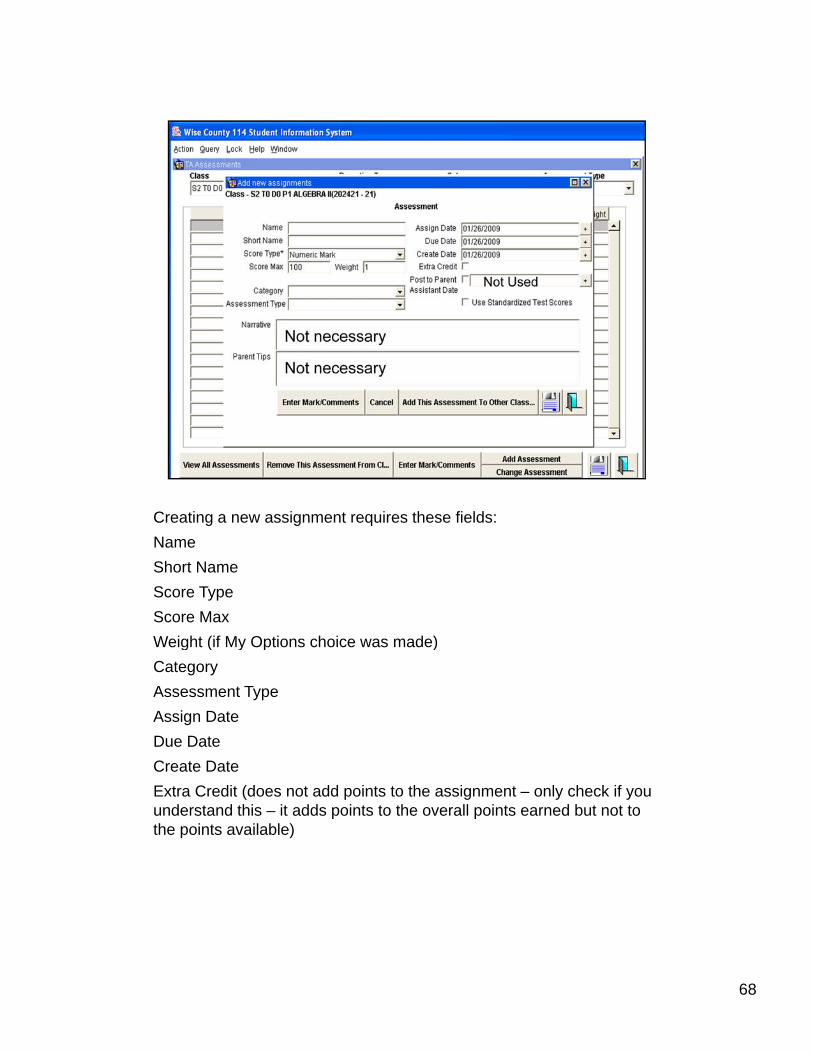
Creating a new assignment requires these fields:NameShort NameScore TypeScore MaxWeight (if My Options choice was made)Weight (if My Options choice was made)CategoryAssessment TypeAssign DateDue DateCreate DateCreate DateExtra Credit (does not add points to the assignment – only check if you understand this – it adds points to the overall points earned but not to the points available)
68

69

70

You can assign the assessment/assignment to other classes associated with the prep.
71
72

Enter Mark/Comments – can fill down first mark or first comment – can delete here as well.
73
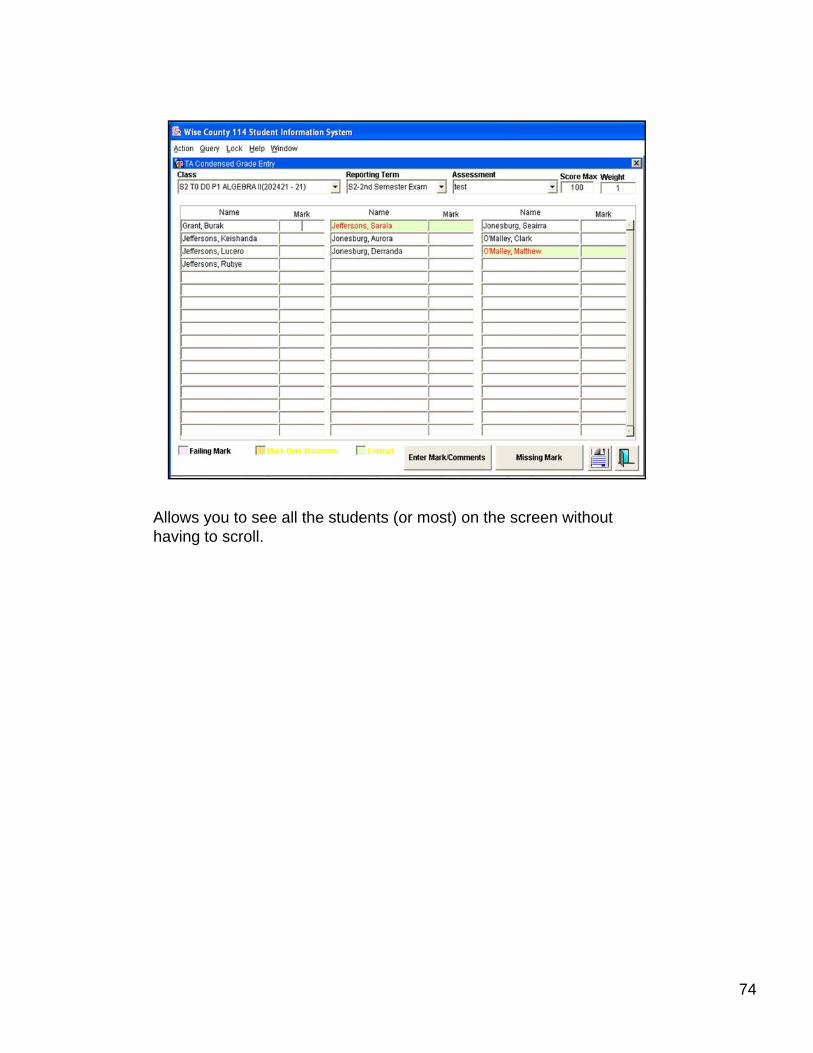
Allows you to see all the students (or most) on the screen without having to scroll.
74

75

76

If they choose incorrectly they can repost.
77
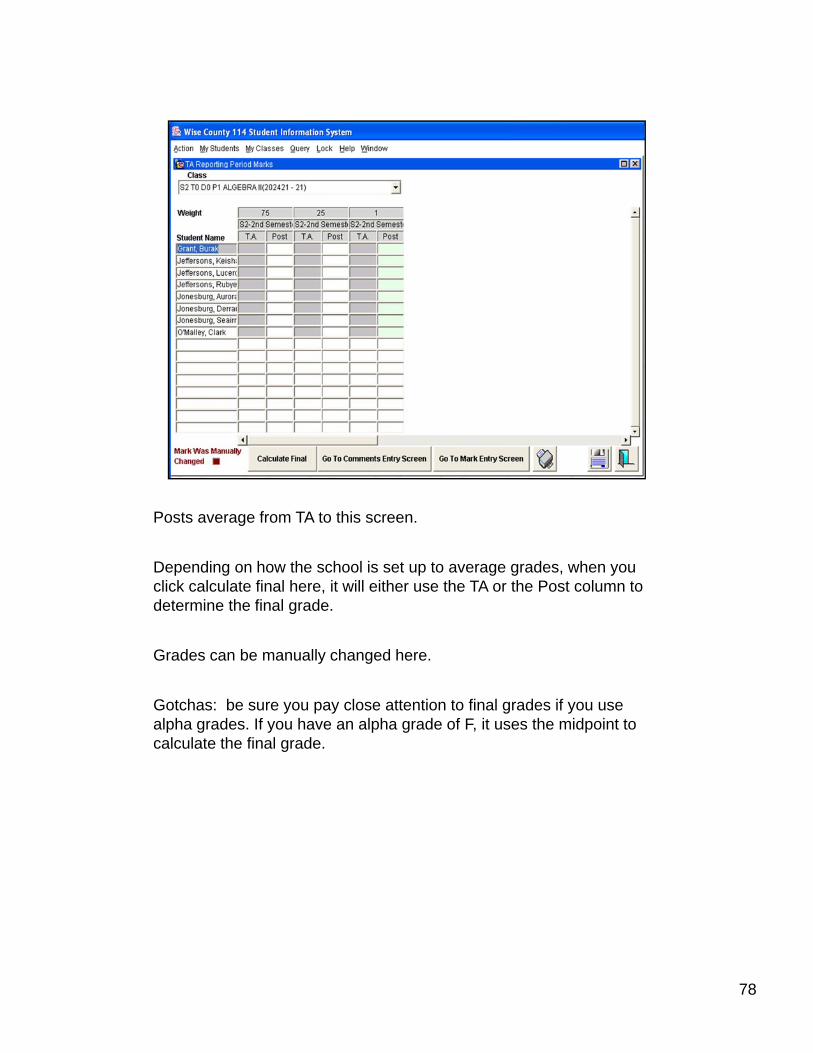
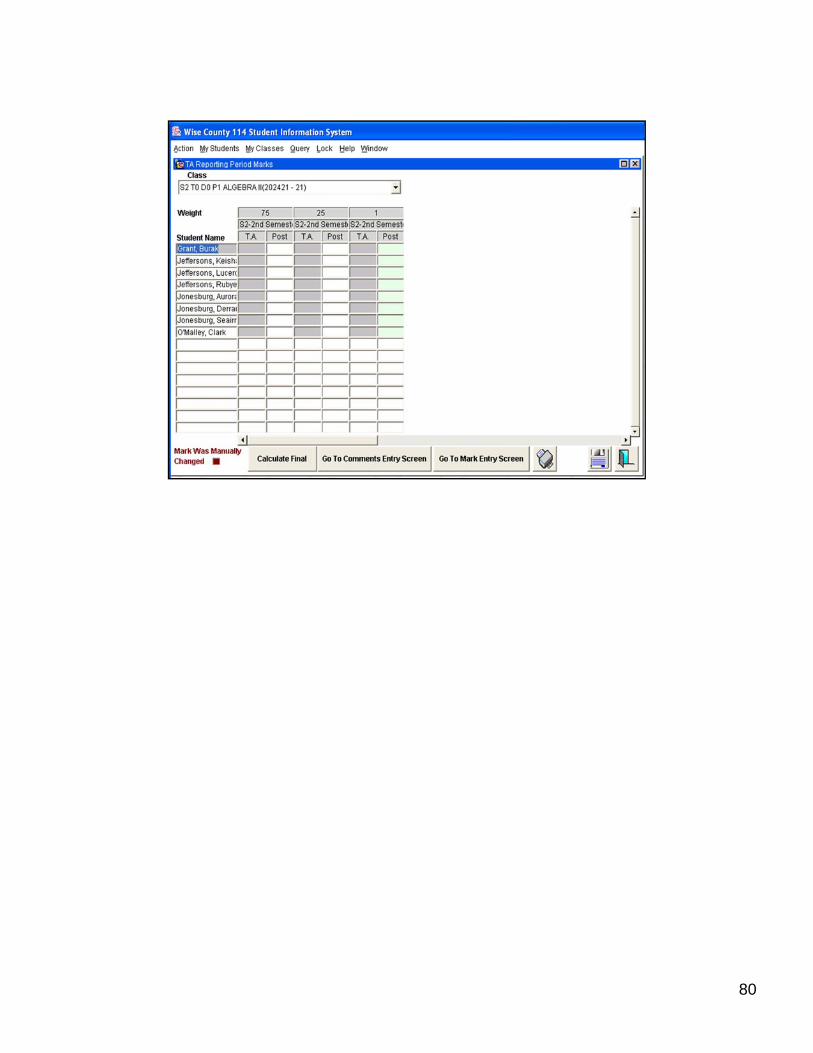
Posts average from TA to this screen.
Depending on how the school is set up to average grades, when you click calculate final here, it will either use the TA or the Post column to determine the final grade.
Grades can be manually changed here.
Gotchas: be sure you pay close attention to final grades if you use alpha grades. If you have an alpha grade of F, it uses the midpoint to calculate the final grade.
78

This is the screen the data manager sees. It is a good idea to visit this screen and check Mark Entry is Complete to let the data manager know that the teacher has posted grades.
This is the only screen where teachers can input report card comments (don’t be fooled by the button on the previous screen – meant for another state)another state).
79
80

81

Timetable – scheduleFailing Reporting Term – when you run this, if you set it to 100 as the failing threshold, this is a quick way to run a one page report showing the overall average of the students in list format.
Mailing Labels – may have to fiddle with the Adobe settings to get it to tl d li i t i h i k t fit lirun correctly and line up – print as image, shrink to fit, page scaling are
all areas that you can adjust to make it work.
82
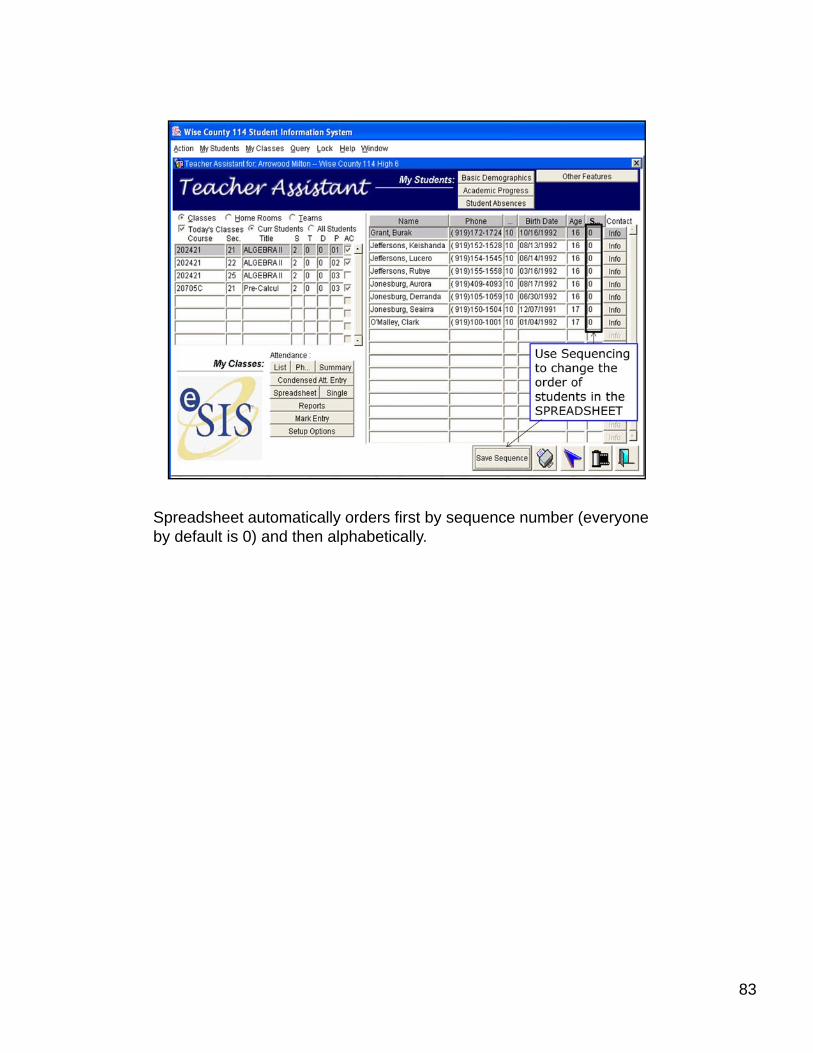
Spreadsheet automatically orders first by sequence number (everyone by default is 0) and then alphabetically.
83
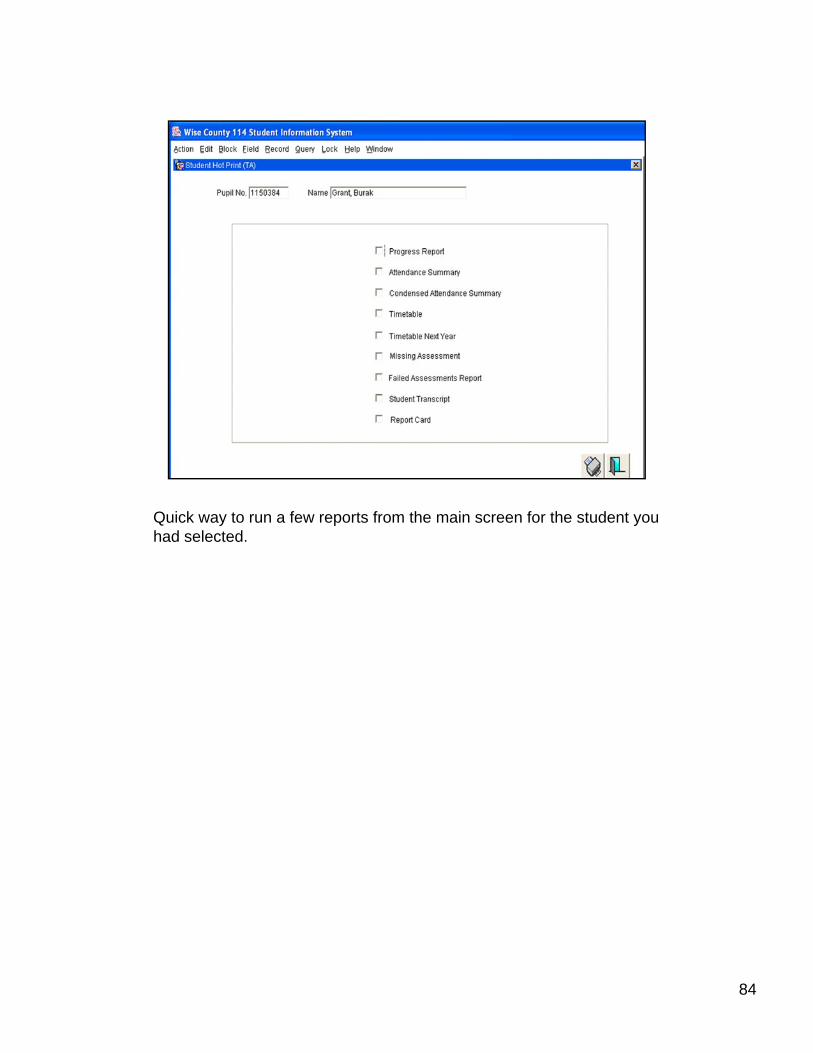
Quick way to run a few reports from the main screen for the student you had selected.
84
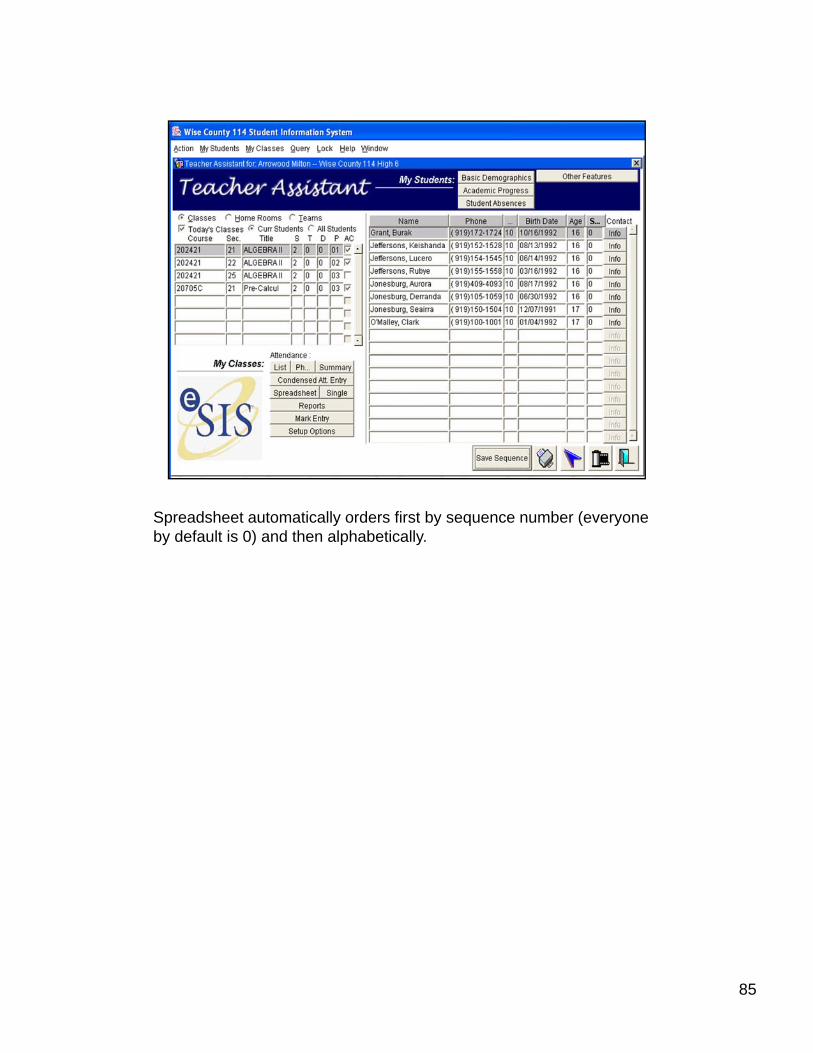
Spreadsheet automatically orders first by sequence number (everyone by default is 0) and then alphabetically.
85
86

87