this report - aquatic commonsaquaticcommons.org/798/1/no_16.cv.pdfthe management of aquatic...
TRANSCRIPT


This report may be reproducedas desired with due credit to;the author and the Institute
ISBN 978—177—020—i
{) KSL,R..I. 1985

ISSN 0331-6734
KAINJI LAKE RESEARCH INSTITUTETECHNICAL REPORT SERIES NO. 16
THE MANAGEMENT OF AQUATIC MACROPHYTES
FOR LIVESTOCK FODDER: A CASE STUDY ON
Echinochloa stagrilna (Retz.) P. Beauv.
IN LAKE KAINJI NIGERIA.
By
EMMANUEL ASUQUO OBOT
KAINJI LAKE RESEARCH INSTITUTEPRIVATE MAIL BAG 666
NEW BUSSA
KAINJI LAKE RESEARCH INSTITUTENEW BUSSA.
1985


CONTENTS
ist of Tables ..... ""....""". . ..................... v
List of Figures .. . ....... vi
1bstract ......, -1
Introduction • ,...,. 1
Materials and Method . . .• . .... 2
Study area .. .. . . . . 2
Description and identification ... . 3
Colonization characteristics of Echinochloa stagnina 4
Seed germination . .... •. ... 7
Standing crop, growth rate, phosphorus andnitrogen concentration . .... . .. ... ... 7
Effect of continuous harvesting on E. stagnina . .... 9
Contributions of macrophytes to theevapotranspirational losses from Lake Kainji 9
Results and Discussion ................ 10
Laboratory investigation of nodal tillering 10
Field investigation of nodal tillering ...... 10
Seed germination ii
Distribution and zonation of E. stagnina inLake Kainji ... 11
Standing crop and growth rate estimation ...... 13
Nitrogen and phosphorus concentration . •• .. .... 14
Effect of continuous harvesting on E. stagnina ...... 14
Effect of plant removal on the nutrient statisof Lake Kainji ..
........ 15
-Estimates of EvapotranspiratiOn loss 16

iv
Management options ...... ..• ...... ..................... 18
The rationale for management 18
Management Plan ........,,. a non,000.s ,..sao, a a a a 1 9
Nutrient Cycle .. ...•.... ............ 19
Management of Echinochloa stagnina in other man-madelakes, cattle drinking ponds and fish ponds: a conjecture 20
Acknowledgement . . . . . . . . . ..,.....,...a.. a a a a a a a a 2 1
Literature Cited a..a.... ,......... 21

V
LIST OF TABLES
Table 1. Hypsographic chart for Kainji Lake(modified from Table 2 of Henderson (1973))
Table 2. Performance of E. stagnina growing on sedimentand floating (Laboratory investigation)
Table 3. Two way ANOVA of the effect of treatment andtime.
Table 4. Percentage germination of E. stagnina seedsunder two treatments (see. text for explanation oftreatments).
Table 5. Effect of continuous harvesting of E. stagnina
Table 6. Kainji Lake Echinochloa model.
Table 7. Result of applying the water balance equation toflow data 1978 — 1982.
Table 8. Result of applying the expression ER = 1,19 Eto estimate evapotranspiration from Lake Kainji.
Table 9. Nitrogen percentage and crude protein content ofEchinochloa stagnina and some terrestrial grassesat peak standing crop.

vi
LIST OF FIGURES
Figure 1. Map of Lake Kainji showing study sites.
Figure 2. Performance of E. stagnina growing insediment and floating.,
Figure 3. vegetation map of Lake Kainji.
Figure 4. A Schematic representation of thevegetation zone at Wara (Site 3),
Figure 5. Total standing crops of E. stagnina for July 1981January 1983.
Figure 6. Relationship between standing crop and meanmonthly water elevation.
Figure 7. Growth rate of E. stagnina compared with rate ofchange of water elevation.
Figure 8. Changes in the nitrogen of stein and leaves ofE. stagnina with time.
Figure 9. Effect of continuous harvesting on tiller density,
Figure 10. Change in standing crop with time duringcontinuous harvesting.
Figure 11. Effect of continuous harvesting on mean tillerweight of E. stagnina.
Figure 12. Relationship between mean tiller weight and tillerdensity.
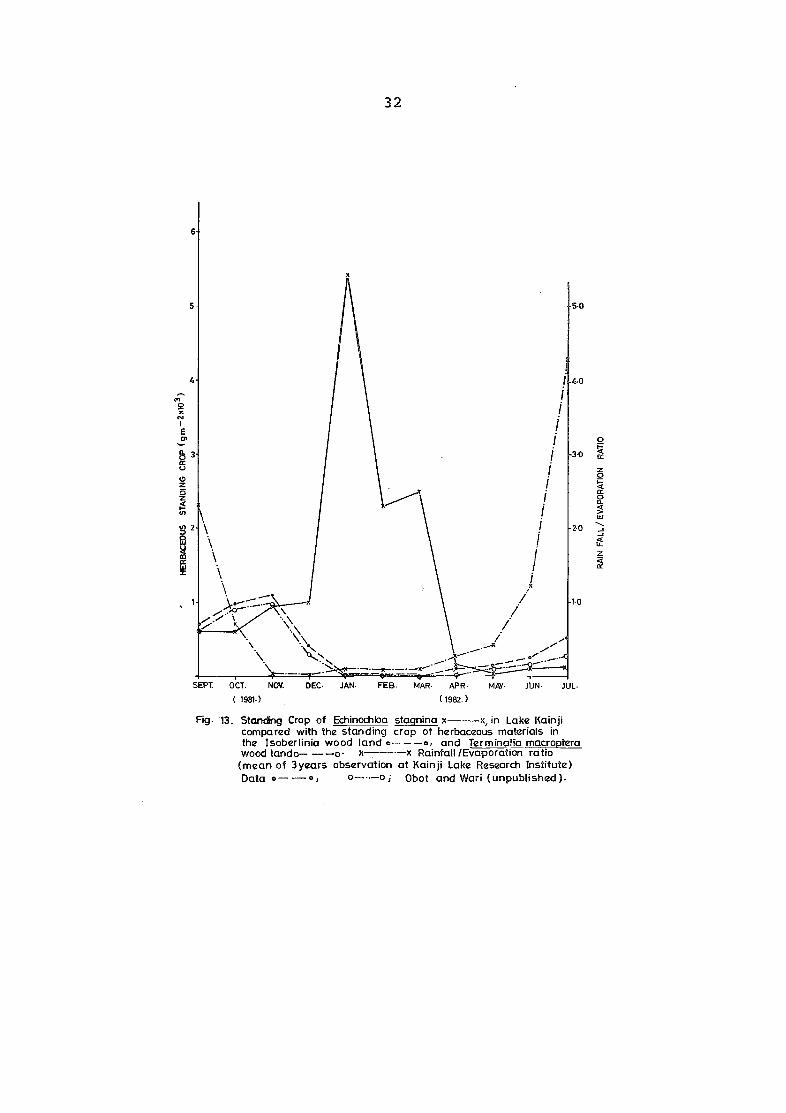
Figure 13. Standing crop of E. stagnina in Lake Kainjicompared with the standing crop of herbaceousmaterials in the Isoberlinia wood land andTermiflalia macroptera woodland; Rainfall!evaporation ratio (mean of 3 years observationof Itainji Lake Research Institute) data.

ABSTRACT
Echinochloa stagnina growing in Lake Kainji isidentified, described, and separated from Echinochloayramidalis and Echinochloa colona. Echinochloa stagnina,which requires the annual iOn draw—down of the lake forsuccessful establishment and survival, shows a markedzonation and contributes to evapotranspirational water lossfrom the lake; accounting for the reduction of the effectivelake volume by up to 17%, for example in 1979.
A management strategy which demands the harvest andremoval, for livestock fodder, of 75% of the total yearlystanding crop (up to 120, 965,4 tonnes) in order to maintainthe grass as a renewable source of dry season fodder withoutsignificantly affecting power generation is discussed. Theeffect of harvesting on the grass and the number ofsustainable harvests in a qiyen area is estimated. With SUCiremoval an estimated 3 x 10°kg of nitrogen and 4 x lO3kgphosphorus are removable from the lake ecosystem0 Sourcesof nutrients to balance these removals are discussed.
INTRODUCTION
The growth of Echinochloa stagnina* in association withE, pyramidalis and other emergent and floating macrophytesin Lake Kainji is of considerable interest from the standpointof livestock production. It is common knowledge that ruminantlivestock in the savanna areas of Nigeria lose form andweight in the dry season because of scarity of suitablefodder, as terrestrial grasses and herbs dry up at this timeand are uáually burnt, This has been identified as one ofthe factors that limit livestock production in Nigeria(Oyedipe et al., 1981).
In the Kainji lake basin nomadic livestock productionis presently facing a crisis because of land use pressuresexerted by physical land development (see Ayeni et al., 1982).The emph•ais now should be on the settlement and integrationof the nomadic livestock farmers into utilizing residues fromlarge scale farms such as one being developed by the NigerRiver Basin Development Authority. The progress of settlementand integration has been slow so far, but a few nomadiclivestock farmers can be described as settled.
* Plant nomenclature according to Flora of West TropicalAfrica. Huchinson, J. and Dalziel, J.M. (1952 - 1972).

2
These farmers have already recognised the dry seasonfodder potential of Echinochloa stagnina and thus harvestlarge quantities of the grass to feed their stock during thedry season. It is expected that human activities on theEchnochlo.a — lake ecosystem will increase as morepastoralistis settle. The pattern of utilization of theEchinochloa - lake system is then likely to udergo a rapidtransition from the present subsistence use by a smallpopulation, to a sophisticated manipulation of the ecosystemfor the benefit of large resident groups.
The grass has, however, been viewed as a problem tothe lake hydrology and also to navigation with small crafts.N.E.P.A. hydrologists at Kainji, believe that the grasswhich covered a total of 924km2 in 1979 - 1980 (Fregenepers. conan.) has blocked one of the major inflow channels ofthe reservoir. They contend that this blockage coupled withevapotranspiration from the grass (unestimated) is responsiblefor the reduction of the effective lake volume by 15.1%, Thehydrologists advocate the extermination of the grass withherbicides, but the grass stand is a spawning and feedingground for a variety of economically important fish species(Imevbore and Bakare, 1974).
It may not be desirable, therefore, to exterminate thegrass; rather it might be exploited as a renewable resourceand kept within "safe limits such that, it does not affectpower generation significantly and is available to thelivestock industry. Such exploitation can only be based onsound biological knowledge of the plant. This report givesa summary of results of studies on the possible managementof the grass for dry season livestock fodder.
MATERIALS AND METHOD
STUDY AREA
The Kainji lake reservoir is located 9°50' — 10°55N;4025t - 4°45E (Fig. 1). It is 136.9km maximum length and24.1km maximum width, with a surface area of approximately1300km2. At full voli,une, the water level is at latitude142m; maximum depth 60m, mean depth urn.
The climate of the location of the lake, the hydrology,physical and chemical characteristics of the lake and thegeology of the lake site have been reported elsewhere (seeMorton and Obot, 1984; Henderson, 1973; El-Zarka, 1973 andImevbore, 1975).

3
DESCRIPTION AND IDENTIFICATION
Echinochloa stagnina is a large perennial grass9ccasionally behaving as an annual with straggling orrecumbent stems up to about im long under non-floodedconditions and elongating up to 7 — 9m (very rarely up tolim) in flooded areas. The spongy stein, 3 — 5cm in diameter,roots sparsely at the nodes. Under flooded conditions thestem trails on the surface of the water, but the leaves andinflorescence are held in an upright position above thewater. The length of the internodes is variable; up to 18cm.
Leaves are ligulate. The leaf ligule is representedby a fringe of pale coloured bristles about 5mm long at thebase of the leaf blade. The blade is up to 60cm in lengthand 2cm broad at the widest point and hairless althoughroughly silicaceous to the touch and with tiny prickles alongthe margins. The leaf blade is dark green with a whitishmid-rib. The leaf sheaths, as long as the internodes, maybe brown or green in colour.
Plants flower whenever the root zone is flooded, Theinflorescence is paniculate, the peduncle being up to 25cmin length. Panicle branches are crowded, alternate, thebasal ones being up to about 6cm long. The sessile spikeletsare acute-accuminate up to 5cm in length, the upper lemmaending in a stiff bristle 5 - 20mm long. Spikelets aresecund to the branches of the paiicle and are not persistentbut fall off when mature to leave a bare panicle withfractiflex branches.
E. stagnina is usually found in swampy areas and alongthe margins of streams and lakes Sometimes it forms float.ingmats on water surfaces.
A voucher specimen (Obot/Echi 01) is preserved in theUniversity of Ife herbarium (IFE).
This grass is often confused with E. colona and E.pyramidalis.
E. colona is erect annual up to 60cm high rooting atthe lower nodes. The leaf blade is up to 13cm in lengthand 5mm broad at the widest point, hairless and smooth onthe margins, without ligules. The sheaths covering theinternodes are up to 15cm long.
The inflorescence is paniculate, the peduncle is up to23cm long. The branches of the panicle, usually under 3cmlong, are spaced about half their length apart and alternate,

4
The secund spikelets are sessile, 1mm long a-nd laàc bristles,
E. colona occupies similar habitats to those of Lstagnina but is usually restricted to shallow watet areasnot more than 30cm deep
A voucher specimen (Obot/Echi 03) is preserved in theUniversity of If e herbarium (IFE)
E. dalis is a rhizomatous perennial up to 2mhigh0 The leaf blade is up to 6cm long and 2cm broad atthe widest point. The leaves have a ligule represented asa fringe of pale hairs 2mm long at the base of the leafblade. The sheaths are up to 11cm long extending to jutover half the length o the internodes
The inflorescence is paniculate, the peduncle being upto 25cm long; the alternate branches, up to 6cm long, arecrowded as in E. The sessile secund spikeletsare up to 4mm long and lack bristles. A dense stand of'E0 pyramidalis appears bluish-green from a distance, Theplant is restricted to wet (not flooded) areas.
A voucher specimen (Obot/Echi 02) is preserved in theUniversity of If e herbarium (IFE).
COLONIZATION CHARACTERISTICS OF Echinochloastagnina
Definitions Required to Explain ColonizationCharacteristics
Draw-down period: A draw—down period in-lake Kainjirefers to the period,, between the highest water elevationand the lowest water elevation in a given year (betweenFebruary and August).
Flood period: A flood period refers the the periodbetween the lowest water elevation of a given year and thehighest water elevation of the next year (effectively;August - January).
New area: A new area is exposed mud which had remainedinundated during the previous draw—down period.
Acquired area: An acquired area is an area of draw—downwhich maintains, a stand of E. !9nina in at least twoconsecutive drawdown periods. '

S
General Observation of Colonization
For each In drop in water elevation, up to 80km2o mud are exposed (Table 1) This exposed mud can becbionized by E. sta9nina both by seeds and by tillers fromthe nodes of old stems, provided the mud is wet enough forgermination of the seed and establishment of tillers, Themud is exposed during the rainy season so conditions areusually suitable, The internodes of the stem die afterthe new tillers are established.
If the exposed area is new, it is colonized mainly byseedlings of E. nina, A new area may become acquiredif it is exposed in the next drawdown period when it iscolonized mainly by the production of tillers from nodes ofthe previous seasons plants0 If the area is not exposed,the colonizing plants of the previous season usually die0An acquired area may also remain inundated during the nextdraw—down period. Plants in such areas are also killed.
An acquired area may stay exposed for more than twoflood cycles. In this situation, the mud may become dryenough for other terrestrial plants to establish, and thearea will be lost to E. stag.nina through competition. Thusthe area of draw—down colonized and acquired by E. staqninaf or a given year is largely determined by the highest' waterelevation (January) and the lowest water elevation (August)of the previous year. (See also Obot and Morton, 1984),
Estimation of the Colonization Factor (R)
As stated above, the expansion of E. stagnina intonew areas is mainly by seedlings while retention ofpreviously colonized area is achieved largely throughtillering from the nodes of previous seasons plants. Anestimation was made of such colonizing ability on an areabasj and termed the factor, R1. This factorwas estimated from tiller density and seed production perin2 of E.stagnina stand,
Eight in2 seed collectors (seed collectors were 1m2trough hollowed out of polyurethane packing materials; thismaterial floats easily).were randomly placed in the grassstand at Monai (Site 2, see figure 1), and seeds trappedin the collectors were ounted daily throughout the fruitingseason (November — FebruaryJ. The mean number of seedscollected fo the total period was 1Q09 seeds in 2, Meantiller density was 197 tillers ra2 in January, 1982. Thus,each tiller has effectively produôed 51 seeds (1009/197), R.

6
If the recorded tiller density and seed production dataare representative of the entire E. stagnina stand, then seedproduction from each tiller is enough to produce 5.1 tillersand therefore, each im 2 of E. stagnina stand can expand to5.1rn2 of E. stagnina stand, provided that the seed isdispersed evenly.
The Effect of Flooding on the Establishmentof Echinochloa stagnina
E. stagnina has been observed growing in the lakerooted in areas of 9.5m depth. Also stems of the grassshave been observed floating. Such stems may not come incontact with the wet mud during the drawdown, New tillersproduced by these stem? are less vigorous at the outset andeventually die. The daw-down is thus seen to be a conditionfor the survival of Echinochloa stagnina in the lake. Thispremise was investigated further as described below.
Laborator_y Investigation of Nodal Tillering
Three pieces of mature stems of E. stagnina bearingthree nodes each were placed in a planting pot filled withsoil collected from the lake shore, The pots were wettedevery day with tap water but not flooded. This was replicatedthree and marked treatment I. Treatment II was set up in asimilar manner but the pots were flooded such that the stemcuttings remained floating and not in contact with the soil.After five days periodic observations were made, the numberof open leaves per tiller and the mean tiller length per potwere observed as an index of plant performance under thetwo treatments.
Field Investigations of Nodal Tillering
Two treatments similar to the laboratory investigationswere set up in the lake, Twenty stem cuttings carryingthree nodes each were used in each of 10 replicates. Thefloating stems were kept in place by a floatable ring tiedto a stake. For the sediment treatment, the stems wereplaced on the wet mud close to the water edge. Investigationswere carried out from December to January.
The treatments were first observed after 12 days atwhich time the number of sterns producing actively growingtillers were counted. Observations on the performance (meantiller length of selected and labelled tillers - the largestas of the 12th day) commenced 33 days after the experimentbegan.

7
SEED GERMINATION
Laboratory Tests of Germination
The seeds of Echinochloa stagnina when mature usuallyfall directly into water. It has been suggested(Nuénscher, 1936) that for proper storage, seeds of aquaticplants, should be kept in water.
E. stagnina collected for this investigation were,however, stored dry because of difficulties posed bybacterial and fungal infection when the seeds were stored inwater
Seeds were collected in January, 1982. Part of thisseed lot was at once tested for germination: 10 seeds inthree replicates were placed on filter paper in petri-dishes,The filter paper wetted every day. After 14 days, ofobservation, no seed germinated.
Part of the same seed lQt was stored dry until May, 1983when theexperiment was, repeated. This time, there were twotreatments. In Treatment 1, 66 seeds were planted in threereplicated directly from the storage flask. In Treatment IIthe seeds were soaked in water for 5 days, sun-dried forthree days and then planted. Sixty-six seeds were plantedin three replicates. All the replicates of both treatmentswere wetted every day and observed for 14 days. Rates ofgermination is presented under results.
Distribution and Zonation of E, stagninain Lake Kainji
Stand and species data collected on the distributionof macrophytes in lake Kainji was analysed by reciprocalaveraging ordination (Hill, 1973.) and association aralysis(William an Lainbert, 1959). Detils of methodology has beendescribed elsewhere (see Obot, 1984).
STANDING CROP, GROWTH RATE, PHOSPHORUSND NITROGEN CONCENTRATION
Site of Data Collection
Data for standing crop and nutrient levels werecollected in site 2 (Monai, see Fig. '1) where grazing andharvesting could be, effectively controlled, This site wasalso easily accessible at all seasons.

8
Data Collection and Analysis
For determination of standing crop above sediment,the density of plants was first determined at nine randompoints using a 1m2 floatable quadrat. At each point anindividual plant was recovered by a diver. The deepest divewas 9m. Sampling was carried out at monthly intervals.Dry weight of the individual plants were combined withdensity data for conversion to standing crop on an areabasis. Thus dry weight of an individual plant, W, mult±pliedby the density, D, of plants at the point it was collectedwas regarded as the standing crop at that point
Mean monthly standing crop is thus given by
9
W. x D.1 1i1
9
Growth rate was calculated using the reltaionship
Nrt = log t -
T
where r is the growth rate, N is the monthlystanding crop and is the standing crop at the beqinninof the study. T is time in months.Utilizable standing crop (the portion of standing crop
usually harvested for livestock) was estimated by clippingplants shoots extending above water wIthin a O25rn2 floatablequadrat. Sampling was carried out from a boat. The boat wasrowed a random number of Oar strokes (number drawn from a bagof random numbers) in a randomly chosen direction tchosen bytossing a 10k coin, using the base of the palm tree aspointer). Plants were oven dried at 65°C (as recoiumendedby The International Institute for Tropical Agriculture,Ibadan (I.I.T.A.) for chemical analysis) to constant weight.Data on water elevation were obtained from National ElectricPower Authority (N,E.P.A.).

9
Nitrogen and Phophorus Concentration
Plant materials collected and treated as describedabove were separatedinto stem, leaf (including leaf-sheath)'nd inflorescence. Chemical analysis was carried out at theLaboratories of the International Institute for TropicalAgriculture (101.T0A.) Ibadan. Replicate samples wereanalysed in the Kainji Lake Research Insitute Laboratories.
EFFECT OF CONTINUOUS HARVESTING ONE. stagnina
Ten 1m2 plots were randomly located in the E. stagninastand at Monai (site 2 see Fig. 1). This plot size waschosen for ease in sampling from a boat. The plots werevisited at intervals from 35 - 45 days0 Thirty days waschoen as a minimum because, from a preliminary study, theplant was found to grow to a reharvestable height withinthis time. During each visit, the tiller density in eachplot was recorded and the above water biomasss of the grasswas determined To determine biomass, the above water partof the grass was clipped0 During a preliminary study, itwas observed that plants cut below the water level usuallydie, so harvesting in this study was done above water.Plant material was oven dried at SO°C to constant weight.
CONTRIBUTIOS OF MACROPHYTES TO THEEVAPOTNS±TIONAL LOSSES FROMLAKE KAINI
The role of the emergent vegetation in theevapotranspirational losses from Lake Kainji was investigatedusing the water balance method0 (see also Sokolov andChapman, 1974). The study of water balance is the hydrologicalapplication of the principle of conservation of mass, Thisstates that, for any arbitrary volume and during any periodof time, the difference between Input and output will bebalanced by the change in water storage within the volurne,
For Lake Kainji, the major inputs are; surface inflow,F1; and precipitation in the form of rainfall R. The majoroutputs are: turbine and spill—way flow F0; evapotranspiration,ER; and losses due to seepage, I.
A simple water balance equation for Lake Kainji willthus be:
As = Fj+RFQERI

10
where s is the change in storage in a given timeinterval.
The floor of Lake Kainji is silty alluvium, and it iscommonly held that losses due to infiltration and seepageare negligible in reservoirs over fine textured soils(Taisma and Leliji, 1976). Moreover, if water balance inLake Kainji is considered on an annual basis, errors due toinfiltration will be negligible because the lake returns toalmost the same volume each year (see also Sokolov andChapman, 1974). Thus the water balance equation for thelake reduces to the form:
= F. + R - F - E1 o P.
To estimate total evapotranspiration, the equation canbe written as:
E F. ±R -. F AsR 1 0
This equation was used to estimate total evapotranspirationfrom Lake Kainji. For this estimation, all parameters inthe equation were treated as flow rates per year in m3 x 10Data on inflow, outflow, precipitation and storage wereobtained from the hydrology division of the National ElectricPower Authority (NEPA) at the Kainji Damfl Estimates of openwater (pan) evaporation were also obtained from NEPA.
RESULTS AND DISCUSSION
Laboratory Investigation of nodal Tillering
The results are shown in Table 2. All stems intreatment II died while stems in treatment I showed a steadygrowth throughout the seventeen days of observation.
Field Investigation o nodal Tillering
After 12 days the percentage of surviving stems inTreatment II (floating) was 20,3 ± 6.2* and the percentage ofsurviving stems in Treatment I (sediment) was 78.60 ± 10.4.
Results of the performance of labelled tillers are shownin Figure 2. Analysis of variance (Table 3) showsthat there is a significant effect of the treatment on theperformance of the grass. The shape of the curve of the
* All confidence intervals at p 95% unless otherwise noted

11
sediment treatment (Figure 2) indicates a long, lag phasein the growth of the grass. At the start of the experiment,the stems were placed on wet mud but by the 47th day the waterlevel had risen such that the root zone of the new tillerswas floodeth This might explain the sudden fast growth.
From the two investigations, it is clear that stemsthat are in contact with wet mud have a higher chance of•survival than those remaining floating.
Bidwell L1.a76) observed that during the draw-down inLake Kainji, the emergent flora, mainly Echinochloa sp.does not die by being ,stranded but ref bats when the lakerises. Van der Va'lk and Davis (1980), working in a prairieglacial marsh, rorted that periodic draw—downs enableseveral emergent species to co—exist in a community becauseof their diverse response to disturbance. Cook (1980)reviewed the use of lake level draw—down as a macrophytecontrol technique and doncluded that the technique can beeffective but is species specific, some species beingstimulated.
The low percentage of stems that survive the floatingconditions and the highly significant effect of the treatmenton the performance of the grass indicates that the draw—downis necessary for successful establishment and growth ofEchinochloa stagnina.
Seed Germination
The result of seed germination tests is tabulated intable 4. The wetted, dried and re—wetted seeds show a muchhigher percentage germination.
Field Observation
The seedlings of E, ina are usually found on thedraw—down area during the low—wate season. Since theseeds are mature from January to Februar , when the waterlevel is at its maximum, seeds, therefore, must have stayedin water for up to seven months before the mud is exposedin August, Once exposed, the seeds may likely become some-what descicated and re—wetted before germinating. Thefailure of the laboratory test of seed to germinate inJanuary 1982 immediately after collection suggests thatseed germination may also be age dependent, although failureto treat these seeds by wetting, drying and re-wetting mayhave led to germination failure.
Distribution and zonation ofE. stagnina in Lake Kainji
acrophrte zonation in Lake Kainji is shown in Figure 3.The zones are. ?tmiedlcel the dreuencv and

12
duratiOn of inundation. There are four major plantsassociation in the draw—down area of the Kainji Lake. Theseassociations may better be described as:
Savanna zone
Mimosa pigra zone
Echinochloa/grass zone
Mud communities
Figure 4. is a schematic representation of thesevegetation zones at Wara (Figure 1).
The savanna zone is, strictly, not in the draw—down area.This zone lies above usual high water mark and carries aherbaceous flora typical of the Northern Guinea Savanna, forexample, Indigofera bractiolata, Tephrosia platycarpa, T,elegans and Cassia mimosoides. The most frequent grass isVetivera nigritana.
The Mimosa pigra zone is readily recognized by thetangle of Mimosa pigra with an undergrowth flora made up ofIpomoea aquatica., Digitaria horizontalis, Vetivera nigritanaEchinochloa pyramidalis, Leptochloa caerulescens, Ludwigialeptocarpa and Sorghum arundinaceum which frequently formsdense almost pure stands. These are killed when the areais flooded. Echinochloa stagnina is present in this zonebut not frequent. Soil pH is between 5 and 6.
The Echinochloa/grass zone is characterized by a dnsestand of Echinochloa stagnina on acid soil (pH < 5); otherplants in this zone are Polygonum seneqalense which formssudds with the grass Vossia cuspidata, Sacciolepis africanaand Leptochloa caerulescens, Broad leaved herbs in thiszone include Alternanthera sessilis and Ludwigia leptocarpa.
The mud communities are characterised by the highfrequency of plants of the family Cyperaceae, mainlyCyperus dilatatus, interspersed with seedlings of E, stagninaand Polygonum senegalense. Broad leaved herbs in this zoneare the floating Ludwigia stolonifera, which may anchorPistia stratiotes among its roots, Sphenoclea zeylanica,Ludwigia leptocar and L, erecta. This zone is only exposedhen the water level fall below 132 AMSL, The soil p isbetween pH 5 and 6.

13
Echinochioa stagnina forms dense stands only in theEchil chioa grass zone, between elevation 132.6m AMSL and137 05m SLO The grass, however, grows without forming densestands in other areas of the draw-down, between elevation14L7m AMSL and 13100m AMSL (see also Chachu, 1977) E,stagnina therefore, seems to prefer shallow areas with waterdepths between 3m and 9m (see also Henderson, 1973),inundated for eight months and completely exposed for up tofour months in any draw-down-flood cycle, The distributionof E0 stagnina may thus be determined by seasonal inundation(water regime) and water depth0 It is not clear whether theacid soil under the grass is a determining factor in itsdistribution or whether the presence of the grass has amodifying influence on the soils
Standing Crop and Growth Rate Estimation
The monthly standing crop of Echinochloa stagnina,July 1981 to January 193, is shown in Figure Thesuper-imposition of the monthly watr elevation in the lakeon the standing crop curve suggests obvious relationshipbetween the two. The regressive relationship is indicatedin figure 6, The relationship is not linear but approachesthe exponential: Y = ae or Ln Y = Ina + bx0 The bestfit regression is mY = 34,4 ÷ O29 x (r2 O56, n = 17)whe Y is the standing crop and x is the monthly mean waterelevation0
Figure 7 shows the relationship between growth rateof E0 stagnina and the rate of change in water elevation.The growth rate seems to be related to the rate of changeof water elevation but no statistically significantcorrelation was found between the two0 Other factor may beequally important
The relationship between standing crop and climaticvariables was investigated0 There is no significantcorrelation between standing crop and radiation balance,nor is there significant correlation between standing cropand minimum air temperature0 There is, however a significantnegative correlation (r* = O66) between standing cropand mean lake temperature0 A higher rate of respiration isexpected at high water temperatures, (e0g0 Abdulrahman andWilliams, 1981). This may partly explain the lower netproduction (standing crop) at high lake temperatures0
* Significant at P < OO5

14
Nitrogen and Phqphorus Concentration
The trend in nitrogen concentration of the stern andleaves throughout the growing season is shown in Figure 8There is a decrease in the nitrogen concentration in the sternbetween July and October (the period when new growth begins;the nodes of old sterns becoming active to produce new tillers) 2after which there is a steady accumulation of nitrogen in thestem. There is increase in nitrogen concentration of leavesduring the active growing period (July to December) and asharp decline after DeceitÜer0. Isichei (1 9 1), working in thederived and guinea savanna zones of Nigeria, showed that thereis loss of nitrogen fpoi, the beiow-ground parts of grassesdirring the flush and mi,d—growth phases and an accumulation ofnitrogen in the below2ground parts after peak :biomassMorton (1977), working in a Molinietum in Berkshire2reported that 75% of the nitrogen and phosphorus in Molinialeaves was withdrawn before abscission in Echinochioastagnina the nodes of the stem are the major organs ofpropagations A nitrogen partitioning to the nodes during thegrowing season to he used in' early regrowth during the nextgrowing season is therefore hypothesized here0
No systematic trend in phosphorus concentration of theplant 'can he discernible from the present data although thereis variation from one sampling period to another samplinqperiod.Effect of continuous harvesting' on B0 stagnina
The results are tabulated in Table 5. TI'ta'hanqsin tiller density at each visit is shown in Figr::e 9.Iheje £3 S ,.,.eer tndencv :,. ,,n :e se .. ,,,.,.i" c1crtfLer cvc sCS Th c 3; cm — 2
major environmental variable were kept constan InthlcaLe, us e'iel of rhe wa-er C3ujS. C' 'W 'cie scid wenccl fLrEt rtn; r - . CElflrsg -]:upuouc the eu CL Jw ) m,JYc ea: ui dr±cn't,h,LJ l1O7eV°1 . p rer - _1C 2 -'
exists0 Y = 3227 ft2 O82 5) where Y isthe tiller density and N is time in days0 The chanpe instanding crop with time during continuous harvsostincc isshown in Figure 1OS There iS decrease in standincj cronafter each harvest which fits the logarithmic relationship
= a + hlnx, (1 354997 6450 77mm ft2 p95, n 6 where= standing crop and x time in days) That there is a
decrease in standing crop with each harvest while there isan increase in tiller density indicates a decrease in mean

15
tiller weight with harvest. Figure 11. shows that meantiller weight does decrease after every harvest0 Productionof new tillers exerts a nutrient denand on the stump. Withthe continuous removal of the shoot, the nutrient store inthe stump is slowly depleted. Thus as the number of tillersincreases, one expects decreasing performance because lessnutrients are available in the stump. Also, with increasein density of tillers, the tillers will have a shading effecton each other so that photosynthetic efficiency will decreasewithout a commensurate decrease in respiration. A lowerperformance is thus expected.
Figure 12. shows the relationship between the tillerdensity and the mean tiller weight0 The relationship closelyfIts the logarithmic model Y = a + blnx, specifically Y =91,03 14,Ollnx (r2 0,84, n = 6) where Y is the meantiller weight and x is the tiller density0
One might expect a relationship between the standingcrop at, the present harvest, Y and the -biller density x2at the previous harvest and time (days) x1. This relatioshipwas lnve.fligated by fitting a polynomial equation to the datashown in Table 5. The best fit polynomial is Y = 12.59.98i,94x1 — 1.14x2 (r2 0.82). The signs associabed with theparameters x1 and x2 indicate that any increase in theii er deilslcv with harvest w] 1 e e:c a laLg ecs cve
effect on the total standing crop of subsequent harvests4From a management stand-point, one needs to know the
number of harvests that could he made on one plot duringone growing season without lowertng utilizable harvest toan uneconomic level. This was investigated by regressionrejqcI Tie rsrn;,cn 2629 0 b:,ii = 7 V standing crop, x = number of harvests; 1 st, 2ndcrc 'wc. -nafl 113 0 flve Inosca coijC l n3c'e flgrowinci season with the standing crop reduced, however,after each harvest. For Lake Kainji, if the grass isa. esued e em crty £ire harvest t vn tpan LHperiod1 January to April when cattle fodder is in shortsupp:Ly
EFFECT OF PLALT REMOVAL ON THENUTRIENT STATUS OF LAKE_KAINJI
The effect of harvesting and removal of Echtnochloastagnina from the Kainji Lake ecosystem was investigated bya modelling approach. This model is. an extension of- theKainji Lake Echinochloa Model (Morton and Obot, 1984).
16
The part of E. stagnina utilizable for livestock fodderis the part which extends above water bearing the few (usuallyfive) leaves. It is known, from field observation, that theelongated stems are used for thatching and as fuel for fishsmoking. This, however, is negligible compared to harvestfor livestock fodder. The utilizable part is approximately10% of the total plant and the utilizable standing crop (UT)is thus given by:
UT = 0,1 X APROD
The nitrogen concentration of the utilizable part of thegrass is approximately 2% while the phosphorus concentrationis approximately 0.2% (see Table 3,1.. of Ohot, 1984).
The nitrogen remoáble (in tonnes) is given by:
NREM = 0.02 X UT t
The phosphorus removable (in tonnes) is given by:
PREM 0.002 X UT t
Model Predictions Including StandingCrop? Nitrogen and Phosphorus Content
The result of applyin9 the model to years 1972 to1983 is shown in Table '6. With a cutting regime of 75%,up to 3200 tonnes of nitrogen may be removed per year whileup to 320 tonnes of phosphorus may be removed For arenewable resource management the nutrients removed must bemade up by inputs to the system so that the system sustainsitself.
At present, however, the nutrient budget of the KainjiLake is not understood well enough to know whether particulateand soluble nutrient input into the lake is enough to offsetthe estimated removal.
Estimates of Evapotranspiration Losses
The result of applying the wate balance equation tofive years data are shown in Table 7 also shown in Table7 is the area of lake surface colonized by emergentvegetation in the years 1978 1982 as calculated using theKainji Lake Echinochloa Model (Morton and Obot, i984). Onewould expect there to be a correlation between E nd areacolonized by the vegetation A, assuming that lear areaincreases with area colonized. In fact there is regressiverelationship, the best fit being the exponential form:

17
ER0.62e22 x 1OA (2 = 0.56, n =5).
Stern (1965) also found an exponential regressiverelationship between evapotranspiration and leaf area indexin safflower.
Based on the theoretical volume of the laic.e given as13m3 x 10, the percentage reduction in lake volume due toevapotranspiration varied from 12.6% (1980) to 17.7% (1978)with.a mean of 14.5%. This agrees reasonably with estimateof 15,1% of the hydrology division of NEPA,
Also shown in Table 7 are estimates of evaporationbased on pan evaporation (En) observations at the dam site.The actual open water evapotatiori from the lake is probablylower than these estimates due to the "blanket effect"(Ward, 1975), but these estimates might be reasonableestimates of the potential evaporation in the Kainji area0The relationship between E (the evaporation from a freewater surface) and evaporaion from a plant covered surfaceis ER = fE where ER is the evaporation from a plant coveredsurface ann. £ is a correction factor. These estimates ofE were used to calculate a correction factor f ER/E forte aqu.tic vegetation of Lake Kainji. P
The calculated correcLion factor (Table 7) variesfrom 1.01 (1980) to 1.57 (1978) with a mean of 1.19.Correction factors reported for emergent plants in humidregions are always greater than one. (SokolovandChapman, 1974).Thus a quick estimate of evapotranspiration from Kainjigiven by:
ER i..19E
Errors exist, however, in the estimation of E due toerrors in the measurement of inflow in the 1ae. NEPAshydrologist, Fregene (per. comm.) agrees that estimates ofinflow into Kainji Lake is only approximate, becauseof water use for irrigation and domestic activities. Using theexpression ER = 1.l9Ep , estimates of evapotranspiration weremade for the years 1978 - 1982.
The result are shown in Table 8. The mean approximateevapotranspiration loss from the lake is i.86m3 x 10'. Themean percentage reduction in effective lake volume is 14,30%.This is not very different from its estimates of 14.50% usingthe water balance equation above, The figure 15.1% for 1982agrees with NEPAs estimate.

18
The overall trend in the present estimate indicates thatthe emergent vegetation contributes to the water losses ofthe lake, probably accounting for the reduction of theeffective lake volume by up to 17%.,
MANAGEMENT OPTIONS
THE RATIONALE FOR MANAGEMENT
The growth of Echinochloa stagnina in association withother emergent macrophytes in Lake Kainji has attractedwidely varied interests. While the power generationauthorities at the Kainji dam view it as a problem to thelake's hydrology and optimal, power generation, the cattlefarmers see it as an important source of dry season fodderfor their stock, while fishery experts view the grass standas a valuable spawning ground for a variety of economicall'important fish species. Wildlife experts and conservationistsalso see the grass as the only hope left for the return ofthe manatee, a herbivorous mammal that live in the River Nigerbe fore impoundment.
The grass, although a perennial, behaves as an annual inLake Kainji (see also Yabuno, 1970a), growing and producingmaximally during the drier months of the year when the lakeis at full volume. Figure 13 shows the monthly standingcrop of E. stagnina in Lake Kainji compared with the monthlystanding crop of terrestrial herbacious materials in twomajor vegetation types in the Kainji Lake National Park for1981 - 1982. Also shown in Figure 13 is the monthlyprecipitation to evaporation ratio (average of three yearsobservation) for the National Pak as a measure of monthlymoisture availability. Figure 13 shows that E. stagnin issuperior, in productivity, to terrestrial herbs especially inthe drier months of the year. Compared nutritionally withterrestrial grasses (Table 9, i stagnina t peak bIOIUaSFJis nutrtionaLL superior to r'osz trest:ideally, the yrass should be left t grow as a forage cropin the lake, However, the grass contributes toevapotranspirational losses of the lake which lowers theeffective volume of the lake perhaps up to 17%; furthermore,this effect will increase with increase in area coveredby Echinochloa.
The contribution to evapotranspirational losses,however, calls for a control measure. Results obtained inthis study indicate that the grass could be managed andmaintained within such limits that while it is used as a

19
renewable source of dry season fodder, it does not affectpower generation significantly, arid also, can satisfy theinterest of the fishery and wildlife experts,
MANAGEMENT PLAN
Harvesting Below Water
It has been shown in this study that Echinochioastagnina requires the lOm annual draw—down of the lake forsuccessful establishment and survival and thus growin such areas of the draw—down as are inundated for up to ninemonths in a year Consequently, it shows a strongly zonaldistribution The area of lake surface covered by the grassin a given year has aso been shown to depend on the miriimmand maximum water levels of the previous year (Morton and Obot,1984) The control measure (Morton arid Obot, 1984) demandedby this colonization characteristics is the harvesting of75% of the area covered per year for fodder, It is assumed,due to the relative ease of harvesting below water, that mostof the cattle farmers will harvest by cutting the plant belowthe water surface. In this case, all harvested plants willbe killed.
Harvesting Above Water
The grass can, however, be harvested above water.If this is done, the above water nodes, produce new tillersand tIller density increases with each harvest The samearea can thus, be harvested up to five times in one growthseason before the harvestable biomass fails below an economiclevel. During such continuous harvesting, although there isan increase in the tiller density, there is a decrease in themean weight of the tillers. This implies that the tillerslose vigour with each harvest. The best harvesting regimeis a function of the local condition and this need carefulstudy before harvesting is implemented.
NUTRIENT CYCLE
When plants are harvested below water, the harvestedplants are usually killed. Plnt materials kil1e decomposerapidly returning up to 2 x 1Okg of nitrogen and 7 x lO5kgof phosphorus to the lake, The harvesting and removal ofplants from 75% of the lake area coverd will cause theremoval from the lake, of up to 3 x 1Okg of nitrogen and4 x io5kg phosphorus. Harvesting above water will causethe removal of much greater amounts.

20
At present, the nutrient budget of Lake Kainji is notwell enough understood to know whether particulate and solublenutrient input into the lake are enough to offset the estimatedremoval. This should be the subject of ñizther investigations.
No estimates are available on nitrogen fixation byaquatic blue-green algae in the lake, although estimates fromother lake systems (e.g. Home and \Jiner, 1971) and fromterrestrial crusts (e.g. Isichei, 1979) suggest that imputsfrom this source may be considerable, Nitrogen fixationby cyanobacteria crusts in the sediment during draw-down mayalso be considerable. Particulate nutrients in the dungof cattle ad wild u.ngulates that graze the Echinochioastand during the draw-down also need quantification.
agement of Echinochloa stagnina in othermai-made lakes cattle, drink ppnds andfish ponds: a conjecture
Most man—made lakes and cattle drinking ponds in thenorth of Nigeria draw-down naturally in the dry season, Insuch ponds, Echinochloa stagnina tillers may not establishsuccessfully under tETharsh conditions of the dry seasonthus, dry—season growth as in Lake Kainji may not be obtained,In this situation, an intensive management is required. Thegrass could be established by tillers and/or seeds at the outof the rains, harvested at peak growth and stored as hay forthe dry season. The effect of drying on the nutrient contentof E. stagnina and loss of nutrient value with storage of dryE. na are subjects of on-going study at Kainji LakeResearchInstitute. Preliminary- results indicate that theres no significant loss in the nutrient value with quick dryingin Solar Kilns, The effect of sun drying is not yet wellestablished.
In fish ponds where artificial water level control ispracticable, the pond could be drawndown in the rainyseason to allow Echinochloa stagnina to establish itself thenthe water level could be dawn-up for good dry season growth.Such management, would depend, however, on the area of fishpond that the pond manager can safely allow for grassdevelopment. A careful study of local conditions would alwaysbe necessary.

21
ACKNOWLEDGEMENTS
The materials presented in this report is part ofa thesis presented in partial fulfilment of the requIrementsfor the award of the degree of doctor of philosophy,University of If e The study was funded by Kainji LakeResearch Institute I wish to thank Dr J,SOO Ayeni foruseful comments on the manuscript
LITERATURE CITED
Abdulrahmnan, FS and Williams, GJ, (1981) Temperatureand salanity regulation of growth and gas exchange ofSalicornia fructicosa (L) L, oia 48(3) : 346352.
AkenOva, M,E. (1976) Forage potential of photoperiodsensitive millet (Pennisetum americanum (Linn) K, Schum)Maiwa in South Western Nigeria, Nigerian Journal ofAnimal Production 3(2): 13—19,
Ayeni, J.SO,; Obot, E.A. and Chachu, REO (1982) Landuse for increased Beef production in the Kainji-LakeBasin, Paper presented at the National Conference onProduction, Kaduna, 1982 Proceedings (In press).
Bidweli, A, (1976) The effect of water level fluctuationson the biology of Lake Kainji, Nigeria The NigerianField 41(4) 156—165,
Chachu,'R.E,O. (1977) The Vascular Flora of Lake KainjiProceedings of the Intenational Conference on KainjiLake and River Basin Development in Africa, Vol. II,Kainji Lake Research Institute, Nigeria,
Cook, GD. (1980) Lake level draw as a macrophyte controltechnique, Water Resources Bulletin 16(2): 317322,
ElZarka,E.L. (1973) Kainji Lake Nigeria: In ManmadeLakes: their problems and environmental effects,Ackermann, W.C., White, G,F and Worthington, EB, eds,American Geographical Union, Washington D,C.
Henderson, H.F. (1973) A Liznnological description.of KainjiLake, 1969 — 1971 F.A.O, Tech, Report FI/DP/NIR 66/524/10,

22
Hill, M.O. (1973) Reciprocal Averaging. An Eigen VectorMethod of ordination. J. Ecol, 61(1): 237—249.
Horne,A.J, and Viner, A.B. (1971) Nitrogen fixation andits significance in tropical Lake George, Uganda Nature
232: 417—418.
Imevbore, A.M.A. (1975) The Kainji Dam and Health. In:
Man—made lakes and human health, Stanley, N.F. andAlpers, M.P. eds. Academic Press, London..
Imevbore, A.M.A. and Bakare, 0. (1974) Pre-impoundinentstudy of the Swamps of Lake Kainji Basin. TheAfrican Journal Trop. Hydrol. and Fish 3(1):79-93.
Isichei, A.0. (1981) Nitrogen concentration in the majorgrasses of the Derived and Guinea Savanna Zones ofNigeria in relation to season and site. Trop. Agric.60(1): 48—52.
Isichei, A.0. (1979) Elucidation of stocks and flows ofnitrogen in some savanna ecosystems. UnpublishedPh.D. Thesis, University of If e, Nigeria.
McGinty, A.; Smeins, F,R. and Merrill, L,B. (1982) Influenceof spring burning on cabtle diet and performance on theEdwards Plateaue. J. Range Management 36(2): 175-178
Morton, A.J. and Obot, E.A. (1984) The control ofEchinochloa stagnina (retz.) P. Beauv By Harvesting forDr season livestock fodder in Kalnji Lake Basin NigeriaA modelling approach J. Apl. Ecol. 21(2): 687-694.
Morton, A.J. (1977) Mineral Nutrient Pathways in A Molinietumin Autum and Winter J. Ecol. 65: 993-999.
Muenscher, W.C. (1936) Storage and Germination of Seeds ofAquat;Lc Plants. Bulletin 652. Cornell UniversityAgricultural Station, Ithaca, New York.
Obot, E.A. and Morton, A.J. (1984) A computer programmefor calculating the area colonizable by aquaticmacrophytes in Lake Kainji; Kainji Lake ResearchInstitute Technical Report: No. 13.
Obot, E.A. (1984) Studies on the productivity of Echinochloastagnina (Rezt.) P. Beauv. in the Kainji Lake Basin ofNorthern Nigeria, Ph.D. Thesis University of Ife.
23
Oyedipe, EO0, Buvanendran, V0 and Eduvie, .LO0 (1981)Some factors affecting the reprodudtive performance ofwhite fulani (Bunaji) cattle0 Tpp Agric0 (Trinida)59(3): 231—234
Sokolov, A0A0 and Chapman, T0G. (1974) Methods for waterbalance computations0 The UNESCO Press, Paris0
Stern, W0R, (1965) Evapotranspitation of safflower t threedensities of sowing0 Aust0 J Agric0 Rise0 16: 961—971,
Talsma, T0 and Van der Leiyj, A0 (1976) Water balanceestimation of evaporation from ponded rice fields in asemi-arid region0 c0TaterManagemewt 1: 89-97
Usman, 3080 (1981) Produbtion of Heracious materials inGuinea Savanna0 Unpublished M,Sc, Dissertation0University of Ife,
Van der Valk, A0G0 and Davis, C.B0 (1980) The importance ofnatural draw—down on the growth of four emergent speciesin a prairie Glacial Marsh0 Auatlc Botany 9: 301—322.
Ward, C0R, (1975) Principles of Hydrolog0 2nd Ed0 pp. 99103 McGraw-Hill Book Company (UK) Limited0
William, W0T. and Lazubert, J0M0- (1959) Multivariate methodsin plant ecology I Association analysis in plantcommunities. J. Ecol0 47: 83—101.
Yabuno, T0 (1970a) Biosystematics of Echinochloa stagnina(Retz0) P0 Beauv. Cytological relationship been the12 - ploid and 14 ploid strains0 Genetica 41: 311—315w

24
Table 1Hypsographic chart for Kainji Lake(Modified front Table 2 of Henderson (1973))
Height of Uppersurface
(a above M.S.L)
Lake Volume(3 io
Area of 1—rnStratum
(m3 x 10)
IncrementalArea of MudExposed (km3)
142 15.6 1.30 0
141 14.4 1.24 60
140 13.2 1.17 70
139 12.0 1.11 60
138 10.9 1.05 60
137 9.9 .99 60
136 8.85 .92 70
135 7.95 .86 60
134 7.10 .76 80133 6.30 .73 50
132 5.60 .67 60131 4.90 .63130 4.3 .58129 3.7 .53128 3.25 .48127 275 .43
126 2.3 .39125 1.9 .35124 1.35 .31
123 1.25 .26 not122 1.0 .22 usually121 .85 .18 exposed120 .7 .14
119 .6 .09
116 .5 .07
117 .4 .05
116 .35 .04
115 .30 .03
114 .25 .02
113 .2 .01112 .1 .005111 .05 —
110 — —
Table 2 — Performance of E. stagnina growing on sedimentand floating (Laboratory investigation)
Date Ja Floating (Treatment II) SedIment Trealonent I)No. of Open
1Mean Tiller No. of
—1Mean Tiller
Leaves Tiller Length (cm) Leaves Tiller Length (cm)
26/10/82 1 0.00 0.00 1.20 ± 0.48 2.10 ± 1.227/10/82 2 0.00 0.00 1.30 ± 0.76 2.90 ± 1.126/10/82 3 0.00 0.00 1.70 ± 0.74 3.32 ± 1.229/10/82 4 0.00 0.00 2.32 ± 0.66 3.90 ± 1.041/11/82 7 0.00 0.03 2.80 ± 0.25 4.23 ± 0.862/11/82 8 0.00 0.00 3.00 ± 0.00 4.88 ±0.393/11/82 9 0.00 0.00 3.11 ± 0.25 5.80 ± 0.904/11/82 10 0.00 0.00 2.80 ± 2.50 6.73 ± 1.325/11/82 11 0.00 0.00 2.80 ± 0.25 6.73 ± 1.328/11/82 14 0.00 0.00 2.70 ± 1.50 7.27 ± 1.579/11/82 15 0.00 0.00 2.22 ± 0.51 7,27 ± 1.6610/11/82 16 0.00 0.00 2.22 ± 0.51 7.27 ± 1.6611/11/82 17 0.00 0.00 2.33 ± 0.66 7.30 ± 1.76

Table 3 — Two way ANOVA of the effect of treatmentand time.
Sources of variance df SS MS FS
A (Treatment) 1 2,650.7532 2,650.7532 146.36
B (Time) 3 3,097.8924 1,032.6308 57.02
AS (Interaction) 3 1,781.0613 593.6871 32.78
Residual 72 1,303.9770 18.1708
Significant at P < .001
Table 4 - Percentage Gernination of E. stagnina Seedsunder two treatments (see text for explanationof treatments)
No. ofNo. ofReplicateSeeds Seedlings Percentage
Germinationafter 14 days
TREATMENT I 1 66 10 15.1
2 66 10 15,1
3 66 0.00 0.00
TREATM3NT II 4 66 24 36.3
5 66 21 31.8
6 66 20 30.9
Table 5 — Effect of Continuous Harvesting of E. stagnina
D ta e Da SyNumber
Tillersofm
Dry we,ghtgm
Mean TillerWeight tg)
20th October 1981 — 120 ± 36.2 3392 ± 128.8 28.2
3rd December 1981 43 408 ± 261.9 1214.3 ± 35.7 2,97
13th January 1982 85 (42) 436.6 ± 20.6 595.3 ± 39.5 1.36
25th February 1982 128 (43) 480.5 ± 17.2 347.4 ± 8.0 0.72
3rd April 1982 165 (37) 799.1 ± 102.9 208.0 ± 13.2 0.26
15th May 1982 207 (42) 639.8 ± 36.7 68.5 ± 3.6 0.10
24th June 1982 247 (40) 952.9 ± 25.2 138,3 ± 6.8 0.14

26
Table 6 - Rainji Lake Echinochioc Model
YEAA AREA PCI PROD ACT APROD UT(T) WREMIT) PREM(T)
1972 428.0 32.3 1194774.0 10.8 391933.5 39193.1 753.9 78.4
1973 593.0 45.6 1806374.0 3.8 484919.1 48491.9 969,8 97.0
1974 578.0 44.5 1606374.0 17.6 634316.9 63431.7 1268.9 128.9
1975 360.0 27.7 800468.0 22.4 647068.1 64706.8 1294.1 129.4
1976 492.0 37.8 1624066.0 28.5 1149334.7 114933.5 2293.7 229.9
1977 439.0 33.6 1382140.0 33.8 1382140.0 138214.0 2764.3 276.4
1978 558.0 42.9 1595544.0 42.9 1595544.0 159554.4 3191.1 319.1
1979 531.0 40.8 1531640.0 40.8 1534640.0 153164.0 3363.3 306.3
1980 470.3 36.2 1396248.0 36.2 1396248.0 139624.8 2792.5 279.2
1981 422.0 32.5 1136280.0 32.5 1136280.0 113628.0 2272.6 227.3
1982 544.0 41.8 1580382.0 41.4 1563596.6 156309,7 3126.2 312.6
1983 579.0 44.5 1612872.0 44,5 1612872.0 161287.2 3225.7 322.5
AREA = Potential area colonizable (km)PCT = Potential Percentage Area Covered Ibm)ACT = Actual Percentage Area CoveredPROD = Total Standing Crop (tonnes)OP = Utilizable Standing Crop )tonnes)NREM = Nitroun Rernoved (1)
PREP ?hosphorus Removed IT)
Teble 7 - Result o6 Applying the Water Ralance Equation to Flow Data 1978 — 1982
e1 Total bumsFi* m x 10
TotalPrecipitationR: m x io
TotalOutflow
m x i09Storagee m x 10
TotalEvapotraflspiatiOr.
ER m x 10
Total PSnEvaporationE' R X 10
ERI
ER
Area of LtheSurface
Colonized byVegetation
**
1978 26.33 0.81 22.63 2.20 2,31 1.35 1.57 558
1979 35.61 0.31 33.63 0.62 1.67 1,62 1.03 532
1980 29.62 0.34 29.01 —0,69 1.64 1.61 1.01 470
1981 26.81 0.34 25.13 0.40 1.66 1.60 1.03 422
1982 26.02 0.21 24.39 -0.35 2.19 1.66 1.31 544
* Data of PEPA Kathji
8rton arid Obot (1984)

27
Table 8 - Result of applying th,e expression ER = •1.19 Eto estimate Evapotranspiration from Lake I<ainji
Source: Aken 'Ova 1976
Crude protein = % N x 6.25 (see McGinty et al. 1982)
Year ER = 1.19 E (inn x 10) Percentage Reduction in LakeVolume
1978 1.60 12.30
1979 1.92 14.76
1980 1.91 1469
1981 1.90 14.61
1982 1.97 15.15
Mean 1.86 14.30
Table 9 - Nitrogen percentage and CrudeEchinochioa stgnina and someat peak Standing crop
Protein content ofterrestrial grasses
KjedahlNitrogen
Crude -
Protein Asn
Echinochloa tagnina 1.41 0.08
Pennisetuni pedicullatum 0.41 ± 0.01*
8.81 6.7
2.66 —
Schizachyriu sauguinium 0.44 ± 0.002** 2.75 —
Pennisetum violaceuxa 0.37 ± QQ5* 2.31 —
P. americanurn —
yp_arrhenia involucrate 0.41 ± 0.02*
H. cyanenscens 0.09 ± 0.01*
Andropogon tectoruin 0.61 ± 0.01*
13.52+ —
2.66 —
0.56 —
3.81 —
A. gayanus 0.38 ± 0.002**
A. africanus 0.66 ± 0.07*
Rotthoellia exaltata 0.72 ± 0.04*
2.38 —
4.12 —
4.50 —
Loudatia flavida 0.50 ± 0.06* 3.12 —
Aristidia kerstingii 0.12 ± 0.4*
Andropogç seudaprieus 0.35 ± 0.003**
A. chirensis 0.44 ± 0.001**
Beckeropsis uniseta. 0.51 ± 0.01
0.75 —
2.19 —
2.75 —
3.19 —
* Usman 1981: +** Isichei 1981

////
///
33 34 35 36 37 38 39 40 41 42 63 44 45 46 47 48 49 50 51
TIME IN DAYS.
Fig. 2. Performance of .. Stagninci growing in Sediment o—-—o andFloating o—
28
1100011000
10000
90 50
Fig. 1. Map of Lake Kainji ShowingStudy Sites
study sites
I• Confidsnce Limits
KEY
Open Wtr
Svannci ZoncEchinothloo/Crasstoneiti_flPE pigro Zon0
Mud Commuilies
Monoi
30
0
ii
Kainji Dam
S DoongnriScale 1:5Q0C) 000
FIG. 3. VEGETATION MAP OF LAKE KAINJI 1983

Echinochion! ti0ijMud Grass Zone ExpoS2d yearly
coffssuri ExpZCd yes1t March- DecemberI
- (10 months)1tiesAugust—Nov. E. Stagnlno
ISub— (4 months) present
1iTISrgqd1 Dense Stand IPlOnts of EcflinochlQQ present
I stagnina
I I
I- '-I I-
______
10 9 6 1-5
Usually esposedSubmerged
December— January
FIg. 5. -Total Standing Crops of E. Stagnina for July 1981January 1983-
29
Savanno Zone
en Water
WATER DEPTH AT FULL V0UE (ALTITUDE 142m)
Fig. 4 A Schematic Repcentation of The Vegetciticn Zoneal Wora (Site 3.)
C
Standing CropX—-—--—X Wotcr Elevation
[ 951. Confidence interval-
0'C
Ea'
a-0
0z02U)
-JU)
E
20—
-Jt'J
I— 1981 1 1. 1982 -vi k-,98

C0
0>
En
En
C
U
0En
30
+
+
+
+ +.+
+
+
++
142 0
600C
E4500
0U
En 3000C
Cci
En,
_ 1500
C01
0
1320 13'.O 1360 380 1400
Month(y Mon Water elevation (rn.AI4,SL
Fig. 6. Relationship between standing, crop and moonmonthly water elevation.
1uij
0En
ci
0to
'8.
0
a
ci,ciCEn.
Ena.
Stern
Time in months1982
Fig. . Changes in the nitrogen content of stem andleaves of E'Stagnifla with time
IOQC
Jan1983.
Fig. 7. Growth rate of E' stagnina .— —. comparedwith rate of change of water elevation ——-.o
80C
600E
En
En
40C
ZOC
0
La#w atl-.-uIt voIume—-—I —Lake level tauIing..
0 70 140 210
Time in days2O 30
Fig. 9. Effect of continuous harvesting on tiller density

E2700-a,
0.0
a,a
Ca(a
0' 24-
0'
16-
S
C B-0
a,
=aS
31
3600-
1800-
900-
0-'
1 70 10 2;0
Time in days
280 350
Fig. 10. Change in standing crop with time duringcontinuous harvesting.
32-
70 140 210
Time in days
0.1
280 350
Fig 11- Effect of continuous harvesting on mean tillerweight of E.stagnina.
3
24
16
8
200 400 600 8(l0 1000
Tillers rn—2
Fig. 12. Relationship between mean tiller weight andtiller density.
0)
*
E
U(9zQzU)
32
5
4
0
0
Ui
1
z
OCT. NOV.
(1981.)
DEC JAN. FEB. MAR- APR. MAY- JUN JUL.
(1962.)
Fig. 13. Standng Crop of Echinochloa stagnina x x in Lake Kainjicompared with the standing crop of herbaceous materials inthe Isobertinia wood land ———o and Terminalia macropterawood land a— — —o. x———x Rainfall /Evaporcxtion ratio(mean of 3 years observation at Kainji Lake Research Institute)Data o— —e, o—..—O; Obot and Wan (unpublished).

t


Kainji Lake Research Institute Technical Report Series
No. 1 ITA, E.O. (1978)A preliminary report on the fish stockassessment and management proposal for theI.I.T.A. (Ibadan) irrigation and domesticwater supply reservoir.
No. 2 YARO, IBRAHIM (1979)A practical approach to the design cogetructionand operation of midwater trawl used in KainjiLake Nigeria.
No. 3 AYENI, J.S.O. (1979)Some aspects of the development of grazingreserves in Kainji Lake basin, Nigeria.
No. 4 IBEUN, M.O. (1979)Keinji Lake basin, Nigeria: a multi—disciplinarybibliography, 1957—1978.
No. 5 ITA, E.O. (1980)A review of recent advances in warm wateraquaculture research and a proposed experimentaldesign for maximizing fish production inNigerian fish ponds.
No. 6 IBEUN, M.O. (1980)An index to the proceedings of the internationalconference on Kainji Lake and River Basinsdevelopment in Africa.
No. 7 EYO, A.A. (1981)The construction and operation of a newmechincal gas smoking kiln (Kainji Gas Kiln)
C). S ITA, E.O. (1982)Biological indices of overfishing in KainjiLake and the management proposal for tha Lakefiry
No. q IBEUN, M.O. (1983)A preliminary report on the construction anduse of a simple optical coincidence device inKainji Lake Research Institute's Library.
No. 10 CHAUDHRY, A.B. AND ERINNE, E.C. (1983)Determination of optimum irrigation frequencyfor various field crops in the Kainji Lakeregion of the Nigerian savanna. I. Onions(Allium cape L.) -
No. 11 CI-IAUDNRY, A.B. AND ERINNE, E.C. (1983)Determination of optimum irrigation frequencyfor various field crops in the Kainji Lakeregion of the Nigerian Savanna. II. Cowpea(Vigna unguiculata (L.) Kelp).
No. 12 CHAUDNRY, AB. AND OGO, R.C. (1984)Determination of a package of inputs for maize(Zee mays L.) crop in the Kainji Lake basin ofNigerian savanna.
No. 13 OBOT, E.A. AND MORTON, A.J. (1984)A computer programme for calculating the areacolonized by emergent macrophytes in Lake Kainji.
No. 14 ITA, E.O.; SADO, E.K.; BALOGUN, J.K.; PANDOGARI, A.AND IBITOYE, B. (1985)
Inventory survey of Nigerian inland waters andtheir fishery resources. I. A preliminarychecklist of inland water bodies in 1igeria withspecial reference to ponds, lakes, reservoirsend major rivers.
No. 15 IBEUN, M.O. (1985)Nigerian wildlife: a bibliography and bibliometricanalysis, 1930—1982.
PUBLISHED AND PRINTED BY KAINJI LAKE RESEARCH INSTITUTE, NEW BUSSA, NIGERIA