this report is the culmination of an effort by the calgary ... · this report is the culmination of...
TRANSCRIPT
This report is the culmination of an effort by the Calgary Chamber of
Voluntary Organizations (CCVO) to provide Albertans with useful and
timely information about the thousands of nonprofit organizations that
operate in the province. Funding for the project was provided by the
Government of Alberta.
The Canada West Foundation was commissioned to perform the
core research components of the project. The project was managed
by CCVO’s Director of Workforce Development Michael Grogan.
This report was prepared by the Canada West Foundation’s
Senior Researcher Robert Roach and Canada West Foundation’s
Policy Analyst Shawna Ritchie. Canada West Foundation Intern
Candice Powley was instrumental to the research and survey that
form the basis of this report. The authors wish to thank the State
of the Alberta Nonprofit Sector Survey Advisory Committee for
their contributions to this report: Rhonda Barraclough, Alberta
Association of Services for Children and Families, Peter Boland,
Peter T. Boland and Associates, Russ Dahms, Edmonton Chamber
of Voluntary Organizations, Peter Elson, Mount Royal University,
Roger Gibbins, Canada West Foundation, Punch Jackson, Carol
Moerth, Alberta NonProfit/Voluntary Sector Initiative Secretariat,
and Katherine van Kooy, Calgary Chamber of Voluntary Orga-
nizations. The authors especially want to thank the hundreds of
nonprofit organizations that completed the online survey. Any
errors or omissions remain the responsibility of the authors. The
opinions expressed in this document are those of the authors only
and are not necessarily those of Canada West Foundation’s Board
of Directors, advisors or funders.
© 2011 Calgary Chamber of Voluntary Organizations
QUESTIONS?Michael Grogan, Director of Workforce Development, CCVO
[email protected] • 403-261-6655 ext. 227
Funding for this project has been provided by the Government of Alberta
Contents Figures / Appendices ExecutiveSummary 2 Preface 3 Introduction 1 4 Methodology 2 5 ExistingResearch2.1 6 TheStateoftheAlbertaNonprofitSectorSurvey2.2 6
LimitationsoftheSurvey2.3 7 DiversityWithintheSector2.4 8 SurveyResults 3 9 Keycharacteristics3.1 10 Howmanyorganizationsarethere? 10 Whatdoorganizationsdo? 11 Figure 1 PercentageofOrganizationsbyPrimaryActivityArea
Howmanyyearshaveorganizationsbeenoperating? 12 Figure 2 AgeofOrganizations
Whodoorganizationsserve? 13 Figure 3 GeographicReachofOrganizations
14 Figure 4 GroupsServed
SizeofAnnualRevenues 15 Figure 5 PercentageofOrganizationsbyAnnualRevenues
SourcesofRevenue 16 Figure 6 RevenueSources(PercentageofRespondentsReporting FundingfromEachSource)
16 Figure 7 RevenueSources2003(NSNVO)(excludingHospitals, UniversitiesandColleges)
HumanResources3.2 17
PaidStaff 17 Figure 8 NumberofPaidStaff
StaffRecruitmentandRetention 18 Figure 9 ChangeinStaffSize(comparedtothreeyearsearlier)
18 Figure 10 TroubleRetainingPaidStaff
19 Figure 11 DifficultyAttractingandRetainingStaff
StaffDevelopment 20 StaffSalaries 21 Figure 12 AverageSalaryofNonprofitManagersbyAnnual OperatingBudget2005–2010(inThousandsofDollars)
VolunteerResources 22 Figure 13 BoardMemberTimeCommitment(averageannual hoursperboardmember)
23 Figure 14 NumberofVolunteers
23 Figure 15 VolunteerTimeCommitment(averageannualhours pervolunteer)
24 Figure 16 DirectionofVolunteerSupport(numberofvolunteers comparedtothreeyearsprior)
StabilityofRevenueSources3.3 25 Figure 17 ChangeinAnnualRevenue
26 Figure 18 DifficultyRaisingRevenue
26 Figure 19 IsDemandforServicesRising?
28 Figure 20 RevenueChangesbySource
Conclusion 4 29 ClimbingOutoftheDark4.1 30 CurrentStateoftheSector4.2 31 References 32 33 Appendix 1 MethodologicalLessons
36 Appendix 2 MajorSecondarySources
38 Appendix 3 PercentageofOrganizationsbyPrimaryActivityArea
39 Appendix 4 US“StateoftheSector”Reports
40 Appendix 5 AbouttheCalgaryChamberofVoluntaryOrganizations
40 Appendix 6 AbouttheCanadaWestFoundation
2
Executive Summary
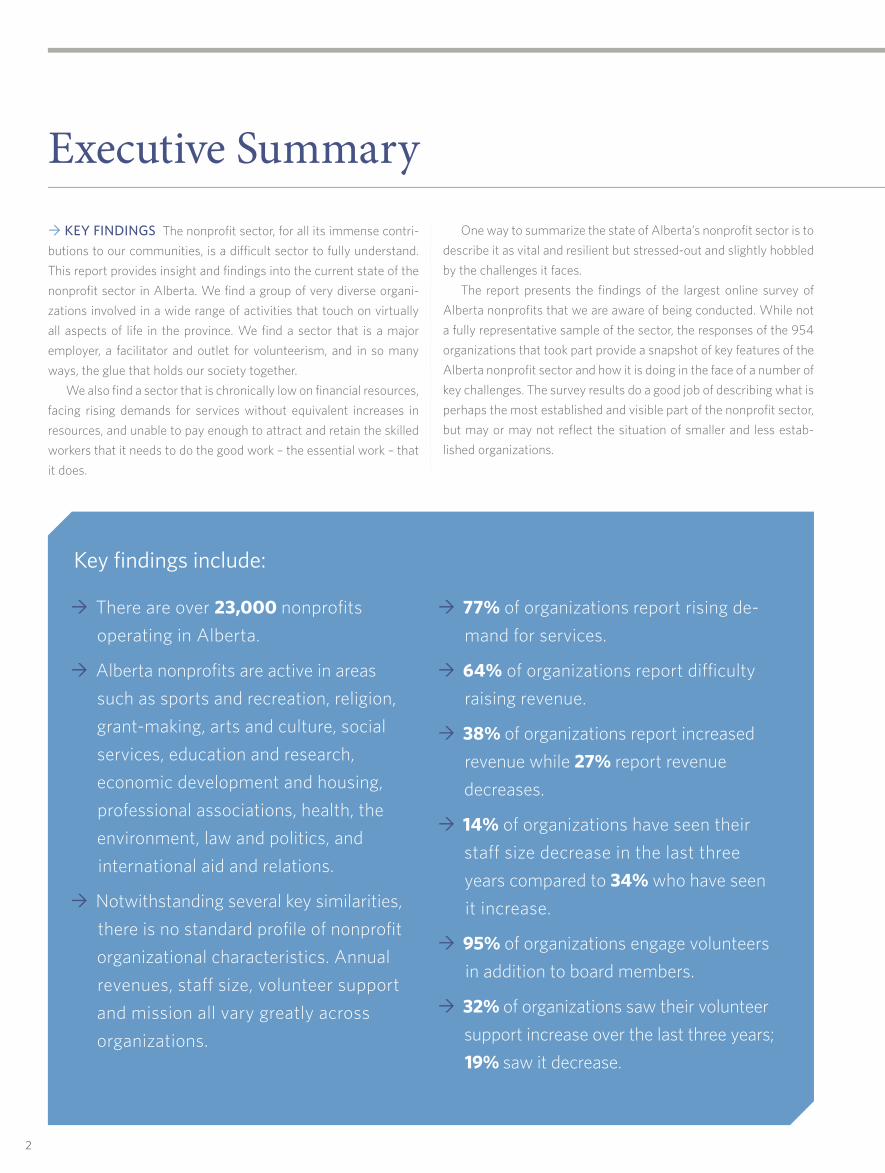
Keyfindingsinclude:
There are over 23,000 nonprofits
operating in Alberta.
Alberta nonprofits are active in areas
such as sports and recreation, religion,
grant-making, arts and culture, social
services, education and research,
economic development and housing,
professional associations, health, the
environment, law and politics, and
international aid and relations.
Notwithstanding several key similarities,
there is no standard profile of nonprofit
organizational characteristics. Annual
revenues, staff size, volunteer support
and mission all vary greatly across
organizations.
77% of organizations report rising de-
mand for services.
64% of organizations report difficulty
raising revenue.
38% of organizations report increased
revenue while 27% report revenue
decreases.
14% of organizations have seen their
staff size decrease in the last three
years compared to 34% who have seen
it increase.
95% of organizations engage volunteers
in addition to board members.
32% of organizations saw their volunteer
support increase over the last three years;
19% saw it decrease.
KEY FINDINGS The nonprofit sector, for all its immense contri-
butions to our communities, is a difficult sector to fully understand.
This report provides insight and findings into the current state of the
nonprofit sector in Alberta. We find a group of very diverse organi-
zations involved in a wide range of activities that touch on virtually
all aspects of life in the province. We find a sector that is a major
employer, a facilitator and outlet for volunteerism, and in so many
ways, the glue that holds our society together.
We also find a sector that is chronically low on financial resources,
facing rising demands for services without equivalent increases in
resources, and unable to pay enough to attract and retain the skilled
workers that it needs to do the good work – the essential work – that
it does.
One way to summarize the state of Alberta’s nonprofit sector is to
describe it as vital and resilient but stressed-out and slightly hobbled
by the challenges it faces.
The report presents the findings of the largest online survey of
Alberta nonprofits that we are aware of being conducted. While not
a fully representative sample of the sector, the responses of the 954
organizations that took part provide a snapshot of key features of the
Alberta nonprofit sector and how it is doing in the face of a number of
key challenges. The survey results do a good job of describing what is
perhaps the most established and visible part of the nonprofit sector,
but may or may not reflect the situation of smaller and less estab-
lished organizations.

3
PrefaceMethodological Challenges and Lessons for Further Research
The nonprofit sector in Alberta is exceptionally diverse and far
reaching. Some organizations are big, some are small. Some have no
paid staff, others have hundreds of employees. Some serve children,
some serve animals, some serve the general public. Many are found
in Alberta’s two largest cities, but others dot the countryside.
On top of this inherent complexity, and even after the large online
survey and gleaning of existing sources presented in this report,
high quality statistical information that represents the full width and
breadth of the sector is severely lacking. Sector-wide time series data
that can establish trends is almost nonexistent. Governments collect
only the most basic information about nonprofits, and even this is
often incomplete. Regular surveys that provide representative find-
ings for Alberta nonprofits are expensive – the last (and only one)
was conducted in 2003.
Is nonprofit revenue up or down? How many staff do nonprofits
currently employ, how much do they make and how many are unem-
ployed? How many people are served by nonprofits? Though we
cannot fully answer these or a host of similar questions, there are
pieces of information coming in from the front lines all the time that
give us insight into the full picture and how it changes over time.
The lessons learned while preparing this report will improve future
efforts to do so and, at the same time, highlight the need for more and
better information about Alberta’s nonprofit sector. To this end, there
is a critical role to be played by the provincial government in facilitating
the ongoing collection of consistent and meaningful data on Alberta’s
nonprofit sector. There are opportunities for the province to collect
more data directly from nonprofits at the time of annual registration
and to support regular and robust surveys of the sector.
Appendix 1 provides a list of the lessons learned about how to
go about conducting a state of the nonprofit sector study that will
hopefully inspire and improve future survey work and, in turn, lead to
a better picture of Alberta’s nonprofit sector. The ultimate goal is to
use this knowledge to make informed decisions, identify trouble spots
and areas of strength, and ensure that the sector thrives over the long-
term. After all, if we let the nonprofit sector languish, we all suffer.
In the movie “Scent of a Woman,” a blind army officer played by
Al Pacino laments that he is “in the dark.” The same can be said of
Albertans (and Canadians in general) when it comes to the thou-
sands of nonprofit organizations that operate in our midst. We know
that these organizations do a tremendous amount of good things and
that our society would be devastated if they did not exist. Despite this,
the last (and only) comprehensive survey of nonprofits was conducted
over seven years ago. The National Survey of Nonprofit and Voluntary
Organizations was led by a consortium of concerned nonprofits and
conducted by Statistics Canada in 2003. The survey was a massive
undertaking that required the full resources of our national statistical
agency to complete. Unfortunately, there appear to be no plans to
repeat the survey. A complementary attempt by Statistics Canada to
measure the nonprofit sector’s contribution to gross domestic product
(the Satellite Account of Nonprofit Institutions and Volunteering) does
not provide the information on a provincial basis.
We are indeed in the dark. There is, of course, anecdotal infor-
mation about how the sector is doing and numerous small-scale
surveys have been conducted, but we don’t have a good database
of consistent, sector-wide information about nonprofit organizations.
This makes it very difficult to get a sense of “the state of the sector”
and even harder to make informed public policy decisions about it.
To help address this information gap, the Calgary Chamber of
Voluntary Organizations teamed up with the Canada West Foundation
to put together a current portrait of Alberta’s nonprofit sector. Inspired
in part by “state of the sector” reports conducted by other jurisdictions,
the goal was two-fold: to test the options for preparing a state of the
sector report for Alberta with an eye to assessing the viability of doing
a report on a regular basis; and to produce an inaugural edition of the
report that would be useful to stakeholders and the general public.
We certainly learned a great deal about the trials and tribulations
of putting together a report of this nature with a limited budget and
within a reasonable timeframe. We pass along what we learned
about the process in Appendix 1.
We were also able to gather enough quality information about
Alberta’s nonprofit sector to prepare this report. In addition to
existing information, we are extremely thankful for the over 950
nonprofit organizations that took time from doing the good things
they do to complete our online survey.
This report is not a complete portrait, but it does provide a fresh
look at the nature and activities of the thousands of “points of light”
that do so much to make life better in Alberta. If only we had a little
more light to shine back onto the sector to see how it works and how
it is doing.
Robert Roach, February 2011.

444
1 The nonprofit sector is composed of a diverse array of organizations, including social service organizations,hospitals,universities,museums,sportsandrecreationorganizations,shelters for thehomeless,artscouncils,foodbanks,organizationsthatraisefundstosupportmedicalresearch,self-helpgroups,placesofworship,socialclubs,tradeassociations,andadvocacygroups.Althoughwidelydisparateintheirareasofactivity,allnonprofitandvoluntaryorganizationsshareacommonsetofcharacteristicsthatdistinguishthemfromgovernmentandprivateorganizations.Organizationsareconsideredtobepartofthenonprofitsectoriftheyare:
•Organized(i.e.,havesomestructureandareinstitutionalizedtosomeextent,butnotnecessarilylegallyincorporated).
•Nongovernmental(i.e.,areinstitutionallyseparatefromgovernments).•Nonprofitdistributing(i.e.,donotreturnanyprofitsgeneratedtotheirownersordirectors).•Self-governing(i.e.,areindependentandabletoregulatetheirownactivities).•Voluntary(i.e.,benefittosomedegreefromvoluntarycontributionsoftimeormoney).
(Halletal.2003a).
2 CharitablestatusisaconceptthatdatesbacktotheElizabethanera.Today,itisimportantbecauseitallowsnonprofitorganizationstoissuereceiptsthatallowdonorstoclaimataxdeduction.Thecourtshaveidentifiedfourcategoriesofcharity:thereliefofpoverty;theadvancementofeducation;theadvancementofreligion;andcertainotherpurposesthatbenefitthecommunityinawaythecourtshavesaidischaritable.
PointsoflightasatitleforthisreportisderivedfromaspeechgivenbyUSPresidentGeorgeH.W.BushinhisinauguraladdressonJanuary20,1989.
Introduction 1According to the National Survey of Nonprofi t and Voluntary Organizations (NSNVO) conducted in 2003, Alberta has over 19,000 nonprofi t organizations1 operating within its borders, or approximately 610 nonprofi ts per 100,000 people. Over half of these (57%) are registered as charitable organizations with the Canada Revenue Agency.2 The NSNVO also found that the nonprofi t sector in Alberta generated $9.6 billion in revenue, harnessed 2.5 million volunteers and employed over 175,000 people in 2003.
These fi ndings showcase the sector’s signifi cant economic and social contributions to the province. Despite this, more recent sector-wide information of the sort found in the NSNVO is lacking and there are no offi cial plans afoot to repeat the NSNVO anytime soon.
In 2010, the Calgary Chamber of Volunteer Organizations (CCVO) commissioned the Canada West Foundation (CWF) to conduct a survey of Alberta’s nonprofi t organizations and to prepare a pilot report on the state of the sector that could serve as a template for future (or perhaps even annual) sector report updates. The goal was to begin building an information base on the Alberta nonprofi t sector.
While we did not have the resources to replicate the meth-odology of the NSNVO, we are able to provide a sense of the current health of the sector and the challenges it faces as Alber-tans move into the second decade of the 2000s.
The fi ndings reinforce the image of the sector as large, diverse, volunteer-driven and active in a wide range of areas from social services and health care to religion and amateur sport. The survey excluded hospitals and universities. The sector continues to be faced with a range of challenges including demand outstripping resources and intense competition for skilled labour. This fi nan-cial pressure has impacts on the ability of nonprofi ts to fulfi ll their mandates, and on their ability to recruit and retain qualifi ed employees. The survey results generally demonstrate that, while Alberta has a vibrant and active nonprofi t sector, it is under a great deal of strain, which is an ongoing barrier to achieving its full potential.
Despite these challenges, the sector remains resilient and continues to play its vital role. As always when interacting with the people who work and volunteer in the nonprofi t sector, we were impressed by the passion, hardiness and commitment they possess. This report is dedicated to them.
“Thank you for this opportunity. We hope it will give the appropriate people
some idea how diffi cult it can be to serve your community.” – Survey Participant

555
Two methods were used to prepare this report: the mining of existing studies;
and an online survey of Alberta nonprofi t organizations.
2.1 ExistingResearch
2.2TheStateoftheAlbertaNonprofitSectorSurvey
2.3LimitationsoftheSurvey
2.4DiversityWithintheSector
Methodology 2

6
Existing Research 2.1The secondary research involved collecting existing studies that include information on nonprofit organizations in Alberta, evaluating their
applicability and quality, and then integrating this information into the report where appropriate. The main existing studies are outlined in
Appendix 2.
The only comprehensive and statistically representative survey of
nonprofits operating in Alberta took place in 2003. The National Survey
of Nonprofit and Voluntary Organizations (NSNVO) was conducted by
a consortium of groups including Statistics Canada, Imagine Canada
and the Canada West Foundation. The national sample included over
13,000 incorporated nonprofit organizations (i.e., formally incorpo-
rated or registered under specific legislation with provincial, territorial
or federal governments) representing an estimated 161,000 nonprofit
organizations operating in Canada in 2003.
The Canada West Foundation was given the task of preparing
a summary of the results for the Alberta sub-sample (see Roach
2006). The survey involved extensive telephone interviews with 1,639
respondents representing an estimated 19,356 nonprofit organizations
operating in Alberta in 2003.
Replicating the method used for the NSNVO proved to be imprac-
tical for the State of the Alberta Nonprofit Sector Survey. Without the
resources of Statistics Canada and a very large budget, compiling a
list of Alberta nonprofits with up-to-date contact information from
which a truly random (and therefore truly representative) sample
could be drawn combined with the effort required to conduct in-depth
telephone interviews was not a viable option.
As a result, it was decided to conduct an online survey. An
invitation to complete the survey was sent via email to over 3,600
organizations. The invitation was also posted on the CCVO and CWF
websites and project contacts were asked to distribute the invitation
to their networks.
The online survey was open from mid-July to mid-October 2010.
A total of 954 organizations took part.
The State of the AlbertaNonprofit Sector Survey 2.2
7
Limitations of the Survey 2.3 Although steps were taken to ensure that the survey was sent to the
full spectrum of nonprofits in the province, the final sample of 954
is neither random nor stratified based on known characteristics of
the sector such as type, size and location of organizations. A random
sample would have required the initial invitation list to be randomly
selected from the total population of nonprofits and a higher
response rate. Stratification would have required fulfilling quotas for
specific categories of nonprofits in order to ensure that the sample
accurately reflects the main features of the sector as a whole. This
was not compatible with the online survey method we used. Under-
represented subsectors include very small organizations with no paid
staff, sports and recreation organizations and religious organizations.
Social service organizations, on the other hand, are overrepresented
in the results as are organizations with charitable status. It is impor-
tant to note that, although nonprofit in nature, hospitals/health
authorities, universities and colleges were omitted from the survey.
As a result, the findings are not “representative” of the Alberta
nonprofit sector in a strict statistical sense. Nonetheless, the feed-
back received from the 954 respondents comes from a wide range
of organizations and provides a reasonable snapshot of the nature
of the sector and some of the key issues it currently faces. The 2003
NSNVO survey results, while dated, can be used to fill in gaps related
to certain characteristics of the sector while the new results provide
an updated diagnosis of some key aspects of the sector’s health.
Assuming that the NSNVO results are more representative of the
sector as a whole and that there have been no major shifts in the
type of nonprofits operating in Alberta since 2003, we can identify
where the 2010 State of the Alberta Nonprofit Sector Survey differs
from the actual situation on the ground. In particular, social service
agencies are overrepresented while sports and recreation and reli-
gious nonprofits are underrepresented. It is unclear why religious
organizations were less likely to respond whereas the lack of sports
and recreation organization participation is likely the result of their
tendency to be run by volunteers whose contact information changes
on a regular basis.
In addition, according to the NSNVO, 57% of Alberta’s nonprofits
were also registered charities in 2003. However, 57% of the 23,152
nonprofits registered with the Alberta government yields 13,197
charities, which is much higher than the actual figure of 9,100 (39%
of Alberta’s nonprofits). This discrepancy is likely due to differences
between how the NSNVO list was generated compared to the list
kept by the Alberta government rather than the result of a major shift
in the proportion of charities in Alberta’s nonprofit sector since 2003.
This illustrates both the need for extreme caution when comparing
nonprofit data from different sources and the ongoing lack of defini-
tive data on the sector.
Regardless of which proportion is more accurate, the fact that
78% of respondents to the State of the Alberta Nonprofit Sector
Survey identified their organization as a registered charity means that
charities are over-represented in the survey. This is not surprising
given that charitable status usually means that an organization is
relatively well-established and, therefore, easier to contact.
Given the above, the results of the State of the Alberta Nonprofit
Sector Survey are more likely to reflect that part of the nonprofit
sector that has been operating for some time, has paid staff, and
provides social services. Assuch,thesurveyresults doagoodjobof
describingwhatisperhapsthemostestablishedandvisiblepartofthe
nonprofitsector,butmayormaynotreflectthesituationofsmallerand
lessestablishedorganizations.
For this reason (and the methodological differences that stand
behind it), we cannot use the State of the Alberta Nonprofit Sector
Survey to update the NSNVO (i.e., identify changes over time). As
such, the more comprehensive NSNVO will be used as the basis for
establishing broad sector characteristics (with the caveat that they
date back to 2003), but the 2010 survey will be used to explore how
Alberta’s nonprofits are faring today in terms of the challenges they
are experiencing.

8
Diversity Within the Sector 2.4There are many things that link nonprofits together including their
use of volunteer labour and the fact that they do not distribute earn-
ings to owners/investors. It is, however, a mistake to think of the
sector as homogeneous. The sector is, in fact, extremely diverse.
Just as humans share key traits but are also very different from one
another, so too are nonprofits.
Take two calgary nonprofits for example: the Economics Society of
Calgary (ESC) and Wood’s Homes. Both are nonprofits. But the ESC
is small, volunteer-run (with the exception of one part-time student
employee), focused on putting on lunches with economic speakers,
and not registered as a charity. Wood’s Homes, conversely, helps
children in need, has a budget in the millions, a large paid staff and
is a registered charity. It is important to remember the diversity that
characterizes the sector when interpreting the results that follow.

9
3.1 KeyCharacteristics
Howmanyorganizationsarethere?
Whatdoorganizationsdo?
Howmanyyearshaveorganizations
beenoperating?
Whodoorganizationsserve?
SizeofAnnualRevenues
SourcesofRevenue
3.2HumanResources
PaidStaff
StaffRecruitmentandRetention
StaffDevelopment
StaffSalaries
VolunteerResources
3.3StabilityofRevenueSources
Survey Results 3

10
As of March 2010, there were 23,152 nonprofit organizations registered with
Service Alberta.3 According to the list of registered Alberta charities kept by
Canada Customs and Revenue, there were 9,100 charitable organizations in
the province as of January 11, 2011. While there are differences between the
two lists, the majority of the organizations on the federal charities list appear
on the list of provincial registered nonprofits (as one would expect since
all charities are nonprofits and should be registered as nonprofits with the
Government of Alberta).4
How many organizations are there?
Key Characteristics 3.1
3 Thislistincludes“societies,”“religioussocieties,”and“nonprofitcompanies.”AswiththeNSNVO,groupsthatarenot formally incorporatedorregisteredarenot included. It is,however,possiblethatsomeunincorporatedgroupsthatarenotontheServiceAlbertalistmayhaveslippedintotheStateoftheAlbertaNonprofitSectorSurveysamplingframeforitwasnotpossibletocrossreferenceallgroupswhomayhavereceivedaninvitationtoparticipateagainsttheServiceAlbertalist.
4 Thecharitieslistincludeshealthauthorities,schoolboardsandpubliclibrariesthatdonotappearonthelistofregisteredAlbertanonprofits.Inthecaseofhealthauthorities(asinglehealthauthoritywascreatedin2008afterthedataonthenonprofitlistwascollected)andschoolboards,thelargeannualrevenuesoftheseorganizationsskewtherevenuedataavailablefromthecharitiesdatabase.(Missingrevenuedataformanycharitiesalsohasaskewingeffect.)

1111111111
Nonprofi t organizations in Alberta touch on virtually all aspects of life from
leisure time to medical care. Using the Canadian version of the International
Classifi cation of Nonprofi t Organizations (ICNPO), survey respondents can
be grouped into 12 primary activity areas plus a catch-all “other” category.
What do organizations do?
Notes Numbersmaynotaddto100due
torounding.Changesbetweenthetwosurveys
cannotbeseenastrendsasthemethods
usedyieldedresultsthatareNOTdirectly
comparable.TheNSNVOdataaremore
representativeoftheAlbertanonprofitsector
whiletheStateoftheAlbertaNonprofitSector
Surveydataprovideasenseoftheorganizations
itwasabletoreachandtheissuesthose
organizationsseeasimportant.*The“other”
categoryismostlikelyhigherfortheStateof
theAlbertaNonprofitSectorSurveybecause
NSNVOinterviewerspressedrespondents
overthephonetoselectaprimaryactivity.The
differencebetweenthesetwosurveysdoes
notindicatethatthesectorcharacteristics
havechanged,butratherthatdifferentdata
havebeengatheredasaresultofdifferent
methodologicalprocesses.
Survey Question Whatistheprimaryareaof
activityofyourorganization?Ifyourorganization
operatesinmultipleareas,pleaseselectthe
categorythatbestrepresentsyourprimaryareaof
activity.
Sources StateoftheAlbertaNonprofitSector
Survey2010andNSNVO2003.SeeFigure2in
Roach2006.
Figure 1 PercentageofOrganizationsbyPrimaryActivityArea
Sports and recreation 6%
26%
Religion 8%
19%
Grant making, fundraising or volunteer promotion 4%
11%
Arts and culture 12%
10%
Social services 38%
9%
Education and research 5%
8%
Development and housing 3%
5%
Business, professional associations, unions 1%
3%
Health 6%
2%
Environment 3%
2%
Law, advocacy and politics 3%
2%
International 1%0.4%
Other* 9%
2%
n 2010StateoftheAlbertaNonprofitSectorSurveyresults
n 2003AlbertaNSNVOresults
12
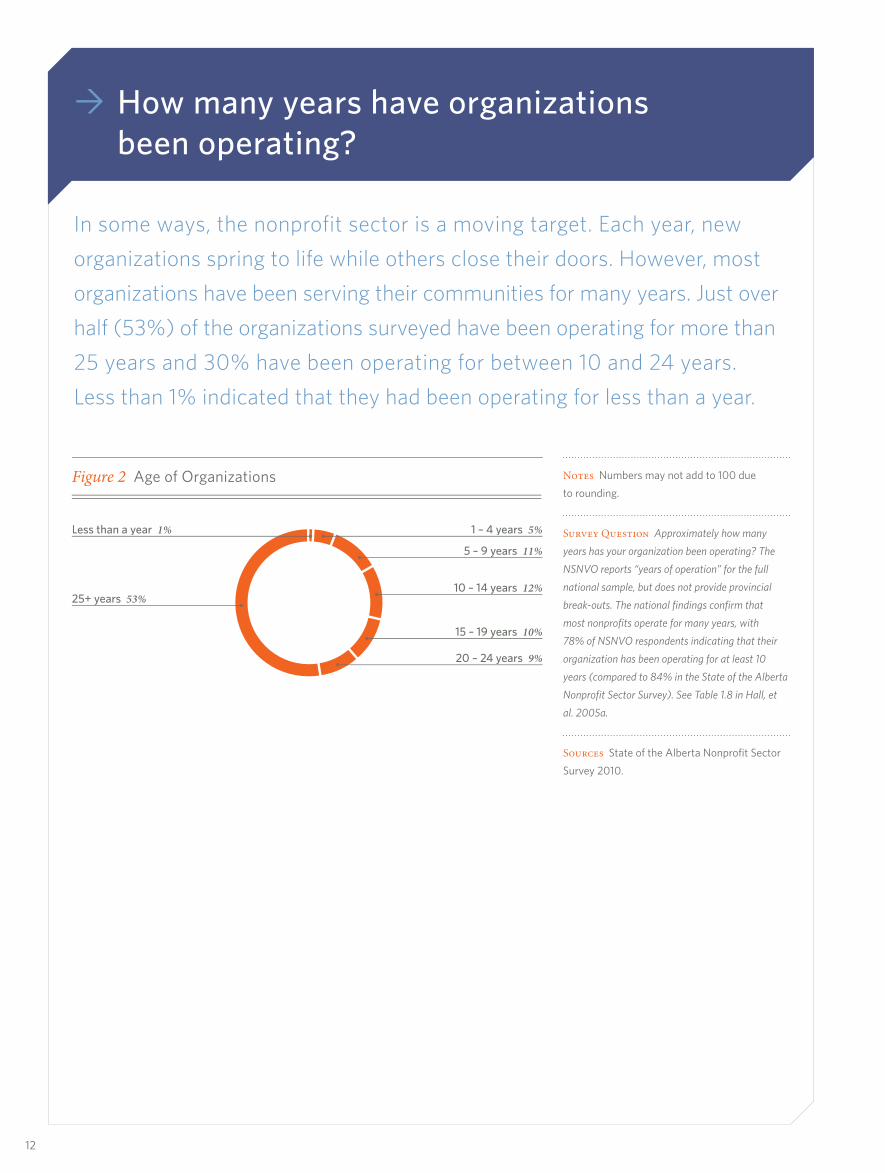
In some ways, the nonprofit sector is a moving target. Each year, new
organizations spring to life while others close their doors. However, most
organizations have been serving their communities for many years. Just over
half (53%) of the organizations surveyed have been operating for more than
25 years and 30% have been operating for between 10 and 24 years.
Less than 1% indicated that they had been operating for less than a year.
How many years have organizations been operating?
Notes Numbersmaynotaddto100due
torounding.
Survey Question Approximatelyhowmany
yearshasyourorganizationbeenoperating?The
NSNVOreports“yearsofoperation”forthefull
nationalsample,butdoesnotprovideprovincial
break-outs.Thenationalfindingsconfirmthat
mostnonprofitsoperateformanyyears,with
78%ofNSNVOrespondentsindicatingthattheir
organizationhasbeenoperatingforatleast10
years(comparedto84%intheStateoftheAlberta
NonprofitSectorSurvey).SeeTable1.8inHall,et
al.2005a.
Sources StateoftheAlbertaNonprofitSector
Survey2010.
Figure 2 AgeofOrganizations
Less than a year 1% ••••
25+ years 53% ••••
•••• 1 – 4 years 5%
•••• 5 – 9 years 11%
•••• 10 – 14 years 12%
•••• 15 – 19 years 10%
•••• 20 – 24 years 9%

1313131313
The importance of the Alberta nonprofi t sector is illustrated by the variety
of needs, groups and communities it serves.
Who do organizations serve?
Notes Numbersmaynotaddto100dueto
rounding.Changesbetweenthetwosurveys
cannotbeseenastrendsasthemethodsused
yieldedresultsthatareNOTdirectlycomparable
Survey Question Whichofthefollowing
bestdescribesthegeographicareathatyour
organizationprimarilyserves?
Sources StateoftheAlbertaNonprofitSector
Survey2010andNSNVO2003.
Figure 3 GeographicReachofOrganizations
Local municipality55%
74%
A region of the province21%
13%
The entire province 10%
7%
More than one province or territory 3%
2%
Canada4%
2%
International 4%
2%
Other3%
0.1%
n 2010StateoftheAlbertaNonprofitSectorSurveyresults
n 2003NSNVOresults
5 Becausewedonothaveinformationonthefinances,humanresources,etc.ofthefulllistofAlbertanonprofits(as theydo in, forexample,manyUSstates),andbecause theStateof theAlbertaNonprofitSectorSurveysampleisnotsufficientlyrepresentativeofAlberta’sregionstoprovideaccurateregionalanalysis,weareunabletopresentaregionalbreakdownoftheresults.AdditionaldatacollectionatthetimeofannualregistrationwithServiceAlbertawouldbetheeasiestwaytoovercomethislackofdataasthechallengesrelatedtosamplingthefullwidthandbreadthofAlbertaareextensive.
Nonprofi ts operate in Alberta’s large cities, smaller centres and
rural areas. Survey respondents hail from Barrhead, Camrose,
Coaldale, Didsbury, Fort McMurray, Grande Prairie, Kneehill
County, Lethbridge, Onoway, Raymond, Slave Lake, Three Hills,
Westlock, and many other places as well as the main centres of
Calgary and Edmonton.5
A quarter of survey respondents indicated that their orga-
nization has more than one location operating in Alberta. The
organizations with more than one location tend to be older and
registered as charities. Almost half of Alberta’s nonprofi t and
voluntary organizations (46%) serve their local municipal area
(city, town or rural municipality). Signifi cant proportions serve
either a region of the province (21%), the entire province (10%),
or a particular neighbourhood or community (9%).

14
Figure 4 GroupsServed
Children/youth
19%30%
Elderly/seniors
6%11%
Persons with disabilities/special needs
12%8%
Aboriginal peoples
1%4%
People of a particular ethnic or cultural origin, visible minorities, immigrants
2%4%
Single sex
4%2%
The general public
33%46%
Geographic area
5%10%
Other
16%24%
n 2010StateoftheAlbertaNonprofitSectorSurveyresults
n 2003NSNVOresults
Notes Numbersmaynotaddto100dueto
rounding.TheNSNVOallowedrespondentsto
selectmorethanonecategoryofgroupserved.
Asaresult,theNSNVOcolumnaddstogreater
than100%.Changesbetweenthetwosurveys
cannotbeseenastrendsasthemethodsused
yieldedresultsthatareNOTdirectlycomparable.
Survey Question Whichgroupsofpeople
doesyourorganizationMAINLYservethrough
itsprogramsandactivities?(Althoughyour
organizationmayservemorethanonegroup,
pleaseselectthegroupthatistheMAINoneserved
byyourorganization.)
Sources StateoftheAlbertaNonprofitSector
Survey2010andNSNVO2003.SeeFigure4in
Roach2006.

1515151515
“While revenues have increased, they in no way match the increase in
operating costs that we have experienced in the last two years and expect to
face in the next three years.” – Survey Participant
Size of Annual Revenues
Notes Numbersmaynotaddto100dueto
rounding.Changesbetweenthetwosurveys
cannotbeseenastrendsasthemethods
usedyieldedresultsthatareNOTdirectly
comparable.Note:The“don’tknow”responses
(n=105)wereremovedfromtheStateofthe
AlbertaNonprofitSectorSurveyresultsasthe
NSNVOresultsdonotincludethiscategory.
Survey Question Inthelastyear(last12
months,2009,ortheorganization’sfiscalyear),
approximatelywhatwasthetotalamountof
revenuethatyourorganizationreceivedfromall
sources?
Sources StateoftheAlbertaNonprofitSector
Survey2010andNSNVO2003.SeeFigure9in
Roach2006.
Figure 5 PercentageofOrganizationsbyAnnualRevenues
$99.9K or less30%
66%
$100K – $249.9K13%
17%
$250K – $499.9K11%
7%
$500K – $999.9K12%
5%
$1M – $9.9M25%
5%
$10M +9%
1%
n 2010StateoftheAlbertaNonprofitSectorSurveyresults
n 2003NSNVOresults
6 AnupdatedestimateisnotpossiblewithoutreplicatingtheNSNVO’smethodology.Unfortunately,StatisticsCanada’sSatelliteAccountofNonprofitInstitutionsandVolunteeringdoesnotprovideprovincialbreakdowns.Thecharitabledatabasecontainssomeincomedatabutitissubjecttoerrors,missingvaluesandcontainsquasi-governmentalorganizationssuchashealthauthoritiesandschoolboardsthatskewthedata.
We know there is a huge range in the annual revenues of nonprofi t
organizations; some organizations run on just a few dollars while
others are big operations with budgets in the millions. As is true
in the private and government sectors, there exists a tremendous
degree of heterogeneity in the nonprofi t sector.
In 2003, the total revenue of nonprofi t and voluntary organi-
zations (not including hospitals and universities) in the province
totaled $8.6 billion, which illustrates the signifi cant economic
presence of the sector in the province.6 The 2003 NSNVO high-
lights the variability of revenue size in voluntary organizations in
Alberta. According to the NSNVO data, the majority of organiza-
tions are quite small, and operate on annual revenues of less than
$100,000, whereas only 6% of organizations have revenues of
$1,000,000 or more. The State of the Alberta Nonprofi t Sector
Survey reinforces the diversity of revenue size in the sector,
but captures fewer of the smaller organizations included in the
NSNVO.
The organizations surveyed in the 2010 State of the Alberta
Nonprofi t Sector Survey have somewhat larger operating
revenues (on average) than those in the NSNVO. This is perhaps
unsurprising as organizations that are large enough to have paid
employees are more likely than small, volunteer-based organiza-
tions to respond to a survey about Alberta’s nonprofi t sector. The
larger operating revenues in the 2010 survey may also, in part,
be attributed to the growth of individual organizations over the
intervening years.
16161616161616
“The biggest funding issue we face is sustainable funding. Too much of the
funding available is program-based (i.e., pilot projects or one time funding).
We need sustainable funding for long-term planning.” – Survey Participant
Sources of Revenue
Survey Question Whatarethesourcesof
fundingforyourorganization(checkallthat
apply)?
Sources CalgaryChamberofVoluntary
Organization’sEconomicClimateSurveyMay
2010(n=575).
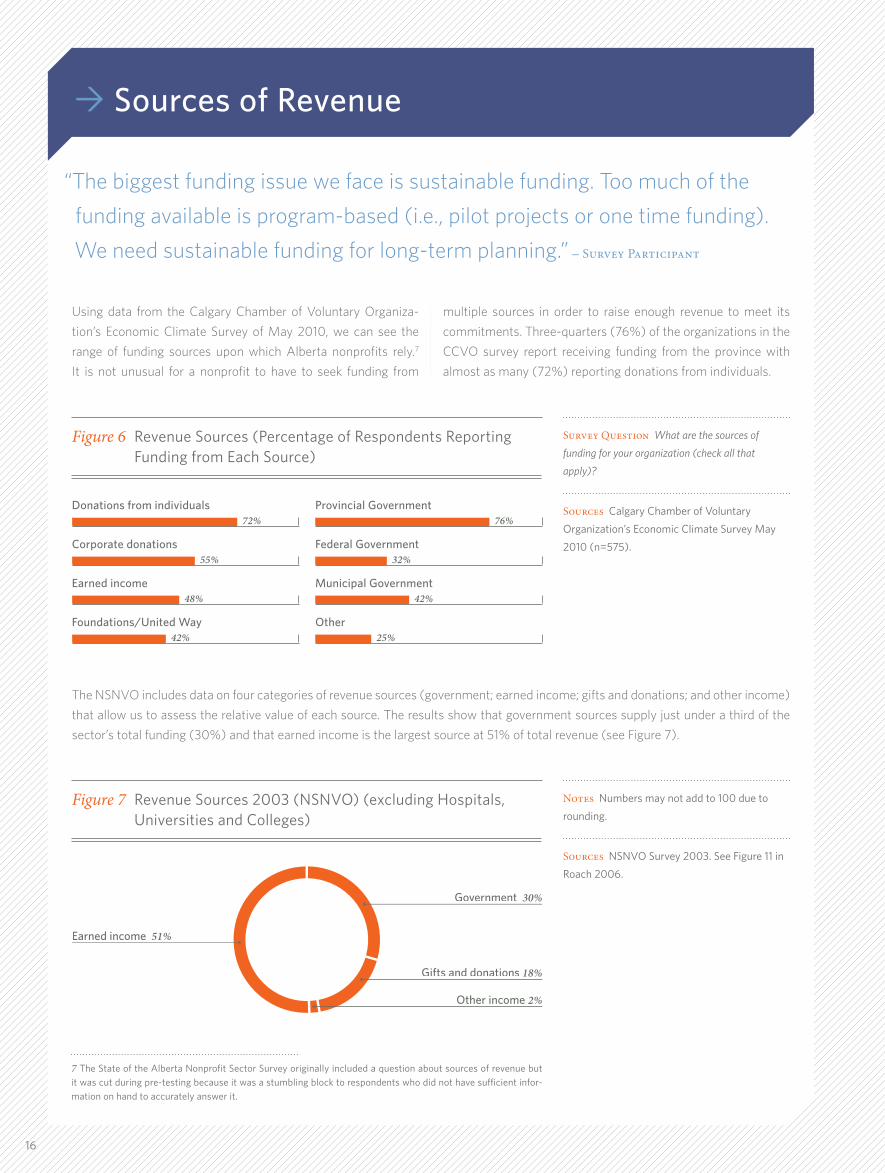
Figure 6 RevenueSources(PercentageofRespondentsReportingFundingfromEachSource)
Donations from individuals Provincial Government72% 76%
Corporate donations Federal Government55% 32%
Earned income Municipal Government48% 42%
Foundations/United Way Other42% 25%
The NSNVO includes data on four categories of revenue sources (government; earned income; gifts and donations; and other income)
that allow us to assess the relative value of each source. The results show that government sources supply just under a third of the
sector’s total funding (30%) and that earned income is the largest source at 51% of total revenue (see Figure 7).
7 TheStateoftheAlbertaNonprofitSectorSurveyoriginallyincludedaquestionaboutsourcesofrevenuebutitwascutduringpre-testingbecauseitwasastumblingblocktorespondentswhodidnothavesufficientinfor-mationonhandtoaccuratelyanswerit.
Using data from the Calgary Chamber of Voluntary Organiza-
tion’s Economic Climate Survey of May 2010, we can see the
range of funding sources upon which Alberta nonprofi ts rely.7
It is not unusual for a nonprofi t to have to seek funding from
multiple sources in order to raise enough revenue to meet its
commitments. Three-quarters (76%) of the organizations in the
CCVO survey report receiving funding from the province with
almost as many (72%) reporting donations from individuals.
Notes Numbersmaynotaddto100dueto
rounding.
Sources NSNVOSurvey2003.SeeFigure11in
Roach2006.
Figure 7 RevenueSources2003(NSNVO)(excludingHospitals,UniversitiesandColleges)
Earned income Earned income 51% 51% ••••
•••• Government Government 30%30%
•••• Gifts and donations Gifts and donations 18%18%
•••• Other income Other income 2%2%

17
8 SeeTable(notFigure)5inRoach2006.BecausetheNSNVOcapturedalargernumberofverysmallorgani-zations, it estimates that 58% of Alberta nonprofits have no paid staff. Conversely, the State of the AlbertaNonprofit Sector Survey sample includes 122 organizations (13%) with no paid staff. Hence, the State of theAlberta Nonprofit Sector Survey reflects the experiences of organizations with paid staff more so than theNSNVO.
“In our sector, we are unfortunately competing with government-delivered
services in that staff in a government-operated facility earn 30 – 50% more
than our frontline staff doing the same job.” – Survey Participant
Paid Staff
Notes Numbersmaynotaddto100dueto
rounding.
Survey Question Approximatelyhowmanypaid
employeesdoesyourorganizationhave(bothfull-
timeandpart-time)?
Sources StateoftheAlbertaNonprofitSector
Survey2010andNSNVO2003.SeeTable3.9in
Hall,etal.2005a.
Figure 8 NumberofPaidStaff
0 10 – 2413% 16%
54% 6%
1 – 4 25 – 9929% 14%
26% 4%
5 – 9 100+14% 14%
8% 2%
n PercentofthetotalStateoftheAlbertaNonprofitSectorSurveysample
n 2003NSNVO(Canada-wideresults)
Human Resources 3.2As with the private and government sectors, the most important
component of the nonprofit sector is the people involved. Paid staff
and, in the case of nonprofits, volunteers are the lifeblood of the
sector. Once again, we see that the sector is characterized by diver-
sity; in this case it is the variation in paid staff and volunteers. Some
Alberta nonprofits are run entirely by volunteers while others have
paid staff complements of over 500 people. All nonprofits harness
volunteers. Some have only a handful of volunteers sitting on their
board while others have hundreds of people pitching in to help them
do the good things that they do.
According to the NSNVO, 105,375 were paid employees of an
Alberta nonprofit in 2003 if hospitals, universities and colleges
are excluded.8 Looking at the organizations in the State of the
Alberta Nonprofit Sector Survey that have paid staff, we find that
33% have between one and four staff and 49% have less than 10
staff. While not a perfect reflection of the sector, the State of the
Alberta Nonprofit Sector Survey results reinforce the findings of
the NSNVO in that Alberta nonprofits tend to have less than 10
paid staff.

18
The survey shows that mass layoffs are not happening across the sector. Nonetheless, a red fl ag is raised by the fact that 42% of
organizations report that they have had trouble retaining paid employees in the last three years.9
“We are very concerned about staff retention, recruitment and succession
planning as funding decreases.” – Survey Participant
Staff Recruitment and Retention
Notes Numbersmaynotaddto100dueto
rounding.Changesbetweenthetwosurveys
cannotbeseenastrendsasthemethods
usedyieldedresultsthatareNOTdirectly
comparable.
Survey Question Comparedtothreeyearsago,
hasthenumberofemployeesthatwork30hours
ormoreperweekforyourorganizationincreased,
stayedaboutthesameordecreased?(question
askedonlyoforganizationsthatindicatedthey
hadpaidstaff).
Sources StateoftheAlbertaNonprofitSector
Survey2010andNSNVO2003.SeeFigure31
inRoach2006.
Figure 9 ChangeinStaffSize(comparedtothreeyearsearlier)
Increased 34%
24%
Stayed about the same 43%
65%
Decreased 14%
11%
Not applicable/not sure9%
—
n 2010StateoftheAlbertaNonprofitSectorSurvey
n 2003NSNVO
9 TheNSNVOfoundthat18%ofAlbertanonprofitshaddifficultyretainingpaidstaff(seeTable[notFigure]8inRoach2006).Evengiventhedifferencesinmethodology,wecannotaccountforwhytheresultsaresodifferent.
The number of paid staff is a stable or growing aspect of most
organizations. Survey respondents indicate that, compared to
three years ago, their number of employees has either stayed
the same (43%) or increased (34%). A small, but still notable,
percentage (14%) decreased their number of staff (5% said this
“did not apply” presumably because they only have part-time
staff while 4% said that they were not sure).
Notes Numbersmaynotaddto100due
torounding.
Survey Question Hasyourorganizationhad
troubleretainingpaidemployeesinthelastthree
years?(questionaskedonlyoforganizationsthat
indicatedtheyhadpaidstaff).
Sources StateoftheAlbertaNonprofitSector
Survey2010.
Figure 10 TroubleRetainingPaidStaff
No 55% ••••
•••• Yes Yes Yes 42%
•••• Don’t know/not sure Don’t know/not sure Don’t know/not sure Don’t know/not sure Don’t know/not sure 4%

1919191919
10 AccordingtotheHRCouncilfortheVoluntaryandNon-profitSector’sCanada-wideSurveysofEmployersandEmployees,66%ofAlbertanonprofitsreporteddifficultyrecruitingqualifiedpaidstaffin2007.SeeHRCouncilfortheVoluntaryandNon-profitSector2008,Figure11.
Notes Numbersmaynotaddto100due
torounding.
Survey Question Doyouexpectattracting
andretainingqualifiedstaffwillbecome…?and
Hasyourorganizationhadtroubleretainingpaid
employeesinthelastthreeyears?(questionsasked
onlyoforganizationsthatindicatedtheyhad
paidstaff).
Sources StateoftheAlbertaNonprofitSector
Survey2010.
Figure 11 DifficultyAttractingandRetainingStaff
Much more diffi cult in the next three years 21%
7%
Somewhat more diffi cult in the next three years 34%
25%
About the same as now over the next three years 35%
56%
Somewhat easier over the next three years 6%6%
Much easier over the next three years 1%1%
Don’t know/not sure 3%
6%
n Organizationsthathavehadtroubleretainingpaidemployeesinthelastthreeyears
n OrganizationsthathaveNOThadtroubleretainingpaidemployeesinthelastthreeyears
“The recruitment and retention of staff is very diffi cult, a position has been
vacant for almost six months. The lack of staff medical, dental, short-term,
and long-term benefi ts is also a factor.” – Survey Participant
Overall, organizations are somewhat pessimistic about their
ability to attract and retain qualifi ed staff in the years ahead.
Although 47% of the organizations indicate that they believe
this issue will be about as big of a challenge today as in the
future, 29% indicated it would be somewhat more diffi cult and
13% thought it would be much more diffi cult. Comparatively, only
6% thought it would be somewhat or much easier in the future.10
When we break these responses down by organizations that
report diffi culties retaining staff and those that do not, we fi nd that
35% of the organizations with current staff retention problems
predict that these will continue, 34% are worried that it will get
somewhat more diffi cult and 21% fear that it will get much more
diffi cult to attract and retain qualifi ed staff. Not being able to pay
enough was cited by many organizations as a reason why it is
diffi cult to attract staff with the appropriate skills and experience.
STAFF TURNOVER According to the HR Council for the
Voluntary and Non-profi t Sector’s Canada-wide Surveys of
Employers and Employees, the estimated employee turnover
rate for Alberta in 2007 was 21% (HR Council for the Volun-
tary and Non-profi t Sector 2008, Figure 16). The Council notes
that this is a conservative estimate because it does not include
dismissals (only voluntary resignations). Peter T. Boland and
Associates calculate a turnover rate for 2010 of 34% for the
organizations that participated in the Boland survey. This is
down from a whopping 42% in 2008. The lower number for
2010 likely refl ects the effects of the recession, but it is still quite
high and suggests a fair degree of disruption within the nonprofi t
sector workforce. (It should also be noted that there are meth-
odological differences between the HR Council estimate and the
Boland estimate that make it unwise to directly compare the
two results.)

20
Alberta nonprofits are proactive about providing their employees with
human resource development opportunities, with over three-quarters (77%)
reporting that they do this. The most common types of training available
to employees include on-the-job training and work-related courses,
seminars and workshops. These include both basic training (computer
skills) and mandated courses (food safety, first aid). Some organizations
are able to offer employees paid time off to take these courses, while other
organizations indicate that they accommodate professional development
by being flexible with scheduling.
Staff Development
11 AccordingtotheHRCouncilfortheVoluntaryandNon-profitSector’sCanada-wideSurveysofEmployersandEmployees,73%ofAlbertanonprofitshaveabudgetforstafftraininganddevelopment.SeeHRCouncilfortheVoluntaryandNon-profitSector2008,Figure21.
There is great diversity in the capacity of nonprofit organizations
to provide training opportunities and workplace benefits to their
employees. A minority of presumably smaller organizations
indicate that they cannot provide any training opportunities
or benefits to their employees. A similarly small minority lists
comparatively extensive packages that include annual profes-
sional development budgets, health and wellness funds,
birthdays off with pay, merit bonuses, flexible family/personal
days, scholarship programs, pensions and benefits.
Taken as a whole, respondents indicate that the majority of
nonprofit organizations in Alberta are able to offer at least some
training opportunities to their employees – particularly training
that encourages professional development and directly relates
to the position.11

2121212121
“I do not work [in this sector] for the money.” – Survey Participant
Staff Salaries
Notes The“othermanager”valueswere
calculatedastheweightedaverageoffour
positions:TopFinanceandAdministration
(CFO);DirectorofOperations;Department
Manager;TopFundDevelopmentExecutive.
Resultsarenotrepresentativeofallnonprofit
organizationsbuttheydoprovideasenseofthe
levelanddirectionofsalariesamongestablished
organizations.
Sources PeterT.BolandandAssociates,Survey
ofNotForProfitSectorSalariesandHuman
ResourcePractices,variousyears,usedwith
permission.
Not surprisingly, larger organizations (measured by annual operating budget) pay their CEOs and managers more than smaller orga-
nizations (see Figure 12). CEO salaries in the nonprofi t sector are lower than those typically paid in the private or government sector.
Between 2005 and 2010, the trend is generally up for the salaries of nonprofi t CEOs and managers.
Figure 12 AverageSalaryofNonprofitManagersbyAnnualOperatingBudget2005–2010(inThousandsofDollars)
Revenues of less than $3 million Revenues of $5 – $10 million
$175 $175
$150
$125
$150
$125
$100 $100
$75 $75
$50 $502005 2006 2007 2008 2009 2010 2005 2006 2007 2008 2009 2010
Revenues of $3 – $5 million Revenues of $10 million+
$175 $175
$150
$125
$150
$125
$100 $100
$75 $75
$50 $502005 2006 2007 2008 2009 2010 2005 2006 2007 2008 2009 2010
n CEOn Othermanagers

22222222222222
“We are proud of the volunteers who have supported the vision of our
organization.” – Survey Participant
Volunteer Resources
Notes Numbersmaynotaddto100dueto
rounding.
Survey Question Onaverage,approximately
howmanyhoursdideachboardmembercontribute
totheorganizationlastyear?
Sources StateoftheAlbertaNonprofitSector
Survey2010.
Figure 13 BoardMemberTimeCommitment(averageannualhoursperboardmember)
12 Seepage31inRoach2006.Thisdoesnotmeanthat2.5milliondifferentAlbertansservedasvolunteersasmanypeoplevolunteerformorethanoneorganization.AccordingtotheCanadaSurveyofGiving,VolunteeringandParticipating,thereare1,445,000individualvolunteersinAlbertain2007.
One of many valuable characteristics that nonprofi t organiza-
tions possess is volunteer labour. According to the NSNVO, the
Alberta nonprofi t sector engaged 2.5 million volunteers in 2003
who in turn contributed 448.7 million hours of their time.12
Virtually all nonprofi ts have some sort of board or council or
executive that is staffed by volunteers. About half (52%) of the
organizations in the State of the Alberta Nonprofi t Sector Survey
have boards of between 5 and 9 people and 30% have boards
of between 10 and 14 people. The average annual number of
hours of volunteer time per board member varies greatly across
organizations. Some 15% of organizations report that their board
members contribute over 100 hours each per year, 33% report a
time commitment of between 40 and 99 hours, and 47% report
that their board members contribute between 10 and 39 hours.
Excluding board members, respondents to the State of the Alberta
Nonprofi t Sector Survey report a wide range of volunteer comple-
ments. A small proportion (5%) have no volunteers other than
board members, 30% report between 1 and 19 volunteers, 37%
report between 20 and 99, 19% report between 100 – 499, and
9% report having over 500 volunteers. Here again we see the
variation that characterizes the sector as well as the immense
volunteer army that the sector is able to mobilize.
9 hours or less 9 hours or less 5% 5% ••••
10 – 39 hours 10 – 39 hours 47% 47% ••••
•••• 40 – 99 hours 40 – 99 hours 33%33%
•••• 100+ hours 100+ hours 15% 15%

23
Notes Numbersmaynotaddto100dueto
rounding.
Survey Question Excludingboardmembers,
approximatelyhowmanypeoplevolunteeredfor
yourorganizationoverthepastyear?
Sources StateoftheAlbertaNonprofit
SectorSurvey2010.TheNSNVOusedslightly
differentcategories,buttheresultsareroughly
thesameandillustrateasimilarpatternof
volunteersupportacrossorganizations:11%of
AlbertaparticipantsintheNSNVOreported
novolunteersotherthanboardmembers,70%
reportedbetween1and99,and19%reported
over100.SeeFigure21inRoach2006.
Notes Numbersmaynotaddto100dueto
rounding.
Survey Question Onaverageandexcluding
boardmembers,approximatelyhowmanyhours
dideachvolunteercontributetotheorganization
lastyear?
Sources StateoftheAlbertaNonprofitSector
Survey2010.
Figure 14 NumberofVolunteers
Figure 15 VolunteerTimeCommitment(averageannualhourspervolunteer)
“The volunteer pool of people with values that contribute to community is
diminishing.” – Survey Participant
VOLUNTEER RATE According to the Canada Survey of Giving, Volunteering and Participating, the volunteer rate for the popula-
tion age 15 and over in Alberta was 52% in 2007 (up from 48% in 2004). The average number of hours donated in 2007 was 172,
down from 175 in 2004. See Charts 2.9 and 2.10 in Hall et al. 2009.
“It is a very tough business. Staff burnout is very high. Board members are also
harder to fi nd and have less time. It’s not a pretty picture” – Survey Participant
Volunteers contribute anywhere from one hour of their time to
more than 100 hours over the course of a year. A number of orga-
nizations (10%) report volunteers who contribute 100 hours or
more to their cause; this translates into 2.5 work weeks of time or
more (based on a 40-hour work week). Almost a quarter (22%)
report time commitments of between 10 and 19 hours and 29%
report commitments of between 20 and 99 hours.
0 0 5% 5% ••••
1 – 19 1 – 19 30% 30% ••••
20 – 99 20 – 99 37% 37% ••••
•••• 100 – 499 100 – 499 19%19%
•••• 500+ 500+ 9%9%
9 hours or less 9 hours or less 26% 26% 26% 26% ••••
10 – 19 hours 10 – 19 hours 22% 22% ••••
•••• 20 – 49 hours 20 – 49 hours 20 – 49 hours 20 – 49 hours 29%29%
•••• 50 – 99 hours 50 – 99 hours 14%14%
•••• 100+ hours 100+ hours 10% 10%

24
Notes Numbersmaynotaddto100dueto
rounding.Changesbetweenthetwosurveys
cannotbeseenastrendsasthemethods
usedyieldedresultsthatareNOTdirectly
comparable.
Survey Question Comparedtothreeyears
ago,hasthenumberofvolunteersservingyour
organizationincreased,stayedaboutthesameor
decreased?
Sources StateoftheAlbertaNonprofitSector
Survey2010andNSNVO2003.SeeFigure24in
Roach2006.
The news is relatively good in terms of the direction in which
the number of volunteers is going, with 77% of respondents
reporting that the number of volunteers available to their orga-
nization has either stayed the same or increased compared to
three years ago. Nonetheless, given that 19% indicate that their
number of volunteers has decreased, a fifth of respondents have
less volunteer support today than three years ago. The results of
the NSNVO show the same trend with 30% of Alberta organi-
zations reporting an increase in their number of volunteers and
21% reporting a decrease.
Figure 16 DirectionofVolunteerSupport(numberofvolunteerscomparedtothreeyearsprior)
Increased 32%
30%
Stayed about the same 45%
49%
Decreased 19%
21%
Don’t know/not sure 4%
—
n 2010StateoftheAlbertaNonprofitSectorSurvey
n 2003NSNVO
25
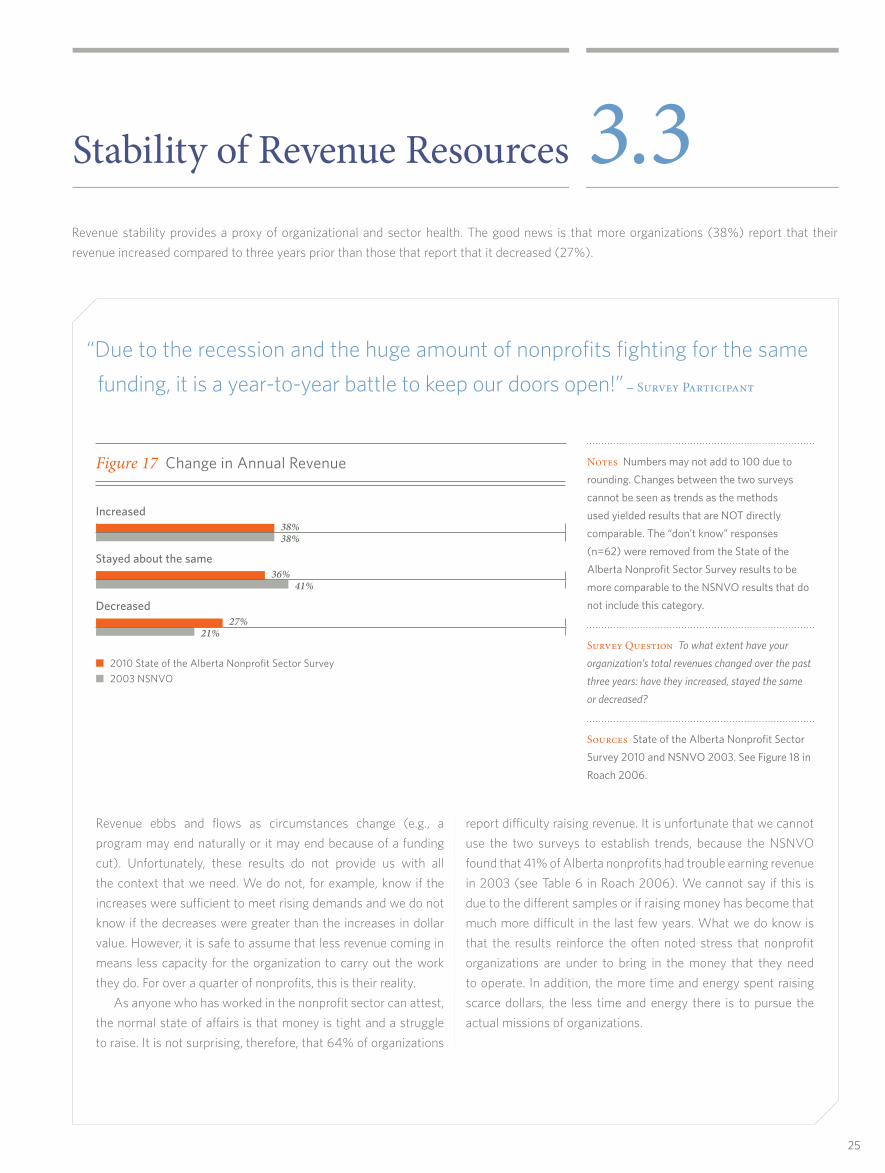
Revenue stability provides a proxy of organizational and sector health. The good news is that more organizations (38%) report that their
revenue increased compared to three years prior than those that report that it decreased (27%).
Notes Numbersmaynotaddto100dueto
rounding.Changesbetweenthetwosurveys
cannotbeseenastrendsasthemethods
usedyieldedresultsthatareNOTdirectly
comparable.The“don’tknow”responses
(n=62)wereremovedfromtheStateofthe
AlbertaNonprofitSectorSurveyresultstobe
morecomparabletotheNSNVOresultsthatdo
notincludethiscategory.
Survey Question Towhatextenthaveyour
organization’stotalrevenueschangedoverthepast
threeyears:havetheyincreased,stayedthesame
ordecreased?
Sources StateoftheAlbertaNonprofitSector
Survey2010andNSNVO2003.SeeFigure18in
Roach2006.
Stability of Revenue Resources 3.3
“Due to the recession and the huge amount of nonprofits fighting for the same
funding, it is a year-to-year battle to keep our doors open!” – Survey Participant
Revenue ebbs and flows as circumstances change (e.g., a
program may end naturally or it may end because of a funding
cut). Unfortunately, these results do not provide us with all
the context that we need. We do not, for example, know if the
increases were sufficient to meet rising demands and we do not
know if the decreases were greater than the increases in dollar
value. However, it is safe to assume that less revenue coming in
means less capacity for the organization to carry out the work
they do. For over a quarter of nonprofits, this is their reality.
As anyone who has worked in the nonprofit sector can attest,
the normal state of affairs is that money is tight and a struggle
to raise. It is not surprising, therefore, that 64% of organizations
report difficulty raising revenue. It is unfortunate that we cannot
use the two surveys to establish trends, because the NSNVO
found that 41% of Alberta nonprofits had trouble earning revenue
in 2003 (see Table 6 in Roach 2006). We cannot say if this is
due to the different samples or if raising money has become that
much more difficult in the last few years. What we do know is
that the results reinforce the often noted stress that nonprofit
organizations are under to bring in the money that they need
to operate. In addition, the more time and energy spent raising
scarce dollars, the less time and energy there is to pursue the
actual missions of organizations.
Figure 17 ChangeinAnnualRevenue
Increased 38%38%
Stayed about the same 36%
41%
Decreased 27%
21%
n 2010StateoftheAlbertaNonprofitSectorSurvey
n 2003NSNVO

26
13 TheCalgaryChamberofVoluntaryOrganization’sMay2010surveyofAlbertanonprofitsfoundthatalmost70% of organizations were experiencing increased demand for programs and services, over half saw theiroperatingcostsincrease,whileonly25%reportedarevenueincrease.
Notes Numbersmaynotaddto100dueto
rounding.
Survey Question Hasyourorganizationhad
difficultyearningrevenuesfromanysourcesinthe
pastthreeyears?
Sources StateoftheAlbertaNonprofitSector
Survey2010.
Figure 18 DifficultyRaisingRevenue
Notes Numbersmaynotaddto100dueto
rounding.
Survey Question Hasthedemandforyour
organization’sservicesincreasedinthelastthree
years?
Sources StateoftheAlbertaNonprofitSector
Survey2010.
Figure 19 IsDemandforServicesRising?
INDIVIDUAL DONATIONS According to the Canada
Survey of Giving, Volunteering and Participating, 85% of
Albertans age 15 or older report making at least one donation
of money (excluding putting change into a coin collection box
located beside cash registers) to a nonprofi t in the 12 months
before the survey (the donation rate). This was up from 79% in
2004. The average annual donation in Alberta was the highest in
the country at $596 in 2007, up from $500 in 2004. See Charts
1.15 and 1.16 in Hall et al. 2009.
According to the NSNVO, donations from individuals added
up to 17% of total nonprofi t revenue in 2003 (see Figure 11 in
Roach 2006).
Of the respondents to the State of the Alberta Nonprofi t
Sector Survey who received funding from individual donations,
21% say this funding increased since the prior year and 35% say
it decreased. Of those who say it decreased, 45% see it as a
moderate problem and 27% see it as a serious problem.
“Our concern is an increase in demand for services without an increase in
funding. Our volunteer board does a lot of work because we cannot afford to
hire regular paid staff.” – Survey Participant
One indication of the fi nancial stress organizations are facing
is the rising demand for nonprofi t services. Revenue increased
for 38% of organizations, but 77% report that demand for their
services increased. How much of the rise in demand is due to the
recession and its lingering effects is unclear, but the gap created
by revenue falling or staying the same for 63% of organizations
while demand has increased for 77% is clearly a major concern.13
Yes 64% ••••
•••• No No No 28%
•••• Don’t know/not sure Don’t know/not sure Don’t know/not sure 8%
Yes 77% ••••
•••• No No No 16%
•••• Don’t know/not sure Don’t know/not sure Don’t know/not sure 7%

2727272727
“When you add all of the small funding decreases together, you fi nd an
organization that is struggling fi nancially. Cash fl ow has become more of an
issue for us, as the bulk of our expenses are paid over a short period
of time.” – Survey Participant
“Two continuing trends are causing increasing concern and stress in our
ability to utilize available resources to deliver our mission: 1) the progressive
and continued increase in accountability demands from stakeholders
(e.g., fi scal audit, outcome measures, budgeting and reporting detail)
without additional grants or other resources to fulfi ll the demands; and 2)
the tendency of funders and grantors to prefer short-term grants for ‘new
and innovative’ approaches over sustained grants for proven effective
(and often longer-term) practices works against achievement of desired
outcomes that they claim to want.” – Survey Participant
One of the reasons it is diffi cult to raise money lies in the fact that
there are a lot of nonprofi ts seeking the same scarce dollars from
governments, casinos, corporations, donors and clients. When
asked if competition with other organizations to obtain funding
is a problem, 21% say it is a small problem, 36% a moderate
problem and 15% a serious problem.
A third of organizations report that they have experienced a
decrease in government funding compared to 13% that report
an increase and the situation is roughly the same for corporate
funding. Overall, there is no category of funding in which the
number reporting an increase is greater than the number
reporting a decrease. Figure 20 highlights the volatility in nonprofi t
revenue streams from year-to-year.

28
Notes Numbersmaynotaddto100due
torounding.
Survey Question Comparedtothe
previousfiscalorcalendaryear,hasyour
organizationexperiencedachangeinoverall
fundingfrom______?
Sources StateoftheAlbertaNonprofitSector
Survey2010.
Figure 20 RevenueChangesbySource
GovernmentIncreased 13%
Stayedthesame 29%
Decreased 33%
Notapplicable 21%
Don’tknow/unsure 5%
CorporationsIncreased 13%
Stayedthesame 32%
Decreased 30%
Notapplicable 21%
Don’tknow/unsure 5%
Granting foundations/United WaysIncreased 8%
Stayedthesame 30%
Decreased 22%
Notapplicable 34%
Don’tknow/unsure 6%
Individual donationsIncreased 17%
Stayedthesame 35%
Decreased 28%
Notapplicable 13%
Don’tknow/unsure 6%
Sale of goods and services (other than to government)Increased 10%
Stayedthesame 20%
Decreased 12%
Notapplicable 53%
Don’tknow/unsure 5%
Membership feesIncreased 9%
Stayedthesame 28%
Decreased 10%
Notapplicable 50%
Don’tknow/unsure 3%
Charitable gamingIncreased 5%
Stayedthesame 17%
Decreased 26%
Notapplicable 47%
Don’tknow/unsure 6%
Endowments/investmentsIncreased 3%
Stayedthesame 18%
Decreased 17%
Notapplicable 52%
Don’tknow/unsure 11%

292929
4.1 ClimbingOutoftheDark
4.2CurrentStateoftheSector
Conclusion 4

30
Climbing Out of the Dark 4.1Alberta’s nonprofit organizations are a fundamental component of
the province’s social fabric and economy. They are part of the bedrock
of our communities, they contribute to a healthy democracy and civil
society, and they are a key piece of the puzzle that is our long-term
economic success. Alberta’s nonprofit organizations deliver a range
of services to their communities and to the people of Alberta and
beyond. They also contribute significantly to the provincial economy,
employ thousands and harness the volunteer power of millions.
Despite all this, there is little awareness of the nonprofit “sector” in
the daily discourse of average Albertans. We know a lot, for example,
about the oil patch, about the education sector, about how farmers
are doing and how many people are texting each other, but we know
comparatively little about the web of organizations that sustain so
much of our social exchange.
Part of the reason for this is that we tend to take nonprofits, and
the work they do, for granted. Another reason is that we have relied
for years on anecdotal evidence and one-off studies rather than invest
as a society in a consistent, methodologically rigorous, and regular
examination of the sector. Building on the information found in the
2003 NSNVO and the 2010 State of the Alberta Nonprofit Sector
Survey, we have the capacity to begin to accurately tell the story of
Alberta’s nonprofit sector and the challenges it faces. The next step
is to continue assessing the sector in order to better understand how
its challenges and opportunities change over time.
The value of this information to policy-makers, funders, nonprofit
organizations and the general public points to a role for the provincial
government in ensuring that consistent and meaningful data on the
nonprofit sector is collected on a regular basis. Collecting more basic
information through annual reporting processes and supporting
future surveys of the sector are two ways that the province can
greatly improve our understanding of nonprofits.

31
Current State of the Sector 4.2
The findings outlined in this report show that the Alberta nonprofit
sector is performing well but also has some challenges to overcome.
Because of the complexity of the sector and the imperfect state of
the information we have about it, it is difficult to present a compre-
hensive diagnosis of the sector’s health. On the bright side, there
are lots of organizations, doing lots of things, raising lots of money,
employing lots of people and, generally, making life in Alberta better.
On the dark side, the results raise a number of long-standing red
flags: revenue is tight for many organizations with many reporting
that service demands are rising while revenues are either staying
put or decreasing. This is a bad sign and relying on the “get it done”
perseverance that characterizes the sector is not a good long-term
strategy.
We also see a sector that faces a number of human resources
challenges. We know anecdotally that many nonprofit sector workers
are there because they want to make a difference and want to help
others in some way. Relying on this as a recruitment and retention
strategy, however, only goes so far. Children, mortgages, and all
sorts of other bills (not to mention the burnout that can occur when
working in an area like social services) often mean that nonprofit staff
move on for higher pay or more security. As skilled labour shortages
intensify in Canada, the ability of the nonprofit sector to attract quali-
fied staff will become an even bigger issue.
Overall, the thousands upon thousands of points of light in the
nonprofit sector continue to shine, with some organizations doing
better, but too many reporting tough slogging. More information is
critical, in part because it will make it harder to take the sector for
granted and in part because we need tailor-made solutions that reflect
the diversity of the sector rather than one-size-fits-all approaches.
But information is only part of the way forward; we also need to make
sure we fully appreciate the work of the sector as donors, volunteers
and voters.
“The system is broken. The old models upon which the sector was built, both
the benevolent benefactor (15/16th century thinking) and the business model
(nonprofit is an oxymoron to the business model) no longer work. Funders,
organizations and individuals need to adopt a new model of cooperation
dedicated to creating great communities.” – Survey Participant

32
CalgaryChamberofVoluntaryOrganizations.2010. Weathering the Storm: Diverse Experiences in Alberta’s Voluntary Sector.CCVO Economic Climate Survey May 2010.
CalgaryChamberofVoluntaryOrganizations.2009.Stretched to the Limit: Economic Impact Survey of Alberta’s Nonprofits and Charities.
Hall,Michael,etal.2009.Caring Canadians, Involved Canadians: Highlights from the 2007 Canada Survey of Giving, Volunteering and Participating. Statistics Canada. Catalogue no. 71-542-XIE.
Hall,Michael,etal.2005a.Cornerstones of Community: Highlights of the National Survey of Nonprofit and Voluntary Organizations, 2003 revised. Statistics Canada. Catalogue no. 61-533-XPE.
Hall,Michael,etal.2005b.The Canadian Nonprofit and Voluntary Sector in Comparative Perspective. Imagine Canada.
Hall,Michael,etal.2003.The Capacity to Serve: A Qualitative Study of the Challenges Facing Canada’s Nonprofit and Voluntary Organizations. Canadian Centre for Philanthropy (Imagine Canada).
Hamdad,Malika,SophieJoyalandCatherineVanRompaey.2004.Satellite Account of Nonprofit Institutions and Volunteering. Statistics Canada. Catalogue no. 13-015-XIE.
HRCouncilfortheVoluntaryandNon-profitSector.2008.Toward a Labour Force Strategy for Canada’s Voluntary and Non-profit Sector, Report #2.
Lasby,DavidandCathyBarr.2010.Imagine Canada’s Sector Monitor. Vol. 1, No.2. Imagine Canada.
Lasby,DavidandCathyBarr.2010.Imagine Canada’s Sector Monitor. Vol. 1, No.1. Imagine Canada.
McFarlane,SusanandRobertRoach1999.Great Expectations: The Ideal Characteristics of Non-Profits. Canada West Foundation.
McMullen,KathrynandGrantSchellenberg.2002.Mapping the Non-Profit Sector. Canadian Policy Research Networks.
MinnesotaCouncilofNonprofits.2007.Minnesota Nonprofit Economy Report: A Statewide and Regional Analysis.
PeterTBolandandAssociatesInc.2008.Boland Survey of Not For Profit Sector Salaries and Human Resource Practices. Reviewed with permission.
Roach,Robert.2006.The Nonprofit and Voluntary Sector in Alberta: Regional Highlights of the National Survey of Nonprofit and Voluntary Organizations. Imagine Canada.
Sharpe,David.1994.A Portrait of Canada’s Charities: The Size, Scope and Financing of Registered Charities. Canadian Centre for Philanthropy (Imagine Canada).
StatisticsCanada.2009.Satellite Account of Nonprofit Institutions and Volunteering. Catalogue no. 13-015-X.
Stevens,Harvey.2010.The Voluntary and Non-Profit Health and Social Services Sectors in Manitoba: A Profile of Its Composition, Workplace Challenges and Resources for Meeting Those Challenges. Manitoba Federation of Non-Profit Organizations Inc.
Vodarek,Lindsey,DavidLasbyandBrynnClarke.2010.Giving and Volunteering in Alberta: Findings from the Canada Survey of Giving, Volunteering and Participating. Imagine Canada.
Wilding,Karl,etal.2006.The UK Voluntary Sector Almanac 2006: The State of the Sector. National Council for Voluntary Organisations.
References

33
14 Itisimportanttorememberthat,whilethegoldstandardofnationalsurveysoftheCanadiannonprofitsector,theNSNVOmethodologicalisalsosubjecttocritiqueanditsresultsdonotalwaysmeshwithothersourcesofstatisticalinformation. Inotherwords,all surveysof thesectorsuffer frommethodological limitationsand, in this regard, theAlbertaNonprofitSectorSurveyisnotunique.
Appendix 1 MethodologicalLessons
Sampling Frame
The first step we took was to determine if there was an existing source of data from which we could pull some, or all, of the information needed to create a state of the sector report. Once we confirmed that this Holy Grail was not available (more on this below), we knew that we had to collect the data ourselves through a survey of nonprofit organizations. The best method in terms of accuracy and for revealing trends would have been to replicate the method (though not neces-sarily all of the questions) used by the National Survey of Nonprofit and Voluntary Organizations (NSNVO) that was conducted in 2003.
The NSNVO was able to use the resources of Statistics Canada to create a master list (sample frame) of Alberta nonprofits that included telephone numbers and information on the primary activity of the organizations based on the International Classification of Non-profit Organizations (ICNPO). A random and stratified sample was drawn from this list. The statistical representativeness of the survey respondents (n=1,639) meant that the results could be extrapolated to the entire nonprofit sector in Alberta (see Hall et al. 2005a for a detailed account of the NSNVO’s methodology).14
We considered replicating the NSNVO, but we ran into a number of barriers that prevented this. We did not have the resources to build a master list of nonprofits from the same sources used by Statistics Canada for the NSNVO. We were, however, able to obtain a list of all nonprofits registered with the provincial government. The list was graciously provided by Service Alberta.
With the list of registered nonprofits in hand, we set out to see if we could use it to develop a stratified random sample as in the NSNVO. The first problem we encountered was that the list does not include information on type of organization or annual revenue, so it was not possible to stratify the sample using ICNPO categories or by revenue size. The second problem we found was that the list does not include telephone numbers or email addresses. Mailing addresses are avail-able, but we were told that many of these are for lawyers representing the organizations and that contacting these lawyers can lead to a fee being charged to the nonprofit organization for services rendered. In either case, a mail-out survey was rejected because of the very low response rates associated with this method.
We tested the option of tracking down phone numbers and email addresses for a random sample of organizations on the list. We found that this is a very slow process that did not guarantee accurate results, especially for small organizations. In a test, it took one staff member five days to get the contact information for 250 randomly selected organizations from the list of registered Alberta nonprofits. Using the internet to search for contact information, the return rate (the number of organizations we found information for vs. the number of organizations we attempted to get information for) was roughly 60% when looking for either phone or email information; when looking for just email information, the return rate was about 37%; when looking for just phone information the return rate was roughly 48%.
If we had continued with this method, it would have somewhat improved the randomness of the sample, but we would still have been unable to stratify by type or revenue. It was therefore decided to abandon the effort to replicate the NSNVO’s methodology. If a much larger budget was available, it may have been possible to work with Statistics Canada and overcome the above barriers, but one of the goals of the project was to see if there was a less expensive option than spending the large sums needed to conduct the NSNVO.
Because we did not have the resources to conduct a telephone survey, we opted to gather email addresses for a large number of nonprofits in anticipation of conducting an online survey. We were assisted in this by the Calgary Chamber of Voluntary Organizations (CCVO) as it was able to send an invitation to participate in the survey to an existing list of about 1,600 nonprofits. We supplemented this by compiling a list of an additional 2,052 organizations. Because the CCVO list contained relatively few small organizations, sports and recreation organizations, religious organizations, and rural organiza-tions, we focused our efforts on ensuring that these organizations were represented in the supplementary list.
It is important to note that when acquiring information from exist-ing lists or from the internet, researchers should take care to double check that all organizations on the list are nonprofits. You must be particularly cautious when looking for contact information for arts and culture groups, specifically theatre and dance groups, because while some are nonprofits, others are not. We were able to determine this by cross referencing the organizations on our list with the master list of registered nonprofits.
It is very difficult to get contact information for certain groups of nonprofits, particularly small, grassroots organizations (e.g., parent groups, homeowner associations, non-mainstream churches and organizations in small communities). When attempting to acquire information for groups that tend to be underrepresented (e.g., reli-gious groups, sports organizations, arts and culture groups, and environmental organizations), it is usually easiest to get lists of local organizations from a parent group (e.g., a list of all local swim clubs and their contacts from the Swim Alberta website).
Overall, data mining for contact information is very time consum-ing. Unless using an already established list with accurate contact information, it is important to leave a considerable amount of time to build a database. In the end, it took about a month to compile the database of organizations to which the survey was sent.

34
The Web Survey
We selected Survey Monkey (www.surveymonkey.com) to construct the online survey because of its ease of use and previous experience with it. Every organization on the two lists received an initial invitation to complete the survey by clicking a link that would take them to the survey on the Survey Monkey website. All organizations also received reminder notices. More passive forms of advertising the survey were also conducted such as posting the information on the Canada West Foundation website and asking key contacts to spread the word about the survey.
Despite these efforts, the final list of 954 participating organizations over represents larger, more established organizations (particularly social service agencies) and under represents sports and recreation and religious organizations. One challenge with conducting surveys of the nonprofit sector is that it is, despite the lack of comprehensive data, a sector that is asked to complete a lot surveys and participate in things like roundtables. These requests tend to go the same list of “usual suspects” (i.e., established, highly visible and easy-to-contact organizations). This can lead to confusion as organizations that receive multiple requests may think they have already completed a survey and even fatigue as executive directors and other staff decide that they don’t have time to complete yet another survey or go to another meeting on the sector’s future. Luckily, nonprofit leaders understand the critical importance of better information about the sector and, in turn, the value of taking part in research exercises. For this, we thank the organizations that participated in the State of the Alberta Nonprofit Sector Survey of 2010.
Questionnaire Design
When it came to designing the survey instrument, the NSNVO once again loomed large in our thinking. The NSNVO questionnaire was created by a consortium of organizations working over a two-year period and informed by a qualitative research phase that explored the key issues facing the sector in terms of its capacity to act. It therefore made sense to take advantage of this work instead of “reinventing the wheel.” Early on, it was also hoped that we could (as noted above) replicate the NSNVO’s method and use its results as a baseline against which to compare the new results. This made repeating ques-tions from the NSNVO even more attractive (even though our goal of replicating the NSNVO’s method was not achieved).
Because it was a telephone survey conducted by trained staff who could press the interview subjects to be more specific and guide them through difficult questions, the NSNVO questionnaire could be more detailed and complex than what we felt was reasonable for a web survey. A chief aim was to keep the time needed to complete the online survey to a minimum and the questions relatively simple in order to encourage completion. We estimated that the survey would take about 15 minutes to complete – the maximum length we felt a survey of this sort should be.
One advantage of the online method (at least in theory) is that respondents can look up information such as annual revenue and number of staff that would be difficult to do over the phone. It is unclear whether this advantage was realized. In fact, we discovered that a question that asked respondents to breakdown their organiza-tion’s revenue into percentages by source was sufficiently complex that it was deterring completion of the survey. (The question was dropped early in the field work for this reason.)
Unfortunately, we had little control over who completed the survey or over how much effort they put into it (skipped questions were common). We were hoping that the survey would be completed by executive directors with intimate knowledge of their organizations, but this may not have always been the case or even the norm.
Given the above, committing the resources needed to do the inter-views by phone might yield a better overall result in terms of specifically asking for executive directors, pressing respondents to answer all of the questions, guiding them through difficult ones, and ensuring that quotas are met (e.g., sufficient numbers of small organizations, rural organizations or types of organizations). For example, a question on the survey asked about the primary area of organizational activity using the standard ICNPO categories. The question is often met by skep-ticism on the part of respondents who argue that their organization does not fit into any one of the tidy ICNPO peg holes. In a telephone interview, the surveyor can stress the need to slot an organization’s activities into a standard category and to focus on the primary area of activity in ways that are difficult to do in an online survey. As a result, 83 organizations responded by saying “other” and another 139 skipped the question altogether. Of course, telephone interviews introduce their own problems (e.g., the need to answer then and there rather than having the option to stop and look things up).
In addition to the above challenges, many of the factors that deter-mine the “state of the sector” (i.e., how it is doing rather than just information about its size and structure) are qualitative in nature. Asking good questions that probe qualitative issues is a challenge regardless of the method used. For this pilot test, we opted to err on the side of simplicity in order to ensure reliable results and a higher response rate. Future investigators may, however, want to revisit this and commit more time and effort to the qualitative side of the equa-tion. One option here would be to supplement the survey data with focus group feedback or case studies.
Perhaps the most important factor for future investigators to con-sider is the establishment of a baseline against which changes in the sector can be tracked over time. Time series data is crucial to getting a solid sense of the “state of the sector” as change in variables such as revenue, revenue sources, number of staff, staff salaries, number of volunteers, and demand for services is a key measure of the sector’s overall health. Because we could not replicate the NSNVO and use its findings as a baseline, we attempted to capture change in the sector by asking respondents about the circumstances of organizations three years prior to the survey, but a better option is to repeat the survey (or at least a subset of key questions) every year or every second year.
In terms of questions that could have been added, a workable question on sources of revenue, more information about staff salaries and turnover, more detail regarding full-time versus part-time staff, additional feedback on the nature of what volunteers do and greater emphasis on how exactly demand is changing are all worthy of serious consideration. If more data on characteristics such as revenue, number of staff and number of volunteers and volunteer hours was collected at the time of registration (including more detailed contact information), future surveys could devote more questions to these sorts of issues and to more qualitative measures of the state of the sector.
35
Data Quality and Margin of Error
Because the sample is not representative according to the science of statistical sampling and analysis, it is moot to talk about the sample’s margin of error. Although we feel confident that the survey captured an important subset of nonprofits and, in turn, the characteristics they exhibit and the circumstances that they currently face, we can-not say with any confidence that the results match the characteristics and circumstances of the general population of Alberta nonprofits. In addition, we know that there are inaccuracies inherent in the data due to skipped questions and impossible-to-track response errors – both related to the online survey method.
Nonetheless, the results come from a broad group of organizations that “represent” strong trends in the sector that have been identi-fied over and over again such as the greater pace of demand growth compared to revenue growth and the ongoing challenge of attracting and retaining qualified staff. The precise percentages and some of the details are likely wrong, but the general parameters as well as the direction of change are likely accurate. The diversity of the sec-tor, however, means that the general picture formed by these results does not apply to all nonprofits in Alberta and that some nuances may have been missed. The results apply best to the large number of organizations that are well-established (registered as charities with paid staff and in existence for an extended period) and active in, most particularly, the social services sector.
It is important to explain why the pilot report does not provide analysis of how variables interact. For example, we do not examine how revenue size, type of organization or geographic location affects changes in volunteers or difficulty retaining staff. The reason for this lies in the non-representative nature of the sample. If the sample as a whole is not truly representative, these distortions are multiplied when two variables are cross-tabulated. To say, for example, that small organizations are more likely to have trouble retaining staff when you have only a limited number of small organizations that may or may not represent the actual population of small organiza-tions intensifies the appearance of accuracy while actually reducing it. For this reason, and as noted in the analysis, the results should be read with caution and the safest interpretations are for the sample as whole rather than for smaller slices of it.
Summary
A basic state of the sector report along the lines of the one prepared each year for the state of Minnesota would be relatively easy if the information needed for a basic overview was collected at the time of annual provincial registration or in some other direct way. This information would also make it much easier to construct a sampling frame and to contact organizations via email and phone. Contact information and basic data that can be used to stratify the population of Alberta nonprofits are the keys to better survey results.
Once these challenges have been met, several years of repeated surveying is necessary to establish clear trends lines that can be supplemented by qualitative “temperature checks” and other follow-up research on the sector.
A web survey is a viable and low cost option but would be a much better method if the basic information noted above was available. If more resources can be obtained, testing the pros and cons of a telephone survey would be very worthwhile.
Another key factor is creating awareness among nonprofit senior staff that participation in surveys and other research is vitally important to understanding the good work done by the sector and informing decision-making on the part of funders and government. Even the best survey methodology will fail to yield good results if nonprofits do not see the value of participating and do so in large
numbers and with gusto.

36
Appendix 2 MajorSecondarySources
APortraitofCanada’sCharities:TheSize,ScopeandFinancingofRegisteredCharities.Thereportwaspublishedin1994,buttheCanadaCustomsandRevenuedatadatebackto1991.
Conducted by the Canadian Centre for Philanthropy (now Imagine Canada), the report examines basic information about registered charities such as revenues and expenditures, and type of organization.
LIMITATIONS Very old information; only covers charities; source of information (the T3010 form submitted by charities to Canada Customs and Revenue) is unreliable due to significant reporting errors.
BolandSurveyofNotforProfitSectorSalariesandHumanResourcePractices.Ongoing.
www.ptbaconsulting.com
Peter T. Boland & Associates Inc. has been conducting research on nonprofit sector salaries and human resources practices for over a decade. The reports are available to subscribers and provide information on, for example, salaries by position, turnover and vacancy rates, salary adjustments, vacation and sick leave, and benefits.
LIMITATIONS Focus is on salaries and human resources; non-random sample.
CalgaryChamberofVoluntaryOrganizationsEconomicClimateSurveyofAlberta’sNonprofitsandCharities.EconomicImpactSurvey:October2009(thirdinaseries).EconomicClimateSurveyMay2010.
www.calgarycvo.org
Surveys of the financial health of Alberta nonprofits.
LIMITATIONS Non-random sample; focus on financial issues.
CanadaSurveyofGiving,VolunteeringandParticipating(CSGVP)(formerlytheNationalSurveyofGiving,VolunteeringandParticipating).Mostrecentis2007.Alsoranin2004,2000,and1997.
www.givingandvolunteering.ca/files/giving/en/csgvp_highlights_2007.pdf
Conducted by Statistics Canada, the survey is designed to collect national data to fill a void of information about individual contributory behaviours including volunteering, charitable giving and participation.
LIMITATIONS Focused on individual donations and volunteering.
CanadianPolicyResearchNetworks(CPRN)ResearchSeriesonHumanResourcesintheNonprofitSector.Datadrawnfromthe1999WorkplaceandEmployeeSurvey(WES)conductedbyStatisticsCanada–WEShasbeeninactivesince2006.
www.cprn.org
An attempt by the now defunct CPRN to provide baseline data about the size and nature of Canada’s nonprofit sector and the human resources it employs.
LIMITATIONS Information is dated; provincial information is limited; sample excludes nonprofits without paid staff and religious organizations.

37
GivingandVolunteeringinAlberta:FindingsfromtheCanadaSurveyofGiving,VolunteeringandParticipating.2007data.
Reports also available for health organizations, sports and recreation organizations, religious organizations, and social service organizations.
www.givingandvolunteering.ca/reports/2007
Derived from findings from the Canada Survey of Giving, Volunteering, and Participating (CSGVP), these reports from Imagine Canada provide insight into the Albertans who support sports and recreation organizations. They detail how much people contribute, how they make donations, how they came to volunteer, what they do as volunteers, other causes they support, their motivations for making contributions, and the barriers they face.
LIMITATIONS As with the CSGVP, focused on individual donations and volunteering.
ImagineCanada’sSectorMonitorSurveyReports.FirstsurveyconductedbetweenNovember24,2009andJanuary11,2010;futuresurveysareplanned.
www.imaginecanada.ca
The Sector Monitor survey program was launched to regularly monitor the state of charities across the country and their ability to deliver their missions. Their reports provide information on the impacts of the economic climate on charities, levels of stress, human resources trends, organizations’ responses to the economic climate, and overall confidence for the future.
LIMITATIONS Only includes registered charities; non-random sample; limited number of respondents from Alberta.
NationalSurveyofNonprofitandVoluntaryOrganizations.2003data.
www.statcan.gc.ca/pub/61-533-s/61-533-s2005001-eng.htm
ALBERTA SUMMARY: http://www.imaginecanada.ca/files/www/en/nsnvo/f_alberta_sector_report.pdf
Conducted in 2003, the survey provides the only statistically sound and comprehensive profile of nonprofit organizations in Canada. The findings are based on the responses of approximately 13,000 incorporated nonprofit organizations and registered charities across the country.
LIMITATIONS Information is getting old. Methodology is solid but difficult to replicate with a limited budget.
SatelliteAccountofNon-profitInstitutionsandVolunteering2007.Latestreporthas2007estimates.
www.statcan.gc.ca/bsolc/olc-cel/olc-cel?catno=13-015-XIE&lang=eng
Collecting information from 1997 to 2007, this report from Statistics Canada provides information about nonprofit organizations in Canada. It explores the contribution and role of the nonprofit sector in macro-economic terms.
LIMITATIONS Information is for Canada as a whole; no provincial break-outs; focused on economic factors only.
TowardaLabourForceStrategyforCanada’sVoluntary&Non-profitSector.DatacollectiontookplacebetweenDecember2007andJanuary2008byIpsosReid.
http://hrcouncil.ca/about/documents/HRC_LFS_Report3.pdf
A three part series released by the HR Council for the Voluntary & Nonprofit Sector contains the key findings from Canada-wide surveys of employers and employees. These reports provide information on characteristics of organizations, recruitment and retention practices and challenges, demographic characteristics of the people who work in the sector, and employee plans and expectations for the future.
LIMITATIONS Expensive methodology to replicate; focus on human resources only.

38
Appendix 3 PercentageofOrganizationsbyPrimaryActivityArea
Sports and recreation (includes providing opportunities for sports and recreation, tourism, as well as service clubs such as the Rotary, Kinsmen or Lions)
6%26%
Religion (this includes religious congregations, organizations supporting religious congregations, but not religiously inspired groups that focus on some other type of activity such as the Mustard Seed in Calgary
8%19%
Grantmaking, fundraising or volunteer promotion (this includes making grants to other organizations, fundraising on behalf of other organizations, and promoting and supporting volunteering for other organizations)
4%11%
Arts and culture (includes media and communications, the visual and performing arts, historic and literary societies, museums, zoos and aquariums)
12%10%
Social services (children’s services, youth services, family services, services for the disabled, services for the elderly, self-help, disaster or emergency services, temporary shelters, refugee support, income support, material assistance to the needy – this includes day care but not health services, nursing homes, service clubs or community development or job training)
38%9%
Education and research (includes providing formal educational programs and conducting medical and scientific research, but not providing day care or health and wellness education)
5%8%
Development and housing (includes economic and community development, housing, employment training, vocational counseling and operating com-munity or neighbourhood organizations)
3%5%
Business, professional associations, unions (includes regulating or promoting the interests of specific professions, branches of businesses or groups of employees)
1%3%
Health (includes providing health care and public health and wellness education but not medical research)
6%2%
Environment (includes protection and beautification of the natural environment, animal protection and veterinary services)
3%2%
Law, advocacy and politics (includes advocacy on behalf of a specific cause or group, legal services, crime prevention, victim services, offender rehabilita-tion, politics)
3%2%
International (includes delivering services outside of Canada and fostering international relations)
1%0.4%
Other*
9%2%
n 2010StateoftheAlbertaNonprofitSectorSurveyResults
n 2003AlbertaNSNVOResults

39
Appendix 4 US“StateoftheSector”Reports
A handful of US states produce reports which provide a snap-shot of the nonprofit sector, although most of the information is on economic and labour force characteristics.
Information for most American state nonprofit sector reports is taken from state revenue agency databases.
In all of the reports, information is broken down at the state level.
Many of the reports also further break down key information at the county/sub-state level.
All of the reports include information on employees and wages.
Most of the reports include information on assets and expendi-tures, and about half report revenue information.
Most of the information is categorized by activity area (sports and recreation, social services, etc.).
There is little done overall in the way of multi-year or multi-sector comparisons.
Minnesota Nonprofit Economy Report (2009)
Key Tables:
Number of Nonprofit Employers and Employment Locations in Minnesota
Number of Nonprofit Employees in Minnesota as Percentage of State’s Total Workforce
Average Weekly Wages in Minnesota by Sector (nonprofit, government, private)
Average Weekly Wages for Nonprofit Employees by Industry
Revenue Sources for Small Nonprofits (assets under $1 million)
Revenue Sources for Medium-Sized Nonprofits (assets between $1 and $10 million)
Revenue Sources for Large Nonprofits (assets over $10 million)
Minnesota Nonprofit Assets, Revenues and Expenses by Selected Activity Areas (most current fiscal year)
Expenditures by Nonprofit Organizations located in Minnesota
For Each Region:
Number of Nonprofit Employment Locations in the Region
Number of Nonprofit Employees in the Twin Cities and Nonprofit Percentage of All Employees in the Region
Median Hourly Wages for Full-Time Employees in the Region
Average Weekly Wages in the Region by Sector
Assets, Revenues and Expenses by Selected Activity Areas for Nonprofits in the Region
Assets, Revenues and Expenses by Size of Organization for Nonprofits in the Region
Wisconsin Nonprofit Sector Report (2009)
Key Tables:
Charitable Nonprofits in Montana, Expenditures and Assets
Reporting Charitable Nonprofits in Wisconsin by Field
The Wisconsin Nonprofit Sector
Number, Expenditures, and Assets of Reporting Charitable Nonprofits in Wisconsin by Field
Reporting Charitable Nonprofits in Wisconsin by Expenditure Level
Wisconsin Foundations by Foundation Type
Wisconsin Foundations by Country
Nonprofits by the Numbers: Maryland Association Nonprofit Organizations (2009)
Part I: Statewide Data
Types of Nonprofits
Nonprofits by Size of Annual Income
Nonprofits by Service Delivery Area
Maryland Nonprofit Employees and Payroll
Counties with the largest % growth in nonprofit employment from 1998 to 2008
Counties with the largest % of persons employed by the non-profit sector 2008
Nonprofit Employment by County
Part II: County by County Analysis
Nonprofits by County
For Each Country:
Types of Nonprofits
Nonprofits by Size of Annual Income
A Sample of Nonprofits in Your County
Nonprofits by Service Delivery Area
Nonprofit Employees and Payroll

40
Partners in Prosperity: The Maine Nonprofit Sector Impact (2008)
Key Tables:
Percent of Reporting Nonprofits
Percent of Total Expenditures by Activity Group
Revenues in Maine Nonprofits with Budgets < $5
Revenues in Maine Nonprofits with Budgets $5m or More
Overview of Maine Foundations
Top 10 Maine Foundations by Total Giving
Average Charitable Contribution of Itemizers
Percent of Income Contributed by Itemizers
The Montana Nonprofit Sector (2007)
Key Tables:
Charitable Nonprofits in Montana, Expenditures and Assets
Sources of Revenue for Reporting Charitable Nonprofits in Montana
Reporting Charitable Nonprofits in Montana by Field
Number, Expenditures, Assets, and Revenues of Reporting Charitable Nonprofits in Montana by Field
Reporting Charitable Nonprofits in Montana by Country
Reporting Charitable Nonprofits in Montana by Expenditure Level
Nonprofit Wages by Country
Total Wages by Industry
Average Charitable Contribution of Itemizers
Percent of Income Contributed by Itemizers
Overview of Montana Foundations
Top 10 Montana Foundation by Assets
Top 10 Montana Foundations by Total Giving
Appendix 5 AbouttheCCVO
The Calgary Chamber of Voluntary Organizations gives voice to the nonprofit and voluntary sector. CCVO’s insight and leadership generate results for the sector to be able to thrive and contribute to strong, healthy communities. CCVO promotes and strengthens the nonprofit and voluntary sector by developing and sharing resources and knowledge, building connections, leading collaborative work, and giving voice to critical issues affecting the sector.
For more information visit www.calgarycvo.org.
Appendix 6 AbouttheCanadaWestFoundation
The Canada West Foundation is the only think tank dedicated to being the objective, nonpartisan voice for issues of vital concern to western Canadians. Through our research and commentary, we contribute to better government decisions and a stronger Canadian economy.
The West is in. And the Canada West Foundation helped put it there. Over the past 40 years, our research and commentary has improved government policy and decision making. Today, the West is on the national agenda and is at the forefront of the most important debates that will shape our country.
We give the people of British Columbia, Alberta, Saskatchewan and Manitoba a voice. A voice for their dreams, interests and concerns. As westerners, we understand the people and the places of the West. We know our history and how it influences our future. Whether it is the economy, energy, environment, education, healthcare, taxes, social services, urban issues, provincial-federal relations or any other policy area of importance to the West, we have researched it, com-mented on it, stimulated debate about it and recommended practical options for improving the policy response. Democracy lives.
Our credentials are impressive. We have the policy and economic experts you need. Our Board of Directors represent the who’s who of the four western provinces. Our list of projects is long. We’re just like the West. Absolutely essential. Absolutely part of Canada’s success.
More information can be found at www.cwf.ca.


www.calgarycvo.org