this report may not u= published without … sre... · *r. j. tuttle nb13 compliance with the...
TRANSCRIPT

•
•
Rockwell International SUPPORTING DOCUMEN TEnergy Systems Grou p
GO NO . S/A NO . PAGE 1 OF TOTAL PAGES REV LTR/CHG NO NUMBE R
07704 42000 N704T199005 7
PROGRAM TITL E
Decontamination and Di sposition of Facilities Progra m
DOCUMENT TITL E
Final Radiological Inspection of the Below-Grade Areas in the SRE Prior to Releas e
for Unrestricted Us e
DOCUMENT TYPE KEY NOUNS
Radiological Inspection SRE, Environmental Inspectio n
ORIGINAL ISSUE DATE REL. DATE APPROVALS DATE
T ttl eJRPREPARED BY /DATE DEPT MAILADDR
u..C . C . Conners- - ;
John C . Blake 755-520 KB45 J . H . Walter j a l , - -' . ''" "D . C . Empey
aR&D PROGRAM? YES NO j r✓_ : .
rIF YES. ENTER TPA NO- -DISTRIBUTION ABSTRACT
NAME MAI LADDR This document defines and discusses the activitie s
which will be performed at the SRE to demonstrat e
*R. J . Tuttle NB13 compliance with the established cleanness cri -
*W. D . Kittinger NBO2 teria . It includes the monitoring technique s
*A. P . Lichtman KB45 which will be employed, the data to be collected ,
*R. Aguilera KB45 and the analysis activities to be performed . Con -
*T. D . Hunnicutt (3) TO11 trols over the back filling operation are als o
*W. McCurnin T020 discussed .*J . Marzec T14 3*J . M. Harris T05 5*J . H . Walter 1006*B . Ureda NBO2*J . Carroll NBO2*C . C. Conners NBO2*R. K . Owen T143*D. Phillips T143*F. Seward 1143
RESERVED FOR PROPRIETARY/LEGAL NOTICES
THIS REPORT MAY NOT U= PUBLISHED WITHOUT THEAPPROVAL OF THE PATENT BRANCH, DO E
This re ort was reared as an acco unt of work sponsored by the UnitD P PStates Government . Ncither the U . S. Government, nor any cf its emplcy
,r any of its coat, .crs, subcc ..t:actors, or their employees , makes a
755-C .51/sjd/fehliability or resp 'r, arranty, express or ir. . plied, or assumes any legal la ► Ity or resp
complete ,css or usefulness of any informatifor the accurac yS :iilit ,y
3E' COMPLETE DOCUMENT paratus, product or process disciu~ed, or represents that its use wo t
NO ASTERISK , TITLE PAGE/SUMMARY nut infringe privately owned rights .OF CHANGE PAGE ONL Y
I
$y
Id'
FORM 734-C REV . 12-79

•
•
Rockwell International .
Energy Systems Group
CONTENTS
NO N704TI990057PAGE 2
Page
1 .0 Introduction . . . . . . . . . . . . . . . . . . . . . . . . . . . . . . . . . . . . . . . . . . . . . . . . . . . . . . . . . 3
2 .0 Scope of Activities . . . . . . . . . . . . . . . . . . . . . . . . . . . . . . . . . . . . . . . . . . . . . . . . . . 5
3 .0 Acceptance Criteria . . . . . . . . . . . . . . . . . . . . . . . . . . . . . . . . . . . . . . . . . . . . . . . . . . 6
4 .0 Examination Methods . . . . . . . . . . . . . . . . . . . . . . . . . . . . . . . . . . . . . . . . . . . . . . . . . . 7
4 .1 Surface Dose Rate . . . . . . . . . . . . . . . . . . . . . . . . . . . . . . . . . . . . . . . . . . . . . . . 7
4 .2 Removable Beta . . . . . . . . . . . . . . . . . . . . . . . . . . . . . . . . . . . . . . . . . . . . . . . . . . 7
4 .3 Alpha Emitters . . . . . . . . . . . . . . . . . . . . . . . . . . . . . . . . . . . . . . . . . . . . . . . . . . 8
4 .4 Removable Alpha . . . . . . . . . . . . . . . . . . . . . . . . . . . . . . . . . . . . . . . . . . . . . . . . . 8
4 .5 Soil Contamination Limits . . . . . . . . . . . . . . . . . . . . . . . . . . . . . . . . . . . . . . . 9
4 .6 Special Examinations . . . . . . . . . . . . . . . . . . . . . . . . . . . . . . . . . . . . . . . . . . . . 10
4 .6 .1 Gamma Emitters . . . . . . . . . . . . . . . . . . . . . . . . . . . . . . . . . . . . . . . . . . . 10
4 .6 .2 Migration Control Activities . . . . . . . . . . . . . . . . . . . . . . . . . . . . . 1 1
4 .6 .2 .1 Water . . . . . . . . . . . . . . . . . . . . . . . . . . . . . . . . . . . . . . . . . . . 1 1
4 .6 .2 .2 Air . . . . . . . . . . . . . . . . . . . . . . . . . . . . . . . . . . . . . . . . . . . . . 11
5 .0 Calibration and Qualification . . . . . . . . . . . . . . . . . . . . . . . . . . . . . . . . . . . . . . . . 13
5 .1 Calibration . . . . . . . . . . . . . . . . . . . . . . . . . . . . . . . . . . . . . . . . . . . . . . . . . . . . . 13
5 .2 Qualification . . . . . . . . . . . . . . . . . . . . . . . . . . . . . . . . . . . . . . . . . . . . . . . . . . . 1 4
6 .0 Grid Surveys . . . . . . . . . . . . . . . . . . . . . . . . . . . . . . . . . . . . . . . . . . . . . . . . . . . . . . . . . 15
7 .0 Sample Analysis . . . . . . . . . . . . . . . . . . . . . . . . . . . . . . . . . . . . . . . . . . . . . . . . . . . . . . 17
8 .0 Sample Plan Design . . . . . . . . . . . . . . . . . . . . . . . . . . . . . . . . . . . . . . . . . . . . . . . . . . . 18
9 .0 Backfilling . . . . . . . . . . . . . . . . . . . . . . . . . . . . . . . . . . . . . . . . . . . . . . . . . . . . . . . . . . 19
9 .1 Material Sites . . . . . . . . . . . . . . . . . . . . . . . . . . . . . . . . . . . . . . . . . . . . . . . . . . 19
9 .2 Soil Samples . . . . . . . . . . . . . . . . . . . . . . . . . . . . . . . . . . . . . . . . . . . . . . . . . . . . 20
9 .3 Water Samples . . . . . . . . . . . . . . . . . . . . . . . . . . . . . . . . . . . . . . . . . . . . . . . . . . . 20
9 .4 Air Samples . . . . . . . . . . . . . . . . . . . . . . . . . . . . . . . . . . . . . . . . . . . . . . . . . . . . . 20
Appendices . . . . . . . . . . . . . . . . . . . . . . . . . . . . . . . . . . . . . . . . . . . . . . . . . . . . . . . . . . . . . . . . 2 1
TABLES
•1 . Contamination Limits for Release to Unrestricted Use . . . . . . . . . . . . . . . . . 6
FORM 719-P REV . 2.80
Rockwell International NO N704TI99005 7
Energy Systems Group
1 .0 INTRODUCTION•PAGE . 3
The Energy Systems Group of Rockwell International has been in the process
of decommissioning the Sodium Reactor Experiment (SRE) Building 143 at the Santa
Susana Field Laboratory . With this effort nearing completion, it is necessary
that a comprehensive radiological survey be conducted of the areas to be back-
filled within and adjacent to this building . This is an important step in the
release of the building for unrestricted use . It is necessary to provide reason-
able assurance that residual radioactivity is below acceptable limits . These
limits have been established and are presented in the cleanness criteria contained
in Table 1 (see Section 3 .0) .
Quality Assurance has developed this document to describe the activities
which will be performed at the SRE to provide an independent assessment of effec-
tiveness of the decontamination operations which have been conducted . This
effectiveness will be established by extensive meter surveys, smear sample
examination, and a material sampling program conducted within the SRE for the
purpose of defining the existing levels of the natural and induced radioactivity .
These will be compared to the criteria established as necessary to release the
site for unrestricted use .
Three specific approaches using radiation measuring instruments will be
utilized . First, a complete sweep of the area will be made to identify any areas
of "high" activity that are detectable with field survey instruments . Second,
very thorough surveys of areas which the records show as having had high levels
of contamination and were cleaned up will be performed concentrating on the
boundaries with assumed clean areas . Third, a 1-meter square (1-m2) grid will be
developed on a drawing of the SRE and samples of material will be taken from the
SRE surfaces for a preestablished number of both random and selected location
samples . Specific analytical data on the average and maximum radiation levels
will be determined and statistically evaluated . This data will be compared to
the criteria to establish whether the backfilling can commence .
FORM 719-P REV .'2-80
Rockwell International NO N704T199005 7Energy SystemsGroup PAGE 4
•
•
Three methods for obtaining material samples of soil and rock will be
employed . Surface soil samples will be obtained in areas where there is suffi-
cient loose material to make this approach more feasible . In hard-surfaced
areas (sandstone or rock), material will be chipped away . Second, surface
smears will be obtained from existing original concrete surfaces . Third, ground
water samples will be obtained from points in and/or around the SRE for analysis .
Each of these samples will be carefully identified and of sufficient quantity to
provide for analysis and material archiving .
The material samples obtained for Quality Assurance will be submitted to
Health, Safety and Radiation Services (HS&RS) for determination of the level of
radioactivity and to an independent outside laboratory for analysis and determi-
nation of the radionuclides present . The results of both analysis activities
will be accumulated into a final report of the survey prepared by Quality Assur-
ance and Operations covering all activities at the SRE .
Comprehensive records of all activities supporting this plan will be main-
tained to provide a clear presentation of the survey and results . The data
developed from the various examinations will be analyzed and a final report on
the activities prepared .
• 755-C.51/sjd '
FORM 719•P REV. 2-80

Rockwell International No N704TI990057
Energy Systems Group PAGE . 5
2 .0 SCOPE OF ACTIVITIES
This program has been developed to evaluate that portion of the SRE building
and immediately adjacent areas which have been excavated during the decontami-
nation operations . It is specifically limited to those below-grade areas which
are to be backfilled. In some areas, it was necessary to excavate extensively to
remove various items of equipment and piping . These areas have already been
backfilled for safety purposes . This plan will address the existing conditions
in the SRE .
Since no releases of alpha-emitting radionuclides occurred at the SRE, the
meter surveys and measurements made at the SRE will be specifically to detect
beta-gamma and gamma radiation . Alpha measurements will be obtained from the
material samples obtained and submitted for analysis .
•
755-C .51/sj d
FORM 719-P REV . 2.80
Rockwell International No N704TI99005 7
Energy Systems Group PAGE . 6
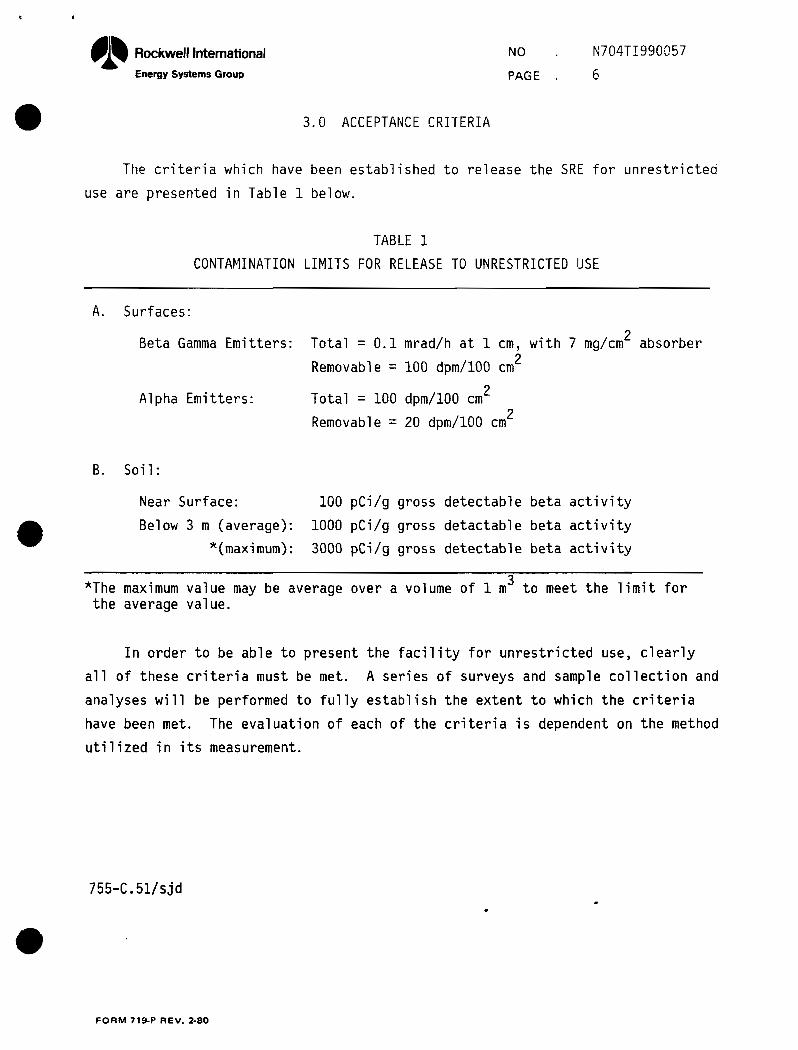
• 3 .0 ACCEPTANCE CRITERI A
The criteria which have been established to release the SRE for unrestrictea
use are presented in Table 1 below .
TABLE 1
CONTAMINATION LIMITS FOR RELEASE TO UNRESTRICTED US E
•
•
A . Surfaces :
Beta Gamma Emitters : Total = 0 . 1 mrad/h at 1 cm, with 7 mg/cm2 absorber
Removable = 100 dpm/100 cm2
Alpha Emitters : Total = 100 dpm/ 100 cm2
Removable = 20 dpm/100 cm2
B . Soil :
Near Surface : 100 pCi/g gross detectable beta activity
Below 3 m (average ) : 1000 pCi/g gross detactable beta activity
*(maximum) : 3000 pCi/g gross detectable beta activity
The maximum value may be average over a volume of 1 m3 to meet the limit forthe average value .
In order to be able to present the facility for unrestricted use, clearly
all of these criteria must be met. A series of surveys and sample collection and
analyses will be performed to fully establish the extent to which the criteria
have been met . The evaluation of each of the criteria is dependent on the method
utilized in its measurement .
755-C .51/sjd
FORM 719-P REV . 2-80

Rockwell International NO N70411990057
Energy Systems Group PAGE 7
• 4 .0 EXAMINATION METHODS
In this section the methods to be employed in the evaluation of each of the
acceptance criteria will be discussed . At the outset, it is important to recog-
nize that the evaluation is dependent on two major factors : appropriate, cali-
brated equipment, and the knowledge and skill of the person doing the survey .
4 .1 SURFACE DOSE RAT E
The first of the criteria from Table 1 is for beta-gamma emitters . Total
radiation dose will be measured with a CP-7 (ion chamber) with a 7 mg/cm2 window
at 1 cm from the chamber front . The CP-7 is a large, high-sensitivity ion chamber
for measuring true dose rate in air . Other measurements of beta activity are
generally considered to be more sensitive contamination indicators and, therefore,
the dose rate survey will be conducted in the manner of discovery . This means
that the entire area will be surveyed in an attempt to locate and identify areas
of increased radioactivity . As these are located, they will be evaluated agains t
• the acceptance criteria of 0 .1 mrad/h . Any area which exceeds this limit will be
identified for additional cleanup .
4 .2 REMOVABLE BET A
The second of the acceptance criteria is the removable beta activity, which
will be measured by a smear and reported in units of dpm/100 cm2 with a limit of
100 dpm/100 cm2 . A 2 .4-cm diameter Whatman No . 540 filter paper disc will be
passed over a representative portion of a section of a surface using moderate
pressure with the tip of the thumb . (The judgement of "moderate pressure" is a
matter of experience .) Normally, the area of the portion smeared should approxi-
mate 100 cm2 . Since the pressure-bearing portion of the filter paper disc is
approximateley 2 cm wide, the length of the smear should be about 50 cm (18 in .)
long. This should be achieved by a Z or S pattern with legs that are each about
6 in . long . The original SRE concrete surfaces that are to be buried are to be
sampled by this method . The smear paper will be protected against loss of
activity prior to counting by use of a "smear book" composed of file cards . To
prevent transfer of contamination, these books will not be reused . Approximatel y
• 10% of the 1-m2 containing original concrete will be sampled with this technique .
FORM 719.P REV. 2.80

Rockwell International NO N704TI990057
Energy Systems Group PAGE 8
•
•
4 .3 ALPHA EMITTER S
Alpha emitters will be measured by the scanning scaler technique using an
alpha detector, averaged over 1 m2, and using the most sensitive range practical
reported in dpm/100 cm2 . The acceptance criteria is 100 dpm/100 cm2 maximum .
The scanning scaler method for alpha measurements uses the integrating
function of a scaler in providing a direct measurement of the average surface
activity . The measurement of surface radioactivity will use portable scalers
(Ludlum Model 2200 or the Technical Associates Model FS-8) and alpha-sensitive
detectors (Ludlum Model 43-5 alpha scintillator or the Technical Associates
PAS-9 alpha scintillator) . The detector probe will be slowly traversed across
the surface to provide complete coverage during the counting time period set on
the scaler . This time period will be 10 min for either of the alpha scintillator
detectors . The average gross and net countrates will be calculated by dividing
the gross count by the counting time and subtracting the background countrate .
The net countrate will be converted to surface activity (dpm/100 cm2) by correc-
ting for detection efficiency and the area ratio (relative to 100 cm2) . The
resulting value is the surface activity averaged over 1 square meter (the area
scanned during the counting time period) . If the area is scanned uniformly, this
result is essentially independent of scan speed, so if the scan of the area is
completed before completion of the count time, the probe should be moved in a
random pattern over the area for the remainder of the counting time .
This method is not generally effective with soils, and so it will be limited
to specific preselected areas which will be designated by Quality Assurance . The
purpose will be to obtain a sufficient number of 1-m squares identified, docu-
mented, and measured so that positive conclusions can be made about the alpha
activity at the SRE . Approximately 1% of the 1-m2 grid will be sampled with
this technique .
4.4 REMOVABLE ALPHA
The removable alpha will be determined from the beta smears and is limited
to 20 dpm/100 cm2 . The only additional precaution to be observed is to avoid th e
. excessive loading of the filter paper with surface dirt since this could cause
incorrectly low measurements of the alpha activity .
FORM 719-P REV . 2.80

Rockwell International
Energy Systems Group
NO N704TI99005 7
PAGE . g
• The filter paper disc will be placed on a counting planchet flat in order to
avoid source geometry errors . The activ ty for alpha and beta radioactivity will
be recorded on the data sheet with any other related information .
4 .5 SOIL CONTAMINATION LIMIT S
The acceptance criteria for soils is based solely on beta activity and is
established as 100 pCi/g at the surface, and 1000 pCi/g average at 3 m (10 ft)
below the surface with a maximum of 3000 pCi/g . This criteria will be evaluated
by three methods : instrument surveys, surface measurement, and laboratory analy-
sis of soil samples .
Surveys for beta activity will be conducted by use of a Ludlum Model 12 or
Technical Associates PUG-1 countrate meter and a thin-window, pancake G-M detector
(Ludlum 44-9, Eberline HP-210, or Technical Associates P-11 or P-11A) . The
background countrate will be determined locally by placing a clean hand over the
face of the probe or by placing the probe face against a known clean surface,
preferrably with a low effective atomic number, such as a plastic slab, and
estimating the mean meter indication, using the slow time response . During the
survey, the probe may be in contact with the surface or up to 1/2 in . away . The
survey traverse rate should not exceed 2 in ./sec . The surveys will be conducted
throughout the entire area in a manner of discovery, attempting to locate and
identify areas of increased radioactivity . Surveys will be conducted with the
audio on, the fast time response selected, and using the most sensitive range
practical .
The surface soil samples will be obtained using a clean shovel to remove the
soil and place it in a 2-quart waterpoof cardboard container . The shovel must be
wiped clean after each sample is obtained . Each soil sample should be approxi-
mately 1 kg and should be free of rocks and debris . The identification for each
sample will be clearly marked on both the cardboard container and lid. The lid
will then be taped on in a manner that will not obscure the labeling nor result
in damaging it when the tape and lid are removed .
FORM 719-P REV. 2.80

Rockwell International NO N70411990057
Energy SystemsGroup PAGE 10
• Subsurface soil samples may also be required by Quality Assurance, and these
will come from auger holes drilled in the surface . Core drilling will be used to
obtain these samples, and care must be exercised to avoid cross contamination .
In addition, it will be necessary to drill through a plastic sheet spread on the
surface in the event radioactive material is picked up during the drilling . The
material being removed from the hole will be continuously monitored for beta and
gamma radiation as it is being withdrawn .
Samples of rock and concrete will also be obtained, identified, and sub-
mitted for analysis . These samples will be chipped from their surfaces and
placed in the 2-quart waterproof cardboard containers, identified, and taped
closed as discussed above .
4 .6 SPECIAL EXAMINATIONS
The preceding section discussed the methods and activities necessary to
demonstrate compliance to the established acceptance criteria . This section will
describe certain additional tests and activities which will be performed to
provide further confidence that the decontamination program has been effective
and comprehensive .
4 .6 .1 Gamma Emitter s
A comprehensive survey of the area will be conducted to locate and define
any areas of increased gamma activity . While it should be recognized that there
was a gamma component accounted for in the "surface dose rate," a specific
evaluation of the gamma activity in the area has not been performed . A Ludlum
Model 12S Micro R meter (which uses a 1-in . x 1-in . NaI (T2) scintillator cali-
brated for Cs-137 gamma rays) will be used for the surveys of gamma radiation .
The survey will be conducted with the audio on, and the fast (F) time response
and most sensitive range selected. In performing the survey, the operator should
move at a slow pace while monitoring the gamma radiation reading from approxi-
mately 1 m above the ground (waist level for most people) . Areas of increased
activity will be identified and defined and records maintained of the measurements
•
FORM 719-P REV. 2-80
Rockwell International NO • N704TI99005 7
Energy Systems Group PAGE . 1 1
• obtained . These will be cross correlated with the results of the examinations
performed to demonstrate compliance to the acceptance criteria . No limit has
been established for gamma radiation .
4 .6 .2 Migration Control Activitie s
A clear demonstration that there is no migration of residual radioactive
contamination from the SRE to the surrounding environment is also necessary to
assure a continuing acceptable condition . Two transport methods are available
for the dispersion of the radioactive materials into the environment : water and
air . Each of these will require monitoring to assure that the decommissioning
task has been properly completed.
4 .6 .2 .1 Wate r
Water samples will be obtained from the water sampling locations in and
around the SRE on a weekly basis . Several wells exist in the area for this
purpose, and there are low points in the SRE into which water seeps from time t o
time . If these prove to be insufficient, additional sampling locations within
the SRE may be drilled for the purpose of water sampling .
Samples will be obtained in clean jars and properly identified with date and
location . These will be submitted for a determination of the level of radio-
activity which exists in each sample . Charts of the individual measurement s
and a ten measurement running average will be prepared for each location to
identify significant changes in the levels identified .
4 .6 .2 .2 Air Monitoring
The second transport method of radioactivity is through air movement, and
the extent of contamination transfer from this method will be monitored . Air
samples will be taken by passing air through filter paper by use of air sampling
pumps (Gast 0211) with Type AE glass fiber filters, or high-volume air samplers
(Hi-Q Filter Products CF-12B with 4-in, fiberglass Type E filters) . The sampler
used, its flow rate, and the sampling time will be noted on the data sheet . The
•FORM 719.P REV. 2-80

Rockwell International NOEnergy Systems Group PAGE
N704TI990057
1 2
filter paper will be placed in an envelope with the serial number marked on the
envelope . These air samples are generally ready for counting as received, how-
ever, the high-volume air samplers use a 4-in .-diameter filter paper from which
a 1-in .-diameter sample must be cut for counting . In this case, only 1/16 of
the surface gets counted, and the results must be adjusted accordingly . The
airborne sample information will be reported and this data will be plotted o n
a chart with a ten measurement running average to identify any unusual conditions .
The air monitoring system will be operational during the shifts when soil is
being disturbed in the SRE . A suitable representative location for the instrument
will be identified, and comprehensive records of its operation and the resulting
data will be maintained .
4 .6 .3 Alpha Emitter s
Approximately five additional soil samples will be taken for the specific
purpose of providing material for analysis for plutonium . These samples will
consist of at least 2 quarts of soil and each will be well mixed and split into
an archive sample and a sample to be sent to an outside laboratory for analysis .
No limit has been established for plutonium .
755-C .51/sjd/jbv
FORM 719-P REV . 2-80

Rockwell International NO N704TI99005 7
Energy Systems Group PAGE 13
• 5.0 CALIBRATION AND QUALIFICATIO N
5 .1 CALIBRATIO N
•
Maintenance and calibration of all battery-powered (field instrument) systems
will be performed with 13-week service periods, and laboratory instruments (ac-
powered) will be serviced and calibrated within 6-month service periods by QA
Instrumentation and Technical Support at ESG/De Soto (or more frequently if
required by the manufacturer) . Prior to use of an instrument, the calibration
label shall be checked to assure that the instrument is in current calibration .
No instrument shall be used for a documented measurement or for radiation safety
purposes if the calibration has expired .
Instrument calibration shall determine the correct operating parameters and
will indicate both the background countrate and the efficiency factor. The
efficiency factor is defined as :
E = C A B (dpm/cpm )
where A is the total source activity rate (dpm) for the selected radiation
corrected for backscatter, C is the gross countrate (cpm) with the source in
place, and B is the background countrate (cpm) with the source removed . Cali-
bration sources prepared as a thin deposit on a relatively high-Z metal backing,
such as steel, copper, or nickel, may exhibit a strong back-scatter effect . This
effect is negligible for smear and filter papers, and very small for soil and
water samples in aluminum planchets . Therefore, when using calibration sources
of this sort, the efficiency factor is defined as :
E _ 2 (27r emission rate) (dpm/cpm)C- B
FORM 719-P REV. 2-80

Rockwell International NO N704TI990057
Energy SystemsGroup PAGE 14
. For the Tc-99 calibration sources, this effect will cause a difference of 25% in
the efficiency factor . For the Th-230 alpha calibration sources, this is only
1 .4% . Use of these efficiency factors will result in a small, but variable and
uncertain, systematic error . This error will not be adjusted . For calibration
sources and for samples near the acceptance levels, no correction is required for
dead-time losses .
5 .2 QUALIFICATIO N
In order to assure continued calibration of an instrument and detect mal-
function or drift at an early time, repeated qualification measurements must be
made and recorded . For each of the instruments described above, a measurement of
the background (in a stable environment with low background) and the response to
identified sources will be made and plotted on control charts prior to the first
use of the instrument each day . For measurements with a small number of counts
(alpha detector background), the action and limit lines will be established as
closely as possible at the 68%, 95%, and 99% bounds as determined from th e
• Poisson distribution (see Appendix A), while for measurements with 20 or more
events, the Gaussian (normal) distribution will be assumed with the lines set at
± ±1.960 \li, and ±2 .576 N, where N is the number of counts recorded . The
gross values are to be plotted ; no corrections nor unjustified rejections are to
be made . Redetermination of the average countrate and action and limit lines
will be necessary following repair or servicing of an instrument .
Qualification data for each instrument shall be kept on instrument record
sheets of the type shown in Appendix B . Sample control charts are also shown in
this appendix . The records sheets and control charts are part of the permanent
documentation to be developed in this program .
755-C .51/sj d
•
FORM 71 9- P REV. 2.80

Rockwell International
Energy Systems Group
•
NO
PAG E
6 .0 GRID SURVEYS
N704TI99005 7
15
The entire area to be surveyed at the SRE is approximately 140 ft long (east
to west) and 65 ft wide (north to south) with the floor approximately 20 ft below
grade . This represents about 18,500-ft2 surface or 1700-m2 area to be surveyed .
Clearly, surveying each square foot or square meter of the area would represent
an unreasonable task. Accordingly, alternative approachs of sampling the total
population will be utilized .
The area to be surveyed will be defined on a drawing of the SRE . On this
drawing will be overlayed 1-m2 grid pattern covering the inside and outside
below-grade areas including all of the walls, columns, and the post and plank
retaining wall on the south edge of the excavation . Each of the resulting 1-m
squares, representing the total population, will be given a number, and 54 of
these numbers will be selected using a table of random numbers . These will form
the unbiased or control sample .
A second independent group of 54 samples will be identified on the meter
squares . These will be from specific locations selected because the history of
operations or the previously run sweep surveys suggest that they are areas of
higher activity . Every attempt will be made to make these 54 samples truly
represent the worst case .
All 108 samples locations will be initially identified on the drawing or map
of the SRE . Using the southwest corner, where the retaining wall meets the
existing concrete wall, as the starting point, the sample locations on the SRE
surfaces will be established . Material samples (soil, rock, or concrete from the
original structure ; there is nothing to be gained from chipping away the new
column supports) will be obtained and identified, as discussed in Paragraph 4 .5 .
In addition, the measurements used to establish the sample location will be
recorded with the rest of the sample information . A 1-m2 perimeter will b e
placed on the surface at the sample location . Material samples for the 54 unbiased
samples will be obtained from any random location within the parameter . For 54
FORM 719•P REV. 2 80
Rockwell International
Energy Systems Group
NO
PAGE
N704TI990057
16
• selected samples, however, it will be necessary to measure the surface gamma
radiation within the perimeter and obtain the sample from the area showing the
highest reading . This reading is to be +-ecorded with the other sample data .
The samples will be carefully inventoried and submitted to HS&RS to establish
the amount of radioactivity present in each sample , as discussed in the Sample
Analysis section .
•
755-C .51/sj d
FORM 719-P REV . 2-80

Rockwell International No N704TI990057
•Energy Systems Group
7 .0 SAMPLE ANALYSIS
PAGE 1 7
The material obtained from the grid survey activity will be submitted to
HS&RS for the determination of the amount of radioactivity present in the sample .
This will be determined using standard , documented procedures and will yield a
result in pCi / g . This information will be recorded and reported for each of the
108 samples submitted .
A second group of 27 samples will be drawn from the original 108 samples and
submitted to HS&RS for a second determination of the amount of radioactivity
present . These samples will be numbered only permitting tracibility to the
original sample . The data from the reevaluated samples will permit an evaluation
of the repeatability of the analysis system and provide for increased confidence
in the resulting data .
A third group of samples will be drawn from the original 108 and submitted
to an outside laboratory for a complete breakdown to provide an inventory of the
natural and induced radionuclides present in the contribution each makes to the
total radioactivity present in the sample . These samples will be selected from
those with the highest measured radioactivity, original SRE material, or which in
some manner seem to be unusual . The number of these samples cannot be predeter-
mined, but it is expected that there will be more than ten .
755-C.51/sjd/feh
FORM 719 .P REV . 2-80

Rockwell Intemetional NO N704TI990057
Energy Systems Group PAGE 18
•8 .0 SAMPLE PLAN DESIG N
The grid sampling plan for the SRE has been designed to provide statistically
supportable information about the radiological condition of the total below-grade
area prior to backfilling . The approach taken is to establish an adequate ,
random, unbiased sample of the SRE surfaces and statistically compare it to an
equal sample which the history of the building and surveys of the area indicate
to be the worst condition . The sample size for the random sample has been estab-
lished from accepted statistical tables and will represent the population of the
entire area . This unbiased sample will represent the expected baseline or general
condition of the total area . A second sample from the same population will be
selected and will represent the worst case which can be defined for the area .
The closer these two samples are, based on statistical tests, the more uniform
will be the area and thus, the greater the assurance that the total area can be
represented by the samples and be declared as acceptable .
In establishing the sample plan, MIL-STD-414 was consulted to determine the
number of samples which would be required . This document indicated that 40 or 50
samples would be necessary for a total population of 1,700 where the variability
is unknown and the standard deviation method is employed with a single specifica-
tion limit .
In the case of the SRE, however, it is necessary to establish more than just
a simple accept or reject condition . Certain statistical tests are necessary to
adequately support the judgments made . Accordingly, the MIL-STD-414 sample sizes
were used as a point of departure in establishing a more suitable sample size .
In order to perform a single-sided "t" test of the mean where a = 0 .025 and t3 is
selected at 0 .05 and 8/6 is chosen as 0 .5, then 54 samples would be required .
This sample size offers a very satisfactory trade off between the cost of sampling
and analysis versus the adequate and sufficient accumulation of data for statis-
tical purposes . Therefore, a random sample of 54 will be drawn from the total
population of approximately 1,700 m squares . A second sample of 54 will be drawn
from the same population but at selected locations . These two samples will then
be compared using a number of tests including the "difference of means" and
others .
755-C .51/sj d
FORM 719•P REV. 2-80

Rockwell International
•
9 .0 BACKFILL IN u
The volume to be backfilled in and immediately adjacent to the SRE has been
estimated at approximately 6,500 yd3 . This equates to approximately 1,30045 yd3
truckfulls of material, although the actual number will be higher since the loose
material from the truck will have to be compacted when it is dumped in the SRE .
Some of this material was removed from the SRE during the decontamination activi-
ties and has been determined to be safely below the cleanness limits for the SRE .
Additional material will be required to complete the backfill operation, and this
will be obtained from other areas at SSFL .
In order to be confident that the backfilling material which is used is sub-
stantially less than the cleanness criteria for soils established in Table 1, a
monitoring program will be established . This program will required the radiolo-
tical survey of the areas from which the material will be obtained, the sampling
of soil which is used to establish the levels of radioactivity, the monitoring of
water from the wells in the SRE area for changes in radioactivity levels, and the
monitoring of the air . These are the controls necessary to assure that the mate-
rials and methods used in the backfilling operation do not result in creating a
condition which exceeds the established criteria .
9 .1 MATERIAL SITE S
The meter surveys discussed in Paragraph 4 .5 for beta and Paragraph 4 .6 .1
for gamma activity will be used at each site from which backfill material is
drawn . These surveys will be performed approximately every other day while the
material is being drawn from the site . The purpose of the survey will be to
assure that the sites are essentially homogeneous with activity levels well below
those established for soils . Records of each survey will be accumulated for
incorporation into the final report .
FORM 719-P REV. 2.80
NO . N704T199005 7
Energy Systems Group PAGE 19
Rockwelllntemational NO . N704TI99005 7
Energy Systems Group PAGE . 2 0
• 9.2 SOIL SAMPLES
Samples of the backfill material will be obtained from approximately 10` of
the truckloads each day . Material will be taken from several locations in the
load (before or after it is dumped) and placed in a 2-quart waterproof cardboard
container and identified as described in Paragraph 4 .5 . This material will be
submitted to HS&RS for analysis to establish the activity in pCi/g . This data
will be used to establish the "as left" condition of the SRE .
•
Obtaining samples from 10% of the truckloads is substantially more than
would be required if a standard sampling program based on MIL-STD-414 were used .
Had this standard been used, only 40 or 50 samples (approximately 3% to 5%) would
have been required . The larger number of samples is justified when the cost of
locating and removing material with excessive radioactivity is compared to the
cost of sampling and the resulting data base which will be developed . A control
chart will be used to provide substantiation that the backfill material is con-
sistently within acceptable limits .
9 .3 WATER SAMPLES
Water will be drawn from all available locations in and around the SRE each
day and submitted to HS&RS for analysis . Water will be used in compacting the
backfill material . By monitoring the well water, assurance can be gained that
there is no migration of any residual high-level radioactivity from the SRE into
the water table . Both the absolute levels of activity and the longer term trend
will be tracked . This data will be accumulated, analyzed, and incorporated into
the final report .
9 .4 AIR SAMPLE S
Air samples will be obtained and analyzed as described in Paragraph 9 .4 .
•
755-C .51/sjd/feh
FORM 719-P REV. 2.80

- r-
•
Rockwell Intemational
Energy Syste ms Group
NO N704TI990057
PAGE 2 1
APPENDIX A
THE POISSON DISTRIBUTIO N
Radioactive disintegration belongs to a class of phenomena that are repre-
sented by a statistical (or probability ) distribution known as the binomial
distribution . When the probability of a specific event ( the radioactive tran-
sition of a specified nucleus ) within the measurement time interval is small,
the binomial distribution is well approximated by the Poisson distribution :
P(n) = m en.
where P(n) is the probability of n events (counts, for example ) occurring if the
mean (or true) value is m . The standard deviation of this distribution is\ m .
For values of m of 20 or more, the Poisson distribution is well represented
by the discrete Gaussian distribution which, for the sake of generality, is
represented by the continuous Gaussian distribution . The standard deviation (cr)
is equal t o
Values of the percentage of occurrence of a specified number of counts (n)
for distribution with true means (m) are shown in Table A-1. -
The precise 95% bounds are shown for comparison below .
FORM 719-P REV . 7-78

!l~ Rockwell intemational1 I►
En.rgy Systems Group
NO h704T1990057
PAGE 22
Mean Count Lower Bound Upper Bound(-2.5%) (+2 .5% )
3 0.6 8.8
4 1.1 10.2
5 1.6 11. 7
6 2.2 13.1
7 2.8 14.4
8 3.5 15.8
9 4.1 17.1
10 4.8 18. 4
11 5.5 19.7
12 6.2 21.0
13 6.9 22.2
14 7.7 23.5
15 8.4 24. 7
16 9.1 26.0
17 9.9 27.2
18 10.7 28.4
19 11.4 29.7
20 12.2 30. 9
It may be noted that these differ somewhat f rom the bounds that would
be selected from Table A-1 . This may be due to representation of the dis-
crete Poisson distribution this calculation of bounds , as a continuous
distribution .
FORM 779-P REV. 7-78

Rockwell International
E .ryy Sysams G roup
NO N704TI99005 7
PA G E - 23
TABLE A-1
PERCENTAGE OF MEASUREMENTS EXPECTED TO PRODUCE A CERTAIN NUMBEROF COUNTS FOR ACTIVITY WITH THE SPECIFIED MEAN COUNT
(POISSON STATISTICS )
Number Mean Count Numbero fof
Counts 0 .1 0.2 0 .3 0.4 0.5 0.6 0 .7 0 .8 0 .9 Counts
0 90 .48 81 .87 74 .08 67 .03 60 .65 54 .88 49 .66 44 .93 40 .66 0
1 9 .05 16 .37 22 .22 26 .81 30.33 32 .93 34 .76 35 .95 36 .59 1
2 Q.45 1 .64 3 .33 5 .36 7.58 9.88 12 .17 14 .38 16 .47 2
3 0.02 0.11 0 .33 0 .72 1.26 1.98 2 .84 3 .83 4 .94 3
4 - 0.01 0.03 0.07 0.16 0.30 0 .50 0 .77 1 .11 4
5 - - 01 0 .02 0 .04 0 .070 0 .12 0 .20 56
.- - - 0.01 0.02 0 .03 6
7 - - - 7
Number Mean Countof
Counts 1 2 3 4 5 6 7 8 9 1 0
0 36 .79 13.53 4.98 1 .83 0.67 0.25 0 .09 0.03 0 .01 0
1 36.79 27.07 14.94 7 .33 3.37 1.49 0 .64 0 .27 0 .11 0 .05 1
2 18 .39 27 .07 22.40 14. 65 8 .42 4 .46 2 .23 1 .07 0 .50 0 .23 2
3 6 .13 18 .04 22 .40 19 .54 14 .04 8 .92 5 .21 2 .86 1 .50 0.76 3
4 1 .53 9 .02 16 . 80 19 .54 17 . 55 13 .39 9 .12 5 .73 3 .37 1 .89 4
5 0.31 3 .61 10 .08 15 .63 17 . 55 16 .06 12 .77 9 .16 6 .07 3 .78 5
6 0.05 1 .20 5 .04 10 .42 14 . 62 16 .06 14 .90 12.21 9 .11 6 .31 6
7 0 .01 0.34 2.16 5 . 95 10 .44 13 .77 14 . 90 13 .96 11 .71 9 .01 7
8 - 0.09 0 . 81 2.98 6 .53 10 .33 13.04 13 . 96 13 .18 11 .26 89 0.02 0.27 1 .32 3 .63 6.88 10 .14 12 .41 13 .18 12 .51 9
10 - 0.08 0.53 1.81 4.13 7 .10 9 .93 11 .86 12 .51 10
11 0.02 0.19 0.82 2 . 25 4 .52 7 .22 9.70 11 .37 1 1
12 0 .01 0.06 0.34 1 .13 2.63 4 .81 7 .28 9.48 12
13 - 0 .02 0.13 0.52 1 .42 2 .96 5 .04 7 .29 1314 0 .01 0.05 0.22 0 .71 1 .69 3 .24 5 .21 14
15 - 0.02 0.09 0 .33 0.90 1 .94 3 .47 15
16 - 0.03 0 .14 0 .45 1 .09 2.17 1617 0 .01 0 .06 0 .21 0.58 1 .28 1 718 - 0.02 0 .09 0.29 0 .71 1819 0 .01 0 .04 0 .14 0 .37 1 9
20 - 0.02 0 . 06 0 .19 20
21 0 .01 0 . 03 0 .09 2 1
22 - 0 .01 0 .04 22
23 - 0.02 2324 0 .01 24
25 - 25
FORM 719-P REV . 7-78

•
Rockwell international
Energy Systems Group
NO N704TI990057
PAGE . 24
PERCENTAGE OF MEASUREMENTS EXPECTED TO PRODUCE A CERTAIN NUMBEROF COUNTS FOR ACTIVITY WITH THE SPECIFIED MEAN COUNT
(POISSON STATISTICS )
•
Numberof
Mean Count
Counts 11 12 13 14 15 16
01 0.02 0.01 -2 0.10 0.04 0.02 0.01 -3 0.37 0.18 0.08 0.04 0 .024 1.02 0.53 0.27 0.13 0 .065 2.24 1.27 0.70 0.37 0 .196 4.11 2.55 1.52 0.87 0 .487 6.46 4.37 2.81 1.74 1 .048 8.88 6.55 4.57 3.04 1 .949 10.85 8.74 6.61 4.73 3 .2410 11.94 10 .48 8.59 6.63 4 .8611 11.94 11 .44 10 .15 8.44 6 .6312 10.94 11 .44 10.99 9.84 8 .2913 9.26 10.56 10.99 10.60 9 .5614- 7.28 9.05 10.21 10.60 10 .2415 5.34 7.24 8.85 9.89 10 .2416 3.67 5.43 7.19 8.56 9 .6017 2.37 3.83 5.50 7.13 8 .4718 1.45 2.55 3.97 5.54 7 .0619 0.84 1.61 2.72 4.09 5 .5720 0.46 0.97 1.77 2.86 4 .1821 0.24 0.55 1.09 1.91 2 .9922 0.12 0.30 0.65 1.21 2 .0423 0.06 0.16 0.37 0.74 1 .3324 0 .03 0 .08 0.20 0.43 0 .8325 0.01 0.04 0.10 0.24 0 .5026 = 0.02 0.05 0.13 0 .2927 0.01 0 .02 0.07 0 .1628 - 0.01 0.03 0 .0929 0.01 0.02 0 .0430 - 0.01 0 .0232 - 0.0132 0.013334353637
Numberof
17 18 19 Counts
01
- 20.01 - - 30.03 0.01 0.01 - 40.10 0.05 0.02 0.01 50.26 0.14 0.07 0.04 60.60 0.34 0.19 0.10 71.20 0.72 0.42 0.24 82.13 1 .35 0.83 0.50 93.41 2.30 1 .50 0.95 104.96 3 .55 2.45 1.64 116.61 5 .04 3.68 2.59 128.14 6.58 5.09 3.78 139 .30 8.00 6.55 5.14 r49 .92 9.06 7.86 6.50 159 .92 9.63 8.84 7.72 169.34 9.63 9.36 8.63 178 .30 9.09 9.36 9.11 186.99 8 .14 8.87 9.11 195.59 6.92 7.98 8.60 204.26 5 .60 6 .84 7.83 213.10 4.33 5.60 6.76 222.16 3.20 4.38 5.59 231.44 2.26 3.28 4.42 240.92 1.54 2.37 3 .36 250.57 1.01 1.64 2.46 260.34 0.63 1.09 1.73 270.19 0.38 0.70 1.17 280.11 0.23 0 .44 0.77 290.06 0.13 0.26 0.49 300.03 0.07 0.15 0.30 310.01 0.04 0.09 0.18 320.01 0.02 0.05 0.10 33
0 .01 0.02 0.06 340.01 0.03 350.01 0.02 36
0.01 37
FORM 719-P REV. 7 .78

Rockwell International
Ensrgy Sysosms Group
NO i?d704TI990057
PAGE 2 5
APPENDIX B
INSTRUMENT QUALIFICATION RECORD SHEETS AND CONTROL CHART S
da
Each instrument (counting system, scaler and detector , or countrate meter
and probe ) used in the inspection surveys will be assigned a disinct code
consisting of two alphanumeric characters to identify it and its results . As
long as an instrument is in use , a Qualification Record Sheet will be main-
tained , documenting the calibration and quality control measurements . For
instruments consisting of two components , such as the portable scaler and its
detectors or countrate meters and probes , the first character will be assigned
to the major component and the second to the minor. Each unit will have a label
showing its identifying code.
Information on the Qualification Record Sheet will fully describe each
instrument . A master sheet is included in this Appendix . These sheets provide
for a dated record of response to background and to calibration sources . This
record will also be shown on•control charts to provide indication and early
warning of deviation of the instrument from proper behavior .
The use of control charts is demonstrated by a fictitious example in Fig-
ures B-i and B-2, for a scaler and alpha probe . The first figure shows the
background count (not count rate ) while the second shows the count (not count
rate ) for a standard alpha source . The first chart involves Poisson statistics,
while the second involves Gaussian statistics . Normal background counts are
shown initially , for a true count of 4 . An abrupt change in April suggests a
small light leak , while the slow upward drift in June could result from a drift
in the discriminator . The control chart for the standard source shows normal
behavior initially , then some erratic behavior in April , perhaps due to elec-
trical supply noise . The slow decline in response after June could result from
many causes : degradation of the scintillator screen, reduced amplification in
the photomultiplier tube, declining high voltage . In any event, unacceptabl e
FORM 719.P REV . 7 .78

J"k Rockwell Internationali►
Ensryy Syat.nx Group
MARCH15 5 10 15 20 25
14
13
12
1 1
10
5
a
10 55 15 20 25MARCH
APRIL5 10 15 20 25
MAY5 10 15 20 25
JUNE5 10 15 20 25
JULY5 10 15 20 25
10 15 20 25 5 10 I5 20 25 5 10 15 20 25 5 10 15 20 25APRIL MAY JUNE JULY
r
Figure B-1Background Control Chart
FORM 719-P REV . 7 .78
No N704TI990057
PAGE 26

NO N704TI990057Rockwell Intemational0
PAGE 27Energy Systems Group
MARCH
10 15 2C 2 5
1100
1080
1060
1040
1020
1000
980
960
940
920
900
APRIL MAY JUNE JULY10 15 20 25 5 10 15 20 25 5 10 15 20 25 5 1015 20 2 5
5 10 15 20 25 S 10 15 20 25 5 10 15 20 25 5 10 15 20 25 5 10 I5 2(1MARCH APRIL MAY JUNE JULY
Figure B-2Source Response Control Chart
PORM 719-P REV . 7 .7E

Rockwell lntemstionel
Entrgy Syat.ms Group
No N70411990057
PAGE 28
performance is clearly forecast. ( Note that indication of similar poor per-
formance by several instruments checked with the same source suggests the need
for checking the source itself . )
The scale and guidelines on a control chart should be selected and drawn
with care . The scale should provide reasonable separation of the guidelines and
good resolution for various count values , but should not spread them so widely
that trends are hard to discern. For the Poisson distribution , the guidelines
are chosen as symmetrically about the mean as possible to provide 68%, 95%, and
99% limits . For the Gaussian distribution, these correspond to t1a, ±1 .96o-,
and ±2 .576o . The standard deviation , a-, shall be taken as equal to '/W where N
is the expected ( true ) number of counts in the counting interval, determined
from a set of 100 counts (or alternatively , 100 times the counting time inter-
val) . This provides an uncertainty on the mean value of one-tenth the standard
deviation of the data distribution for the basic counting interval, thus
limiting the bias introduced by departu re of this value from the true value .
Mechanical and electronic adjustments to the instrument may affect both the
background and source-response results , so these values must be redetermined
after servicing of an instrument .
The Qualification Record Sheets and the Control Charts are part of the
permanent documentation .
FORM 719-P REV . 7-75

Rockwell International
Energy Systems Gro up
NO
PAGE
N7044T1990057
29
INSTRUMENT QUALIFICATION RECORD SHEET
Instrument Code
Type :
Mfr :
Model :
Serial :
Prop . No . :
Source Identification :
DateCalib .
Due DateBackgroundCount Time
Source ResponseRate Count Time
EfficiencyFactor
FORM 719 • P REV . 7.78