this work is licensed under a creative commons attribution...
TRANSCRIPT

Copyright 2008, The Johns Hopkins University and Simon Day. All rights reserved. Use of these materials permitted only in accordance with license rights granted. Materials provided “AS IS”; no representations or warranties provided. User assumes all responsibility for use, and all liability related thereto, and must independently review all materials for accuracy and efficacy. May contain materials owned by others. User is responsible for obtaining permissions for use from third parties as needed.
This work is licensed under a Creative Commons Attribution-NonCommercial-ShareAlike License. Your use of this material constitutes acceptance of that license and the conditions of use of materials on this site.
Analysis Issues, ITT, Post-Hoc, and Subgroups
Simon Day, PhDJohns Hopkins University

Section A
Intention to Treat

4
Intention to Treat
The principal is that every patient who is randomized should be included in the analysisWhy−
Ensures a valid analysis; ensures different groups of patients are comparable (because of randomization)
−
Avoids many causes of bias; particularly avoids ambiguous decisions about who to include/who not to include in the analysis

5
Intention to Treat
Which treatment is better?or . . .Is treatment X better than treatment Y?−
“Better” as used in “clinical practice” or “all other things being equal?”

6
Which Treatment is Better, Treatment X or Y?
Who wants to know the answer?−
Pharmaceutical company/producer
−
Regulators−
Prescribers
−
Purchasers−
Patients

7
Medical vs. Surgical Treatment for Operable Tumours
Medical Treatment Surgical Treatment
Intention to Treat

8
Treat ment Group A Treat ment Group B
(Placeb o)
Compli ance No Pats % Morta lity No Pats % Morta lity
< 80%
> 80%
Total
357
708
1065
24.6%
15.0%
882
1813
2695
28.2%
15.1%
Source: NEJM. (1980). 303: 1038-41.
Five-Year Mortality Rates According to Compliance

9
Complete Follow-Up (On All Patients)
Implications of complete follow-upPragmatism (intention to treat [ITT]) answers the question: “what is the outcome if my policy is to use treatment X?”−
Does this make sense with placebos?

10
Intention to Treat
Pragmatism (pragmatic implantation of ITT)All randomised patientsNot necessarily all recruited patientsNot necessarily all treated patients (but usually)“All randomised patients with at least one post-baseline (questions on-treatment) efficacy assessment”All randomised patients!

11
Guidelines on “Statistical Analysis of Clinical Studies”
Investigatory trials−
Only subjects eligible for entry into the trial who have completed the present trial in accordance with the protocol should be strictly selected and [analysed]
Practical trials−
In the case of practical trials, on the other hand, it is also claimed that the subjects who have undergone the trial treatment should be included in analysis regardless of duration of treatment [and analysed] even if there is no possibility that they will show up . . . as being “improved” (ITT)
12
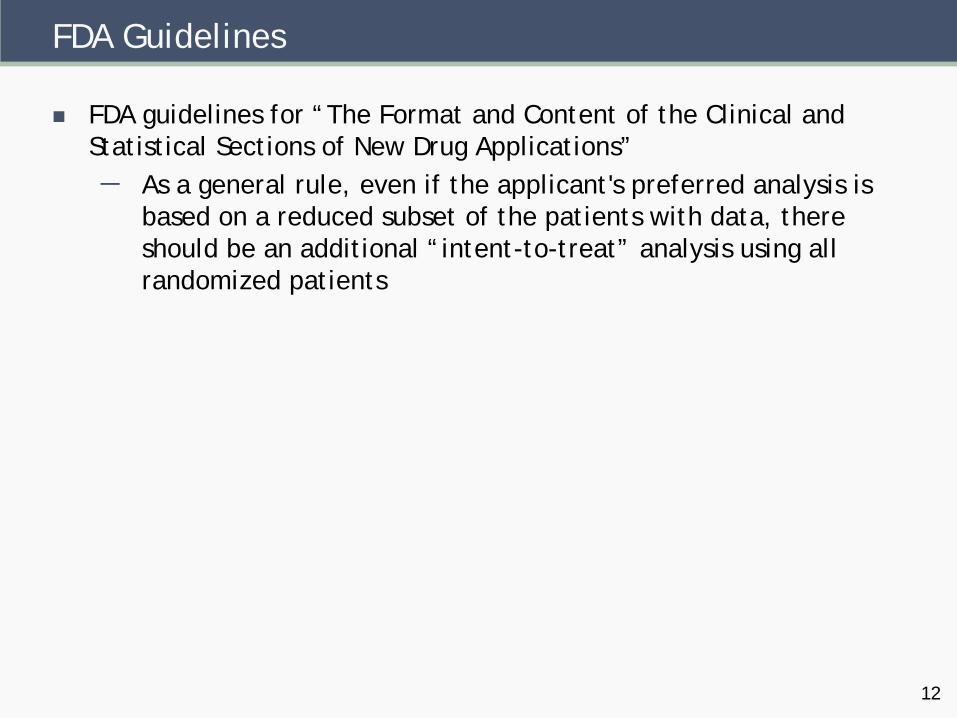
FDA Guidelines
FDA guidelines for “The Format and Content of the Clinical and Statistical Sections of New Drug Applications”−
As a general rule, even if the applicant's preferred analysis is based on a reduced subset of the patients with data, there should be an additional “intent-to-treat” analysis using all randomized patients

13
CPMP Note for Guidance
“Biostatistical Methodology in Clinical Trials for Marketing Authorisations for Medicinal Products”−
In general, it is advantageous to demonstrate a lack of sensitivity of the principal trial results to alternative choices of patient population for analysis
−
When the ITT and the per protocol analyses come to essentially the same conclusions, confidence in the study results is increased

14
ICH E3 Guideline
“Structure and Content of Clinical Study Reports”−
As a general rule, even if the applicant's preferred analysis is based on a reduced subset of the patients with data, there should be an additional “intention-to-treat” analysis using all randomized patients

15
ICH E9 Guideline
“Statistical Principles for Clinical Trials”−
The guideline introduced a new idea with the name: the “full analysis set”
Decisions concerning the analysis sets should be guided by the following principles:1. To minimise bias2. To avoid inflation of type I error

16
ICH E9 Guideline
“Statistical Principles for Clinical Trials”−
In many clinical trials, the use of the full analysis set provides a conservative strategy
−
There are a limited number of circumstances that might lead to excluding randomised subjects from the full analysis set

17
In the Next Section We’ll Look at . . .
Subgroup analyses−
Post-hoc analyses
−
Unreliable conclusions

Section B
Analysis Issues

19
Subgroups and Post-Hoc Analysis
We’ve already seen one example of subgroups of “compliant” vs. “non-compliant” patients

20
Treatment Group A Treatment Group B
(Placebo)
Compliance No Pats % Mortality No Pats % Mortality
< 80%
> 80%
Total
357
708
1065
24.6%
15.0%
882
1813
2695
28.2%
15.1%
Source: NEJM. (1980). 303: 1038-41.
Five-Year Mortality Rates According to Compliance

21
Uncertainty in Data
We can never know the “truth”So we make estimates and draw conclusions that are . . .−
Hopefully reliable
−
Inevitably not certainOne analysis; one chance of making a mistakeMultiple analyses; multiple chances for error (and they tend to “add up”)

22Source: NEJM. (1980). 303: 1038-41.
Treatment Group A Treatment Group B
Compliance No Pats % Mortality No Pats % Mortality
< 80%
> 80%
Total
357
708
1065
24.6%
15.0%
882
1813
2695
28.2%
15.1%
Five-Year Mortality Rates According to Compliance
Why “compliance” as the subgroup?Why not age, metabolic rate, co-morbidity, etc.?Why this “cut-off” (80%) for compliance?

23
A Priori Analysis Plan
“Still, it is an error to argue in front of your data. You find yourself insensibly twisting them around to fit your theory.”
—Sherlock Holmes (via Sir Conan Doyle) inThe Adventure of Wisteria Lodge

24
A Priori Analysis Plan
So one solution is to pre-specify every detail:−
What the subgroups will be
−
What the “cut-off” criteria will be (if any)It is then equally important to report every analysis

25
So-Called “Fishing Expeditions”
Searching through the data, hoping to find “something interesting”“Fishing expedition . . . the analogy of dipping a fishing rod into dark water and pulling out various items of rubbish, but rarely fish!”*
Source: Day. (2007). Dictionary for Clinical Trials.

26
Further Problems with Subgroups
Too many “statistically significant” differencesNot enough “statistically significant” differences

27
Too Many “Differences”
Because the probability of each “statistically significant difference”not being real is 5%So lots of 5%s all add togetherSome of the apparent effects (somewhere) will not be realWe have no way of knowing which ones are and which ones aren’t
28
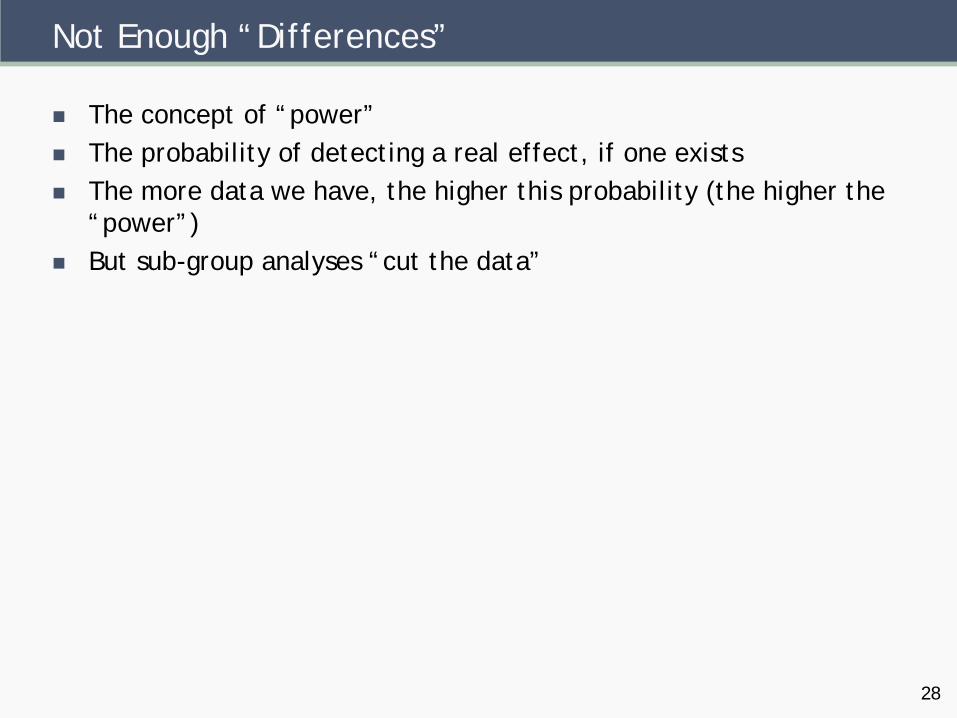
Not Enough “Differences”
The concept of “power”The probability of detecting a real effect, if one existsThe more data we have, the higher this probability (the higher the “power”)But sub-group analyses “cut the data”

29
Not Enough “Differences”
Trials are expensive!We usually fix the size of the trial to give high “power” to detect important differences overallWhen we start splitting the data (only look at men; or only look at women; or only look at renally impaired; or only look at the elderly; etc., etc.), the sample size is smaller . . . the power is much reduced

30
So What’s Going On?
1. Too many “statistically significant” differences2. Not enough “statistically significant” differences
−
These two problems are both at work simultaneously and we have little (or no) idea which effects to believe in and which not to

31
In the Next Lecture We’ll Look at . . .
Missing data−
Reasons
−
Problems−
Bias
−
Solution