thomas p. dinapoli • state comptroller employment … trends in new york state august 2013 office...
TRANSCRIPT

Employment Trends in New York State August 2013
OFFICE OF THE NEW YORK STATE COMPTROLLER
Thomas P. DiNapoli • State Comptroller
Executive Summary
New York State’s economy, like that of the nation, has taken a roller coaster ride since the start of the 21st century. The national recession of 2001 and its aftermath hit the Empire State with job losses proportionally larger than those in most states. Following more than five years of steady recovery from the 2001 downturn, New York was again hit hard by the Great Recession – losing more than 300,000 jobs in 2008 and 2009.
For a five year period beginning in 2007, before the Great Recession, and continuing through 2011, the Empire State’s employment performance outpaced the nation’s. Private sector job trends in the State were more favorable than the national average – with New York showing stronger gains or smaller losses – for five consecutive years, from 2007 through 2011. The State has not previously seen such a sequence of above-average employment results in the 74 years since the federal government began its current series of statistics on employment in the states. After more than three years of gains, New York’s job count is above its pre-recession level – while the nation as a whole remains below its pre-recession peak.
New York’s relatively strong employment performance during and after the Great Recession is likely related, in part, to differences in regional housing markets. Compared to some other states, New York experienced smaller gains in housing values during the years leading up to the recession – and avoided the collapse in residential construction that followed in many regions.
The State has continued to benefit from steady job growth in 2012 and the first half of 2013 – but the national economy is once again outpacing New York, as it has done during most of the post-World War II era. Overall private-sector employment rose 1.5 percent in the State during the year ending in June 2013, compared to 2.1 percent nationwide. In the past year, New York failed to match the national growth rate in major sectors including manufacturing, professional services, financial activities, and trade/transportation/utilities, but outperformed the nation in education and health services.
The information in this report is intended to provide a broad framework for discussion both of New York’s economy and of the State’s efforts to help stimulate economic growth and encourage the creation of the jobs New Yorkers need.

Employment Trends in New York State2
Other key findings of this report, which examines employment and other economic indicators, include:•OverthefiveyearsendinginDecember2012,NewYorkperformedmeasurablybetterthanthenation
in major employment sectors including construction, information, professional services, and leisure and hospitality. Sectors where the State proportionally lost more jobs or gained fewer than the nation during the period included government, and mining and logging.
•NewYorklostnearly100,000manufacturingjobsfrom2007through2012,adeclineof16.9percent that compared to a national average loss of 14.1 percent. For the year ending in June 2013, manufacturing employment rose modestly across the nation as a whole but declined further in New York,withayear-over-yeardropof3.6percent.
• PercapitapersonalincomeinNewYorkhaslongbeenhigherthanthenationalaverage,andtheState’s advantage on this measure has increased in the past decade. As of 2012, New York’s per capita personalincomewas$52,095,or22percentabovetheU.S.averageof$42,693.
• ThefinanceandinsurancesectorremainsthemostimportantsinglecontributortoNewYorkState’soverall economic output, representing 15.9 percent of State gross domestic product in 2011 – a proportion more than double its share of employment.
• InternationalimmigrationremainsabrightspotfortheEmpireState’seconomy.Overthepastdecade, New York gained more than 1 million residents from other countries. The State’s total population rose by barely a quarter of the nation’s pace over the decade ending in 2011, and New YorkwouldhaveseenitsCensuscountdeclinebymorethan680,000overtheperiodifnotforimmigration from outside the United States. Both New York City and Upstate New York gain economically from international migration.
• Ithaca,GlensFallsandtheCapitalRegionhaveseenrelativelyhighprivateemploymentgrowth,compared to the rest of the State, over the last two decades. New York City and Long Island also saw private-sector job gains of more than 10 percent over the period, while most other upstate regions experienced either modest gains or employment losses. All regions except Ithaca saw private employment grow more slowly than the national average over the period.
•Overthefiveyearsthrough2012,mostmetropolitanareasbothdownstateandupstateoutperformedthe nation’s employment trends. However, the Binghamton, Kingston, Syracuse and Utica-Rome regions saw job losses around the same rate as or larger than the national average during the period.
Employment counts, average income and measures of output and population are all important indicators, but they are not the only ways to assess changes in the economy. As with the nation as a whole, every region of New York State remains challenged to generate adequate numbers of well-paying, secure jobs for workers at varied levels of skill and experience. The information in this report is intended to provide a broad framework for discussion both of New York’s economy and of the State’s efforts to help stimulate economic growth and encourage the creation of the jobs New Yorkers need.

3Office of the State Comptroller
New York Employment Compared with the United States
Employment TrendsNew York, like the nation as a whole, has experienced two large drops in private sector employment since 2000 (Figure 1). The first began in 2001 and lasted through 2003. The second, associated with the Great Recession, began in 2008 and bottomed out in 2009.
There is a significant difference between these two periods of employment decline in terms of New York’s relationship to the nationasawhole.Duringthe2001-03 period, New York saw a measurably larger proportional loss in employment when compared with the U.S. In sharp contrast, during the 2008-09 period, the situation was reversed as the U.S. suffered a greater proportional loss, dropping from a greater height to a lower depth than New York.
The table in Figure 2 breaks the employment data down into two discrete five-year periods – from 2002 to 2007 and from 2007 to 2012 – for each of the major sectors that constitute overall employment. The detailed data confirm that while the U.S. outperformed New York in the earlier period, New York has been ahead of the nation in recent years. New York added private sector jobs at a rate of 1.5 percent in the five years through 2012 while employment declined by 3.1 percent nationally.
New York’s employment performance over the 2007-2012 period was better than that of the nation in trade, transportation and utilities, the largest sector of private employment, as well as in the key sectors of construction, information, professional services, and leisure and hospitality. Meanwhile, government and manufacturing employment declined more swiftly in New York than in the nation as a whole. Both the nation and New York enjoyed increases in employment in the education and health sector, and in leisure and hospitality, during each of the two five-year periods.
Private Sector Employment in NYS and US
GG_2013 Report Tables and Graphs rev2 081313 238pm
102,000
104,000
106,000
108,000
110,000
112,000
114,000
116,000
118,000
6,600
6,800
7,000
7,200
7,400
7,600
2000 2003 2006 2009 2012
New York U.S.
New York U.S.
Change in New York State and U.S. Private Sector Employment, 2000-2012
Employment figures in thousands
Source: U.S. Bureau of Labor Statistics, seasonally adjusted monthly data
Figure 1

Employment Trends in New York State4
The bar chart in Figure 3 provides a graphic illustration of the most recent five-year results. The sectors are sorted, with New York’s best performing sectors at the top and the worst at the bottom. The sectors with gains are all service-oriented while those seeing losses include both service- and goods-producing sectors. The larger decline in construction at the national level is due to the housing construction collapse associated with the Great Recession, which hit many other states harder than New York. The large increase in employment at the national level in the mining and logging sector is related to increases in natural resource extraction. Manufacturing declined at both the national and State levels, with New York dropping slightly more than the U.S. as a whole.1
Figure 2
New York and U.S. Employment Change, Major Sectors, 2007-2012
Employment figures in thousands
United States New York
2002 2007Change 2002 to
20072012
Change 2007 to
20122002 2007
Change 2002 to
20072012
Change 2007 to
2012
Total Private 108,937 115,427 6.0% 111,822 -3.1% 6,970 7,233 3.8% 7,340 1.5%Mining and Logging 583 724 24.2% 851 17.5% 5 6 21.6% 5 -14.5%Construction 6,716 7,630 13.6% 5,641 -26.1% 322 352 9.4% 312 -11.4%Manufacturing 15,259 13,879 -9.0% 11,919 -14.1% 651 552 -15.2% 458 -16.9%Trade, Transport & Utilities 25,497 26,630 4.4% 25,516 -4.2% 1,479 1,525 3.1% 1,509 -1.0%Information 3,395 3,032 -10.7% 2,678 -11.7% 297 270 -9.3% 261 -3.4%Financial Activities 7,956 8,348 4.9% 7,786 -6.7% 705 731 3.7% 683 -6.6%Professional Services 15,976 17,942 12.3% 17,930 -0.1% 1,055 1,134 7.6% 1,168 3.0%Education and Health 16,199 18,322 13.1% 20,319 10.9% 1,469 1,599 8.8% 1,763 10.3%Leisure and Hospitality 11,986 13,427 12.0% 13,746 2.4% 640 701 9.6% 801 14.2%Other Services 5,372 5,494 2.3% 5,437 -1.0% 347 363 4.4% 379 4.5%Government 21,513 22,218 3.3% 21,917 -1.4% 1,492 1,501 0.6% 1,460 -2.7%
Source: U.S. Bureau of Labor Statistics, annual data, not seasonally adjusted Note: Sectors do not add to total.
GG_2013 Report Tables and Graphs rev2 081313 238pm
-30% -20% -10% 0% 10% 20% 30%
Leisure and Hospitality
Education and Health
Other Services
Professional Services
Trade, Transportation & Utilities
Government
Information
Financial Activities
Construction
Mining and Logging
Manufacturing
US NY
Percentage Change in Employment by Sector, 2007-2012
Source: U.S. Bureau of Labor Statistics, annual data, not seasonally adjusted
Figure 3
1 For a more detailed review of changes in New York’s manufacturing base, see The Changing Manufacturing Sector in Upstate New York: Opportunities for Growth, Office of the State Comptroller, June 2010, available at http://www.osc.state.ny.us/localgov/pubs/research/manufacturingreport.pdf.

5Office of the State Comptroller
The table in Figure 4 provides annual data for total private sector employment over the entire period and shows the year-to-year changes that occurred. For the five consecutive years ending in 2011, New York outperformed the nation as a whole. The federal Bureau of Labor Statistics’ comprehensive state-level data on employment extend back to 1939. Not once before in that period did New York outpace the nation for four consecutive years, let alone five.2
Duringtwoofthesefiveyears,boththeStateandthenationaddedjobs,andNewYork’sjobgainswerehigher than average. In 2009, while the ravages of the Great Recession brought job losses across the country, New York’s losses were smaller than average. And in 2008 and 2010, New York achieved modest growth in private sector employment despite net losses nationwide.
The figures for 2012 show that New York’s rate of job gains slowed somewhat both compared with 2011 and relative to the nation. Meanwhile, the national rate of job creation continued to accelerate, and surpassed New York’s in 2012 for the first time in six years.
Figure 4
Annual Change in Total Private Sector Employment, 2000-2012
Employment figures in thousands
Year United States Change New York Change2000 111,091 2.1% 7,171 2.2%2001 110,800 -0.3% 7,127 -0.6%2002 108,937 -1.7% 6,970 -2.2%2003 108,517 -0.4% 6,923 -0.7%2004 109,888 1.3% 6,981 0.8%2005 111,943 1.9% 7,048 1.0%2006 114,151 2.0% 7,133 1.2%2007 115,427 1.1% 7,233 1.4%2008 114,342 -0.9% 7,277 0.6%2009 108,321 -5.3% 7,032 -3.4%2010 107,427 -0.8% 7,056 0.3%2011 109,411 1.8% 7,206 2.1%2012 111,822 2.2% 7,340 1.8%
Source: U.S. Bureau of Labor Statistics, annual data, not seasonally adjusted
2 For more on New York’s recent and long-term employment performance relative to the nation, see The Surprise Economy: Why Has New York Been Outperforming the Nation?, Nelson A. Rockefeller Institute of Government, August 31, 2011, available at http://www.rockinst.org/pdf/government_finance/2011-08-31-The_Surprise%20_ Economy.pdf.

Employment Trends in New York State6
Dataforthefirsthalfof2013extend this trend. Figure 5 compares June 2013 data with that from a year before. New York continued to enjoy strong growth relative to most other years since the start of the new century, adding roughly 110,000 jobs. Still, in nearly every sector, national job growth rates exceeded those in New York. Further, while manufacturing employment at the national level increased over the last year, it continued to decline in New York.
Figure 5
Change in Employment, Major Sectors, June 2012-June 2013
Employment figures in thousands
United States New York State
June 2012 June 2013 Change June 2012 June 2013 Change
Total Private 111,694 114,025 2.1% 7,408 7,518 1.5%Mining, Logging & Construction 6,475 6,670 3.0% 329 338 2.5%Manufacturing 11,935 11,969 0.3% 464 447 -3.6%Trade, Transport & Utilities 25,467 25,921 1.8% 1,521 1,545 1.6%Information 2,675 2,691 0.6% 264 257 -2.7%Financial Activities 7,788 7,893 1.3% 690 687 -0.4%Professional Services 17,913 18,550 3.6% 1,182 1,218 3.0%Education and Health 20,296 20,662 1.8% 1,729 1,767 2.2%Leisure and Hospitality 13,716 14,186 3.4% 845 872 3.2%Other Services 5,429 5,483 1.0% 384 389 1.3%Government 21,915 21,851 -0.3% 1,472 1,456 -1.1%
Source: U.S. Bureau of Labor Statistics, annual data, not seasonally adjusted Note: Mining and Logging are combined with Construction by the Bureau of Labor Statistics in this data series.
Cumulative Change in Private Sector Employment
GG_2013 Report Tables and Graphs rev2 081313 238pm
-9%
-7%
-5%
-3%
-1%
1%
3%
5%
2008 2009 2010 2011 2012 2013
New York U.S.
Cumulative Change in New York and U.S. Private Sector Employment, 2008-2013
Source: U.S. Bureau of Labor Statistics, seasonally adjusted monthly data
Figure 6

7Office of the State Comptroller
Economic policy makers and analysts continue to debate the cause of the nation’s slow recovery from the Great Recession, in comparison to previous downturns. While employment conditions in New York remain a challenge as well, the State has experienced a more favorable employment pattern than the U.S. as a whole since the start of the Great Recession, as shown in Figure 6,whichillustratesthecumulativepercentage change in employment since the start of 2008.3 While both New York and the nation experienced dramatic declines in private sector employment during this period, the cumulative percentage loss for the nation was greater than for New York. Similarly, while New York has risen well above the break-even level in terms of total jobs, the U.S. has yet to reach this level.
Another way to look at New York’s relative success compared with the nation is to consider what the nation’s sharper decline in employment means. Overall, as of June 2013, New York had some 332,300 private-sector jobs more than it would have had if its rate of job gains and losses had matched that of the nation as a whole since 2007.
The opposite pattern emerges when it comes to government employment. The chart in Figure 7 shows that government employment patterns in New York paralleled those of the nation as a whole from the start of 2008 through 2011, with a small increase at the outset coinciding with federal stimulus spending. There was also a spike in government employment – unique to New York – that was related to a summer jobs program in 2009. The second employment spike in 2010, which coincides with a similar spike in total government employment in the U.S., is related to temporary Census employment. In the past year and one-half, government jobs in New York have been cut at a faster rate than in the U.S. That rate of decline has accelerated in recent months, with the greatest recent loss occurring in State-level employment.
Cumulative Change in Public Sector Employment
GG_2013 Report Tables and Graphs rev2 081313 238pm
-5%
-3%
-1%
1%
3%
5%
2008 2009 2010 2011 2012 2013
New York U.S.
Cumulative Change in New York and U.S. Public Sector Employment, 2008-2013
Source: U.S. Bureau of Labor Statistics, seasonally adjusted monthly data
Figure 7
3 TheNationalBureauofEconomicResearchdatesthedurationofthelastrecessionasDecember2007throughJune2009.New York State continued to gain employment, on a seasonally adjusted basis, until April 2008.

Employment Trends in New York State8
Income TrendsNew York continues to set a pace well ahead of the nation when it comes to per capita income. Figure 8 shows that the Great Recession had no discernible impact on this pattern. And while per capita income declined for both in 2009, New York regained its 2008 level in 2010, while the U.S. as a whole had to wait until 2011 to equal its previous high point. In recent years, personal income per capita in New York has been more than 20 percent higher than the national average, a larger advantage for the State than a decade ago.
Components of New York’s Gross Domestic Product
Figure 9 shows the comparative contributions of various economic sectors to New York’s total economic output, or gross domestic product(GDP).Thelargestsharecomes from finance and insurance activities, which provided 15.9 percentoftheState’sGDPin2011,the most recent year for which data is available. The health and education sector comes next, with 15.2 percent. Trade, transportation and utilities, which collectively constitute the provision of most retail and wholesale commerce, provide 12.5 percent, while real estate and rentals comprise 11.4 percent. These four economic sectors together constitute 55 percentoftheState’sGDP.
Contributions of Sectors to NYS GDP
GG_2013 Report Tables and Graphs rev2 081313 238pm
Agriculture & Mining 0.3%
Construction 2.6% Manufacturing
5.4% Leisure and Hospitality
6.0%
Other Services 6.0%
Information 7.2%
Professional Services
8.1%
Government 9.5% Real Estate
and Rental 11.4%
Trade, Transportation
& Utilities 12.5%
Education and Health
15.2%
Finance and Insurance
15.9%
Contribution of Economic Sectors to New York’s GDP in 2011
Source: U.S. Bureau of Economic Analysis
Figure 9
Per Capita Income - New York State
GG_2013 Report Tables and Graphs rev2 081313 238pm
$35 $35 $35 $36 $39
$41
$45
$48 $49
$47 $49
$51 $52
$30 $31 $31 $32 $34
$35 $38
$40 $41
$39 $40
$42 $43
$25
$35
$45
$55
2000 2002 2004 2006 2008 2010 2012 New York U.S.
Per Capita Income, New York and U.S., 2000-2012 (Dollars rounded to thousands)
Source: U.S. Bureau of Labor Statistics, annual data, not seasonally adjusted
Figure 8

9Office of the State Comptroller
The entire financial services sector, which consists of both the finance-insurance sector and the real estate andrentalsector,combinedforatotalof27.3percentofNewYork’sGDP–farexceedingitsroughly9.5percent of total employment in the State in 2011. The information sector similarly provides a significantly largershareofGDPthanemploymentintheState.Inmostothersectors,thepictureisreversed–forexample, education and health provides roughly 20 percent of private sector employment but represented 15.2 percent of overall economic activity in 2011.
ComparingNewYork’stotalGDPgrowth with that of the nation since 2000, as in Figure 10, we can see New York underperformed the nation in 2002 through 2004 and suffered a greater loss during 2008, at the start of the Great Recession. However, New York’s losses in 2009 were relatively less than the nation’s, and its gains in 2010 were greater, as shown in Figure 10.
Change in Real Gross Domestic Product
GG_2013 Report Tables and Graphs rev2 081313 238pm
-5%
-3%
-1%
1%
3%
5%
2000 2002 2004 2006 2008 2010
U.S. New York State
Change in Real Gross Domestic Product, New York and U.S., 2000-2011
Source: U.S. Bureau of Economic Analysis
Figure 10
Employment Trends in New York State10
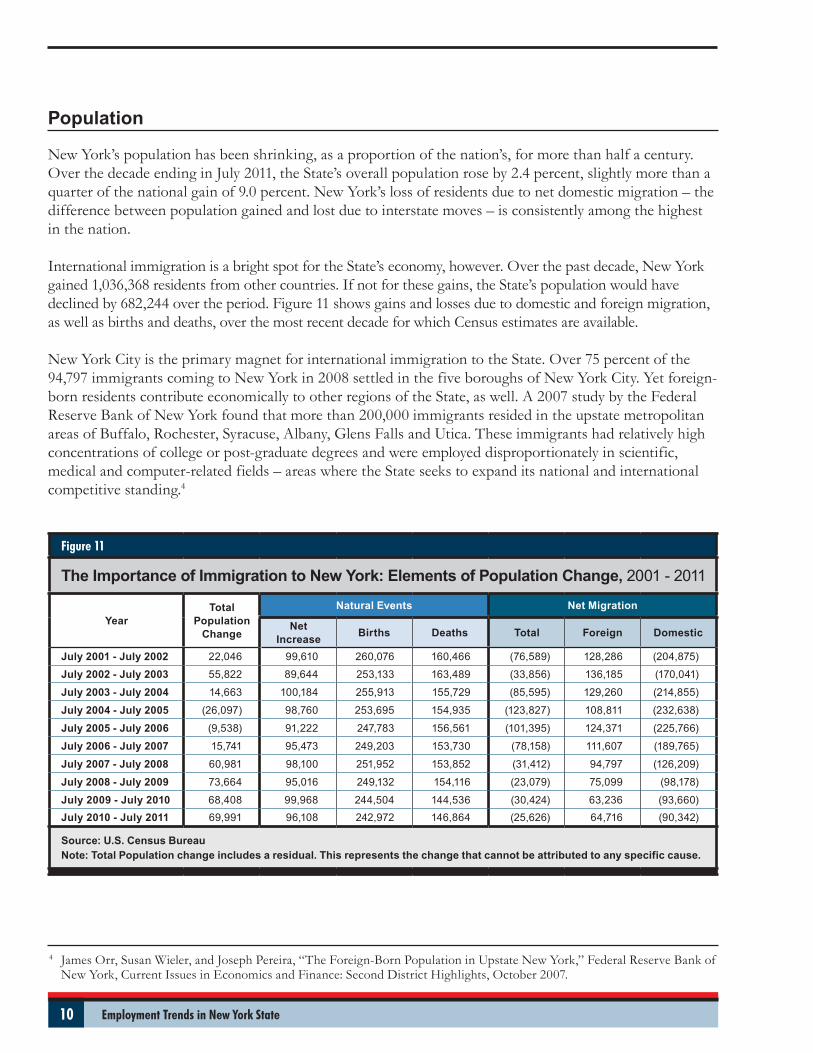
Population
New York’s population has been shrinking, as a proportion of the nation’s, for more than half a century. Over the decade ending in July 2011, the State’s overall population rose by 2.4 percent, slightly more than a quarter of the national gain of 9.0 percent. New York’s loss of residents due to net domestic migration – the difference between population gained and lost due to interstate moves – is consistently among the highest in the nation.
International immigration is a bright spot for the State’s economy, however. Over the past decade, New York gained1,036,368residentsfromothercountries.Ifnotforthesegains,theState’spopulationwouldhavedeclinedby682,244overtheperiod.Figure11showsgainsandlossesduetodomesticandforeignmigration,as well as births and deaths, over the most recent decade for which Census estimates are available.
New York City is the primary magnet for international immigration to the State. Over 75 percent of the 94,797 immigrants coming to New York in 2008 settled in the five boroughs of New York City. Yet foreign-born residents contribute economically to other regions of the State, as well. A 2007 study by the Federal Reserve Bank of New York found that more than 200,000 immigrants resided in the upstate metropolitan areas of Buffalo, Rochester, Syracuse, Albany, Glens Falls and Utica. These immigrants had relatively high concentrations of college or post-graduate degrees and were employed disproportionately in scientific, medical and computer-related fields – areas where the State seeks to expand its national and international competitive standing.4
Figure 11
The Importance of Immigration to New York: Elements of Population Change, 2001 - 2011
YearTotal
Population Change
Natural Events Net Migration
Net Increase Births Deaths Total Foreign Domestic
July 2001 - July 2002 22,046 99,610 260,076 160,466 (76,589) 128,286 (204,875)
July 2002 - July 2003 55,822 89,644 253,133 163,489 (33,856) 136,185 (170,041)
July 2003 - July 2004 14,663 100,184 255,913 155,729 (85,595) 129,260 (214,855)
July 2004 - July 2005 (26,097) 98,760 253,695 154,935 (123,827) 108,811 (232,638)
July 2005 - July 2006 (9,538) 91,222 247,783 156,561 (101,395) 124,371 (225,766)
July 2006 - July 2007 15,741 95,473 249,203 153,730 (78,158) 111,607 (189,765)
July 2007 - July 2008 60,981 98,100 251,952 153,852 (31,412) 94,797 (126,209)
July 2008 - July 2009 73,664 95,016 249,132 154,116 (23,079) 75,099 (98,178)
July 2009 - July 2010 68,408 99,968 244,504 144,536 (30,424) 63,236 (93,660)July 2010 - July 2011 69,991 96,108 242,972 146,864 (25,626) 64,716 (90,342)
Source: U.S. Census Bureau Note: Total Population change includes a residual. This represents the change that cannot be attributed to any specific cause.
4 James Orr, Susan Wieler, and Joseph Pereira, “The Foreign-Born Population in Upstate New York,” Federal Reserve Bank of NewYork,CurrentIssuesinEconomicsandFinance:SecondDistrictHighlights,October2007.

11Office of the State Comptroller
Private Employment Patterns Since 1990
Most of the employment trends we have seen in recent years have been developing over a long period. If we look back to 1990, we can see that trends are fairly consistent in most individual employment sectors. The following two charts, Figures 12 and 13, divide the State’s private employment sectors into two groups. The first consists of those that have shown gains since 1990, while the second comprises those with job losses over the period.
Among the gainers, the sector with the most consistent growth has been education and health. The other three sectors – leisure and hospitality, professional services, and the “other services” category (including equipment repair, religious activities, advocacy, laundry services, personal care services, funeral services, pet care services, photofinishing, temporary parking, and dating services) have all shown significant but more volatile growth.
Five other major sectors have shown declines in the total number of jobs since 1990, as illustrated in Figure 13. Two of these (information; and mining, logging and construction) have occasionally risen into positive territory but then slipped below their 1990 level. The remaining three (manufacturing; trade, transportation and utilities; and financial activities) have all remained consistently below their 1990 levels of employment.
Cumulative Percentage Change in Employment - The Winners
GG_2013 Report Tables and Graphs rev2 081313 238pm
-20%
-10%
0%
10%
20%
30%
40%
50%
60%
70%
1990 1993 1996 1999 2002 2005 2008 2011
Education and Health Leisure and Hospitality Other Services Professional Services
Cumulative Percentage Changes in Private Employment–Sectors with Gains
Source: U.S. Bureau of Labor Statistics, annual data, not seasonally adjusted
Figure 12
Cumulative Percentage Change in Employment - The Losers
GG_2013 Report Tables and Graphs rev2 081313 238pm
-60%
-50%
-40%
-30%
-20%
-10%
0%
10%
20%
1990 1993 1996 1999 2002 2005 2008 2011 Financial activities Information Trade, transportation & utilities Manufacturing Mining, logging & construction
Cumulative Percentage Changes in Private Employment–Sectors with Losses
Source: U.S. Bureau of Labor Statistics, annual data, not seasonally adjusted. Note: Mining and Logging are combined with Construction by the Bureau of Labor Statistics in this data series.
Figure 13

Employment Trends in New York State12
Regional Analysis
Another way to analyze employment gains and losses is to look at New York in terms of its geographic regions. Over an extended period, going back to 1990, the regional picture shows significant disparities among areas of New York State. The four charts that follow – Figures 14 through 17 – show changes in private employment since 1990 in the major metropolitan areas of the State. There are two charts showing the larger and smaller regions with relatively higher rates of job growth, and two charts for those regions that have seen only modest gains or job losses over the period.
Regional Employment - Even Bigger Winners
GG_2013 Report Tables and Graphs rev2 081313 238pm
-15%
-10%
-5%
0%
5%
10%
15%
20%
25%
30%
1990 1993 1996 1999 2002 2005 2008 2011
Glens Falls Ithaca
Smaller Upstate Areas with Stronger Job Growth, 1990 - 2012
Figure 15
Source: U.S. Bureau of Labor Statistics, annual data, not seasonally adjusted
Regional Employment - The Winners
GG_2013 Report Tables and Graphs rev2 081313 238pm
-15%
-10%
-5%
0%
5%
10%
15%
20%
25%
30%
1990 1993 1996 1999 2002 2005 2008 2011
New York City Nassau-Suffolk Hudson Valley Capital District
Larger Urban Areas with Stronger Job Growth, 1990 - 2012
Figure 14
Source: U.S. Bureau of Labor Statistics, annual data, not seasonally adjusted

13Office of the State Comptroller
New York City, Long Island and the Hudson Valley saw job gains over this longer period. In the upstate regions around Albany, Glens Falls and Ithaca, private employment was up by double-digit percentages over the period. Most other upstate regions have seen private sector employment decline, with Rochester showing a modest gain. All the regions of the State, except Ithaca, were well below the national private employment growth rate of 22.8 percent over the period. As shown in the Appendix, however, most regions of the State – whether upstate or downstate – outperformed the nation during the five-year period ending in 2012.
Regional Employment - The Smaller Losers
GG_2013 Report Tables and Graphs rev2 081313 238pm
-15%
-10%
-5%
0%
5%
10%
15%
20%
25%
30%
1990 1993 1996 1999 2002 2005 2008 2011
Binghamton Elmira Utica-Rome
Smaller Upstate Regions with Job Losses, 1990 - 2012
Figure 17
Source: U.S. Bureau of Labor Statistics, annual data, not seasonally adjusted
Regional Employment - The Losers
GG_2013 Report Tables and Graphs rev2 081313 238pm
-15%
-10%
-5%
0%
5%
10%
15%
20%
25%
30%
1990 1993 1996 1999 2002 2005 2008 2011
Rochester Buffalo-Niagara Falls Syracuse
Larger Upstate Urban Regions with Slow Growth or Job Losses, 1990 - 2012
Figure 16
Source: U.S. Bureau of Labor Statistics, annual data, not seasonally adjusted

Employment Trends in New York State14
Appendix
Ten-Year Change Total Private Goods Producing
Service Providing (Private)
Government
United States 2.52% 2.65% -18.38% 8.14% 1.88%
New York State 3.99% 5.30% -20.70% 9.55% -2.12%
Capital District 1.21% 3.85% -5.69% 5.25% -6.89%
Binghamton -6.50% -8.11% -26.38% -1.63% -0.41%
Buffalo-Niagara Falls -0.15% 0.02% -23.13% 5.92% -0.97%
Elmira -4.09% -2.64% -11.63% 0.00% -10.67%
Glens Falls 5.13% 7.18% -1.11% 9.45% -2.78%
Ithaca 12.42% 11.96% -13.73% 14.81% 15.12%
Kingston -7.10% -8.28% -30.86% -3.62% -3.27%
Nassau-Suffolk 3.39% 3.69% -13.43% 6.78% 1.83%
Poughkeepsie-Newburgh-Middletown 2.91% 4.87% -26.16% 12.15% -4.52%
Rochester 0.00% 0.25% -26.37% 8.85% -1.24%
Syracuse -1.44% -2.10% -25.05% 3.30% 1.57%
Utica-Rome -3.31% -6.82% -25.13% -2.63% 8.94%
New York City 8.25% 10.49% -25.00% 13.77% -3.66%Putnam-Rockland-Westchester 2.06% 3.12% -18.09% 6.69% -3.10%
Note: The Metro regions presented in these tables reflect the Metropolitan Statistical Areas used in reports from the Bureau of Labor Statistics of the U.S. Department of Commerce.
Employment Change in New York Metro Regions Five-Year (2007 – 2012) and Ten-Year (2002 – 2012) Intervals
Five-Year Change Total Private Goods Producing
Service Providing (Private)
Government
United States -2.84% -3.12% -17.20% 0.23% -1.35%
New York State 0.75% 1.47% -14.80% 3.81% -2.70%
Capital District -0.87% 0.71% -3.63% 1.31% -6.03%
Binghamton -5.76% -6.89% -22.07% -1.77% -2.03%
Buffalo-Niagara Falls -0.11% 0.40% -11.39% 2.97% -2.65%
Elmira -3.16% -2.06% -5.00% -1.54% -6.94%
Glens Falls -1.43% -0.22% -6.32% 1.41% -7.08%
Ithaca 5.18% 3.82% -12.00% 5.61% 12.50%
Kingston -5.35% -6.00% -21.13% -3.16% -3.90%
Nassau-Suffolk -0.32% -0.18% -13.09% 2.04% -1.09%
Poughkeepsie-Newburgh-Middletown -1.49% -0.30% -20.76% 3.85% -6.18%
Rochester -0.33% -0.37% -15.42% 3.64% 0.00%
Syracuse -2.57% -3.35% -18.52% -0.18% 1.04%
Utica-Rome -3.60% -3.72% -14.37% -1.69% -2.95%
New York City 3.55% 4.60% -16.16% 6.19% -2.42%Putnam-Rockland-Westchester -2.69% -2.01% -21.31% 1.18% -6.11%

OFFICE OF THE NEW YORK STATE COMPTROLLER
Thomas P. DiNapoli • State Comptroller
Prepared by the Office of Budget and Policy Analysis