thornhill bioenergy feasibility assessment - rdks.bc.ca · we are pleased to submit this...
TRANSCRIPT
ENSC 417 Designing Solutions in Environmental Engineering 2017 Capstone: Thornhill Bioenergy Feasibility Assessment 3333 University Way Prince George, BC V2N 4Z9 December 1st, 2017 Letter of Transmittal
Dear Sir/Madam, We are pleased to submit this engineering feasibility study for a bioenergy facility in Thornhill entitled “Thornhill Bioenergy Feasibility Assessment”. The assessment discusses in detail the findings of the study for developing a bioenergy industry in the Regional District of Kitimat Stikine. The study provides recommendations for using locally available biomass resources for bioenergy development with a focus on producing heat and biochar products. A complete economic, risk, and sustainability assessment of the proposed design is included in the study. The report has followed the given criteria as required by the instructor. Sincerely,
Kirsten Barlow ǀ Alec Busby ǀ Kris Nickerson ǀ Scott Tennant ǀ Georgia Ukpabi
Encl. Feasibility Study

ENSC 417 - Designing Solutions in Environmental Engineering The University of Northern British Columbia
THORNHILL BIOENERGY
FEASIBILITY ASSESSMENT Final Design Report
December 1st, 2017
Kirsten Barlow 230105011 Alec Busby 230102962 Kris Nickerson 230105163 Scott Tennant 230109777
Georgia Ukpabi 230114715

Page | i
CONTENTS 1 Executive Summary .................................................................................................................................... 1
1 Introduction .......................................................................................................................................... 2
1.1 Background ................................................................................................................................. 2
1.2 Problem Statement ..................................................................................................................... 3
2 Project Components ............................................................................................................................. 4
2.1 Location Selection ....................................................................................................................... 4
2.2 Feedstock Source ........................................................................................................................ 6
2.3 Technology & Process Flow ........................................................................................................ 7
2.4 District Heating ......................................................................................................................... 11
2.5 Bioproduct Market .................................................................................................................... 16
3 Economic Analysis ............................................................................................................................... 18
3.1 Capital Investment .................................................................................................................... 18
3.2 Operating & Maintenance Costs ............................................................................................... 19
3.3 Annual Benefits ......................................................................................................................... 19
3.4 Revenue Sensitivity ................................................................................................................... 21
4 Risk ...................................................................................................................................................... 23
4.1 Operational ............................................................................................................................... 23
4.2 Safety ........................................................................................................................................ 24
4.3 Social ......................................................................................................................................... 24
5 Sustainability Assessment ................................................................................................................... 24
5.1 Policy & Regulations.................................................................................................................. 26
5.2 Assessment of Potential Impacts .............................................................................................. 26
5.3 Emissions ................................................................................................................................... 29
6 Alternative Locations, Feedstock & Technology ................................................................................. 33
6.1 Diversifying Feedstock Supply................................................................................................... 33
6.2 District Heating & Electricity Generation Opportunities .......................................................... 33
6.3 Modular & Mobile Systems ...................................................................................................... 35
7 Recommendations .............................................................................................................................. 36
8 REFERENCES ........................................................................................................................................ 37
9 APPENDICES ...................................................................................................................................... A-1
Appendix A – Decision Matrix for Site Location ................................................................................ A-1
Appendix B – Heating Duration Curves .............................................................................................. B-1

Page | ii
Appendix C – District Heating Design for All Locations ...................................................................... C-2
Appendix D – District Heating Pipe Layout for All Locations .......................................................... D-11
Appendix E – Capital & Operating Cost Summary ............................................................................. E-2
Appendix F – Cash Flow Diagram for Thornhill Location ................................................................... F-1
Appendix G – Risk Matrix .................................................................................................................. G-1
Appendix H – Sustainability .............................................................................................................. H-1
Appendix I – Sample Calculations ....................................................................................................... I-1

Page | iii
FIGURES FIGURE 1: ELECTORAL AREA “E” OF THE UNINCORPORATED SETTLEMENT OF THORNHILL ......................................... 2 FIGURE 2: SIMPLIFIED POTENTIAL SITE LAYOUT FOR THORNHILL SITE. ........................................................................ 9 FIGURE 3: A SIMPLIFIED CONCEPTUAL PROCESS FLOW DIAGRAM OF THE BIOENERGY FACILITY. ............................. 11 FIGURE 4: DISTRICT HEATING PIPELINE LAYOUT. ........................................................................................................ 14 FIGURE 5: REVENUE SENSITIVITY FOR BAGGED AND BULK BIOCHAR PRICES AT 60% TOTAL PRODUCTION SOLD. ...... 21 FIGURE 6: PRICE SENSITIVITY BASED ON THE AMOUNT OF PRODUCED BIOCHAR THAT IS EFFECTIVELY SOLD. .......... 22 FIGURE 7: TERRACE HEAT DURATION CURVE. ........................................................................................................... B-1 FIGURE 8: DEASE LAKE HEAT DURATION CURVE. ...................................................................................................... B-1 FIGURE 9: THORNHILL OCP LAND USE PLAN MAP. .................................................................................................... H-1
TABLES TABLE 1: SITE LOCATION SUMMARY OF MAJOR CHARACTERISTICS. ............................................................................. 6 TABLE 2: ESTIMATED FEEDSTOCK COSTS FOR NORTHWEST BC ..................................................................................... 6 TABLE 3: ESTIMATED FEEDSTOCK SUPPLY NEAR TERRACE AND THORNHILL, BC ........................................................... 7 TABLE 4: ENERGY CONTENT AND EXPECTED FLOWRATES OF PROCESS ....................................................................... 8 TABLE 5: ENERGY INPUT AND OUTPUT, AS WELL AS ENERGY ....................................................................................... 8 TABLE 6: SIGNIFICANT SIZING AND OPERATIONAL CONSIDERATIONS FOR FACILITY EQUIPMENT. ............................ 10 TABLE 7: THORNHILL PEAK HEAT DEMAND FOR DISTRICT HEATING SYSTEM. ............................................................ 12 TABLE 8: THORNHILL PIPE SIZING REQUIREMENTS. .................................................................................................... 13 TABLE 9: MONTHLY NATURAL GAS COSTS AND AVERAGE HEAT DEMAND (GJ) FOR DISTRICT HEATING BUILDINGS.15 TABLE 10: CAPITAL COSTS FOR DISTRICT HEATING SYSTEM IN THORNHILL. .............................................................. 16 TABLE 11: AVERAGE RETAIL PRICES OF BIOCHAR PRODUCTS. ..................................................................................... 17 TABLE 12:THORNHILL MAJOR EQUIPMENT CAPITAL COST ESTIMATES. ..................................................................... 18 TABLE 13: ECONOMIC ANALYSIS SUMMARY FOR THORNHILL BIOENERGY FACILITY. .................................................. 20 TABLE 14: NPV SENSITIVITY TO CHANGING FACTORS. ................................................................................................. 21 TABLE 15: PARAMETER RANGES FOR MONTE CARLO SIMULATION. ............................................................................ 22 TABLE 16: RISK MATRIX. .............................................................................................................................................. 23 TABLE 17: VALUED ECOSYSTEM COMPONENTS (VECS) AND POTENTIAL EFFECTS ON THE ENVIRONMENT. ............. 26 TABLE 18: ANNUAL CO2E EMISSIONS FROM THE COMBUSTION OF NATURAL GAS AND WOOD WASTE. ................. 32 TABLE 19: CO2E EMISSIONS FROM THE DELIVERY OF ROADSIDE SLASH. ................................................................... 32 TABLE 20: DEASE LAKE PLANT CAPITAL COST ESTIMATE ........................................................................................... E-2 TABLE 21: TERRACE DOWNTOWN LARGE CAPITAL COST ESTIMATE......................................................................... E-2 TABLE 22: TERRACE DOWNTOWN SMALL CAPITAL COST ESTIMATE ........................................................................ E-2 TABLE 23: TERRACE INDUSTRIAL PLANT CAPITAL COST ESTIMATE ........................................................................... E-2 TABLE 24: THORNHILL PLANT CAPITAL COST ESTIMATE ........................................................................................... E-2 TABLE 25: SUMMARY OF OPERATING AND MAINTENANCE COSTS. ......................................................................... E-3 TABLE 26: COMPLETE MATRIX FOR PROJECT RISKS. ................................................................................................. G-1 TABLE 27: SKEENA SAWMILL (2015) ANNUAL HARVEST BREAKDOWN. ..................................................................... I-4 TABLE 28: SMALL-SCALE MILLS IN THE KALUM-KISPIOX REGION (2005) ANNUAL HARVEST BREAKDOWN. ............. I-4

Page | iv
LIST OF ACRONYMS
bf Board Feet CEAA Canadian Environmental Assessment Agency CEEI Community Energy and Emissions Inventory CO2e Carbon Dioxide Equivalents COD Commercial Operation Date EAO Environmental Assessment Office ECCC Environment and Climate Change Canada EPA Electricity Purchase Agreement GHG Greenhouse Gas GHGRP Greenhouse Gas Emissions Reporting Program GJ Giga Joule HJBEP Haines Junction Biomass Energy Project ICE Internal Combustion Engine IPCC Intergovernmental Panel on Climate Change NALS Northern Analytical Laboratory Services ODT Oven Dry Tonne PNCDS Pacific North Coast Development Society RDKS Regional District of Kitimat Stikine SNCIRE Skeena-Nass Centre for Innovation in Resource Economics SOP Standing Offer Program t Metric Tonne UNBC University of Northern British Columbia UNFCCC United Nations Framework Convention on Climate Change VECs Valued Ecosystem Components

Page | 1
1 EXECUTIVE SUMMARY This project presents a feasibility assessment for a bioenergy facility in Thornhill, BC. Five
site locations were assessed for their optimality with regards to district heat demand, social
impacts, and capital investment. We are pleased to have determined the Thornhill site as the top
choice to invest in for developing a future bioenergy industry within the Regional District of
Kitimat Stikine (RDKS).
The proposed design consists of a pyrolysis-gasifier system integrated with a district
heating system. Feedstock sourced from small-scale sawmills within the RDKS is expected to
meet the demand of 4,617 ODT of woody biomass on an annual basis to fuel the 527 kg/hr
facility. This feedstock is a combination of roadside slash and sawmill residues, and is expected to
be purchased at an average price of $49.50 per tonne.
The pyrolysis system is designed to annually produce approximately 1,614 tonnes of
biochar to market. Biochar as a soil amendment in bulk and bag form is estimated to sell at a
wholesale price of $400 per tonne and $35 per bag. Excess heat can be cost-effectively
distributed to the surrounding residential and commercial buildings as the plant is designed to
provide 80% of the peak energy demand, approximately 40,291 GJ yearly. Electricity generated
from syngas combustion can be used to power the facility’s operations and offset electrical costs
completely.
Project deliverables include:
a. Process flow of proposed technology
b. District heating system design for optimal location
c. Economic analysis including Class D cost estimates and sensitivity analysis
d. Sustainability assessment on the social, economical and environmental impacts
This report offers a sustainable, feasible, and progressive conceptual design that supports
the regional district’s intent to utilize forestry residuals, enhance local economy, and encourage
alternative energy initiatives in Northwest British Columbia.

Page | 2
1 INTRODUCTION
1.1 Background The purpose of this report is to propose and justify the development of a bioenergy
industry in Thornhill, BC. An investigation into available bioenergy technologies with scalable and
flexible capabilities, and the determination of an optimal size and type of facility for the Thornhill
site that meets the energy demand is proposed. A complete economic, risk, and sustainability
assessment is conducted to establish our final recommendations. The information presented is
intended to form a basis for assessing project feasibility.
Thornhill is an unincorporated settlement located approximately 575 kilometres west of
Prince George, in the Regional District of Kitimat Stikine (RDKS), and situated on the east bank of
the Skeena River directly across from the City of Terrace (Figure 1). Thornhill is within the
traditional territories of Kitselas, Kitsumkalum, Lax Kwa’laams, and Metlakatla First Nations
(Urban System Ltd., 2017). In 2016, the reported population was 3,993 and showing growth of a
mere 0.1% since 2011 (Canada, G. O., 2017). The total land area of the settlement is 16.5 square
kilometres.
Figure 1: Electoral Area “E” of the unincorporated settlement of Thornhill
.
http://www.rdks.bc.ca/sites/default/files/2017-07-06-thornhill_ocp_draft_for_website.pdf

Page | 3
The Skeena-Nass Forest is home to the majority of forest resources within the RDKS and
Thornhill lies predominantly in the biogeoclimatic zone of Coastal Western Hemlock Wet Sub-
maritime with the dominant tree species being Western Red Cedar, Western Hemlock, Balsam
and Sitka Spruce (Urban System Ltd., 2017). With hemlock in the range of 35% to 75% and
balsam making up 19% to 38% of this forest inventory, the species mix is commonly referred to
as hem-fir and is known for having low-quality high-moisture characteristics that make the area
economically challenging to harvest (SNCIRE, 2013).
1.2 Problem Statement Prior to 2000, Northwest BC’s forest industry was operating in full force with 17 major
timber processing facilities and approximately 5,000 direct jobs. A combination of factors,
including the high percent of low-value hem-fir logs, led to an industry collapse. By 2013, the
number of major timber processing facilities had declined to five with an approximate 700
remaining employees (SNCIRE, 2013). In response to this downturn, RDKS has invested research
efforts in exploring emerging bioenergy technology with the goal of renewing Northwest BC’s
forest economy.
A typical BC sawmill’s log input produces 40% residual wood chips and 12% sawdust or
shavings (SNCIRE, 2013). This near 50:50 waste to lumber ratio is what makes generating a profit
from wood waste material of high economic value to sawmills in the region. Bioenergy
technology allows mills to dispose of residual wood waste in a manner that is carbon neutral, if
not carbon negative, while also benefiting from heat and electricity production, as well as
marketable bioproducts.
There have been several demonstration and pilot plants proposed in Northwest BC aimed
at producing bioproducts and combined heat and power, however, none have been executed to
date. Currently, the regional district has expressed interest in a local bioenergy company, BC
Biocarbon, based out of McBride. BC Biocarbon’s slow-pyrolysis system effectively reduces high-
moisture wood waste into biochar, bio-oil, and syngas. This technology, along with similar
bioenergy processes, was explored for this study to determine the optimal location, size, and
bioproduct streams that will contribute to an economic renewal of the region’s forest industry.

Page | 4
2 PROJECT COMPONENTS
2.1 Location Selection Site selection was a major part of the design process. Site characteristics initially
considered for choosing the facility location include zoning, district heating demand, and land
availability. An initial survey of orthographic photos and maps of Thornhill, Terrace, and Dease
Lake was conducted to select four potentially suitable sites located on different lots and
exhibiting different strengths and weaknesses to be explored for the design. From these four
lots, five scenarios were considered: Terrace Downtown Small-Scale, Terrace Downtown Large-
Scale, Thornhill, Dease Lake, and Terrace Industrial.
Information on the properties was gathered and district heating scenarios were
developed for each site using a variety of sources including online GIS systems (Regional District
of Kitimat Stikine, 2017) and BC Assessment (2017). The size of each district heating scenario
varied, primarily due to the density of buildings in the immediate vicinity, and professional
judgement helped to determine which buildings to consider. The district heating scenario was
built out and specified for each of the scenarios using historical heat duration curves (Helle,
2017). These district heating scenarios were then directly applied to determine the appropriate
process size to provide 80% of the maximum heat demand. In this way, the selected sites had a
direct impact on the final process. In determining the most optimal site, factors in the following
categories were considered: district heating; social considerations; practical considerations;
feedstock; bioproduct; and economics. Full descriptions of these categories and rating results
are provided in Appendix A.
District heating considerations focused on the value of each system in terms of the
capital cost per unit heat provided, as well as the percentage of the district heating capital costs
allocated to piping costs. The latter indicator was used as an analog for efficiency wherein a
system with less piping to deliver a specific amount of heat has higher density, and is more
efficient in terms of energy losses and initial investment.
Social factors were assessed on the location’s proximity to sensitive land uses, such as
residential and commercial structures, and whether trucking routes went through urban areas.
These factors were evaluated with orthographic maps, community plans, and best judgement. A

Page | 5
site located on a main highway or in an industrial zone was considered to have a low trucking
impact, whereas a location within town and away from normal industrial areas posed a higher
trucking impact. Sensitive land uses were judged by building type, and residential or light
commercial buildings were considered sensitive land uses and scored lower in this aspect.
Practical considerations included the zoning, the cost and surface area of the lot,
whether the lots required clearing, the distance to markets, and the attractiveness of expanding
electricity production in the future. These considerations were meant to represent, in part, how
challenging and expensive it would be to establish a plant on each site. The attractiveness of
expanding into electricity was meant to give an advantage to the Dease Lake site since it is an
off-grid community. In general, electricity is more expensive in off-grid locations, and the process
for getting approved to sell power is less restrictive in off-grid communities.
The final considerations rated feedstock price and supply, financial performance, and
financial risk. The price and supply of feedstock was used to separate the Terrace sites from the
Dease Lake site; the presence of sawmills and logging activity near Terrace implied a larger
supply of lower price feedstock. The indicators of financial performance and financial risk were
both normalized by capital cost to lessen the bias towards selecting a larger facility. For both
considerations, a Monte Carlo simulation of the facility at each site was performed. The mean
net present value (NPV) normalized by the mean capital cost served as the financial performance
indicator. The standard deviation of the NPV normalized by the mean capital cost was used as
the financial risk indicator.
The decision matrix used both quantitative and judgmental considerations, normalized to
a 5-point scale to perform the comparison. Each consideration was then given a weight, also on a
5-point scale, based on the perceived relative importance of those considerations. Based on the
weighted decision matrix, the Thornhill site was selected for an in-depth economic analysis and
site layout. The Terrace industrial site came a close second, with the Dease Lake site exhibiting
the worst performance. Major characteristics for each site are summarized in Table 1 below.

Page | 6
Table 1: Site location summary of major characteristics.
2.2 Feedstock Source The feedstock requirement for the Thornhill plant has been estimated at 4,617 ODT/yr.
Feedstock sources should be acquired at an acceptable cost to meet this requirement. Typical
feedstock costs for Northwest BC are shown in Table 2 based on values from Sauder (2012). The
cost of delivered logs in the region are high due to challenging terrain and high decay factors.
Furthermore, whole logs and chipped logs from the forest are assumed to incur costs due to
development, harvesting and silviculture.
Table 2: Estimated feedstock costs for Northwest BC
Source Cost/Odt
Delivered log costs1 $151-157
In-woods chipped log costs1 $130-145
In-woods residue chipping costs1 $55-85
Assumed sawmill hog fuel costs1 $25-30
Assumed maximum acceptable feedstock price (CHP) 1 $60
Assumed feedstock costs for the Thornhill plant $50 1Sauder, 2012
Table 2 shows that forest residues are a lower cost option. Forest slash is estimated to be
abundant in the region, as seen in Table 2 (see details in Appendix II). The current practice is to
burn forest slash to decrease the fire hazard and improve forest accessibility. The plant must be
able to source enough biomass within a reasonable distance to meet feedstock requirements.
Technical limitations of machinery and operations for extracting forest residues adds additional
costs and restricts the amount of residues that can be collected (Yemshanov et al., 2014).
Site Land Value Lot Size
(m2)Zoning
Heat provided/
District Heating
Capital (GJ/$)
Net Present
ValueCapital
Standard
Deviation/
Capital
Decision
Matrix
Score
Terrace
Downtown
Large
318,000$ 4200 Light Industrial 14.6 $ 12,354,457 $ 8,367,673 1.03 91
Terrace
Downtown
Small
318,000$ 4200 Light Industrial 18.5 $ 429,537 $ 4,232,408 0.88 92
Terrace
Industrial275,000$ 9650 Industrial 13.7 $ 6,771,972 $ 6,171,817 1.05 125
Thornhill 242,000$ 7500Light Industrial/
Highway Commercial10.5 $ 551,984 $ 3,874,993 0.97 129
Dease Lake 24,700$ 4000 ICI 16 $ (9,740,487) $ 2,780,216 0.75 70

Page | 7
Table 3: Estimated feedstock supply near Terrace and Thornhill, BC
Feedstock source Sawmill chips (ODT/y)
Roadside slash (ODT/y)
Skeena sawmill (2015) 71,200 45,800
Small-scale mills (2005) 8,800 5,680
Total 80,000 51,480
Sawmill chips are considered the lowest cost option in Table 2. Sources of these residues
include the large and small-scale mills near Thornhill (see Table 3). Skeena Sawmill could serve as
a potential source of low cost wood chips. An IFS report for BC Hydro states there is currently no
buyer or outlet for the residual fibre in the region, and it is either stockpiled or land-filled since
the regional pulp mills shut down. However, it should be noted that there is indication Skeena
Sawmill is currently in the design phase of a new pellet plant with a capacity of 96,000 ton/yr
(87,000 tonnes/yr) from wood chips and shavings (Prodesa, 2017). Pellet plants typically require
clean wood chips and shavings to produce high quality pellets with low ash content (ENVINT,
2010). In such circumstances, Skeena Sawmill could be a potential source of hog fuel and lower
grade chips.
It is recommended that low costs sawmill residues be sourced. However, if mill sources
become uncertain or unavailable, another option is forest slash. An assumed feedstock cost for
the Thornhill plant was set at $50/ODT for this reason. Guaranteeing a cost-effective, long term
feedstock source is a way to minimize this risk. In addition, integrating different supply chains
can also mitigate this risk. Long-term supply contracts can be used as a source guarantee and
hedge against fluctuations in feedstock costs.
2.3 Technology & Process Flow
Process Sizing
An energy and mass balance approach was used to specify the major process equipment.
The process was sized based on the district heating system that was specified for each location;
the maximum heat output was set to be the amount of heat required to meet 80% of peak
energy demand. From that energy demand, and the expected energy demand for an internal
combustion engine used to provide the internal electricity requirements, the peak gas demand

Page | 8
for the system was calculated, using a literature value for the energy content of gasifier gas
(Basu, 2013). From the peak gas requirement, a gasifier was specified, using a literature value for
the efficiency of the gasifier (Basu, 2013). Based on the expected energy content and makeup of
the output from the pyrolysis unit, and the required energy to the gasifier, the size of the
pyrolysis unit was specified. In sizing for peak demand, it was assumed that all of the biochar
from the pyrolysis unit would be gasified at peak demand, and at lower demand the biochar not
required by the system would be kept aside for sale. The main assumption made about the
pyrolysis unit was the product breakdown (25% biochar, 25% pyrolysis gas, 50% pyrolysis oil),
which was based off of literature values (Basu, 2013). The energy content and chemical
composition of a representative sample of chips, as well as biochar produced by BC Biocarbon,
was determined by Northern Analytical Laboratory Services (NALS) at UNBC. These values are
within the range specified in the literature, so they were utilized in the calculations. The rest of
the energy values were literature based (Basu, 2013). A rough site layout is presented on the
next page.
Table 4: Energy content and expected flowrates of process products and intermediates at maximum heat demand.
Table 5: Energy input and output, as well as energy efficiency for key processes at maximum heat demand.
LHV, Dry Basis
(kJ/kg)
Flow Rates, Dry Basis
(kg/hr)
Chips 18157 527
Biochar 27523 132
Pyrolysis Oil 13000 264
Pyrolysis Gas 11000 132
Gasifier Gas 4000 1701
Energy (kW) Efficiency
Pyrolysis Input 2658
Pyrolysis Output 2362
Gasifier Input 2362
Gasifier Output 1889
Engine Input 358
Engine Output 86
Boiler Input 1531
Boiler Output 1378
89%
80%
24%
90%

Page | 9
This design gives a range of variability in operation; with the limiting steps being the
pyrolysis unit and the gasifier, due to the limitations on the low end of their operation. The
natural gas boiler has a high range of turndown, so it can run on any amount of gas that the
gasifier provides. The gasifier has a limited turndown; however, if the minimum heat production
exceeds the required heat production, then the excess gas can be flared.
If there is excess biochar that cannot be sold, that biochar can be used to displace fuel.
The pyrolysis unit can be run at the lowest end of production and excess stored biochar can be
fed into the gasifier along with all current products of the pyrolysis unit. If the pyrolysis vessel
has to be shut down, then the gasifier can be run on stored biochar until the pyrolysis process is
operating again. This method would reduce profits if that biochar could be sold otherwise, but it
would ensure that constant heat is supplied to the consumers, and displace fuel costs. Due to
the higher unit value of biochar than the feedstock chips, this operating method is not
economically beneficial. However; if that biochar would otherwise have to be given away or sold
at a very low rate, then offsetting fuel costs and maintaining the sale of heat would be beneficial.
Figure 2: Simplified potential site layout for Thornhill site.

Page | 10
Table 6: Significant sizing and operational considerations for facility equipment.
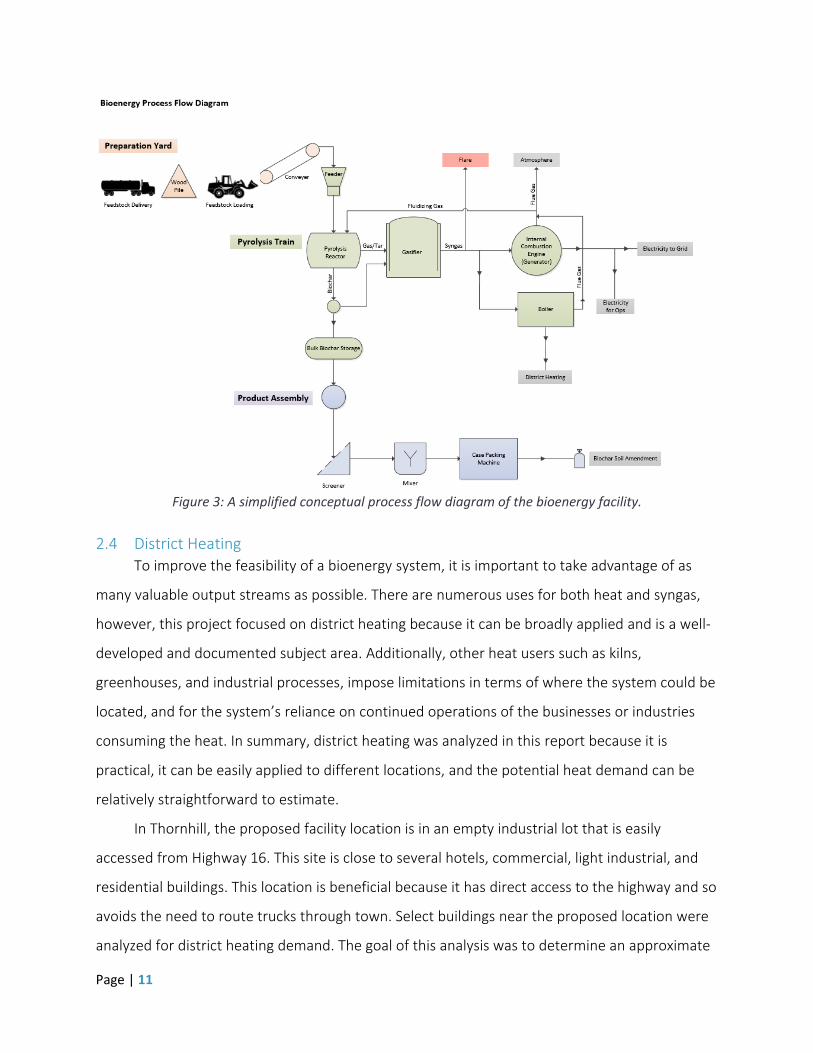
Conceptual Process Flow
Starting in the preparation yard, wood waste is collected and conveyed into the pyrolysis
reactor. Gas and tar produced in the pyrolyzer is sent to a gasifier and further conditioned into a
cleaner syngas. The syngas can either be both fed into an internal combustion engine (ICE) for
electricity generation, and to a natural gas boiler for district heating. Flue gas exiting the ICE and
boiler is emitted to the atmosphere. Biochar produced during pyrolysis is either gasified, stored
as bulk, or further manufactured into a bagged soil amendment. Please see Figure 3 below.
Page | 11
Figure 3: A simplified conceptual process flow diagram of the bioenergy facility.
2.4 District Heating
To improve the feasibility of a bioenergy system, it is important to take advantage of as
many valuable output streams as possible. There are numerous uses for both heat and syngas,
however, this project focused on district heating because it can be broadly applied and is a well-
developed and documented subject area. Additionally, other heat users such as kilns,
greenhouses, and industrial processes, impose limitations in terms of where the system could be
located, and for the system’s reliance on continued operations of the businesses or industries
consuming the heat. In summary, district heating was analyzed in this report because it is
practical, it can be easily applied to different locations, and the potential heat demand can be
relatively straightforward to estimate.
In Thornhill, the proposed facility location is in an empty industrial lot that is easily
accessed from Highway 16. This site is close to several hotels, commercial, light industrial, and
residential buildings. This location is beneficial because it has direct access to the highway and so
avoids the need to route trucks through town. Select buildings near the proposed location were
analyzed for district heating demand. The goal of this analysis was to determine an approximate
Page | 12
heat demand and to ensure there were enough potential customers within reasonable distance
to the plant to ensure district heating would be economically viable.
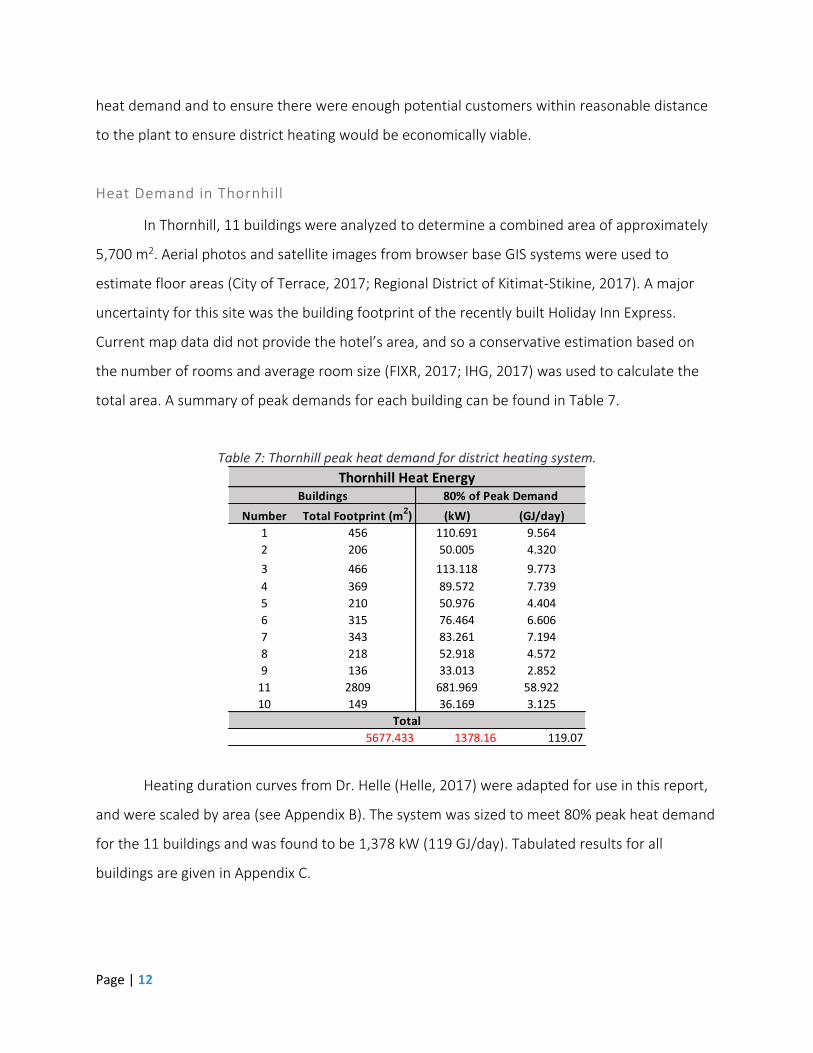
Heat Demand in Thornhill
In Thornhill, 11 buildings were analyzed to determine a combined area of approximately
5,700 m2. Aerial photos and satellite images from browser base GIS systems were used to
estimate floor areas (City of Terrace, 2017; Regional District of Kitimat-Stikine, 2017). A major
uncertainty for this site was the building footprint of the recently built Holiday Inn Express.
Current map data did not provide the hotel’s area, and so a conservative estimation based on
the number of rooms and average room size (FIXR, 2017; IHG, 2017) was used to calculate the
total area. A summary of peak demands for each building can be found in Table 7.
Table 7: Thornhill peak heat demand for district heating system.
Heating duration curves from Dr. Helle (Helle, 2017) were adapted for use in this report,
and were scaled by area (see Appendix B). The system was sized to meet 80% peak heat demand
for the 11 buildings and was found to be 1,378 kW (119 GJ/day). Tabulated results for all
buildings are given in Appendix C.
Number Total Footprint (m2) (kW) (GJ/day)
1 456 110.691 9.564
2 206 50.005 4.320
3 466 113.118 9.773
4 369 89.572 7.739
5 210 50.976 4.404
6 315 76.464 6.606
7 343 83.261 7.194
8 218 52.918 4.572
9 136 33.013 2.852
11 2809 681.969 58.922
10 149 36.169 3.125
5677.433 1378.16 119.07
Total
Thornhill Heat EnergyBuildings 80% of Peak Demand

Page | 13
Pipe Design
It is recommended that the district heating system be constructed from pre-insulated
PEX piping from Uponor. The pipes come in twin and single tubed pipes and can be placed
directly into pre-dug trenches. They have the added benefit of being able to circumvent
obstacles, such as boulders, this flexibility will cut down on installation costs. The pipes are
bought in large coils up to 1,000 feet in length which decreases pipe connections and further
minimizes costs.
Pipe sizing used the specific heat formula and was based on peak heat demand. Delta T
was approximated based on rules of thumb at a 30 degree drop from 85C-55C (Helle, 2017).
This formula was also used to calculate the required mass flow of the water travelling through
the pipes. The volume of water was determined using 2 m/s water velocity (Helle, 2017), and this
then lead to appropriate pipe diameter sizes for each line of the district heating system.
Table 8: Thornhill pipe sizing requirements.
Mass Flow
(kg/day)
Volume Flow
(m3/s)
Pipe Diameter
(inch)
Required Pipe Size to
Deliver Demand (inch)
76192.44 0.000882 0.9328 1
34420.27 0.000398 0.6270 1
77863.33 0.000901 0.9430 1
61655.73 0.000714 0.8391 1
35088.63 0.000406 0.6330 1
52632.94 0.000609 0.7753 1
57311.42 0.000663 0.8090 1
36425.34 0.000422 0.6450 1
22724.06 0.000263 0.5094 1
469424.49 0.005433 2.3154 2.5
24896.22 0.000288 0.5332 1
948635 0.0110 2.87 3
1.62 1.5
Thornhill Pipe Design
Total To Buildings in Line 1
To Buildings in Line 2
Maximum Energy Delivery (kW)
1378.16

Page | 14
Pipe Layout
The layout of the district heating system consists of two main pipelines leaving the site in
opposite directions. Line 1 is a 150m long 3-inch single pipe (Uponor twin pipes have a maximum
diameter of 2.5-inch) with an identical return pipe and leads southwest to buildings 1, 2, 3, 4,
and 11. Line 2 leads northeast connecting buildings 5, 6, 7, 8, 9, and 10, and splitting at
Desjardins Avenue. Line 2 then travels east for 115m to connect buildings 8, 9, and 10. An
orthographic view of the system layout is shown below.
Figure 4: District heating pipeline layout.
Current Energy
The site’s natural gas usage was researched to assess how much residents currently pay
for heat, and to get an idea of how to structure the system’s heat delivery. Terrace and Thornhill
residents are currently supplied with natural gas from Pacific Northern Gas Limited. Consumers
are charged a basic monthly rate coupled with a delivery and usage charge (PNG, 2017). These
charges depend on a “rate class” that is assigned according to zoning and activity that occurs on
the property.
The Thornhill site is largely zoned as M1-Light Industrial. This corresponds to a $410
monthly charge and one of the lowest usage rates of approximately $5.80/GJ. The largest

Page | 15
building in the district heating plan is the Holiday Inn and is zoned as C3-Highway Commercial. It
has a higher than average usage rate of approximately $10.60/GJ and accounts for 56% of the
total cost to heat the 11 buildings. The monthly GJ demand and charge for each building is
shown below in Table 9.
Table 9: Monthly natural gas costs and average heat demand (GJ) for district heating buildings.
Costs
The capital costs for installing a district heating system in Thornhill are split into two main
groups, the pipeline and the boiler system, each accounting for roughly 50% of the costs. As
mentioned previously, pipes were sourced from Uponor and cost $251.30 per meter of 3-inch
single pre-insulated pipe, and $173.70 per meter for the 1.5-inch twin pre-insulated pipe.
Installation costs for the pipes were determined based on reports of similar district heating
systems in the Kitimat-Stikine area, and were estimated to $200 per meter (Nairne, 2014;
Wunderlin, 2012; FVB Energy, 2011). The installation included trench digging, pipe fitting,
connections, labor etc. Boiler costs were determined using a common rule of thumb for
installation, engineering, and other equipment costs of about 3 times the capital cost for the
purchased boiler (Turton, 2009). Energy transfer station costs were approximated per m2 using
Average Heat
Demand (GJ/month)
Zone Base Monthly
Charge ($)
Average Monthly
Metered Charge ($)
Total Monthly
Charge ($)
255.36 M1 - light industrial 410 1559.55 1969.55
115.36 M1 - light industrial 410 704.53 1114.53
260.96 M1 - light industrial 410 1593.75 2003.75
206.64 M1 - light industrial 410 1262.00 1672.00
117.6 M1 - light industrial 410 718.21 1128.21
176.4 M1 - light industrial 410 1077.32 1487.32
192.08 M1 - light industrial 410 1173.08 1583.08
122.08 M1 - light industrial 410 745.57 1155.57
76.16 M1 - light industrial 410 465.13 875.13
1573.28 C3 - highway commercial 150 17570.35 17720.35
83.44 M1 - light industrial 410 509.59 927.52
3179 27,379.10$ 31,637.03$
Thornhill Current Heating CostsBuildings Natural Gas Costs
Total

Page | 16
numbers from the same reports of the installed district heating systems from nearby
communities (Nairne, 2014; Wunderlin, 2012; FVB Energy, 2011); this totaled to approximately
$7.40/m2. Exact capital costs are detailed in Table 10.
Table 10: Capital costs for district heating system in Thornhill.
2.5 Bioproduct Market
Apart from heat, a major by-product of the pyrolysis process is biochar. Since the facility
will output approximately 1,614 tonnes of biochar annually, it is highly recommended to explore
revenue options for generating a profit from this waste stream. Potential biochar products
requiring refining, such as activated carbon, were omitted from bioproduct options to keep
capital costs and operating requirements to a minimum.
Current retail prices of brand name bioproducts were averaged for bulk biochar soil
amendment, bagged biochar soil amendment, and bagged charcoal briquettes (see Table 11).
These prices are based on the average biochar bulk density of 264 kg/m3, the average charcoal
briquette density of 408 kg/m3, and the average bulk biochar market prices of $0.89 to $1.00
(USD) per pound (IBI, 2017 & The Char Team, 2015). These price estimates are expected to
change once a more precise characterization of the facility’s biochar bulk density is tested and
confirmed.
Pipe Length (m) 150
Pipe Cost ($) 75,393.00
Installation Costs ($) 30,000.00
Pipe Length (m) 260
Pipe Cost ($) 45,151.60
Installation Costs ($) 52,000.00
Energy Transfer Station Costs ($) 42,013.00
Boiler Cost ($) 38,588.36
Installation, Engineering, and Minor Equipment ($) 115,765.08
Total Cost ($) 398,911.04$
Thornhill District Heat System Cost
Line 1
Line 2

Page | 17
Table 11: Average retail prices of biochar products.
Bulk sales to agriculture on a contractual basis is an effective way to help ensure a fast
product turnover, to secure a steady revenue, and to minimize the burden of storing unsold
individually bagged products.
Biochar as a soil amendment does not need extensive applications to be effective. For
this reason, individually bagged biochar products are not likely to be bought very frequently
since gardeners do not need to use a lot of the product when applying it to their soils. To
maintain a steady consumer base, it is recommended that the soil amendment be marketed
internationally through an online platform, as is currently practiced by other successful
companies in this industry.
In comparison with the soil amendment option that requires no further processing to
create a final product, biochar briquettes may require the addition of a binding agent, such as
coal tar pitch, to help densify the briquette. Although the capital cost of a briquetting machine
may increase production costs for bagged briquettes, there may also be an opportunity to utilize
the machine for feedstock preparation of non-uniform or small-diameter wood wastes.

Page | 18
3 ECONOMIC ANALYSIS
3.1 Capital Investment
Installed capital cost estimates for the Thornhill plant are shown in Table 12. The values
are based on data from the EPA Biomass CHP Catalog of Technologies (2007), which were
obtained from published estimates and discussions with equipment suppliers by the Antares
Group, Inc. (2003). Plant costs depend on several major process steps including: biomass
collection, preprocessing, biomass conversion, gas cleanup, and product utilization. The main
cost for the pyrolysis-gasification train is the reactors, gas cleanup and syngas cooling. This
typically involves ash removal, quench, bag filter, wet scrubber, and heat exchangers. Heat
exchangers can provide heat to other parts of the process or contribute to district heating.
Table 12:Thornhill major equipment capital cost estimates.
Component Unit Quantity Unit cost Amount
Detailed feasibility study cost 1 $10,000.00 $10,000.00
Development cost 1 $10,000.00 $10,000.00
Pyrolysis and gasifier system kW 1889 $529.54 $1,000,530.38
ICE-genset kW 86 $1,101.49 $94,727.79
Biomass storage and handling kW 1464 $1,088.12 $1,593,010.17
Engineering % 10% $2,708,268.33 $270,826.83 Contingency % 10% $2,708,268.33 $270,826.83
Total cost $3,249,922.00
The capital cost estimate assumes the gasifier system operates with air at atmospheric
pressure and produces a low energy gas, typically from 4 to 6 MJ/m3 (EPA, 2007). The syngas
produced (1,889 kW) is used in different ways. A portion is sent to an ICE to generate a small
amount of electricity (86 kW), but the majority goes into district heating (1,378 kW). The cost for
biomass storage and product handling is another large costs for the plant, which has a calculated
feedstock requirement of 4,617 ODT/yr. Assumed costs for other plant requirements, such as
supplementary studies, development, engineering and contingency, have also been included as
shown in Table 12.
The total fixed capital investment for the Thornhill bioenergy facility is $3.89 million. This
cost includes the district heating system and boiler, the assessed land value of the chosen site,

Page | 19
and major equipment installed costs. To offset capital investment, potential project funding may
be available under the Northern Development Initiative Trust Funding Programs, the Federation
of Canadian Municipalities Green Municipal Fund, and the Innovative Clean Energy (ICE) Fund.
3.2 Operating & Maintenance Costs
Annual operating and maintenance costs amount to $1.62 million and are based on
feasibility level cost estimates adapted from (Turton, 2009). Of this total, approximately
$228,500 is allocated to purchasing feedstock at an average estimated cost of $49.50 per ODT.
Feedstock sourced from small-scale sawmills is estimated to provide 14,480 ODT/yr of wood
chips and slash, and the 527 kg/hr facility requires only 4,617 ODT/yr of this available fuel.
An estimated three to four plant operators are required year-round (49 weeks of the year to
account for holidays) on a 3-shift per day basis. Additional personnel to manage, coordinate, and
supervise operations are also accounted for in labour costs. It is expected that seasonal labour
for product assembly will be required for 4 months of the year when biochar products will be
manufactured.
Utilities costs omit water usage and waste treatment, and electricity consumption is
assumed negligible since operations are expected to run on the electricity produced from the
syngas combustion process. A complete table of operating and maintenance cost estimates for
the five potential locations is provided in Appendix E.
3.3 Annual Benefits
The Thornhill facility is designed to incur revenue from heat, and bulk and bagged biochar. A
revenue scenario was analyzed based on conservative parameters that included selling heat for
30% lower than the current average natural gas rate (~$14 per GJ natural gas is the average price
for all rate cases) at $11.44 per GJ, a discount rate of 5%, capital and operating costs inflated by
30%, and revenue incurred from 60% of the total annual biochar production.
Due to the minimal amount of farmland in central BC that could potentially secure a bulk
biochar market, the ratio of bioproduct sales was set to 40% bulk and 60% bagged. This ratio also
reflects the global biochar market where the majority of biochar sales (>90%) is attributed to
high-end niche markets like bagged soil amendment with the remainder sold for remediation
and agricultural purposes (Jirka, 2014). Briquettes were omitted from this scenario due to their
Page | 20
mediocre average retail price as well as to avoid manufacturing costs of a briquetting machine
and binding agent.
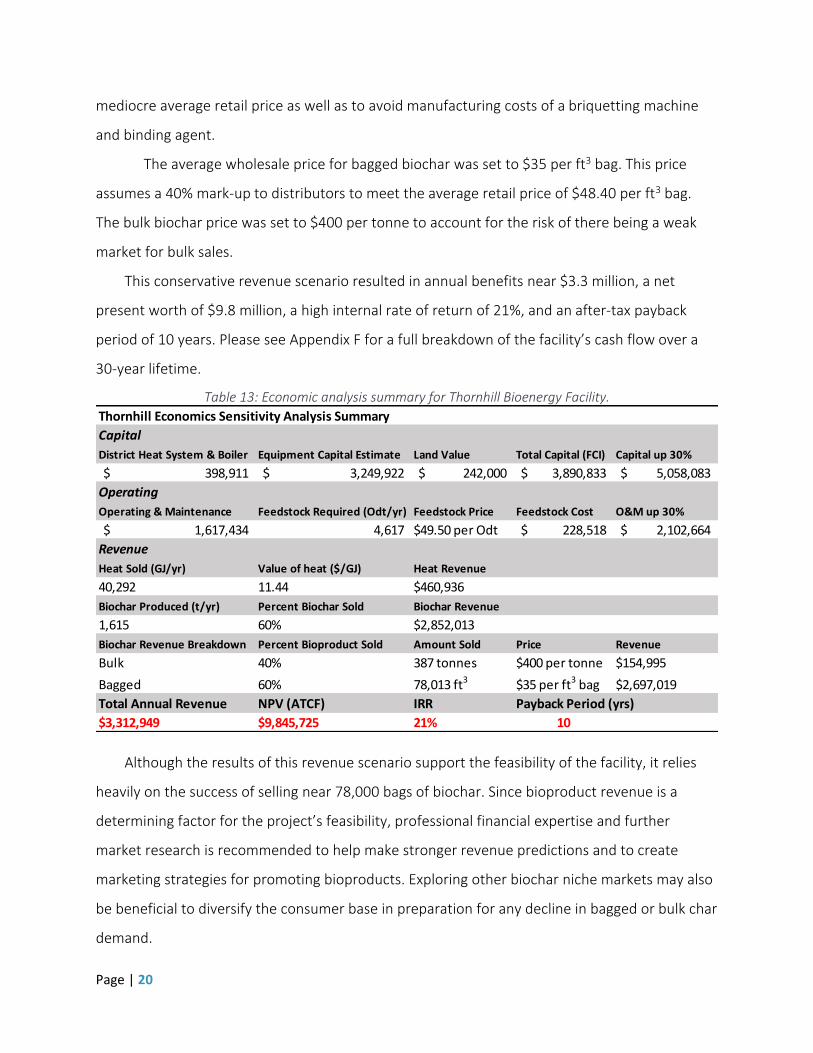
The average wholesale price for bagged biochar was set to $35 per ft3 bag. This price
assumes a 40% mark-up to distributors to meet the average retail price of $48.40 per ft3 bag.
The bulk biochar price was set to $400 per tonne to account for the risk of there being a weak
market for bulk sales.
This conservative revenue scenario resulted in annual benefits near $3.3 million, a net
present worth of $9.8 million, a high internal rate of return of 21%, and an after-tax payback
period of 10 years. Please see Appendix F for a full breakdown of the facility’s cash flow over a
30-year lifetime.
Table 13: Economic analysis summary for Thornhill Bioenergy Facility.
Although the results of this revenue scenario support the feasibility of the facility, it relies
heavily on the success of selling near 78,000 bags of biochar. Since bioproduct revenue is a
determining factor for the project’s feasibility, professional financial expertise and further
market research is recommended to help make stronger revenue predictions and to create
marketing strategies for promoting bioproducts. Exploring other biochar niche markets may also
be beneficial to diversify the consumer base in preparation for any decline in bagged or bulk char
demand.
Thornhill Economics Sensitivity Analysis Summary
Capital
District Heat System & Boiler Equipment Capital Estimate Land Value Total Capital (FCI) Capital up 30%
398,911$ 3,249,922$ 242,000$ 3,890,833$ 5,058,083$
Operating
Operating & Maintenance Feedstock Required (Odt/yr) Feedstock Price Feedstock Cost O&M up 30%
1,617,434$ 4,617 $49.50 per Odt 228,518$ 2,102,664$
Revenue
Heat Sold (GJ/yr) Value of heat ($/GJ) Heat Revenue
40,292 11.44 $460,936
Biochar Produced (t/yr) Percent Biochar Sold Biochar Revenue
1,615 60% $2,852,013
Biochar Revenue Breakdown Percent Bioproduct Sold Amount Sold Price Revenue
Bulk 40% 387 tonnes $400 per tonne $154,995
Bagged 60% 78,013 ft3 $35 per ft3 bag $2,697,019
Total Annual Revenue NPV (ATCF) IRR Payback Period (yrs)
$3,312,949 $9,845,725 21% 10

Page | 21
3.4 Revenue Sensitivity
To demonstrate how sensitive revenue is with regards to product pricing, the following chart
presents the wholesale price options required to break-even. These options depend on the ratio
of bulk to bag products sold and reflect the conservative revenue scenario, as previously
detailed. The bulk price can be driven down by selling a greater percentage of bagged product
and by increasing the bagged wholesale price.
Figure 5: Revenue sensitivity for bagged and bulk biochar prices at 60% total production sold.
The most critical responses to the net present value resulted from changes to the total
percent of biochar sold, followed by the price of the bags, and the percentage sold by bag.
Adjusting these factors by 10% lead to a change in the NPV of 30% or greater (Table 14). The
price of bulk biochar had a small effect relative to others, with just a 2.1% change in the NPV
from a 10% change in the bulk price. This is due to the bulk price being significantly lower than
the bagged price on a per tonne basis ($4640/tonne at $34.57 per ft3 bag, as compared to
$400/tonne bulk).
Table 14: NPV sensitivity to changing factors.
Factor NPV Response to 10%
Change in Factor
% Sold 39.2%
Price Bags 37.1%
% Bagged 33.9%
Price Bulk 2.1%

Page | 22
The total amount and form in which biochar is sold are key factors affecting the overall
NPV. An indicator of the price required to break even is simply the bulk price required to sell all
the char in bulk form. This number can also be viewed as the average price required to break
even given a certain percentage of the total biochar being sold, as illustrated in Figure 5. At 60%
sold, the average price rises to $2190 per tonne and increases as the percentage sold decreases.
Figure 6: Price sensitivity based on the amount of produced biochar that is effectively sold.
Further to the above sensitivity analysis, a Monte Carlo simulation computed a 50% chance
for the net present value of the Thornhill bioenergy facility to be $552,000. The simulation is
based on six parameters that are varied within a range of low, medium, and high values to
determine the most probable NPV. Revenue is based on a conservative bulk biochar price range,
and the capital and operating costs are varied by 30% from their original values. This simulation
indicates the project is a worthwhile investment due to a positive NPV at the 50th percentile.
Table 15: Parameter ranges for Monte Carlo simulation.
Page | 23
4 RISK There are a number of opportunities for risk to be introduced into this project. Anticipating
these risks before they become major problems, and implementing mitigating steps will help to
reduce the overall risk of the project. Four major categories of risk have been identified:
economic, operational, safety, and social. Through identifying some of the major risks we were
able to categorize them by type, as well as the likelihood of occurrence and the severity of the
outcome should the risk occur.
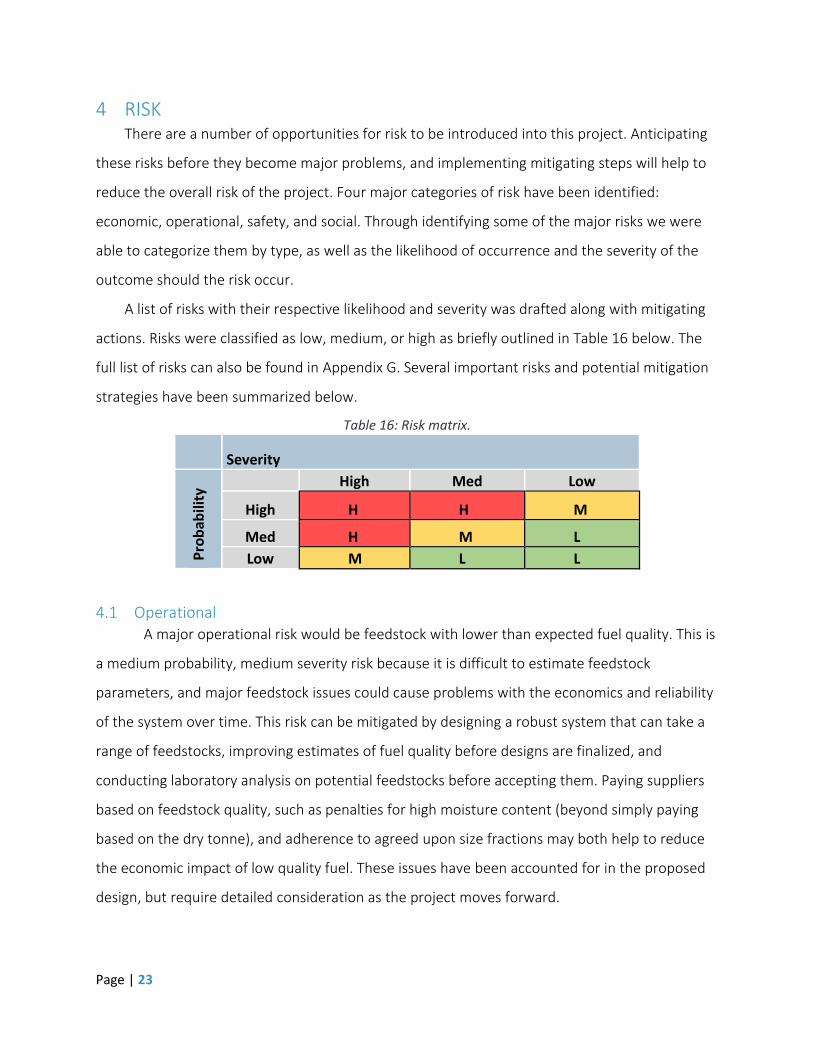
A list of risks with their respective likelihood and severity was drafted along with mitigating
actions. Risks were classified as low, medium, or high as briefly outlined in Table 16 below. The
full list of risks can also be found in Appendix G. Several important risks and potential mitigation
strategies have been summarized below.
Table 16: Risk matrix.
Severity
Pro
bab
ility
High Med Low
High H H M
Med H M L
Low M L L
4.1 Operational A major operational risk would be feedstock with lower than expected fuel quality. This is
a medium probability, medium severity risk because it is difficult to estimate feedstock
parameters, and major feedstock issues could cause problems with the economics and reliability
of the system over time. This risk can be mitigated by designing a robust system that can take a
range of feedstocks, improving estimates of fuel quality before designs are finalized, and
conducting laboratory analysis on potential feedstocks before accepting them. Paying suppliers
based on feedstock quality, such as penalties for high moisture content (beyond simply paying
based on the dry tonne), and adherence to agreed upon size fractions may both help to reduce
the economic impact of low quality fuel. These issues have been accounted for in the proposed
design, but require detailed consideration as the project moves forward.

Page | 24
4.2 Safety
The highest safety risk would be a major fire or explosion in the process. This occurrence
has a low probability and a high severity, leading to an overall medium rating on the risk matrix.
The probability can be reduced by strictly following a maintenance and inspection plan, using
high quality components, and having adequate monitoring and process control systems. In terms
of response to such an incident, an effective emergency response plan, staff training, and regular
emergency response drills would all help reduce the harm of such an incident.
4.3 Social
The social risk would entail public opposition to the project. This is a medium probability and
a medium severity event, because the public typically takes interest in local projects, and any
pushback or protests could slow down or halt the project. This could be caused by residents and
businesses having concerns over health and safety, most likely concerns over trucking, air quality
and safety. Mitigation strategies would include consulting with the public and having public
information sessions. It would be important to address any safety and air quality concerns while
explaining the environmental and economic benefits of such a system.
5 SUSTAINABILITY ASSESSMENT This sustainability assessment evaluates the potential significant adverse impacts that may
occur during the lifetime of this project with regards to: environment, economy, society, and
health. The following integrated approach accounts for the cumulative effects defined under the
Canadian Environmental Assessment Agency (CEAA) stating, “changes to the environment that
are caused by an action in combination with other past, present and future human activities.”
(CEA, 2016). Discussions of these potential effects on the community and the interests of First
Nation’s accounts for the practical means to prevent or reduce to an acceptable standard.
The project area lies within the asserted traditional territory of the Tsimshian First Nation.
Discussions regarding the project’s potential impacts to the Tsimshian First Nation’s asserted
aboriginal rights and title claims require initiation and continual consultation as the design
process moves forward.
The general provisions for the assessment procedures shall include the staging of the
assessment process and notice to the public. The assessment process institutes a pre-application

Page | 25
stage that engages in public consultation, first nation consultation, government agency
consultation, applications of terms of reference, and establishes a working group. Assessment
procedures includes the application review stage for the preparation and submission of the
application. Inclusion of the public consultation assessment, First Nations consultation
assessment, public consultation, First Nation consultation, and government agency consultation
processes is a requirement.
The environmental and socio-economic assessment approach studies the following aspects:
▪ Potential environment interactions;
▪ Estimation of releases to the environment;
▪ Potential for and magnitude of significant effects on the environment;
▪ Recommendations for assessment follow-up and monitoring.
Assessing the potential environmental interactions included: determining issues of concern;
evaluating environmental and socio-economic aspects to determine Valued Ecosystem
Components (VECs); sources and pathways of effects that may impact VECs; determining the
spatial and temporal boundaries for each VEC (FEED, 2013).
“For the purpose of environmental assessment in BC, Valued Components (VECs) are
components of the natural and human environment that are considered by the proponent,
public, Aboriginal groups, scientists and other technical specialists, and government agencies
involved in the assessment process to have specific, ecological, economic, social, cultural,
archaeological, historical, or other importance. (EAO, 2013)”
Scoping of the environmental assessment is conducted in order to compile and analyze the
available information to identify the potential environmental, economic, social, heritage, and
health issues. The regional values held by the public, Aboriginal groups, and other stakeholders
in the region may create project-specific issues. Other issues of concern may be reflected to the
scientific community and government.
A detailed environmental assessment does not account for interactions of feedstock harvesting
(FEED, 5.1). Table 17 addresses potential interactions associated with the site and forest
feedstock harvesting.

Page | 26
Table 17: Valued Ecosystem Components (VECs) and potential effects on the environment.
5.1 Policy & Regulations Decisions by the Provincial, Federal, and First Nation governments and regulatory
approvals is a requirement prior to any activities materializing from this feasibility study.
Required assessment by the according regulatory boards include regulations under the
Environmental Assessment Act, Environmental Management Act, Waste Discharge Regulations,
Canadian Council of Ministers of the Environment, and any other policies or standards in place.
In 2008, the Regional District of Kitimat-Stikine joined a province-wide action on climate
change to reduce greenhouse gases (GHGs) by signing on to the BC Climate Action Charter. The
Climate Action Charter requires communities to commit to becoming carbon neutral in its
operations, measuring and reporting on their community’s GHGs and striving for a compact,
more energy efficient community (OCP, 2017). Under the Greenhouse Gas Reduction Target Act
(2007), a province-wide target has been set to reduce GHG emissions by 33% from 2007 levels
by 2020. The City of Terrace has set GHG reduction targets of 11% below 2007 levels by 2020,
and 80% below 2007 by 2050. Despite Thornhill being an unincorporated settlement, it has
similar plans for emission targets as the City of Terrace. This bioenergy facility will support the
Thornhill’s commitment to becoming carbon neutral as it will implement an energy-efficient
renewable technology into the community.
5.2 Assessment of Potential Impacts
Potential impacts are identified and assessed based on their impact level. The
identification and selection of Valued Ecosystem Components (VECs) and their potential effects
is based on guidelines recommended by the Environmental Assessment Office (EAO) and as
required by BC’s Environmental Assessment Act. The process intention is for proponents and the
EAO staff to improve clarity, consistency, and quality of the Environmental Assessment

Page | 27
Certificate Application. Only impacts that will need supplementary assessment are discussed
further.
5.2.1 Groundwater & Freshwater Resources
Groundwater is considered a VEC as it is a source for potable, commercial, and industrial
water in the community of Thornhill; therefore, a careful assessment is required to eliminate the
potential for contamination of groundwater drinking water sources. Freshwater resources act as
watercourses and provide habitats for fish and aquatic species; this VEC indicates the overall
health of the freshwater ecosystem. Activities from the bioenergy plant are not expected to
significantly impact the freshwater environment, however, regulatory standards and policies
must be applied to both groundwater and freshwater resources, and mitigation measures must
be taken to minimize significant environmental impacts.
5.2.2 Human Health & Wellbeing
Plant operations must be conducted in a manner that minimizes health and safety risks to
the staff and public. It is the responsibility of the operating company to implement occupational
health and safety policies that comply to all required regulations. This includes training with
ongoing reviewal, inspection, and periodic audits to ensure safe practices and to identify areas of
improvement and development. A proper emergency response plan shall be established in the
case of unplanned events to ensure the safety of the workers. These protocols and regulations
shall be in place prior to the commissioning of the facility. It is essential that the facility does not
possess any components having the potential for accidents or failure.
5.2.3 Land Use & Infrastructure
Thornhill’s Official Community Plan provides an organizational layout to meet land use
objectives and policies. Included in the strategy is an establishment of the development permit
areas and guidelines. The development for commercial and industrial areas is required to be in
accordance with the Local Government Act s.488 1(1)(f) (OCP, 2017). The justification for this is
to assure that commercial development along Highway 16 is protected and is aesthetically
pleasing to residents and businesses. The proposed site is within the commercial and industrial
zoning regulations see Appendix H.
Page | 28
5.2.4 Transportation
Traffic affiliated with this project during the construction and operation will have minimal
interaction and environmental effects. During the construction phase, materials and supplies will
be transported to and from the site. The daily operations of the facility will involve the
transportation of feedstock to the site and shipments of biochar products from the site.
Compliance with the Ministry of Transportation and Infrastructure and the specific Acts and
Regulations in place for commercial vehicle safety and enforcement will be in place. Such acts
and regulations are the Motor Vehicle Act, Highway Act, and Commercial Transport Act. The
traffic being limited to several truckloads during the construction and operations will not
compromise the existing infrastructure and will be manageable. Despite the minimal waste
associated with construction and operation of the facility, any disposal of waste will be
transported to the Thornhill Transfer Station. Road transportation impacts will be inconsiderable
since existing infrastructure will be utilized, and the volume of traffic will not compromise the
efficiency or safety of current road networks.
5.2.5 Labour & Economy
The facility is expected to boost the local job economy from activities and works affiliated
in all stages of the project. The Regional District of Kitimat-Stikine’s interest in economic growth
will be stimulated from job creation and business expenditure from this project. Employment in
BC is regulated by the Employment Standards Act and will be adhered to. The construction phase
will require local labourers and contractors during the entire construction period. Facility
operations will offer long-term annual employment as well as short-term seasonal opportunities.
At the end of the plant’s lifetime, decommissioning will also present job opportunities. Overall,
this facility will have positive impacts on the economic development of the local economy from
increased employment and business expenditure.
5.2.6 Atmospheric Environment
The atmospheric environment is determined to be a VEC since the atmosphere acts as a
pathway for airborne contaminants. Receptors of such air contaminants include humans,
wildlife, vegetation, and the built environment (FEED, 2013). Noise pollution from operations is

Page | 29
dependent on the site’s proximity to residences and the design envelope, therefore, it is
recommended to conduct further analysis utilizing vendor information and sound surveys at the
proposed site location. The feedstock preparation operation may cause additional noise issues if
it is conducted on site.
5.3 Emissions Greenhouse gas emissions are a major concern with any future development due to their
strong correlation to climate change. A global initiative to reduce GHGs imposes the
responsibility for this project to ensure a minimal release of emissions. The project will need to
undergo a formal environmental assessment as required by criteria under federal and provincial
legislation, and appropriate measurements must be taken to ensure that guidelines for air
quality and GHG emissions are complied with as required by regulatory bodies such as the CEAA.
A further assessment on emissions dispersion is recommended for estimating ground level
concentrations of contaminants.
GHG emissions data is based on current conditions from Environment and Climate Change
Canada, the Province of BC, the Environmental Protection Agency (EPA), the Canadian
Environmental Protection Act, the Environmental Assessment Act, and Canada-Wide Standards.
The following sections address the current GHG emission guidelines and regulations and
background on potential construction and operation emissions followed by a detailed CO2
emission data from the combustion process.
5.3.1 Greenhouse Gas Emission Guidelines and Protocols
A general guidance for emission regulations and guidelines is addressed in this section to
provide an outline of Greenhouse Gas (GHG) protocol on a national and global scale. The United
Nations Framework Convention on Climate Change (UNFCCC) requires reporting guidelines
placing special consideration on reporting CO2 emissions from the combustion of biomass, in
which the ECCC is responsible for developing and reporting. Reporters to GHGRP are required to
report CO2 emissions from biomass combustion under the guidelines of the UNFCCC. These
guidelines incorporate the Intergovernmental Panel on Climate Change (IPCC) estimations on
GHGs. The 2006 IPCC Guidelines for National Greenhouse Gas Inventories (IPCC, 2006) is the

Page | 30
method utilized to estimate GHG emissions at a facility level. Additional regulations to biomass
combustion under IPCC Guidelines facilities requires the reporting and counting of CH4 and N2O
emissions. The 2006 IPCC Guidelines estimates carbon emissions in terms of the species which
are emitted. (IPCC 2016). The combustion process mostly releases carbon as CO2. A percentage
of the emissions will consist of carbon monoxide (CO), methane (CH4), or non-methane volatile
organic compounds (NMVOCs).
The IPCC provides default emission factors for CO2 that are applicable to all combustion
processes as CO2 emissions are independent of combustion technology, however CH4 and N2O
emissions have a strong correlation with technology. Because of this variability an averaged
emission factor is used, placing a level of uncertainty in the data (WRI/WBCSD, 2005)
Federal and provincial governments place regulatory requirements on the environmental effects
on the atmosphere. Air quality in B.C. is managed through several bodies that regulate air quality
through airshed management programs, Air Quality Management System (AQMS), and the
principle legislations, Environmental Management Act and Waste Discharge Regulation.
Under the airshed management program, BC has an obligation of communities to have airshed
plans that meet a Canada-wide Standards for Particulate Matter and Ozone.
5.3.2 Construction
Air quality during construction should be restricted to fugitive dust emissions during
ground preparation (FEED, 2013). Since the plant will be relatively small in scale, air
contaminants released from construction practices will be marginal, and few to none emissions
from heavy construction equipment on the site will occur, including fugitive dust. Air pollution
from the transportation of materials is expected to be insignificant and restricted to the site.
No consideration for emissions in the construction of forestry roads for harvesting
practices needs to be addressed since this feasibility study is based on feedstock sourced from
the waste of existing sawmills.

Page | 31
5.3.3 Operations
The facility will generate air emissions in the form of GHGs and particulate matter from
the combustion of woody biomass and syngas. Emission estimations reflect a 1.4 MW system to
assess emission rates for each contaminant and are based on an existing system, the Community
Power Corporation technology, researched by the Haines Junction Biomass Energy Project
(HJBEP). Similar to HJBEP, a direct scaling approach is used to size the Thornhill scenario. GHG
analysis is based on a calculation based method using fuel consumption data.
The release of other hazardous contaminants (volatile organic compounds, polycyclic
aromatic hydrocarbons, dioxins, and furans), is determined to be small and in similar nature to
other biomass combustion processes. Concerns for methane and nitrogen dioxide from facility
operations should be insignificant, therefore their evaluation is unnecessary.
Environment Canada has reporting requirements in place for emissions of GHGs which
support the annual mandatory reporting of GHG emissions by facilities under Environment and
Climate Change Canada’s (ECCC) Greenhouse Gas Emissions Reporting Program (GHGRP). Under
these regulations, a regulatory standard of 50,000 tonnes or more of GHGs annually must be
reported. The current plant will be well below this emission rate, therefore GHG emissions
reporting is not mandatory. Calculated carbon dioxide equivalents (CO2e) from the proposed
plant using sawmill waste is reported below in Tables 18 and 19.
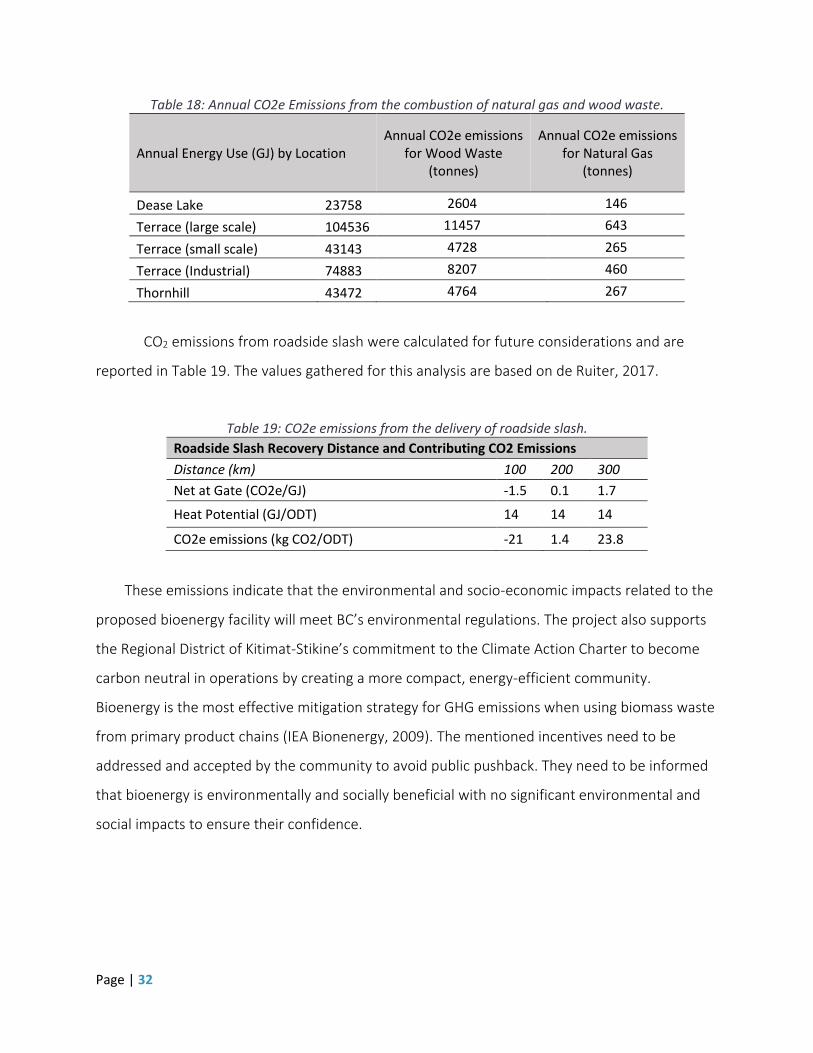
5.3.4 CO2 Emissions
The annual CO2e emissions for natural gas and wood waste for each scenario are
provided in Table 18. The emission values for the fuels only account for the combustion of the
fuel. Pre-processing, transportation, and any additional processes are not accounted for and are
considered minimal and insignificant. The values of 109.6 kgCO2/GJ for wood and 56.1 kgCO2/GJ
for natural gas are based on statistics provided by Fachbuch Regenerative Energie Systeme and
UBA.
Page | 32
Table 18: Annual CO2e Emissions from the combustion of natural gas and wood waste.
Annual Energy Use (GJ) by Location Annual CO2e emissions
for Wood Waste (tonnes)
Annual CO2e emissions for Natural Gas
(tonnes)
Dease Lake 23758 2604 146
Terrace (large scale) 104536 11457 643
Terrace (small scale) 43143 4728 265
Terrace (Industrial) 74883 8207 460
Thornhill 43472 4764 267
CO2 emissions from roadside slash were calculated for future considerations and are
reported in Table 19. The values gathered for this analysis are based on de Ruiter, 2017.
Table 19: CO2e emissions from the delivery of roadside slash.
Roadside Slash Recovery Distance and Contributing CO2 Emissions
Distance (km) 100 200 300
Net at Gate (CO2e/GJ) -1.5 0.1 1.7
Heat Potential (GJ/ODT) 14 14 14
CO2e emissions (kg CO2/ODT) -21 1.4 23.8
These emissions indicate that the environmental and socio-economic impacts related to the
proposed bioenergy facility will meet BC’s environmental regulations. The project also supports
the Regional District of Kitimat-Stikine’s commitment to the Climate Action Charter to become
carbon neutral in operations by creating a more compact, energy-efficient community.
Bioenergy is the most effective mitigation strategy for GHG emissions when using biomass waste
from primary product chains (IEA Bionenergy, 2009). The mentioned incentives need to be
addressed and accepted by the community to avoid public pushback. They need to be informed
that bioenergy is environmentally and socially beneficial with no significant environmental and
social impacts to ensure their confidence.

Page | 33
6 ALTERNATIVE LOCATIONS, FEEDSTOCK & TECHNOLOGY
6.1 Diversifying Feedstock Supply The proposed bioenergy system is designed to run on sawmill residues (chips), however,
the system will be able to handle different types of biomass if it is adequately prepared. An
alternative biomass of primary interest is roadside slash, the majority of which is presently
managed by open burning onsite. In comparison to sawmill residues, one of the major hurdles to
overcome when using slash as feedstock is transportation. Chips have already been transported
to town, and this cost is factored into the cost of the chips as feedstock, whereas slash is
normally dealt with on the landing and the shipping cost is an added expense to procuring slash.
Other considerations with slash are moisture content, and particle size and
characteristics. Unless slash dried out, the moisture content will be higher than in chips and will
reduce energy yields as compared to chips. Another challenge might be maintaining a proper
orientation of branches into the chipper to avoid irregular sized feed. This could result in poor
operation of the feed supply system and the pyrolysis reactor. However; if a carbon tax is placed
on burning slash piles, the economic incentive for finding alternative uses for slash will increase,
potentially making it a more viable fuel.
It has also been proven that dewatered biosolids (produced in wastewater treatment),
manure, plastic, and demolition and construction debris can all be gasified. However, debris with
halogenated compounds, heavy metals, and other contaminants would pose a problem to our
current system. These compounds, which are heavily regulated, would come out in the biochar
or air emissions. This would likely hinder biochar sales, and require sophisticated air emissions
controls. For this reason, plastics and construction and demolition debris would not be ideal
feedstocks. Manure and biosolids could be suitable feedstocks, but would have to be processed
into suitable sized particles (BC Biocarbon accomplishes this by using a briquetting machine), and
as with slash, the high water content of these fuels leads to a lower energy yield.
6.2 District Heating & Electricity Generation Opportunities
The proposed system is designed to produce enough electricity to meet operational
consumption. Depending on how electricity supply develops in BC, there may be upcoming
opportunities for independent power suppliers. Due to the uncertainty surrounding Site C,

Page | 34
electricity was not focused on as a main product. If electricity was a viable product, it could be
produced by eliminating the boiler, utilizing a higher capacity bank of internal combustion
engines, and recovering heat from the exhaust gases.
The system benefits greatly from having consumers to sell heat to, so there will always be
an incentive to have a heat user. However, in addition to supplying heat to a district heating
system, it may also be supplied to industrial or agricultural users. For example, sawmills require
heat for kilns, and large-scale greenhouses and tree nurseries require heat to maintain optimal
growing conditions. These uses are more beneficial than district heating since they use a simpler
setup that would require less investment. District heating may become easier to develop as it is
used more frequently, but it is unlikely to benefit from mass production in the same way that the
rest of the system would.
Remote off-grid communities show potential for a biomass-based electricity system,
although a gasifier-only system may be more suitable since economical proximity to a large,
nearby biochar market is unlikely. If there were uses for the char within a reasonable distance,
such as mines or reclamation projects, then a pyrolysis-based system would be sensible.
This system would also be suitable for off-grid mining operations. Heat and electricity
generated from biomass harvested on-site could provide heat and electricity, and biochar could
be processed into activated carbon, or for use as a soil amendment. This would be beneficial, as
all mines have to have reclamation plans, and frequently resource extraction projects focus on
progressive reclamation throughout the operation of the site. This operating model would
require the mine to harvest biomass in addition to the land initially cleared for mining purposes.
The amount of whole-tree chipping would be a drain on the system, but the overall model may
be more economical than transporting energy products, activated carbon and soil amendments
for water treatment and reclamation.
In a future scenario, a pyrolysis system could be used even with no biochar demand. This
would require a procedure for returning char to the natural carbon cycle and selling carbon
credits based on the amount of carbon sequestered. In this case, a single stage gasifier would be
practical to gasify the char for underground injection. A likely benefit to the proposed system
over a single stage gasifier system would be the quality of syngas, since a single stage gasifier is

Page | 35
expected to produce lower quality gas. A cleaner syngas feed to the internal combustion engine
leads to improved engine wear characteristics and a lower frequency of engine replacement. A
comparison of engine wear from the proposed pilot plant to that of single stage gasifiers may
determine if that benefit is worth the added capital cost and complexity of having pyrolysis and
gasifier stages in series.
6.3 Modular & Mobile Systems Modular or fully mobile systems mounted on trailers are easy to transport and set up. The
proposed design is amenable to this type of system as it can self-generate electricity. A fully
mobile system would be most beneficial if it produced mainly electricity, since char and heat
waste streams would be challenging to make use of with a changing site location. A modular or
mobile system is an attractive option for off-grid locations that have a demand for both
electricity and biochar. Due to the economics of the system proposed in this report, it is
economically sensible to produce biochar for sale.
Mobile technology is also suitable for agriculture and forestry practices in that electricity
could be used to power machinery; however, most equipment in these industries relies on fossil
fuels, and so there is no current demand for electricity. A mobile system may be feasible if these
industries expand into electrical machinery, or if the system produces an alternative fuel for the
current machinery.
Different forms of pyrolysis systems can produce significant amounts of bio-oils that can be
used to make diesel fuel alternatives. The difficulty of this process would be incorporating the
equipment required to make a useable diesel alternative into a portable and easy to operate
system. It may also be challenging to find beneficial uses for the resulting gas and biochar.
Presumably, the gas could be used to self-generate electricity for the system, and the biochar
could be used to return organic matter to the land. However, gas may potentially be produced in
excess of what is required for self-generation, and although returning biochar to nature is
beneficial, it presents no direct economic benefit. More research and development is needed
before mobile bio-oil refining is commercially viable. A separate study may help to assess the
feasibility of such a system.

Page | 36
7 RECOMMENDATIONS It is recommended that a pyrolysis-gasifier plant with an associated district heating system
be built in Thornhill. This type of system is recommended because it offers flexibility in the
method of operation and a mixture of energy and value-added products. Thornhill is additionally
recommended as the top location because it would have a low impact on the local population,
and offers a high energy density for the proposed district heating system.
It is recommended that sawmill wood chips are the main feedstock for this system, due to
the uniform characteristics, relatively low moisture content, favorable price estimates and
established supply chains. Roadside slash is a promising fuel source, but there are technical
challenges to using it, such as chipping, transportation, particle size uniformity and moisture
content. After the pilot plant has been established, trials involving slash should be conducted to
build up the knowledge base and to better determine the required conditions for burning slash.
Energy sales alone is not adequate to sustain the proposed system. Sales of biochar as a
value-added product are required for this system to succeed. Based on current market
conditions, a bagged biochar product is recommended as it results in far higher returns than
selling the biochar in bulk. Other biochar niche markets should be explored to diversify the
consumer base in preparation for any decline in demand for bagged or bulk product. Further
research and financial expertise is recommended before this project is undertaken, as the
market for biochar was the highest source of financial uncertainty. Biochar is a high value
commodity in certain markets, and shows promising potential to support the feasibility of a
developing bioenergy industry.

Page | 37
8 REFERENCES Antares Group, Inc. (2003). Assessment of Power Production at Rural Utilities Using Forest Thinnings and Commercially Available Biomass Power Technologies. Prepared for the U.S. Department of Agriculture, U.S. Department of Energy, and National Renewable Energy Laboratory. Basu, P. (2013). Biomass gasification, pyrolysis and torrefaction: practical design and theory. Academic press. BC Assessment (2017). E-valueBC [Online property information database]. Accessed from https://evaluebc.bcassessment.ca/ Bradley, D., & Solutions, C. C. (2007). Canada-sustainable forest biomass supply chains. Climate change solution. Brouwer, R. and Jobb, T. (2005) The Small Scale Wood Processing Sector in the Kalum-Kispiox Region of British Columbia: Challenges and Opportunities. Retrieved from: http://westlandresources.ca/wp-content/reports/Small_scale_Sector_report_March_30_2005.pdf Canada, G. O. (2017). Census Profile, 2016 Census Kitimat-Stikine E, Regional district electoral area, British Columbia and Canada. Retrieved November 28, 2017, from http://www12.statcan.gc.ca/census-recensement/2016/dp-pd/prof/details/page.cfm?Lang=E&Geo1=CSD&Code1=5949018&Geo2=PR&Code2=01&Data=Count&SearchText=Kitimat-Stikine E&SearchType=Begins&SearchPR=01&TABID=1&B1=All City of Terrace (2017). TERRAMAP [Browser based GIS portal map]. Accessed from http://terramap.terrace.ca/terramap/Default.aspx D.J. Dokken, K.J. Mach, M.D. Mastrandrea, T.E. Bilir, M. Chatterjee, K.L. Ebi, Y.O. Estrada, R.C. Genova, B. Girma, E.S. Kissel, A.N. Levy, S. MacCracken, P.R. Mastrandrea, and L.L. White (eds.)]. Cambridge University Press, Cambridge, United Kingdom and New York, NY, USA, pp. 229-269. EPA (2007). Biomass Combined Heat and Power catalog of technologies. Washington, DC. ENVINT Consulting (2010). The BC Biomass Energy Guide: An Information Guide on Pursuing Biomass Energy Opportunities and Technologies in British Columbia. FIXR (2017). Build a hotel cost [Webpage]. Accessed from https://www.fixr.com/costs/build-hotel. FVB Energy Inc. (2011, October). Village of Burns Lake, BC District Heating System Feasibility Study. Retrieved from: Dr. Steve Helle.

Page | 38
Geoff C. de Ruiter, Steve S. Helle, P. Michael Rutherford (2017). Greenhouse gas assessment of a novel pyrolysis retort kiln producing wood-based synthetic coal from sawmill residues, roadside slash, and hybrid poplar feedstocks. In preparation. Helle, S. (2017). District heating calculations and boiler demands for northwest BC communities [Spreadsheet]. IFS (2015). Wood Based Biomass in British Columbia and its Potential for New Electricity Generation. Retrieved from: https://www.bchydro.com/content/dam/BCHydro/customer-portal/documents/corporate/regulatory-planning-documents/integrated-resource-plans/current-plan/rou-characterization-wood-based-biomass-report-201507-industrial-forestry-service.pdf IHG (2017). Holiday Inn Express & Suites Terrace [Webpage]. Accessed from https://www.ihg.com/holidayinnexpress/hotels/us/en/terrace/yxtes/hoteldetail International Biochar Initiative (2017). Phoenix Energy’s Business Model: Building Small, Profitable Plants. Retrieved from: http://www.biochar-international.org/profile/Phoenix_Energy Jirka, S., Tomlinson, T. (2014). 2013 State of the Biochar Industry: A Survey of Commercial Activity in the Biochar Field. The International Biochar Initiative. Retrieved from: http://www.biochar-international.org/sites/default/files/State_of_the_Biochar_Industry_2013.pdf Ministry of Forests, Lands and Natural Resource Operations. (2017). Major Primary Timber Processing Facilities in B.C. 2015. Retrieved from Province of British Columbia Website: http://www2.gov.bc.ca/assets/gov/farming-natural-resources-and-industry/forestry/fibre-mills/mill_report_2015_final_1.pdf Mwakalila, 2014: Freshwater resources. In: Climate Change 2014: Impacts, Adaptation, and Vulnerability. Part A: Global and Sectoral Aspects. Contribution of Working Group II to the Fifth Assessment Report of the Intergovernmental Panel on Climate Change. Nairne, D. (2014, April). Hazelton Biomass Fed District Energy System Preliminary Feasibility Study. Retrieved from: Dr. Steve Helle. Pacific Northern Gas Ltd. (2017, October). Rates: Vanderhoof to Prince Rupert/Kitimat. Retrieved from: http://www.png.ca/vanderhoof-prince-rupert-kitimat/ Prodesa (2017). Prodesa and the Canadian Market Conquest II, British Columbia https://prodesa.net/prodesa-and-the-canadian-market-conquest-ii-british-columbia/. Accessed Oct 25, 2017.

Page | 39
Quaschning, Volder (2015). Regenerative Energie Systeme. 9. Aktualisierte und erweiterte Auflage. Retrieved from: https://www.volder-quaschning.de/datserv/CO2-spez/index_e.php Regional District of Kitimat-Stikine (2017). Map of regional district [Browser based GIS portal map]. Accessed from http://rdks.pat.ca/RDKS/ SNCIRE (2013). The Skeena-Nass Forest Economy: A compilation of knowledge, opportunities and strategies (Edition 2013. B Draft). Regional District of Kitimat-Stikine. Spelter, H. and Alderman, M. (2005) Profile 2005: Softwood Sawmills in the United States and Canada. The Char Team (2015). Analyses of biochar properties. University Laval, Centre for Research on Renewable Materials. Retrieved from: http://www.biochar-international.org/sites/default/files/Analyse_comparative-biochar-ENG.pdf Turton, Richard (2009). Analysis, Synthesis and Design of Chemical Processes (3rd Edition). Upper Saddle River, NJ: Prentice Hall. Urban System Ltd. (2017). Thornhill Official Community Plan. Retrieved from Regional District of Kitimat-Stikine: http://www.rdks.bc.ca/sites/default/files/2017-07-06-thornhill_ocp_draft_for_website.pdf Wunderlin, T. (2012, May). Feasibility Study Village of Telkwa Biomass District Heating Project. Retrieved from: Dr. Steve Helle. Yemshanov, D., McKenney, D. W., Fraleigh, S., McConkey, B., Huffman, T., & Smith, S. (2014). Cost estimates of post harvest forest biomass supply for Canada. Biomass and Bioenergy, 69, 80-94.

Page | A-1
9 APPENDICES
Appendix A – Decision Matrix for Site Location
FACTOR WEIGHT Reason for weightTerrace Downtown
Large
Terrace Downtown
Small
Terrace
IndustrialThornhill Dease Lake
Piping cost/ total cost 2
This is an indicator of efficiency, but
not as important as the overall district
heating cost and amount of heat sold.
0.0 5.0 1.3 4.3 0.6
Total Cost/ total heat sold
(year)4
District heating is integral to the
project, so it is important to take it
into consideration.
2.4 0.0 3.0 5.0 1.6
9.7 10.0 14.4 28.6 7.5
Trucking Routes through
town2
Taking trucks through built up areas is
undesireable0 0 5 5 5
Proximity to Residences/
sensitive land uses3
Locating close to residences or
sensitive land uses leads to a higher
likelihood of conflict
0 0 5 0 2.5
0 0 25 10 17.5
Appropriate Zoning
(Industrial ideal, light
industrial/ commercial
lose points)
4Easier to justify as industrial; light
industrial is pushing it. (low is good)0.0 0.0 5.0 0.0 2.5
Distance to markets 5
Having access to markets for biochar
vastly increases ability to sell biochar
and maintain profitability (low good)
5.0 5.0 5.0 5.0 0.0
Unit value of land 2Need to be able to buy land; lower
land price means lower initial cost0.0 0.0 3.4 3.1 5.0
Tree clearing/ expected
site preparation2
Some sites would require significantly
more initial work than others (low
good)
5.0 5.0 0.0 5.0 0.0
Suitable size (lose points
for undersize or far
oversize)
3
Needs to be an appropriate size in
order to allow for the most flexibility
in plant design; too big and it's a waste
of money. Need to respect
appropriate bylaws in terms of
percentage of lot covered and
setbacks.
3.4 3.4 0.0 5.0 1.5
Ability for Electricity Sales
(Not really part of design
anymore, could be
consideration for future
expansion, give it low
weight)
1
Being able to further diversify the
product range would be advantageous;
still need to be able to use heat.
0.0 0.0 0.0 0.0 5.0
45.1 45.1 51.8 56.2 29.5
Expected all-in price and
quality of fibre supply in
area
3
fibre price and quality are potentially
the major economic and operational
issues (low good)
5.0 5.0 5.0 5.0 0.0
Net Present Value/
Capital 4
Indicator of feasibility/ subsidy
required (higher or less negative is
better)
5.0 3.4 4.6 3.7 0.0
Standard Deviation/
Capital3
Risk is a good indicator of how
attractive a project is as an
investment. Lower risk is better;
higher risk is a worse investment and
entails higher interest rates.
0.3 2.8 0.0 1.4 5.0
35.9 36.9 33.5 33.7 15.0
90.7 92.1 124.7 128.6 69.5
Financials, feedstock and products
Financials, Feedstock and Products Total Score
Grand Total Score
Practical Total Score
District Heating
Societal/Public
Practical Considerations
District Heating Total Score
Social Total Score

Page | B-1
Appendix B – Heating Duration Curves
Figure 7: Terrace heat duration curve.
Figure 8: Dease Lake heat duration curve.
0
5
10
15
20
25
30
35
0 50 100 150 200 250 300 350 400
kW
Days of the year
Terrace Heat Duration Curve100 m2 Basis
0
2
4
6
8
10
12
14
16
18
0 50 100 150 200 250 300 350 400
kW
Days of the year
Dease Lake Heat Duration Curve 100 m2 Basis

Page | C-2
Appendix C – District Heating Design for All Locations
Terrace Downtown Large
Average Heat Demand
(GJ/month)Zone
Base Monthly
Charge ($)
Average Monthly
Metered Charge
($)
Total Monthly
Charge ($)
319.2 R5 - Dense Residential 10.75 5469.75 5480.50
341.6 M1-Light Industrial 410 2086.24 2496.24
205.52 C1-A - Urban Commercial 25 3102.64 3127.64
178.08 C1-A - Urban Commercial 25 2688.39 2713.39
448 C1-A - Urban Commercial 25 6763.25 6788.25
274.4 C1-A - Urban Commercial 25 4142.49 4167.49
548.8 C1-A - Urban Commercial 25 8284.98 8309.98
560 C1-A - Urban Commercial 25 8454.06 8479.06
1960 C1-A - Urban Commercial 25 29589.22 29614.22
347.2 C1-A - Urban Commercial 25 5241.52 5266.52
492.8 C1-A - Urban Commercial 25 7439.58 7464.58
739.2 R5 - Dense Residential 10.75 12666.79 12677.54
1232 C1-A - Urban Commercial 25 18598.94 18623.94
7647 114,527.86$ 115,209.36$
Buildings Natural Gas Costs
Total
Terrace Downtown (Large Scale) Current Heating Costs
Number Total Footprint (m2) (kW) (GJ/day)
1 570 138.36 11.95
2 610 148.07 12.79
3 367 89.09 7.70
4 318 77.19 6.67
5 800 194.19 16.78
6 490 118.94 10.28
7 980 237.89 20.55
8 1000 242.74 20.97
9 3500 849.60 73.41
10 620 150.50 13.00
11 880 213.61 18.46
12 1320 320.42 27.68
13 2200 534.03 46.14
13655 3314.65 286.39
Terrace Downtown (Large Scale) Heat EnergyBuildings 80% of Peak Demand
Total

Page | C-3
Mass Flow
(kg/day)
Volume Flow
(m3/s)
Pipe Diameter
(inch)
Required Pipe Size to
Deliver Demand (inch)
95240.56 0.001102 1.04 1.25
101924.10 0.001180 1.08 1.25
61321.55 0.000710 0.84 1
53134.20 0.000615 0.78 1
133670.96 0.001547 1.24 1.25
81873.46 0.000948 0.97 1
163746.92 0.001895 1.37 1.5
167088.69 0.001934 1.38 1.5
584810.43 0.006769 2.58 3
103594.99 0.001199 1.09 1.25
147038.05 0.001702 1.30 1.5
220557.08 0.002553 1.59 2
367595.13 0.004255 2.05 2.5
2281596 0.02641 3.109 3
4.049 4
Terrace Downtown (Large Scale) Pipe Design
Total To Buildings in Line 1
To Buildings in Line 2
3180.10
Maximum Energy Delivey (kW)
Pipe Length (m) 521
Pipe Cost ($) 261,865.02
Installation Costs ($) 104,200.00
Pipe Length (m) 489
Pipe Cost ($) 389,524.72
Installation Costs ($) 97,800.00
Energy Transfer Station Cost ($) 101,047.00
Boiler Cost ($) 96,124.91
Installation, Engineering, and Minor Equipment ($) 288,374.74
Total Cost ($) 1,338,936.39$
Terrace Downtown (Large Scale) District Heat System Cost
Line 1
Line 2

Page | C-4
Terrace Downtown Small
Average Heat
Demand (GJ/month)Zone
Base Monthly
Charge ($)
Average Monthly
Metered Charge ($)
Total Monthly
Charge ($)
319.2 R5 - Dense Residential 10.75 5469.75 5480.50
341.6 M1-light industrial 410 2086.24 2496.24
205.52 C1-A - urban commercial 25 3102.64 3127.64
178.08 C1-A - urban commercial 25 2688.39 2713.39
448 C1-A - urban commercial 25 6763.25 6788.25
274.4 C1-A - urban commercial 25 4142.49 4167.49
548.8 C1-A - urban commercial 25 8284.98 8309.98
347.2 C1-A - urban commercial 25 5241.52 5266.52
492.8 C1-A - urban commercial 25 7439.58 7464.58
3155.6 45,218.84$ 45,814.59$
Terrace Downtown (Small Scale) Current Heating Costs
Total
Buildings Natural Gas Costs
Number Total Footprint (m2) (kW) (GJ/day)
1 570 138.36 11.95
2 610 148.07 12.79
3 367 89.09 7.70
4 318 77.19 6.67
5 800 194.19 16.78
6 490 118.94 10.28
7 980 237.89 20.55
10 620 150.50 13.00
11 880 213.61 18.46
5635 1367.86 118.18
Terrace Downtown (Small Scale) Heat EnergyBuildings 80% of Peak Demand
Total

Page | C-5
Mass Flow
(kg/day)
Volume Flow
(m3/s)
Pipe Diameter
(inch)
Required Pipe Size to
Deliver Demand (inch)
95240.56 0.001102 1.043 1.25
101924.10 0.001180 1.079 1.25
61321.55 0.000710 0.837 1
53134.20 0.000615 0.779 1
133670.96 0.001547 1.236 1.25
81873.46 0.000948 0.967 1
163746.92 0.001895 1.368 1.5
103594.99 0.001199 1.088 1.25
147038.05 0.001702 1.296 1.5
941544.7952 0.010897509 2.608 2.5
1.988 2
1303.84
Terrace Downtown (Small Scale) Pipe Design
Total To Buildings in Line 1
To Buildings in Line 2
Maximum Energy Delivery (kW)
Pipe Length (m) 248
Pipe Cost ($) 78,516.80
Installation Cost ($) 174,615.80
Pipe Length (m) 313
Pipe Cost ($) 109,708.85
Installation Cost ($) 87,400.00
Energy Transfer Station Cost ($) 41,699.00
Boiler Cost ($) 51,978.50
Installation, Engineering, and Minor Equipment ($) 155,935.51
Total Cost ($) 699,854.46$
Terrace Downtown (Small Scale) District Heat System Cost
Line 1
Line 2
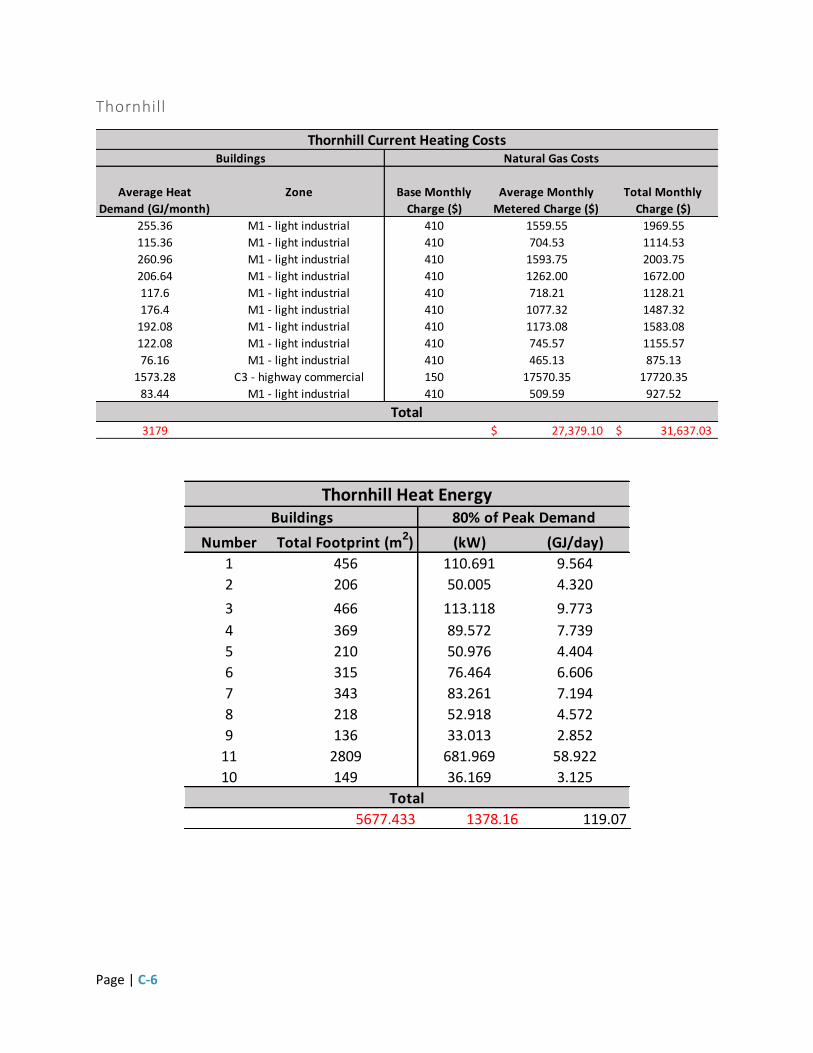
Page | C-6
Thornhill
Average Heat
Demand (GJ/month)
Zone Base Monthly
Charge ($)
Average Monthly
Metered Charge ($)
Total Monthly
Charge ($)
255.36 M1 - light industrial 410 1559.55 1969.55
115.36 M1 - light industrial 410 704.53 1114.53
260.96 M1 - light industrial 410 1593.75 2003.75
206.64 M1 - light industrial 410 1262.00 1672.00
117.6 M1 - light industrial 410 718.21 1128.21
176.4 M1 - light industrial 410 1077.32 1487.32
192.08 M1 - light industrial 410 1173.08 1583.08
122.08 M1 - light industrial 410 745.57 1155.57
76.16 M1 - light industrial 410 465.13 875.13
1573.28 C3 - highway commercial 150 17570.35 17720.35
83.44 M1 - light industrial 410 509.59 927.52
3179 27,379.10$ 31,637.03$
Thornhill Current Heating CostsBuildings Natural Gas Costs
Total
Number Total Footprint (m2) (kW) (GJ/day)
1 456 110.691 9.564
2 206 50.005 4.320
3 466 113.118 9.773
4 369 89.572 7.739
5 210 50.976 4.404
6 315 76.464 6.606
7 343 83.261 7.194
8 218 52.918 4.572
9 136 33.013 2.852
11 2809 681.969 58.922
10 149 36.169 3.125
5677.433 1378.16 119.07
Total
Thornhill Heat EnergyBuildings 80% of Peak Demand

Page | C-7
Mass Flow
(kg/day)
Volume Flow
(m3/s)
Pipe Diameter
(inch)
Required Pipe Size to
Deliver Demand (inch)
76192.44 0.000882 0.9328 1
34420.27 0.000398 0.6270 1
77863.33 0.000901 0.9430 1
61655.73 0.000714 0.8391 1
35088.63 0.000406 0.6330 1
52632.94 0.000609 0.7753 1
57311.42 0.000663 0.8090 1
36425.34 0.000422 0.6450 1
22724.06 0.000263 0.5094 1
469424.49 0.005433 2.3154 2.5
24896.22 0.000288 0.5332 1
948635 0.0110 2.87 3
1.62 1.5
Thornhill Pipe Design
Total To Buildings in Line 1
To Buildings in Line 2
Maximum Energy Delivery (kW)
1378.16
Pipe Length (m) 150
Pipe Cost ($) 75,393.00
Installation Costs ($) 30,000.00
Pipe Length (m) 260
Pipe Cost ($) 45,151.60
Installation Costs ($) 52,000.00
Energy Transfer Station Costs ($) 42,013.00
Boiler Cost ($) 38,588.36
Installation, Engineering, and Minor Equipment ($) 115,765.08
Total Cost ($) 398,911.04$
Thornhill District Heat System Cost
Line 1
Line 2

Page | C-8
Dease Lake
Average Heat
Demand (GJ/month)Zone
Base Monthly
Charge ($)
Average Monthly
Metered Charge ($)
Total Monthly
Charge ($)
238.56 C3 - Highway Commercial 10.75 1563.49 1574.24
842.24 C3 - Highway Commercial 10.75 5519.93 5530.68
264.32 C3 - Highway Commercial 10.75 1732.32 1743.07
108.64 C3 - Highway Commercial 10.75 712.01 722.76
167.44 C3 - Highway Commercial 10.75 1097.38 1108.13
586.88 C3 - Highway Commercial 10.75 3846.33 3857.08
66.08 C3 - Highway Commercial 10.75 433.08 443.83
81.76 C3 - Highway Commercial 10.75 535.84 546.59
108.64 C3 - Highway Commercial 10.75 712.01 722.76
49.28 C3 - Highway Commercial 10.75 322.97 333.72
155.12 C3 - Highway Commercial 10.75 1016.64 1027.39
113.68 C3 - Highway Commercial 10.75 745.04 755.79
41.44 C3 - Highway Commercial 10.75 271.59 282.34
50.96 C3 - Highway Commercial 10.75 333.99 344.74
118.16 C3 - Highway Commercial 10.75 774.40 785.15
533.12 C3 - Highway Commercial 10.75 3494.00 3504.75
3526 23,111.03$ 23,283.03$
Total
Dease Lake Current Heating CostsBuildings Propane Costs
Number Total Footprint (m2) (kW) (GJ/day)
1 426 50.97 4.40
2 1504 179.94 15.55
3 472 56.47 4.88
4 194 23.21 2.01
5 299 35.77 3.09
6 1048 125.38 10.83
7 118 14.12 1.22
8 146 17.47 1.51
9 194 23.21 2.01
10 88 10.53 0.91
11 277 33.14 2.86
12 203 24.29 2.10
13 74 8.85 0.76
14 91 10.89 0.94
15 211 25.24 2.18
16 952 113.90 9.84
6297 753.39 65.09
80% of Peak Demand
Dease Lake Heat Energy
Buildings
Total

Page | C-9
Mass Flow
(kg/day)
Volume Flow
(m3/s)
Pipe Diameter
(inch)
Required Pipe Size to Deliver
Demand (inch)
35082.82 0.0004 0.6330 1
123860.47 0.0014 1.1894 1.25
38871.11 0.0004 0.6663 1
15976.68 0.0002 0.4272 1
24623.86 0.0003 0.5303 1
86307.03 0.0010 0.9928 1
9717.78 0.0001 0.3331 1
12023.69 0.0001 0.3706 1
15976.68 0.0002 0.4272 1
7247.16 0.0001 0.2877 1
22812.07 0.0003 0.5104 1
16717.87 0.0002 0.4370 1
6094.20 0.0001 0.2638 1
7494.22 0.0001 0.2926 1
17376.70 0.0002 0.4455 1
78401.04 0.0009 0.9463 1
518583.37 0.006 2.43 2.5
Maximum Energy Delivery (kW)
753.39
Dease Lake Pipe Design
Total To All Buildings
Pipe Length (m) 990
Pipe Cost ($) 313,434.00
Energy Transfer Station Cost ($) 46,597.80
Installation Costs ($) 198,000.00
Boiler Cost ($) 30,135.46
Installation, Engineering, and Minor Equipment ($) 90,406.37
Total Cost ($) 678,573.63$
Dease Lake District Heat System Cost

Page | C-10
Terrace Industrial
Average Heat
Demand (GJ/month)Zone Base Monthly
Charge ($)Average Monthly
Metered Charge ($)
Total Monthly
Charge ($)
623.84 P1 - public institutional 25 9417.83 9442.83
4854.08 M2 - heavy industrial 410 29645.13 30055.13
5478 39,062.96$ 39,497.96$
Total
Terrace Industrial Site Current Heating CostsBuildings Natural Gas Costs
Number Total Footprint (m2) (kW) (GJ/day)
1 1114 270.415 23.364
2 8668 2104.094 181.794
9782 2374.51 205.16
Terrace Industrial Site Heat EnergyBuildings 80% of Peak Demand
Total
Mass Flow
(kg/day)
Volume Flow
(m3/s)
Pipe Diameter
(inch)
Required Pipe Size to
Deliver Demand (inch)
186136.81 0.00215 1.46 1.5
1448324.81 0.01676 4.07 4
1634462 0.0189 4.32 4
Maximum Energy Delivery (kW)
2035.27
Terrace Industrial Pipe Design
Total To All Buildings
Pipe Length (m) 618
Pipe Cost ($) 392,701.92
Energy Transfer Station Cost ($) 72,386.80
Installation Costs ($) 123,600.00
Boiler Cost ($) 78,358.81
Installation, Engineering, Minor Equipment ($) 235,076.44
Total Cost ($) 902,123.97$
Terrace Industrial Site District Heat System Cost
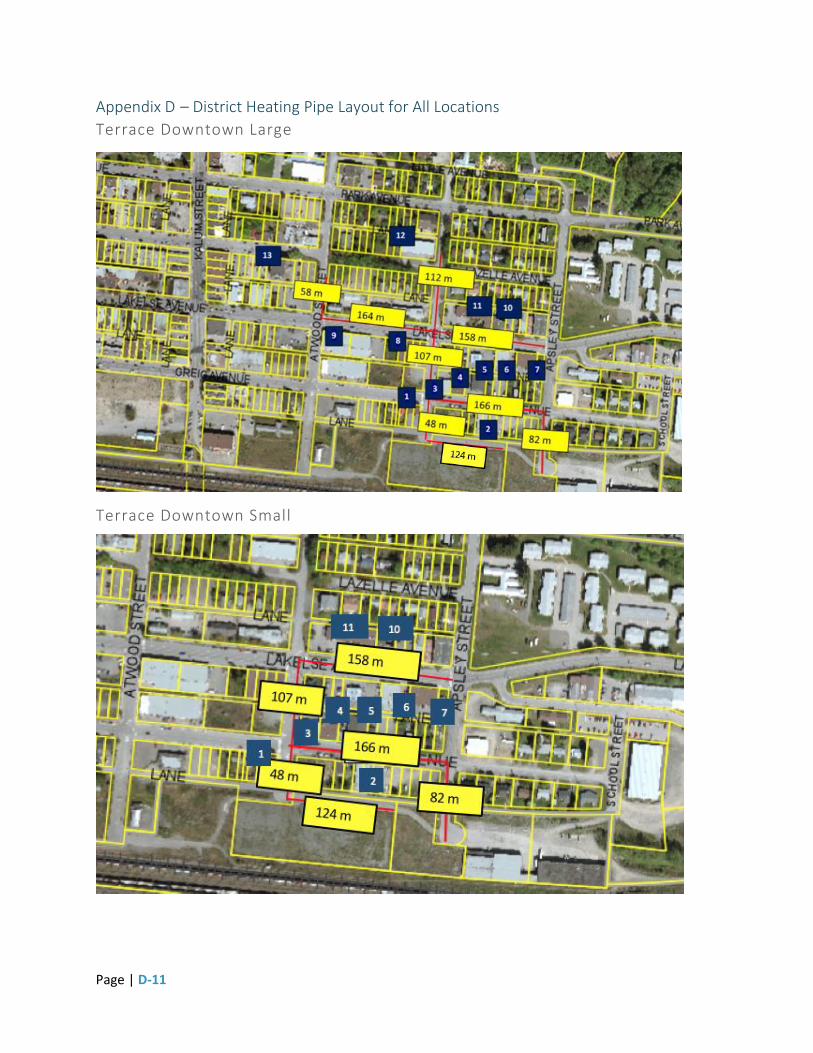
Page | D-11
Appendix D – District Heating Pipe Layout for All Locations
Terrace Downtown Large
Terrace Downtown Small

Page | D-1
Thornhill
Dease Lake
Terrace Industrial

Page | E-2
Appendix E – Capital & Operating Cost Summary Table 20: Dease Lake plant capital cost estimate
Component Unit Quantity Unit cost Amount
Detailed feasibility study cost 1 $10,000.00 $10,000.00
Development cost 1 $10,000.00 $10,000.00
Pyrolysis and gasifier system kW 1195 $529.54 $632,796.48
ICE-genset kW 86 $1,101.49 $94,727.79
Biomass storage and handling kW 839 $1,186.59 $995,549.89
Engineering % 10% $1,743,074.17 $174,307.42
Contingency % 10% $1,743,074.17 $174,307.42
Total cost $2,091,689.00
Table 21: Terrace downtown large capital cost estimate
Component Unit Quantity Unit cost Amount
Feasibility study cost 1 $10,000.00 $10,000.00
Development cost 1 $10,000.00 $10,000.00
Pyrolysis and gasifier system kW 4041 $529.54 $2,139,622.89
ICE-genset kW 86 $1,101.49 $94,727.79
Biomass storage and handling kW 3400 $987.68 $3,358,115.16
Engineering % 10% $5,612,465.83 $561,246.58
Contingency % 10% $5,612,465.83 $561,246.58
Total initial cost $6,734,959.00
Table 22: Terrace downtown small capital cost estimate
Component Unit Quantity Unit cost Amount
Detailed feasibility study cost 1 $10,000.00 $10,000.00
Development cost 1 $10,000.00 $10,000.00
Pyrolysis and gasifier system kW 1878 $529.54 $994,646.63
ICE-genset kW 86 $1,101.49 $94,727.79
Biomass storage and handling kW 1454 $1,073.62 $1,561,042.24
Engineering % 10% $2,670,416.67 $267,041.67
Contingency % 10% $2,670,416.67 $267,041.67
Total cost $3,204,500.00
Table 23: Terrace industrial plant capital cost estimate
Component Unit Quantity Unit cost Amount
Detailed feasibility study cost 1 $10,000.00 $10,000.00
Development cost 1 $10,000.00 $10,000.00
Pyrolysis and gasifier system kW 2997 $529.54 $1,587,139.48
ICE-genset kW 86 $1,101.49 $94,727.79
Biomass storage and handling kW 2461 $1,011.64 $2,489,637.73
Engineering % 10% $4,191,505.00 $419,150.50
Contingency % 10% $4,191,505.00 $419,150.50
Total cost $5,029,806.00
Table 24: Thornhill plant capital cost estimate
Component Unit Quantity Unit cost Amount
Detailed feasibility study cost 1 $10,000.00 $10,000.00
Development cost 1 $10,000.00 $10,000.00
Pyrolysis and gasifier system kW 1889 $529.54 $1,000,530.38
ICE-genset kW 86 $1,101.49 $94,727.79
Biomass storage and handling kW 1464 $1,088.12 $1,593,010.17
Engineering % 10% $2,708,268.33 $270,826.83
Contingency % 10% $2,708,268.33 $270,826.83
Total cost $3,249,922.00

Page | E-3
Table 25: Summary of operating and maintenance costs.
*Operating and maintenance cost estimates are adapted from Engineering Economic Analysis of Chemical
Processes by Richard Turton; Chapter 8 - Estimation of Manufacturing Costs p.225; midpoint values from typical
ranges of multiplying factors were assumed.
Capital Costs
Location
District Heat System &
Boiler
Equipment Capital
Estimate
Assessed Value of
Land
Fixed Capital
Investment (FCI)
Terrace DT Large 1,338,936.39$ 6,734,959.00$ 318,000.00$ 8,391,895.39$
Terrace DT Small 699,854.46$ 3,204,500.00$ 318,000.00$ 4,222,354.46$
Thornhill 398,911.04$ 3,249,922.00$ 242,000.00$ 3,890,833.04$
Dease Lake 678,573.63$ 2,091,689.00$ 24,700.00$ 2,794,962.63$
Industrial Site 902,123.97$ 5,029,806.00$ 275,000.00$ 6,206,929.97$
Annual Operating & Maintenance Costs
Location FCI O&M
Feedstock Required
(Odt/yr)
Feedstock
Required (Odt/hr ) Feedstock Cost
Terrace DT Large 8,391,895.39$ 2,654,494.09$ 9873.00 1.127 314,856.00$
Terrace DT Small 4,222,354.46$ 1,666,196.26$ 4590.24 0.524 123,936.48$
Thornhill 3,890,833.04$ 1,617,433.61$ 4616.52 0.527 124,646.04$
Dease Lake 2,794,962.63$ 1,347,288.31$ 2920.32 0.333 78,848.64$
Industrial Site 6,206,929.97$ 2,136,322.95$ 7323.36 0.836 197,730.72$
Operations & Maintenance
1. Raw Materials - Feedstock Source Available (Odt/yr) Required (Odt/yr) Price ($/Odt) Cost
Wood chips small scale sawmill 8,800 8,800 27.00$ 237,600.00$
Forestry residuals (slash) small scale sawmill 5,680 1,073 72.00$ 77,256.00$
Terrace DT Large Total Feedstock Cost (CRM) 14,480 9,873 314,856.00$
Wood chips small scale sawmill 8,800 4,590 27.00$ 123,936.48$
Forestry residuals (slash) small scale sawmill 5,680 - 72.00$ -$
Terrace DT Small Total Feedstock Cost (CRM) 14,480 4,590 123,936.48$
Wood chips small scale sawmill 8,800 4,617 27.00$ 124,646.04$
Forestry residuals (slash) small scale sawmill 5,680 - 72.00$ -$
Thornhill Total Feedstock Cost (CRM) 14,480 4,617 124,646.04$
Wood chips small scale sawmill 8,800 2,920 27.00$ 78,848.64$
Forestry residuals (slash) small scale sawmill 5,680 - 72.00$ -$
Dease Lake Total Feedstock Cost (CRM) 14,480 2,920 78,848.64$
Wood chips small scale sawmill 8,800 7,323 27.00$ 197,730.72$
Forestry residuals (slash) small scale sawmill 5,680 - 72.00$ -$
Industrial Site Total Feedstock Cost (CRM) 14,480 7,323 197,730.72$
2. Utilities Type Unit Price per unit Required Cost
Electricity Basic Charge $/day 0.24$ 0 -$
Demand Charge $/kW 11.21$ 0 -$
Energy Charge $/kWh 0.06$ 0 -$
Total Utilities Cost (CUT) -$
3. Operating Labour # of Personnel Wage ($/hr) hours Accumulative Salary
Facility Manager 1 30.00$ 2080 62,400.00$
Facility Coordinator 1 25.00$ 2080 52,000.00$
Supervisor 1 25.00$ 2080 52,000.00$
Operators 4 25.00$ 2080 208,000.00$
Seasonal Labour 4 18.00$ 640 46,080.00$
Total Operating Labour Cost (COL) 420,480.00$
0.280*FCI + 2.73*COL + 1.23*(CUT + CRM) Terrace DT Large Terrace DT Small Thornhill Dease Lake Industrial Site
Total Manufacturing Cost (COM) 3,884,913.99$ 2,717,442.53$ 2,624,616.53$ 2,317,772.82$ 3,273,123.67$
Manufacturing Cost w/out CRM 3,497,641.11$ 2,330,169.65$ 2,237,343.65$ 1,930,499.94$ 2,885,850.79$
4. Additional Direct Manufacturing CostsMultiplying Factor
Maintenance and repairs 0.06*FCI 503,513.72$ 253,341.27$ 233,449.98$ 167,697.76$ 372,415.80$
Operating supplies 0.009*FCI 75,527.06$ 38,001.19$ 35,017.50$ 25,154.66$ 55,862.37$
Laboratory charges 0.15*COL 63,072.00$ 63,072.00$ 63,072.00$ 63,072.00$ 63,072.00$
Total Cost 642,112.78$ 354,414.46$ 331,539.48$ 255,924.42$ 491,350.17$
5. Fixed Manufacturing Costs Multiplying Factor
Local taxes and insurance 0.032*FCI 268,540.65$ 135,115.34$ 124,506.66$ 89,438.80$ 198,621.76$
Total Cost 268,540.65$ 135,115.34$ 124,506.66$ 89,438.80$ 198,621.76$
6. General Manufacturing Costs Multiplying Factor
Administrative costs 0.177*COL + 0.009*FCI 149,952.02$ 112,426.15$ 109,442.46$ 99,579.62$ 130,287.33$
Distribution and selling costs 0.11*COM 427,340.54$ 298,918.68$ 288,707.82$ 254,955.01$ 360,043.60$
Research and development 0.05*COM 194,245.70$ 135,872.13$ 131,230.83$ 115,888.64$ 163,656.18$
Total Cost 771,538.26$ 547,216.95$ 529,381.10$ 470,423.27$ 653,987.12$

Page | F-1
Appendix F – Cash Flow Diagram for Thornhill Location

Page | F-2

Page | G-1
Appendix G – Risk Matrix Table 26: Complete matrix for project risks.
Risk Primary
Risk Type Probability
Justification of Probability
Severity Justification of
Severity Risk Mitigating Actions
Residual Risk
No purchase agreement from BC Hydro
Economic
H
BC Hydro stated goals. High probability of Site C dam going ahead.
H
This would render the plant non-functional if electricity was the main product.
H
Do not focus on electricity sales as a product. Or design a flexible plant.
L
A lack of sign-on for district heating system
Economic
M
Initial investment is required and it is a new technology. H
Would likely cause economic failure of the project.
H
Push the technology. Look for grants or subsidies to reduce the costs of connecting. Look for Government buildings to sign on.
M
Cost over-runs
Economic
M
New technology; there may be unforseen issues.
M
Could impact the success of the project. In worst case, it could lead to failure to finish construction.
M
Plan conservatively, have an adequate contingency and run risk models to minimize chance of unacceptable cost over-runs.
L-M
Lack of accessible fuel or over-cost fuel
Economic/ Operational
M
From fuel estimation, we know that there is a lot of residual wood around. There may be issues with getting it at a low enough price to break even.
H
If fuel is limiting, the project could be inoperable for periods of time, which would likely lead to economic failure.
H
Identify and approach multiple possible fuel sources and providers. Consider the ability to stockpile fuel in order to buffer any shortages.
M
Poor quality fuel (worse quality than predicted)
Economic/ Operational
M
Slash may have poor characteristics or contamination. We also know that the wood in the area may be wet/low quality.
M
If the majority of the fuel is very low quality, it would lead to decreased yield and increased wear, hurting the economic prospects over time.
M
Accurately research fuel supplies, conduct test-burns, and get laboratory analysis on the expected fuels.
L/M
Premature, frequent engine failure (electrical system)
Economic/ Operational
M
Wood gasifier syngas without cleaning stages is known to be hard on generators. M
Frequent engine failure is expected in small scale wood gasifier systems. Over time frequent engine failure would have a negative economic impact.
M
Run with a conservative estimate of engine life, and conduct preventative maintenance. This is something that the pilot would be testing.
L/M
Explosion or major fire in plant
Safety
L
With gases and high temperatures, there is always the possibility of an incident. Implementing maintenance and proper process control, it is a low probability.
H
An explosion or large fire has the potential to destroy a large part of the system and injure or result in death. M
Preventative maintenance and inspections, fail-safe, auto shut-off systems, leak detection and gas detection systems. Adequate fire extinguishing systems.
L/M
Fire in feedstock or product storage
Safety
L
Stored biomass can build up heat, and the produced biochar comes out of the cooling system with some residual heat.
H
A fire would have health and safety impacts due to the smoke, it would damage the facility, and impact the economic success by destroying feedstock or product, and causing downtime.
M
Adequately designed storage and handling systems. Include early high-temperature/fire detection systems.
L/M

Page | G-2
Leaks in gas handling system (without a fire).
Safety
M
Over time piping will get damaged, and weaken.
M
Leaks could cause health impacts, downtime for fixes, and potentially fires. M
Gas and leak detection systems, preventative maintenance. Evacuation procedures.
L
Warm winters requiring less heating
Economic/ Operational
M
Climate change is happening; past climate trends are less indicative of future climate trends.
M
Lower than predicted heating demand would mean less ability to sell heat and could result in lower profits or the system being over-capacity.
M
Conservative temperature predictions, risk analysis, ensure flexibility in design. L/M
Inability to obtain suitable land
Operational
M
There may be issues with zoning or land availability.
H
Suitable lots may be owned and not available for purchase.
H
Research into land and zoning. Obtain multiple possible locations.
M
Public push-back
Social
M
Public may not want such a system nearby, especially due to increased trucking or noise. There is the potential for air quality issues or accidents.
M
Public push back could lead to delays or not achieving approval to proceed.
M
Public consultation, getting out the environmentally friendly message and local nature.
L-M
Inability to sell biochar
Economic/ Operational
M
The consumer market may reach saturation, and there may not be enough customers in the area to sustain the plant.
M
If we cannot sell biochar, or have to give it away that would cause economic problems, especially during times of low heat demand.
M
Market research, flexibility in operations, and ability to gassify some of the char to help control char production. Consider exporting.
L/M
Truck or equipment accident
Safety/ operational
M
With trucks and loading/unloading equipment, there is a reasonable probability of an accident occuring over time.
M
It could cause injury, downtime, and economic loss from repairing damage. M
Safety equipment in the yard such as parabolic mirrors and brightly painted obstacles. Effective training, site orientation for first-time drivers/operators.
L/M
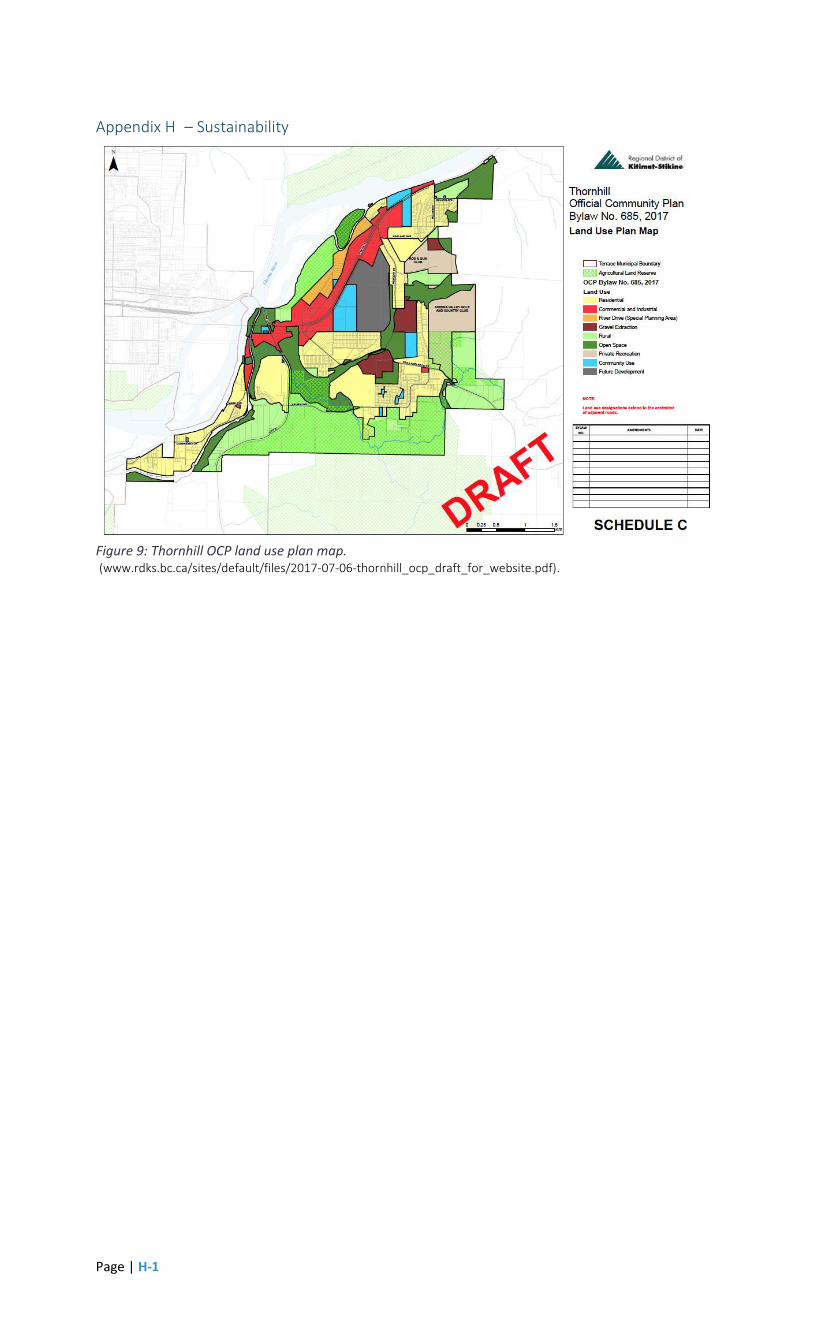
Page | H-1
Appendix H – Sustainability
Figure 9: Thornhill OCP land use plan map. (www.rdks.bc.ca/sites/default/files/2017-07-06-thornhill_ocp_draft_for_website.pdf).

Page | I-1
Appendix I – Sample Calculations
I.1 District Heating
Mass Flow of Water
�̇� =�̇�
𝑐∆𝑇
�̇� =9.564
𝐺𝐽
𝑑𝑎𝑦
0.000004184 𝐺𝐽
𝑘𝑔℃× (85℃ − 55℃)
= 76195𝑘𝑔
𝑑𝑎𝑦
Pipe Diameter
𝑑 = √𝐴
1
4× 𝜋
× 1000
𝑑 = √0.000441𝑚2
1
4× 𝜋
× 1000 = 23.7𝑚𝑚
I.2 Economic Analysis & Bioproduct Price Estimates
Before Tax Cash Flow:
𝑩𝑻𝑪𝑭 = 𝑮𝒓𝒂𝒏𝒕 𝑭𝒖𝒏𝒅𝒊𝒏𝒈 + 𝑼𝒏𝒊𝒇𝒐𝒓𝒎 𝑨𝒏𝒏𝒖𝒂𝒍 𝑩𝒆𝒏𝒆𝒇𝒊𝒕 − 𝑨𝒏𝒏𝒖𝒂𝒍 𝑶&𝑴 − 𝑪𝒂𝒑𝒊𝒕𝒂𝒍 𝑪𝒐𝒔𝒕 𝐵𝑇𝐶𝐹𝑦𝑒𝑎𝑟 0 = 0 + 0 − 0 − 5,058,082.95 = −$5,058,082.95
𝐵𝑇𝐶𝐹𝑦𝑒𝑎𝑟 2 = 0 + 3,312,949.31 − (1.0075)2,102,663.69 − 0 = $1,194,515.61
*where Annual O&M is assumed to increase by 1.0075.
Present Worth of Before Tax Cash Flow:
𝑷𝑾𝑩𝑻𝑪𝑭 = 𝑩𝑻𝑪𝑭(𝟏 + 𝒊)−𝒏 , 𝒊 = 𝑴𝑨𝑹𝑹 = 𝟎. 𝟏𝟓 𝑃𝑊𝐵𝑇𝐶𝐹,𝑦𝑒𝑎𝑟 2 = 1,194,515.61(1 + 0.05)−2 = $1,083,460.90
Capital Cost Allowance:
𝑪𝑪𝑨𝒏 = 𝒅 ∗ 𝑼𝑪𝑪𝒏−𝟏 *Note: First year exception calls for depreciation of assets by only half the depreciation rate. Assumes a 10% CCA Rate. 𝐶𝐶𝐴𝑌𝑒𝑎𝑟 1 = 3,249,922.00 ∗ 0.5 ∗ 0.1 = $162,496.10 𝐶𝐶𝐴𝑌𝑒𝑎𝑟 2 = (3,249,922.00 − 162,496.10) ∗ 0.1 = $308,742.59
Taxation & Profit:
𝑻𝒂𝒙𝒂𝒃𝒍𝒆 𝑰𝒏𝒄𝒐𝒎𝒆 = 𝑩𝑻𝑪𝑭 − 𝑪𝑪𝑨 𝑇𝑎𝑥𝑎𝑏𝑙𝑒 𝐼𝑛𝑐𝑜𝑚𝑒𝑌𝑒𝑎𝑟 2 = 1,194,515.64 − 308,742.59 = $885,773.05
𝐼𝒏𝒄𝒐𝒎𝒆 𝑻𝒂𝒙 = ($𝟓𝟎𝟎, 𝟎𝟎𝟎 ∗ 𝟎. 𝟎𝟐) + (𝑻𝒂𝒙𝒂𝒃𝒍𝒆 𝑰𝒏𝒄𝒐𝒎𝒆 − $𝟓𝟎𝟎, 𝟎𝟎𝟎) ∗ 𝟎. 𝟏𝟐 *Assumes a small business corporate tax rate of 2% on first $500,000 income, and a general corporate tax rate of 12% on income over $500,000.
𝐼𝑛𝑐𝑜𝑚𝑒 𝑇𝑎𝑥𝑌𝑒𝑎𝑟 2 = (500,000 ∗ 0.02) + (885,773.05 − 500,000) ∗ 0.12 = $56,292.77 𝑨𝒄𝒕𝒖𝒂𝒍 𝑵𝒆𝒕 𝑷𝒓𝒐𝒇𝒊𝒕 (𝒂𝒄𝒄𝒐𝒖𝒏𝒕𝒊𝒏𝒈 𝒇𝒐𝒓 𝑰𝒏𝒇𝒍𝒂𝒕𝒊𝒐𝒏) =)𝑵𝒆𝒕 𝑷𝒓𝒐𝒇𝒊𝒕 (𝟏 + 𝒇)𝒏 *Assumes a 2% inflation rate.
𝐴𝑐𝑡𝑢𝑎𝑙 𝑁𝑒𝑡 𝑃𝑟𝑜𝑓𝑖𝑡𝑌𝑒𝑎𝑟 2 = 1,138,222.88 (1 + 0.02)2 = $1,184,207.08
𝑷𝒓𝒆𝒔𝒆𝒏𝒕 𝑾𝒐𝒓𝒕𝒉 (𝑨𝒄𝒕𝒖𝒂𝒍 𝑵𝒆𝒕 𝑷𝒓𝒐𝒇𝒊𝒕) = 𝑨𝒄𝒕𝒖𝒂𝒍 𝑵𝒆𝒕 𝑷𝒓𝒐𝒇𝒊𝒕 (𝟏 + 𝒊)−𝒏
𝑃𝑊 (𝑁𝑒𝑡 𝑃𝑟𝑜𝑓𝑖𝑡)𝑌𝑒𝑎𝑟 2 = 1,184,207.08 (1 + 0.05)−2 = $1,074,110.73
After Tax Cash Flow:
𝑨𝑻𝑪𝑭 = 𝑩𝑻𝑪𝑭 − 𝑰𝒏𝒄𝒐𝒎𝒆 𝑻𝒂𝒙 𝑁𝑒𝑡 𝑃𝑟𝑜𝑓𝑖𝑡𝑌𝑒𝑎𝑟 2 = 1,194,515.64 − 56,292.77 = $1,138,222.88 𝑷𝒓𝒆𝒔𝒆𝒏𝒕 𝑾𝒐𝒓𝒕𝒉 (𝑨𝑻𝑪𝑭) = 𝑨𝑻𝑪𝑭 (𝟏 + 𝒊)−𝒏 𝑃𝑊 (𝐴𝑇𝐶𝐹)𝑌𝑒𝑎𝑟 2 = 1,138,222.88 (1 + 0.05)−2 = $1,032,401.70

Page | I-2
Bioproduct Price Estimates Sample Calculations
All prices are presented in Canadian currency and assume $1.00 USD is worth $1.25 CAD.
Bagged Biochar Average Retail Price $48.40 per ft3 bag
Assumes a 40% mark-up from wholesale to retail price.
𝑊ℎ𝑜𝑙𝑒𝑠𝑎𝑙𝑒 𝑃𝑟𝑖𝑐𝑒 =$48.40
1.40= $35.57 𝑝𝑒𝑟 𝑓𝑡3 𝑏𝑎𝑔
Briquetted Biochar Average Retail Price $3.14 per kg ($36.38 per ft3 bag)
Assumes a charcoal briquette density of 408.7 kg/m3.
𝑅𝑒𝑡𝑎𝑖𝑙 𝑃𝑟𝑖𝑐𝑒 =$3.14
𝑘𝑔×
408.7𝑘𝑔
𝑚3×
1𝑚3
35.31𝑓𝑡3= $36.38 𝑝𝑒𝑟 𝑓𝑡3 𝑏𝑎𝑔
𝑊ℎ𝑜𝑙𝑒𝑠𝑎𝑙𝑒 𝑃𝑟𝑖𝑐𝑒 = $36.38
1.40= $30.00 𝑝𝑒𝑟 𝑓𝑡3 𝑏𝑎𝑔
Bulk Biochar Price Range $0.89 to $1.00 per lb
Assumes an average bulk density of biochar of 263.6 kg/m3.
𝑊ℎ𝑜𝑙𝑒𝑠𝑎𝑙𝑒 = $0.89
𝑙𝑏×
2.2046 𝑙𝑏
𝑘𝑔×
1000 𝑘𝑔
𝑚3= $1962.11 𝑝𝑒𝑟 𝑡𝑜𝑛𝑛𝑒
I.3 Capital Cost Calculations
Capital cost calculations for the Thornhill plant are described below. Equipment cost estimates
are based on installed values from the EPA Biomass CHP Catalog of Technologies (2007). The cost for the
pyrolysis and gasifier system was determined by doubling the cost of a gasifier, and also includes syngas
cleanup and cooling technology. Costs for detailed feasibility and development studies are assumed at
$10,000 each. Engineering and contingency values are assumed to be 10% of installed equipment costs.
Scaling calculations were based on economic estimation described in Basu (2013). Scaled unit costs were
converted to Canadian dollars. The EPA report indicates the unit costs for gasifier systems do not show a
uniform declining trend as a function of size. Instead, they vary depending on the process considered.
Reference gasifier system syngas rate (EPA, 2007, p 54):
32.2𝑥106𝐵𝑇𝑈
ℎ𝑥
ℎ
3600𝑠 𝑥
1.05506𝑘𝐽
𝐵𝑇𝑈= 9436.93
𝑘𝐽
𝑠= 9436.93 𝑘𝑊
Reference gasifier system unit cost (EPA, 2007, p 54):
$ 𝑈𝑆𝐷 1837000 ∗ (1
9436.93 𝑘𝑊) ∗ (
𝐶𝐸𝑃𝐼 𝐹𝑒𝑏 2017 558.3
𝐶𝐸𝑃𝐼 2007 525.4 ) 𝑥
$𝐶𝐴𝐷 1.28
$𝑈𝑆𝐷 1.00 𝑥 2 =
$529.54
𝑘𝑊
Pyrolysis/gasifier system cost based on the calculated syngas output rate from the gasfier:
1889 𝑘𝑊 𝑥 $529.54
𝑘𝑊 = $1,000,530.38
Reference gas ICE unit cost (EPA, 2007, p72):
$USD 900
kW𝑥 (
86 𝑘𝑊
100 𝑘𝑊)
0.7
𝑥 (𝐶𝐸𝑃𝐼 𝐹𝑒𝑏 2017 558.3
𝐶𝐸𝑃𝐼 2007 525.4 ) 𝑥
$𝐶𝐴𝐷 1.28
$𝑈𝑆𝐷 1.00 =
$1101.49
kW
ICE-genset cost:

Page | I-3
86 kW x$1101.49
kW= $94,727.79
Reference biomass storage and fuel handling unit costs (EPA, 2007, p 60): $ USD 800
kW𝑥 (
𝐶𝐸𝑃𝐼 𝐹𝑒𝑏 2017 558.3
𝐶𝐸𝑃𝐼 2007 525.4 ) 𝑥
$𝐶𝐴𝐷 1.28
$𝑈𝑆𝐷 1.00 =
$1088.12
kW
Biomass storage and fuel handling unit costs:
1464 𝑘𝑊 𝑥 $1088.12
kW𝑥 = $1,593,010.17
Total Installed equipment costs:
$1,000,530.38 + $94,727.79 + $1,593,010.17 = $ 2,708,268.33
Engineering costs as percentage of total equipment costs:
$ 2,708,268.33 x 10% = $270,826.83
Contingency costs as a percentage of total equipment costs:
$ 2,708,268.33 x 10% = $270,826.83
Total installed cost: Total equipment costs + engineering + contingency costs: $3,249,922.00
I.4 Feedstock Calculations
Amounts of sawmill residuals were estimated for large and small-scale sawmills near Terrace and
Thornhill, BC. The amount of residuals was estimated based on typical product recovery for coastal mills
at about 46% lumber, 41% by-product chips, 10% sawdust and shavings and 2% lumber shrinkage
(Ministry of Forests, Lands and Natural Resource Operations, 2017). In BC, it has been estimated that 25%
of the harvest is slash, and of that 80% is roadside slash and 20% stumps (Bradley, 2007). Annual harvest
breakdown is provided in Table 27 for the large mill (Skeena Sawmill) and Table 28 for combination of
small-scale mills in the area.
Information for small-scale sawmills was obtained from a report on the Kalum-Kispiox region that
determined 49,600 m3 of sawlogs were used annually for the mills investigated (Brouwer & Jobb, 2005).
This is approximately 21,300 Odt when an assumed average wood density of 430 kg/m3 is used for the
species in the region. Logs from the harvest also assumed a lumber recovery factor of 222 bf/m3. Small-
scale mills are estimated to produce 8,800 t of by-product chips and 2,100 t sawdust/shavings.
Skeena Sawmill is a large-scale sawmill in Terrace with an annual capacity of 120 million bf in
2015 (Ministry of Forests, Lands and Natural Resource Operations, 2017). It is estimated that this sawmill
would generate 71,200 Odt of by-product chips and 17,200 Odt sawdust/shavings, assuming a lumber
recovery factor of 300 bf/m3 (Spelter & Alderman, 2005).
Harvested amounts of fibre logs were also estimated assuming the composition of the cut is 60%
sawlog and 40% fibre log for the region (Brouwer and Jobb, 2005). For the small scale mills, the estimated
fibre log harvest is 14,200 Odt. For Skeena Sawmill, an amount of 114,600 Odt of fibre logs from the
harvest. This fibre log portion is potentially available as feedstock, since the regional pulp mills that
previously accepted fibre quality chips has ceased operating (Sauder, 2012).

Page | I-4
Table 27: Skeena Sawmill (2015) Annual Harvest Breakdown. Percentage Volume (m3) Amount (Odt)
Sawlog 75.0% 400,000 171,900
Sawmill Lumber 46.3% 185,200 79,600 By-product Chips 41.4% 165,600 71,200 Sawdust/Shavings 10.0% 40,000 17,200 Lumber shrinkage 2.3% 9,200 3,900
Forest Residue 25.0% 133,300 57,300
Roadside slash 80.0% 106,700 45,800 Stumps 20.0% 26,700 11,500
Total 100% 533,300 229,200
Table 28: Small-Scale Mills in the Kalum-Kispiox Region (2005) Annual Harvest Breakdown. Percentage Volume (m3) Amount (Odt)
Sawlog 75.0% 49,600 21,300
Sawmill Lumber 46.3% 22,950 9,860 By-product Chips 41.4% 20,520 8,800 Sawdust/Shavings 10.0% 4,960 2,100 Lumber shrinkage 2.3% 1,140 490
Forest Residue 25.0% 16,520 7,100
Roadside slash 80.0% 13,220 5,680 Stumps 20.0% 3,300 1,420
Total 100% 66,100 28,400