(thousand barrels per day) former united - cftc.gov · table 1 .1c world crude oil production...
TRANSCRIPT
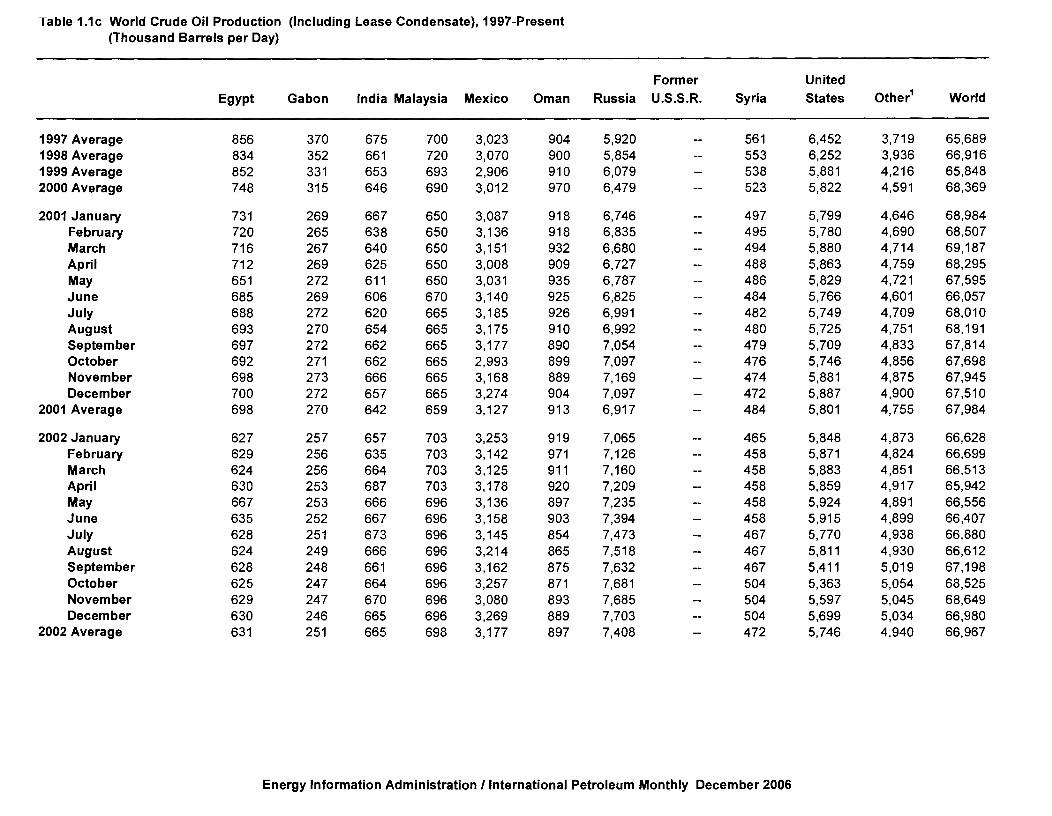
Table 1 .1c World Crude Oil Production ( Including Lease Condensate), 1997 -Present(Thousand Barrels per Day)
Egypt Gabon India Malaysia Mexico Oman RussiaFormerU .S.S.R. Syria
UnitedStates Other World
1997 Average 856 370 675 700 3,023 904 5,920 - 561 6,452 3,719 65,6891998 Average 834 352 661 720 3,070 900 5,854 - 553 6,252 3,936 66,9161999 Average 852 331 653 693 2,906 910 6,079 - 538 5,881 4,216 65,8482000 Average 748 315 646 690 3,012 970 6,479 -- 523 5,822 4,591 68,369
2001 January 731 269 667 650 3,087 918 6,746 - 497 5,799 4,646 68,984February 720 265 638 650 3,136 918 6,835 -- 495 5,780 4,690 68,507March 716 267 640 650 3,151 932 6,680 -- 494 5,880 4,714 69,187April 712 269 625 650 3,008 909 6,727 - 488 5,863 4,759 68,295May 651 272 611 650 3,031 935 6,787 -- 486 5,829 4,721 67,595June 685 269 606 670 3,140 925 6,825 - 484 5,766 4,601 66,057July 688 272 620 665 3,185 926 6,991 -- 482 5,749 4,709 68,010August 693 270 654 665 3,175 910 6,992 -- 480 5,725 4,751 68,191September 697 272 662 665 3,177 890 7,054 - 479 5,709 4,833 67,814October 692 271 662 665 2,993 899 7,097 -- 476 5,746 4,856 67,698November 698 273 666 665 3,168 889 7,169 - 474 5,881 4,875 67,945December 700 272 657 665 3,274 904 7,097 -- 472 5,887 4,900 67,510
2001 Average 698 270 642 659 3,127 913 6,917 - 484 5,801 4,755 67,984
2002 January 627 257 657 703 3,253 919 7,065 - 465 5,848 4,873 66,628February 629 256 635 703 3,142 971 7,126 -- 458 5,871 4,824 66,699March 624 256 664 703 3,125 911 7,160 - 458 5,883 4,851 66,513April 630 253 687 703 3,178 920 7,209 - 458 5,859 4,917 65,942May 667 253 666 696 3,136 897 7,235 - 458 5,924 4,891 66,556June 635 252 667 696 3,158 903 7,394 - 458 5,915 4,899 66,407July 628 251 673 696 3,145 854 7,473 -- 467 5,770 4,938 66,880August 624 249 666 696 3,214 865 7,518 - 467 5,811 4,930 66,612September 628 248 661 696 3,162 875 7,632 - 467 5,411 5,019 67,198October 625 247 664 696 3,257 871 7,681 -- 504 5,363 5,054 68,525November 629 247 670 696 3,080 893 7,685 -- 504 5,597 5,045 68,649December 630 246 665 696 3,269 889 7,703 - 504 5,699 5,034 66,980
2002 Average 631 251 665 698 3,177 897 7,408 - 472 5,746 4,940 66,967
Energy Information Administration / International Petroleum Monthly December 2006

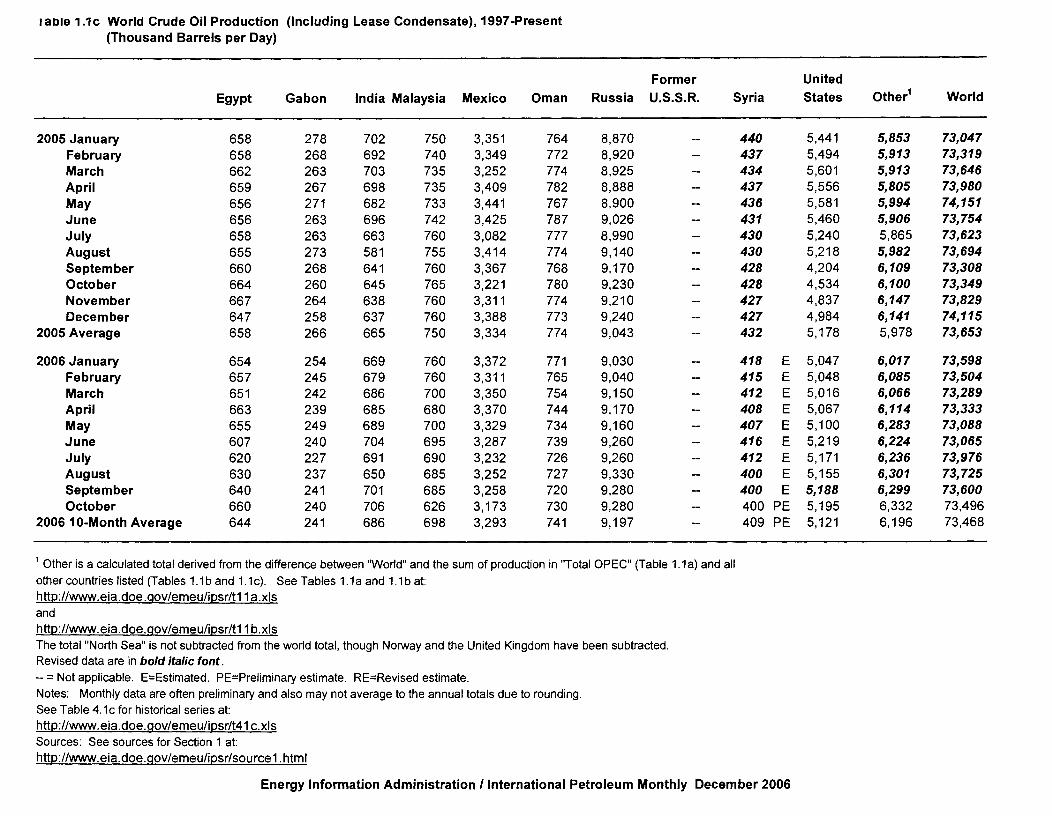
Table 1 . 1c World Crude Oil Production (Including Lease Condensate ), 1997-Present(Thousand Barrels per Day)
Egypt Gabon India Malaysia Mexico Oman RussiaFormerU.S.S.R. Syria
UnitedStates Other' World
2003 January 630 240 670 726 3,330 847 7,678 -- 467 5,785 5,053 67,521February 630 240 665 726 3,325 847 7,789 -- 467 5,791 5,057 69,093March 625 240 670 705 3,317 822 7,836 - 467 5,817 5,055 69,619April 625 240 630 726 3,282 837 7,873 -- 465 5,774 5,049 68,552May 625 240 630 732 3,320 802 7,991 - 465 5,733 5,061 68,565June 620 240 675 742 3,396 817 8,106 - 465 5,701 5,092 67,775July 610 232 675 742 3,400 827 8,238 - 463 5,526 5,076 68,384August 605 240 645 742 3,426 827 8,291 -- 463 5,595 5,195 68,842September 614 245 645 742 3,417 812 8,426 - 463 5,683 5,225 69,542October 615 245 680 748 3,398 797 8,448 - 461 5,635 5,344 70,403November 610 245 665 753 3,380 797 8,445 - 461 5,561 5,480 70,612December 610 250 670 769 3,455 797 8,444 -- 461 5,579 5,615 71,880
2003 Average 618 241 660 738 3,371 819 8,132 - 464 5,681 5,193 69,235
2004 January 610 250 665 730 3,417 762 8,457 -- 446 5,570 5,639 71,564February 607 250 690 730 3,360 762 8,503 -- 436 5,556 5,679 71,527March 590 245 683 740 3,368 768 8,562 - 426 5,607 5,770 71,502April 580 242 696 750 3,439 756 8,639 - 416 5,527 5,804 71,445May 591 240 682 760 3,394 753 8,708 -- 417 5,548 5,805 71,136June 585 237 680 760 3,436 750 8,883 - 408 5,398 5,856 72,733July 595 234 677 760 3,363 749 8,924 - 404 5,458 5,777 73,084August 596 232 680 760 3,354 740 9,013 - 405 5,333 5,777 72,159September 605 230 675 760 3,431 751 9,042 - 396 5,062 5,901 72,777October 604 237 704 790 3,451 743 9,006 -- 392 5,156 6,007 73,274November 599 237 684 764 3,364 740 8,995 - 388 5,396 5,985 72,924December 571 235 682 759 3,222 738 8,916 - 384 5,413 5,872 72,550
2004 Average 594 239 683 755 3,383 751 8,805 -- 410 5,419 5,823 72,224
Energy Information Administration / International Petroleum Monthly December 2006
lame 1 .1c World Crude Oil Production (Including Lease Condensate), 1997 -Present(Thousand Barrels per Day)
Former UnitedEgypt Gabon India Malaysia Mexico Oman Russia U.S.S.R. Syria States Other' World
2005 January 658 278 702 750 3,351 764 8,870 -- 440 5 ,441 5,853 73,047February 658 268 692 740 3,349 772 8,920 - 437 5,494 5,913 73,319March 662 263 703 735 3,252 774 8,925 - 434 5,601 5,913 73,646April 659 267 698 735 3,409 782 8,888 -- 437 5,556 5,805 73,980May 656 271 682 733 3,441 767 8,900 -- 436 5,581 5,994 74,151June 656 263 696 742 3,425 787 9,026 - 431 5,460 5,906 73,754July 658 263 663 760 3,082 777 8,990 - 430 5,240 5,865 73,623August 655 273 581 755 3,414 774 9,140 -- 430 5,218 5,982 73,694September 660 268 641 760 3,367 768 9,170 - 428 4,204 6,109 73,308October 664 260 645 765 3,221 780 9,230 - 428 4,534 6,100 73,349November 667 264 638 760 3,311 774 9,210 - 427 4,837 6,147 73,829December 647 258 637 760 3,388 773 9,240 -- 427 4,984 6,141 74,115
2005 Average 658 266 665 750 3,334 774 9,043 -- 432 5,178 5,978 73,653
2006 January 654 254 669 760 3,372 771 9,030 -- 418 E 5,047 6,017 73,598February 657 245 679 760 3,311 765 9,040 -- 415 E 5,048 6,085 73,504March 651 242 686 700 3,350 754 9,150 - 412 E 5,016 6,066 73,289April 663 239 685 680 3,370 744 9,170 - 408 E 5 ,067 6,114 73,333May 655 249 689 700 3,329 734 9,160 - 407 E 5,100 6,283 73,088June 607 240 704 695 3,287 739 9,260 - 416 E 5,219 6,224 73,065July 620 227 691 690 3,232 726 9,260 -- 412 E 5,171 6,236 73,976August 630 237 650 685 3,252 727 9,330 - 400 E 5,155 6,301 73,725September 640 241 701 685 3,258 720 9,280 - 400 E 5,188 6,299 73,600October 660 240 706 626 3,173 730 9,280 - 400 PE 5,195 6,332 73,496
2006 10-Month Average 644 241 686 698 3,293 741 9,197 - 409 PE 5,121 6,196 73,468
Other is a calculated total derived from the difference between "World" and the sum of production in "Total OPEC" (Table 1 .1a) and allother countries listed (Tables 1.1 b and 1.1 c). See Tables 1.1 a and 1.1 b at:http://www.eia.doe .gov/emeu/ipsr/tl 1 a.xlsandhttp://www. eia.doe .gov/emeu/ipsr/tl 1 b.xlsThe total "North Sea" is not subtracted from the world total, though Norway and the United Kingdom have been subtracted.Revised data are in bold italic font.- = Not applicable. E=Estimated. PE=Preliminary estimate . RE=Revised estimate.Notes : Monthly data are often preliminary and also may not average to the annual totals due to rounding.See Table 4.1c for historical series at:http://www. eia.doe .gov/emeu/ipsr/t4l c.xlsSources: See sources for Section 1 at:hftp://www. eia.doe . gov/emeu/ipsr/source1.htmi
Energy Information Administration / International Petroleum Monthly December 2006
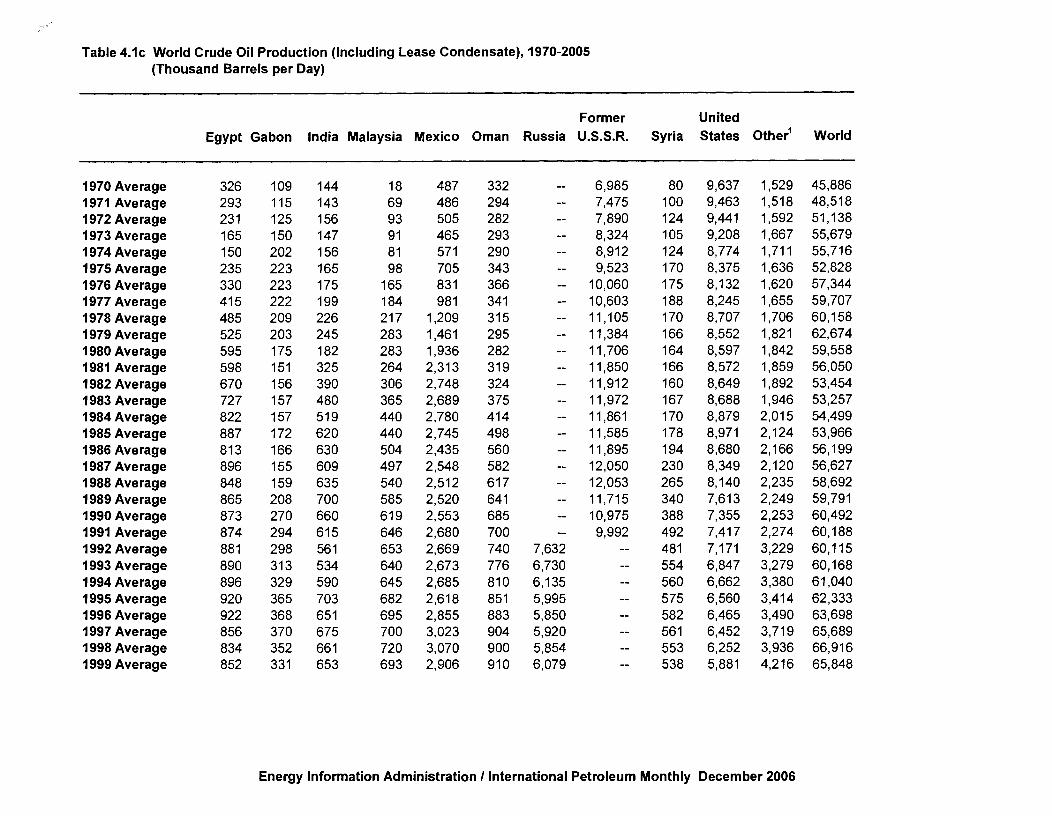
Table 4.1c World Crude Oil Production (Including Lease Condensate ), 1970-2005(Thousand Barrels per Day)
Former United
Egypt Gabon India Malaysia Mexico Oman Russia U.S.S.R. Syria States Other World
1970 Average 326 109 144 18 487 332 - 6,985 80 9,637 1,529 45,8861971 Average 293 115 143 69 486 294 -- 7,475 100 9,463 1,518 48,5181972 Average 231 125 156 93 505 282 -- 7,890 124 9,441 1,592 51,1381973 Average 165 150 147 91 465 293 -- 8,324 105 9,208 1,667 55,6791974 Average 150 202 156 81 571 290 -- 8,912 124 8,774 1,711 55,7161975 Average 235 223 165 98 705 343 - 9,523 170 8,375 1,636 52,8281976 Average 330 223 175 165 831 366 - 10,060 175 8,132 1,620 57,3441977 Average 415 222 199 184 981 341 -- 10,603 188 8,245 1,655 59,7071978 Average 485 209 226 217 1,209 315 -- 11,105 170 8,707 1,706 60,1581979 Average 525 203 245 283 1,461 295 -- 11,384 166 8,552 1,821 62,6741980 Average 595 175 182 283 1,936 282 -- 11,706 164 8,597 1,842 59,5581981 Average 598 151 325 264 2,313 319 - 11,850 166 8,572 1,859 56,0501982 Average 670 156 390 306 2,748 324 -- 11,912 160 8,649 1,892 53,4541983 Average 727 157 480 365 2,689 375 -- 11,972 167 8,688 1,946 53,2571984 Average 822 157 519 440 2,780 414 -- 11,861 170 8,879 2,015 54,4991985 Average 887 172 620 440 2,745 498 -- 11,585 178 8,971 2,124 53,9661986 Average 813 166 630 504 2,435 560 -- 11,895 194 8,680 2,166 56,1991987 Average 896 155 609 497 2,548 582 -- 12,050 230 8,349 2,120 56,6271988 Average 848 159 635 540 2,512 617 -- 12,053 265 8,140 2,235 58,6921989 Average 865 208 700 585 2,520 641 -- 11,715 340 7,613 2,249 59,7911990 Average 873 270 660 619 2,553 685 - 10,975 388 7,355 2,253 60,4921991 Average 874 294 615 646 2,680 700 - 9,992 492 7,417 2,274 60,1881992 Average 881 298 561 653 2,669 740 7,632 -- 481 7,171 3,229 60,1151993 Average 890 313 534 640 2,673 776 6,730 -- 554 6,847 3,279 60,1681994 Average 896 329 590 645 2,685 810 6,135 -- 560 6,662 3,380 61,0401995 Average 920 365 703 682 2,618 851 5,995 -- 575 6,560 3,414 62,3331996 Average 922 368 651 695 2,855 883 5,850 -- 582 6,465 3,490 63,6981997 Average 856 370 675 700 3,023 904 5,920 -- 561 6,452 3,719 65,6891998 Average 834 352 661 720 3,070 900 5,854 -- 553 6,252 3,936 66,9161999 Average 852 331 653 693 2,906 910 6,079 -- 538 5,881 4,216 65,848
Energy Information Administration / International Petroleum Monthly December 2006

Table 4.1c World Crude Oil Production ( Including Lease Condensate), 1970-2005(Thousand Barrels per Day)
Egypt Gabon India Malaysia Mexico OmanFormer
Russia U.S.S.R. SyriaUnitedStates Other' World
2000 Average 748 315 646 690 3,012 970 6,479 - 523 5,822 4,591 68,3692001 Average 698 270 642 659 3,127 913 6,917 -- 484 5,801 4,755 67,9842002 Average 631 251 665 698 3,177 897 7,408 -- 472 5,746 4,940 66,9672003 Average 618 241 660 738 3,371 819 8,132 - 464 5,681 5,193 69,2352004 Average 594 239 683 755 3,383 751 8,805 - 410 5,419 5,823 72,2242005 Average P 658 266 665 750 3,334 774 9,043 - 432 5,178 5,978 73,653
' Other is a calculated totaled derived from the difference between "World" and the sum of production in "Total OPEC"(Table 4.1 a) and all other countries listed (Tables 4.1 b and 4.1 c). See Tables 4.1 a and 4.1 b at:hftp://www.eia.doe.gov/emeu/ipsr/t4la.xls andhttp://www.eia.doe.gov/emeu/ipsr/t4l b.xisThe total "North Sea" is not subtracted from the world total, though Norway and the United Kingdom have been subtracted.- = Not applicable. P=Preliminary.Revised data are in bold italic font.Sources: See sources for Section 4 at: http://www.eia.doe.gov/emeu/ipsr/source4.html
Energy Information Administration / International Petroleum Monthly December 2006

Table GA World Production of Crude Oil, Natural Gas Plant Liquids , and Other Liquids , 1980-Present(Thousand Barrels per Day)
Energy Information Administration - ---- -International Energy Annual 2004
- -- - -
Table Posted: June 19, 2006Next Update: June 2007
Table Notes and Sources
G.1 World Production of Crude Oil, NGPL, and Other Liquids, 1980-2004(Thousand Barrels per Day)
Region/Coun_ try 1980
_
1981 1982. _ 1983 -- 1984 1985 1986 -1987Bermuda 0 0 0 0 0 0 0 0Canada 1,766.0 1,615.0 1,589.0 1,665.0 1,774.0 1,808.0 1,802.0 1,902.0Greenland
.0 0 0 0
_0 0 0 0
Mexico 2,129.0 2,554.0 3,003.0 2,954.0 3,037.0 3,016.0 2,787.3 2,886.2Saint Pierre and Miquelon 0 0 0 0 0 0 0 0United States 10,214.0 10,231.0 10,252.0 10,300.0 10,554.0 10,635.0 10,289.0 10,008.5North America 14,109.0 14,400 .0 14,844 .0 14,919 .0 15,365 .0 15,459.0 14,878 .3 14,796.8
Antarctica 0 0 0 0 0 0 0 0Antigua and Barbuda 0 0 0 0 0 0 0 0ArgentinaAruba
504.0NA
508.0NA
503.0NA
499.0NA
493.0NA
480.0NA
465.00
464.00
Bahamas, The 0 0 0 0 0 0 0 0Barbados _BelizeBoliviaBrazil
00
32.0232.5
00
26.0271.1
1.00
_ 30.0336.2
1.00
28.0446.5
2.00
27.0601.4
2.00
-- 26.0721.4
2.00
23.0713.2
1.40
23.0740.8
Cayman Islands 0 0 0 0 0 0 0 0Chile 45.0 51.0 53.0 4-9 49.0 47.0 41.0 40.0Colombia 132.0 1.013 147.0 156.0 172.0 180.0 310.0 391.0Costa Rica 0
_0 0 0 0 0 0 0
Cuba 6.0 9.0 1 1.0 13.0 16.0 19.0 20.0 20.0Dominica 0 0
_.0 0
_0 0 0 0
Dominican Republic 0 0 0 0 0 0 _ 0 0Ecuador 206.0 213.0 213.0 239.0 260.0 283.0 295.0 176.0El Salvador 0 0 0 0 0 0 0 0Falkland Islands 0 0 0 0 0 0 0 0French Guiana 0 0 0 0 0 0 0 0
-Grenada 0 0 0 0 0 0 0 0GuadeloupeGuatemalaGuyanaHaitiHondurasJamaicaMartiniqueMontserrat
05.0
000000
05.0
000000
06.0
000000
07.0
000000
05.0
0,_0
0000:
03.0
00000 j0
05.0
000000
04.0
000000-
Netherlands Antilles-
0-
0- -
0 0-
0- -
0 0 0Nicaragua 0 0 0 0 0 0 0 0Panama 0 0 0 0 0 0 0 0
URL: http://www.eia.doe.gov/pub/international/iealf/tablegl.xls Page 1
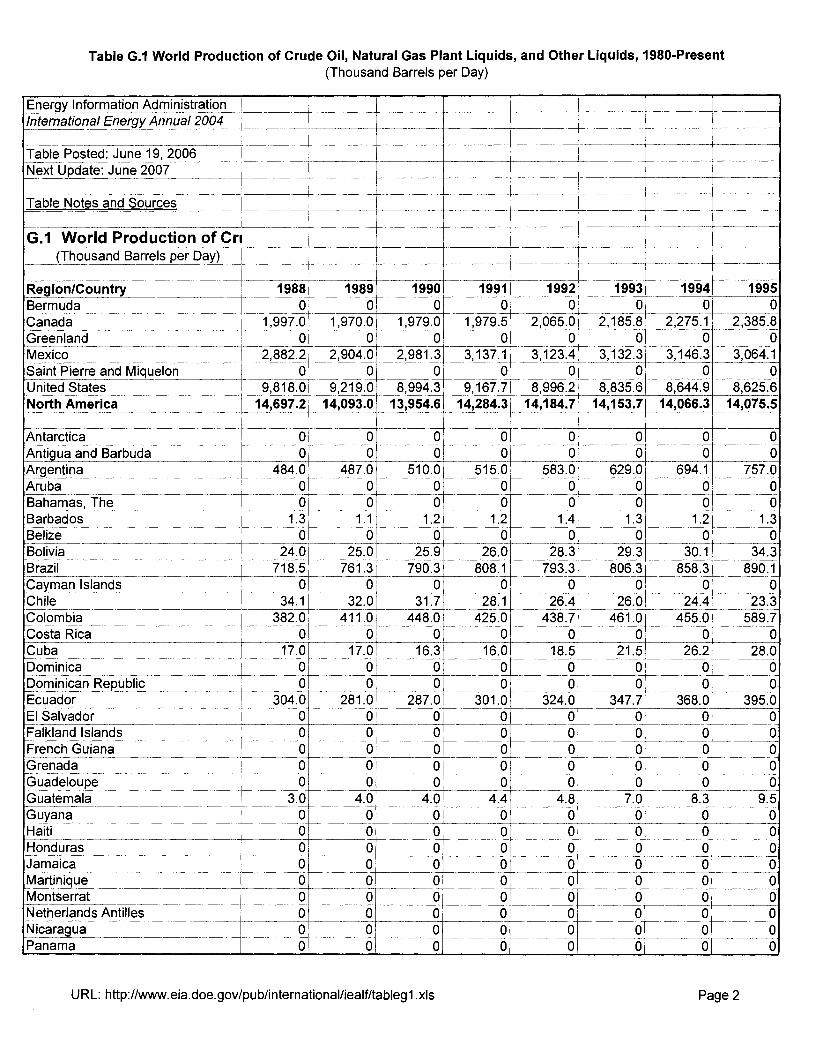
Table GA World Production of Crude Oil, Natural Gas Plant Liquids , and Other Liquids , 1980-Present(Thousand Barrels per Day)
Energy Information Administration _International Energy Annual 2004
Table Posted: June 19, 2006Next Update: June 2007
Table Notes and Sources
GA World Production of Crt(Thousand Barrels per Day)
Re ion/Country 1988 1989 1990 1991 1992 1993 1994 1995Bermuda _0 _ 0 0 _ 0 0 _ 0 0 0Canada 1,997.0 1,970.0 1,979.0 1,979.5 2,065.0 2,185.8 2,275.1
--2,385.8--Greenland_ 0 _ 0 0 0 0 0 _ 0 0_
Mexico 2,8821 2,904.0 2,981.3 3,137.1 3,123.4 3,132.3 3,146.3 3,064.1Saint Pierre and Miquelon 0 0 0 0 0 0
- - -0 0
United States 9,818.0_
9,219.0 -8,994.3 9,16-7--.7 -8,99-6--,2- .68,835.6U,8M- 8,644.9 8,625.6North America 14,697 .2 14,093 . 0
-13,954.6
--14,284.3 14,184 .7 14,153.7 14,066.3 14,075.5
^^Antarctica 0 0 0 0 0 0 0 0__Antigua and Barbuda 0 0 0 0 0 0 _ 0Argentina i 484.0 487.0 510.0
_515.0
_583.0 629.0 694.1 _ 757.0
Aruba_
0 0 0 0 0 0 0 0Bahamas, The _ 0 _ 0 _ 0 0
--0 0 0
-- 0
Barbados 1.3 1.1 1.2 1.2_
1.4 1.3 1.2 1.3BelizeBolivia
024.0
0_ 25.0
0_ 25.9
026.0
028.3
029.3
030.1
034.3
Brazil 718.5 761.3 790.3 808.1 793.3 806.3 858.3 890.1Ca man Islands _ - 0 _-_ 0 0 0 0 0 0 0Chile_ 34.1 32.0 _ 31.7 28.1 26.4 26.0 24.4 23.3Colombia 382.0_ 411.0 448.0 425.0 _ 438.7 461.0 455.0
---589.7
CostaRica _ 0 0 0 0 0 _ 0 - 0 0CubaDominica
17.00
17.00
_ 16.31 0
16.00
_ 18.50
^^
21.50
26.20
28.00
Dominican Republic_ 0 0 0 0 0 0 0 0Ecuador 304.0 281.0 287.0 301.0
_324.0 347.7 368.0 395.0
El Salvador 0 0 0 0 0 0 0 ^0Falkland Islands 0 0 0 0 0 0 0 0French Guiana 0 _0 0 0 0 _ 0 0 0Grenada 0 0 0 0 0 0 0 0Guadeloupe _ 0 0 0 _ 0 0 0 0 0Guatemala 3.0 4.0 4.0 4.4 4.8 7.0 8.3 9.5Guyana 0
00 0
000
00
00
00
00
Honduras 0 0 0 0 0 0 0_
0Jamaica----------------MartiniqueMontserrat __ -^
000
000
__ 0
' 00
000
000
_000
^000
_0
i 00
Netherlands Antilles 0 ^ 0 0 0 0 0Nicaragua 0 _0 0 0 0 0
_0 0
Panama 0 0 0 0 0 0 0 0
URL: http://www.eia .doe.gov/pub/international/iealf/tableg1 . As Page 2

Table GA World Production of Crude Oil, Natural Gas Plant Liquids, and Other Liquids , 1980-Present(Thousand Barrels per Day)
Energy Information AdministrationInternational Energy Annual 2004
Table Posted: June 19, 2006 ^-Next Update: June 2007
Table Notes and Sources
GA World Production of Cri(Thousand Barrels per Day)
Region/Country 1996 1997 1998 1999 2000 2001 2002 2003Bermuda
_ .0 0 0 0 0 0 0 0_
Canada 2,432.4 2,558.2 2,632.0 2,559.8 2,676.3---
2_,738.4-----
2,868.8 3,029.5_Greenland 0 0 0 0 0 0 0 0_Mexico 3,278.3 3,410.6 3,494.6
_3,345.0 3,450.0 3,560.1 32585.2 3,788.9_
Saint Pierre and Miquelon 0 -_ 0 0 0 0 0 0 0United States 8,607.3 8,611.4 8,391.8 8,107.1 8,110.0 8,053.8 8,043.3 7,823.2North America 14,317.9 14,580 .2 14,518 .5 14,011 .9 14,236.3 14,352 .3 14,497 .3 14,641.6
Antarctica 0 0 0 0 0 0 0 0_Antigua and Barbuda 0 0 0 0 0 0 0 0Argentina 800.0 882.1 896.7 850.2 809.1 850.4 840.1 840.1_Aruba 0 0
_0 0 0 0 0 0
Bahamas, The 0 0 0 0 0 0 0 0Barbados 1.0 0.9 1.6 1.9 1.5 1.3 1.0 1.0BelizeBolivia
036.9
037.5
043.2
040.8-
0
- 39.40
43.90
38.50
37.3Brazil 1,001.1 1,068.5 1,228.5
-1,390.8
-1,530.0 1,561.1 1,720.2 1,801.1
Cayman Islands 0 0 0 0 0 0 0 0Chile _ 21.2 14.4 13.3 12.4 10.9 11.7 11.3 11.4Colombia 633.0 656.3 736.9 820.8 694.3 626.6 578.9 544.5Costa Rica_ _ 0 0 --o 0 0 0 0 0__ _Cuba 32.0 33.0 34.0 4040 42.0 50.0 47.3 55.2Dominica 0 0 0 0 0 0 0 0Dominican Republic 0 0 0 0 0 0 0 0Ecuador 399.8 391.2 379.5 376.6 39822 41540 395.0 413.3EI Salvador 0 0 0 0 0 0 0 0Falkland Islands 0 0 0 0 0 0 0 0French Guiana _ 0 0 0 0 0 0 0 0Grenada 0
_0 0
_0
_0
_0 0 0
Guadeloupe 0 0 0 0 0 0 0 0Guatemala 12.8 15.6 23.8 233 20.7 21.1 18.0 22.0Guyana 0
_ _0 0 0
_0 0 0 0_
HaitiHonduras
00
00
00
00
0_0
00
00
00
Jamaica_
0 0 0 0 0 0 0 0Martinique _MontserratNetherlands Antilles _NicaraguaPanama
00000
_ 00000
00000
00000
0
000
_ 00000
00000
_ 00000
URL: http://www.eia . doe.gov/pub/international/iealf/tableg1 . xls Page 3

Table G . 1 World Production of Crude Oil , Natural Gas Plant Liquids , and Other Liquids , 1980-Present(Thousand Barrels per Day)
Energy Information AdministrationInternational EnergyAnnua12004
Table Posted: _June 19, 2006Next Update: June 2007
Table Notes and Sources
1 World Production of CriG._(Thousand Barrels per Day)
_
Re%ion/Country 2004Bermuda 0Canada 3,056.8Greenland 0Mexico 3,825.0Saint Pierre and Miquelon_United States ^
_.0
-7,649.1North America 14,530.9
Antarctica 0Antigua and Barbuda 0Argentina 797.1__Aruba 0Bahamas, The 0Barbados 1.0Belize 0Bolivia 60.2Brazil -- -- - 1,791.3Cayman Islands 0Chile 10.6Colombia 532.8Costa Rica 0_Cuba 66.5Dominica 0Dominican Republic 0Ecuador 530.2_El Salvador 0Falkland Islands 0French Guiana 0_GrenadaGuadeloupe
00
Guatemala 19.8Guyana -0Haiti 0Honduras 0Jamaica 0Martinique 0_Montserrat 0Netherlands Antilles 0Nicaragua 0Panama 0
URL: http://www.eia .doe.gov/pub/international/iealf/tablegl .xls Page 4

Table GA World Production of Crude Oil, Natural Gas Plant Liquids , and Other Liquids , 1980 -Present(Thousand Barrels per Day)
Region/Country 1980 1981 1 982 - 1983 !1984 __1985 1986 1987Paraguay 0 0 _ 0 0 _ 0 0 0 0-, -_Peru 198.0 197.0 199.0 172.0 185.0
-__191.0 179.0 165.0
Puerto Rico 0 ' 0 _ 0 0 0 0 0 0Saint Kitts and Nevis 0 0 0 0 0 0 0 _0Saint Lucia 0 0 0 0 0 0 0 0Saint Vincent/Grenadines
_0 " 0 0 0 0 0 0
Suriname 0 0 0 0 0 1.0 _ 2.0 2.0Trinidad and Tobago__
----211.0 240.0 180.0 160.0 170.0 175.0 168.0 157.0
Turks and Caicos Islandsslands - - 0 0 0 0 0 0 0 0Uruguay 0 0 0 0 0 _ 0_ 0Venezuela 2,228.0 2,157.0
_1,955.0
_1,858.0 1,855.0 1,740.0 1,884.0 1,846.0_ _
Virgin Islands, U.S. 0 0 0 0 0 0 0 0Virgin Islands, British 0 0 0 0 0 - 0 0Central & South America 3,799.5 3,808 . 1 3,634.2 3,628 .5 3,835 .4 3,868.4 4,107 .2 4,030.1
-Albania 44.0 44.0 64.0 75.0 55.0 55.0 55.0 54.0Austria _ _
- -29.0 26.0
-27.0 ^_ 26.0
__ 25.0 23.0 23.0 21.6
Belgium 0 0 0 0 0 - 0^
- 0 0Bosnia and Herzegovina _ NA NA _NA NA
.NA
- -
-,NA_
-NA NA
Bul aria 3.0 3.0 3.0 3.0 4.0-- - 6.0 6.0 6.0Croatia NA _ NA NA NA NA NA
_NA _ NA
Czech Republic NA NA NA NA NA-----
NA,
NA NADenmark _Faroe Islands _
-
6.00
15.00
_35.0
045.0
0
_46.0
058.0
0_ 76.0
097.0
0Finland__ _Former Czechoslovakia
02.1
02.1
_
2.1
_0
2.10
2.1
_0
2.10
3.10
3.1Former Yugoslavia 88.0 - 89.0 87.0 84.0 90.0 88.0 90.0France 52.0 61.0 55.0 55.0 55.0
_67.0 74.0 77.0
Germany NA NA NA NA NA NA NA NAGermany, East 1.0
_1.0 1.0 1.0
-1.0
---1.0 1.0 1.0
Germany, West 92.0 89.0 198.0 105.0_ _
107.0__
109.0 109.0 104.0Gibraltar 0 0 ^- 0 0 0 0 0
_0
Greece _-
0 8.0-
22.0_
26.0_28.0 27.0 27.0 26.1
Hungary _ 58.0 58.0 62.0-
61.0 62.0 62.0 62.0 57.0Iceland 0 0 0
_0 0 - 0 0 0
Ireland--
0_
0 0 0 0 0 0 0Italy ______ 39.0 38.0 36.0 46.0 46.0 47.0 51.6 69.3Luxembourg _0
_0 0
_0 0
_ _0 0 0
Macedonia NA NA NA NA_
^NA NA NA NAMalta 0 0
-0 0
_0 0
--- 00
NetherlandsNorway
31.0527.7
33.0511.8
45.0531.7
62.0661 .l
70.0752.7
87.0823.7
_ 104.0907.7
98.01,053.2
Poland 8.0 8.0 5.5---
5.0----,
5.0 5.0 5.0 4.0Portugal _ _ _ __ 0 0 0 0 0 0 0 0Romania __
-252.0 255.0 255.7 255.0 252.0 235.0 236.0
_230.0
Serbia and Montenegro NA NA_
NA_
NA_
' NA__
NA NA NASlovakia NA NA NA NA NA NA NA NASlovenia NA
_NA NA
_NA
_NA NA
__ NA NA
Spain 33.0 25.0 30.0 58.0- 46. 0- - 44.0 45.0 40.0Sweden _ 0.5 0.1
-0.3
-- ,0.4
- -0.2
--0.1 0.1 0.1
Switzerland 0 0 0 0 0 0 0 0
URL: http://www.eia .doe.gov/pub/international /iealf/tableg1 . xls Page 5
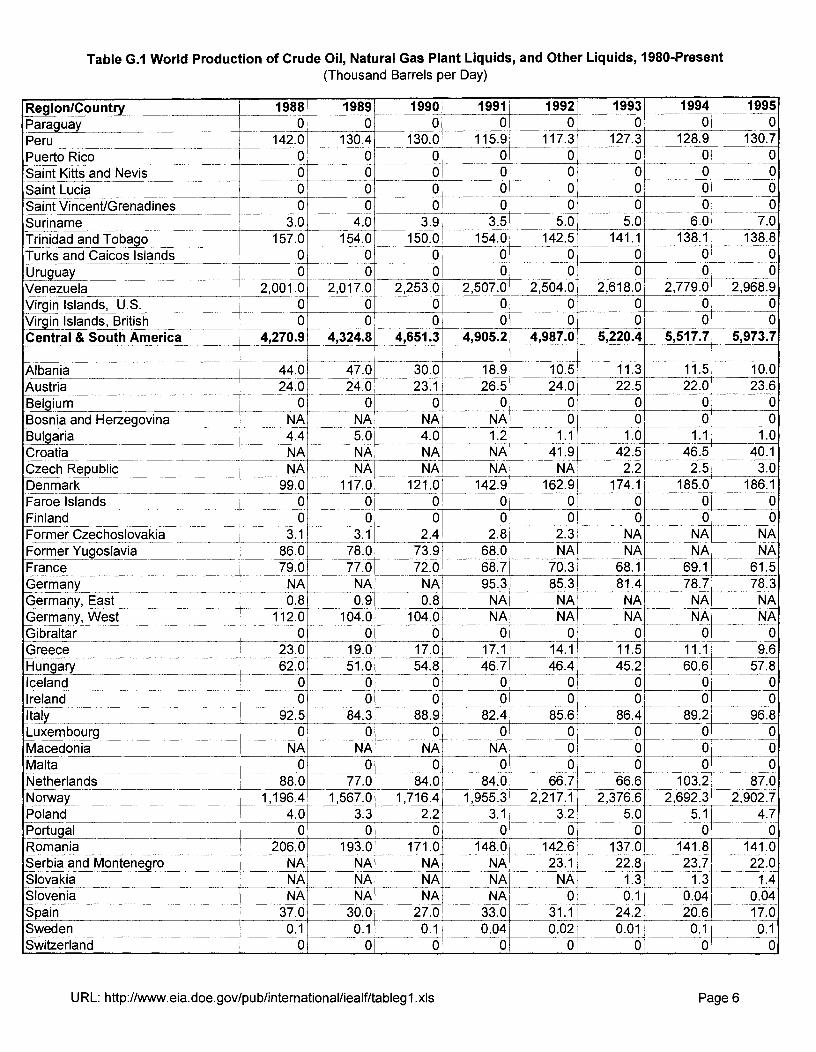
Table GA World Production of Crude Oil, Natural Gas Plant Liquids , and Other Liquids, 1980-Present(Thousand Barrels per Day)
_Re ig'on/Country _ _ 1988 1989 1990 1991 1992 _ 1993 1994 1995
Paraguay 0 0 0 0 0 0 0 0Peru 142.0 130.4 130.0 115.9 ----- 117.3 127.3 128.9 130.7_ _Puerto Rico 0
_0 0 0 0 0 0 0
Saint Kitts and Nevis 0 0 0 _ 0 0 _ 0__Saint Lucia 0 0
_0 0 0 0 0 0
Saint Vincent/Grenadines 0 0 0 0 0 _ 0 0 0Suriname 3.0 4.0 3.9 3.5 _ 5.0 5.0 6.0 7.0Trinidad and Tobago 157.0 154.0 150.0 154.0 142.5 141.1 138.1 138.8Turks and Caicos Islands 0 0 0 0 0 0 0 0Uruguay 0 0 0 0 0 0 0 0Venezuela 2,001.0 2,017.0 2,253.0 2,507.0 _ 2,504.0 _ 2,618.0 2,779.0 2,968.9Virgin Islands, U.S. 0 0 0 0 0 0 0 0Virgin Islands, British 0 0 0 0 0 0 0 0Central & South America 4,270 .9 4,324 . 8 4,651 .3 4,905.2 4,987.0 5,220.4 5,517 .7 5,973.7
Albania 44.0 47.0 30.0 18.9 _ 10.5 11.3 _11.5 _ 10.0_ __Austria
_24.0 24.0 23.1 26.5 24.0 22.5 22.0 23.6
Belgium 0 0 0 0 0 _ 0 0 0rzegovinaBosnia and He NA
_NA NA NA 0 0 0 0_
Bulgaria 4.4 5.0 4.0 1.2 1.1 1.0 1.1 1.0
Croatia NA NA NA NA 41.9 _ 42.5 46.5 40.1Czech Republic NA NA NA NA NA 2.2 2.5 3.0Denmark 99.0 117.0 121.0 142.9 162.9 174.1 185.0
i186.1_
Faroe Islands 0 0 0 0 0 0 0 0Finland 0 0 0 0 0 0 0 0Former Czechoslovakia 3.1 3.1 2.4 2.8 2.3 NA NA NA_Former Yugoslavia 86.0 78.0 73.9 68.0 NA _ NA NA NAFrance 79.0
_77.0 72.0 68.7 70.3 68.1 69.1 61.5
Germany NA NA NA 95.3 85.3 81.4 78.7 78.3_Germany, East 0.8 0.9 0.8 NA NA NA NA NAGermany, West 112.0 104.0 104.0 NA N_A N_A NA NAGibraltar 0 0 0 0 0 0 0 0Greece 23.0
_19.0 17.0 17.1 14.1 11.5 11.1 9.6_
Hungary 62.0 51.0 54.8 46.7 _ 46.4 _ 45.2 60.6 57.8Iceland 0 0 0 0 0 0 0 0Ireland 0 0 0 0 0 0 0Ital^r 92.5 84.3 88.9 82.4 85.6 86.4 89.2 96.8Luxembourg 0 0 0 0 0 0 0 0Macedonia NA NA NA NA 0 0 0 0Malta 0 0 0 0 0 0 0 0Netherlands 88.0 77.0 84.0 84.0 6637 66.6 103.2 87.0Norway 1,1 96.4 1,567.0 1,716.4 1,955.3 2,217.1 2,376.6 2,692.3 2,902.7Poland
.4.0_
3.3 2.2 3.1 3.2 5.0 5.1 4.7_Portugal 0 0 0
_0 0
_0 0 0
Romania 206.0 193.0 171.0 148.0 142.6 137.0 141.8 141.0Serbia and Montenegro NA NA NA NA 23.1 22.8 23.7 22.0Slovakia NA NA NA NA NA 1.3 1.3 1.4_Slovenia
_NA NA NA NA 0.1 0.04 0.04
Spain_
37.0 30.0 27.0 33.0 31.1 24.2 20.6 17.0Sweden i 0.1 0.1 0.1 0.04 0.02 0.01 0.1 0.1Switzerland 0 0 0 0 0 0 0 0
URL: http://www.eia .doe.gov/pub/international/iealf/tableg1.xls Page 6

Table G . 1 World Production of Crude Oil, Natural Gas Plant Liquids , and Other Liquids, 1980-Present(Thousand Barrels per Day)
Region/Country 1996 1997 1998 1999 2000 2001 2002 2003Paraguay 0 0 0 0 0 _ 0 0 0_Peru 120.7 119.3 116.6 107.0 99.5 9_7.1 96.9 92.4Puerto Rico 0 0 0 0 0 0 0 0Saint Kitts and Nevis 0 0 0 0 0 0 0 0Saint Lucia 0 0 0 0 0 0 0 0Saint Vincent/Grenadines 0 0 0 0 0 0 0 0Suriname 7.5 5.0 7.0 10.0 10.0 10.0 10.0 10.0Trinidad and Tobago 138.2 131.8 130.4 135.0 133.2 125.4 138.5 167.0Turks and Caicos Islands 0 0 0 0 0 _ 0 0 0Uru^ua^r 0 0 0 0 0 0 _ 0 0Venezuela 3,158.0 3,498.0 3,382.0 3,085.8 3,440.0 3,316.3 2,906.4 2,564.5Virgin Islands, U.S. 0 0 0 0 0 0 0 0Virgin Islands, British 0 0 0 0 0 0
_0 0
Central & South America 6,362 . 1 6,853 . 5 6,993 .4 6,894 .5 _7_,2_28 ._7 7 129 . 8 6,802 .2 6,559.8
Albania 9.5 9.2 6.3 5.6 5.7 6.0 6.4 6.7_Austria 22.5 19.7 21.4 19.0
_20.0 20.7 21.7 20.9
Belgium 0 0 0 0--
0_ 0 0 0Bosnia and Herzegovina _ 0 _ 0 0
_0
___0 _ 0 0 0
Bulgaria 0.7 0.6 0.8 0.8 0.9 0.6 0.7 0.6Croatia 36.0 36.7 38.3 31.6 30.3 28.6 27.4 27.3Czech Republic 4.3 3.5 3.8 3.9 6.1
_7.4 7.5 9.0_
Denmark __
207.9 230.5_
238.4 300.2_
362.9__
346.2 _ 370.8 375.0Faroe Islands 0 0 0 0 0 0 0 0Finland 0 0 0 0 0 0 0Former Czechoslovakia NA NA_
_NA NA NA NA
_NA NA
Former Yugoslavia NA NA NA NA NA NA NA NAFrance 55.2 45.6 39.9 37.5 36.0 34.9 33.9 29.4Germany 78.4
-,-75.5 77.4 76.3 87.8 85.9 90.9 94.2
Germany, East NA NA NA NA NA NA NA NAGermany, West NA NA NA NA NA NA NA NAGibraltar 0
_ _0 0 0 0 0 0 0
Greece _ 9.0 9.9 7.1 1.0 5.6 5.8 4.1 3.3Hungary 60.3 65.2 50.4 46.7 46.6 45.7 38.4 40.9Iceland 0 0 0
_0
_0
_0 0 0
Ireland 0_
0 0 0 0 0 0 0_Italy 105.0 114.3 109.6 85.6 93.5 79.5 .485 95.8Luxembourg 0 0 0
_0 0 0
_0 0
Macedonia 0 0 0 0 0 0 0 0Malta 0 0 0 0 0 0 0 0Netherlands 81.2 76.7 79.0 58.6 54.6 46.2 65.1 64.9Norway 3,232.5 3,280.9 3,138.6 3,139.4 3,345.7 3,414.6 3,333.9 3,264.0Poland 5.1 6.1 7.4 9.0
.12.9
_17.2 16.7 16.3
Portugal 0 0 0 0_
0.-
0 0 0Romania 142.0 140.9 138.3 132.0 _ 128.4 131.2 130.7 124.0Serbia and Monte negro_ _ 22.0 19.7 18.0 18.0 16.0 1 5.0 14.0 13.5_Slovakia 1.6 1.5 1.2 0.9 1.0
.1.0 1.0 1.3
Slovenia _ 0.02 0.03 0.02 0.02 0.02 0.01 0.01 0.01Spain 10.5 7.6
--10.6 6.1
_4.8 7.1 6.4 6.6
Sweden 0 0 0 0 0 0 0 0Switzerland 0
_0
_0 0 0 0
_0 0
URL: http://www.eia.doe.gov/pub/international/iealf/tablegl.xls Page 7

Table GA World Production of Crude Oil, Natural Gas Plant Liquids , and Other Liquids, 1980 -Present(Thousand Barrels per Day)
Region/Country 2004Para uay 0Peru 94.1_Puerto Rico 0Saint Kitts and Nevis _ 0Saint Lucia 0__Saint Vincent/Grenadines _
_0
Suriname 10.0Trinidad and Tobago 166.4Turks and Caicos Islands 0Uruguay 0Venezuela 2,837.9Virgin Islands, U.S.
.
Virgin Islands, British 0Central &South America 6,917.9
Albania 6.7Austria 21.1Belgium____ 0_Bosnia and Herzegovina 0Bulgaria _ 1.0Croatia___ 25.2Czech Republic 11.1Denmark _ 389.1Faroe Islands 0Finland_ 0Former Czechoslovakia NAFormer Yugoslavia NAFrance_ 28.3Germany __ ___ 103.9Germany, East NAGermany, West NAGibraltar 0_Greece _
--^3.1
Hun ary -- - 42.9Iceland 0Ireland 0Italy__
_104.2
Luxembourg 0_Macedonia 0_Malta 0_ __Netherlands
_ __61.0
Norway 3,188.6Poland 28.7Portugal 0Romania
_121.2
Serbia and Montenegro 13.0Slovakia 5.7Slovenia 0.01Spain
---,6.0
Sweden -- 0Switzerland 0
URL: http://www.eia .doe.gov/pub/international/iealf/tableg1.xls Page 8

Table G.1 World Production of Crude Oil, Natural Gas Plant Liquids , and Other Liquids, 1980 -Present(Thousand Barrels per Day)
Region/Country 1980 1981 1982 1983 1984 _1985 1986 1987Turkey 46.0 46.0 50.0 44.0 41.0 41.0 46.0 51.0United Kingdom 1,667.0 1,861.0
-2,143.0 2,402.0 2,616.0 2,675.0 2,691.0 2,568.2
Europe 2,979 .3 3.0:i,17 3,555.3 4,019 .7 4,298.0 4,458 .0 4,610.5 4,650.6
Armenia NA NA NA NA NA NA NA NAAzerbaijan NA NA NA NA NA NA NA NABelarus NA NA NA NA NA NA NA NAEstonia NA NA NA NA NA NA NA NAFormer U.S.S.R. 11,991.0 12,150.0- 12,227.0- 12,302.0--- 12,201.0- 11,935.0 12,335.0- 12,480.0- - -
Georgia-
NA---
NA NA _ NA _ NA _ NA - NA NAKazakhstan NA NA NA NA _ NA NA NA NAKyrgyzstan NA _NA NA NA -- NA NA NA NALatvia NA NA NA NA NA NA NA NALithuania NA NA NA NA NA NA NA NAMoldova NA NA NA NA NA NA NA NARussia NA NA NA NA NA NA NA NATajikistan NA NA NA NA NA NA NA NATurkmenistan NA NA NA NA NA NA NA NA_Ukraine NA NA NA NA NA NA NA NAUzbekistan NA NA NA NA NA NA NA NAEurasia 11 ,991.0 12 ,150.0 12,227 .0 12,302 .0 12,201 .0 11,935 .0 12,335 .0 12,480.0
Bahrain -56.0---5-4.0 -- 52.0 51 .0 50.0 48.0 52.0 51.0Cyprus 0 0
_0
__0 0 _ 0 0 0
Iran i 1,671.0 1,389.0 2,223.0 2,448.0 2,184.0 2,260.0 2,050.0 2,318.0Iraq 522.02, 1,005.0 1,017.0
_1,010.0 1,214.0 12443.0 1,700.0 2,089.0
Israel_35.0 36.0 1.0 1.0 1.0 1.0 1.0 0.3
Jordan 0 0 0 i 0 0 1.0 0.5Kuwait 1,751.0 1,185.0 863.0 1,119.0 1,224.0 1,077.0 1,494.0 1,680.0Lebanon 0 0
_ -0
--0
_0 0 0 0
Oman 284.0 321.0 326.0 377.0 _ 417.0--
502.0 564.0 588.0Qatar 482.0 429.0 360.0 _320.0 22.0-4 331.0 330.0 317.0Saudi Arabia 10,269.0 10,248.0
_6,913.0 5,416.0 5,018.0 3,763.0 5,254.8 4,683.1
Syria 164.0 166.0 160.0 167.0 170.0 178.0 195.0 231.0United Arab Emirates 1,744.0 1,534.0 1,340.0 1,269.0
_1,276.0 1,353.0 1,515.0 1,686.0_
Yemen 0 _ 0 _ 0 0 0 0 10.0 20.0Middle East 18,978 .0 16,367.0 13,255.0 12,178 .0 11,976 .0 10,956.0 13,166 . 8 13,663.9
Algeria 142.01, 1,051.0 1,045.0 1,024.0 1,119.0 1,157.0 1,065.0 1,188.0Angola
_150.0 130.0
_122.0 1- 177.0
_208.0 231.0 282.0 360.0
Benin 0 0 011
4.0 7.0 8.0 8.0 7.0Botswana 0 0 0
_0 0 0 0
Burkina Faso 0 0 0 0 0 0 _ 0 0Burundi 0 _ 0 0 0 0 0 0 0Cameroon 58.0 87.0 109.0 114.0 35.01 185.0 177.0 174.0Cape Verde 0 0 0 _0
-0 0 0 _0_
Central African Republic 0 0 0 0 0 0 0 0Chad 0 0 0 0 0 0 0 0
-ComorosCongo (Brazzaville)
_ 065.0
083.0
089.0
087.0-
0121.0
---
01.20.0
----
_ 0119.0
-
0---123.0
Con o Kinshasa 20.0 20.0 23.0 5.025.0-- 32.03-2 .O, 33.033.0-- 32.0 32.0
URL: http://www.eia . doe.gov/pub/international /iealf/tableg1 . xls Page 9

Table GA World Production of Crude Oil, Natural Gas Plant Liquids , and Other Liquids, 1980 -Present(Thousand Barrels per Day)
Region/Country _ 1988 1989 1990 1991 1992 1993 1994 1995Turkey 50.0 56.0 73.0 _ 88.3 83.5 76.2 72.4 67.5United Kingdom 2,391.3 1,942.3 1,928.1 1,938.0 1,986.2 2,083.9 2,592.7 2,755.7Europe 4,602.5 4,479 .0 4,593 .6 4,820 . 1 5,097 .9 5,339 .8 6,230 .2 6,566.9_
Armenia NA NA NA NA 0 0 0 0Azerbaijan NA ___ NA NA NA 222.5 208.0 -192.0 182.0Belarus NA NA NA NA 39.9- - 40.0--- 39.8- 38.5-------- ---- -----Estonia
-NA
--- --NA
-NA
--NA 0 0 0 0
Former U.S.S.R. 12,503.0 12,140.0 11,400.0 10,412.0 NA NA NA NAGeorgia NA NA NA _ NA _ 2.9 _ 2.0 1.8 _ 1.0_,Kazakhstan
_NA NA NA NA __ 530.0 490.0 415.0 414.0
Kyrgyzstan_
NA NA NA_
NA 2_.3 ______2.0 1.6 2.0Latvia NA NA NA NA
^_ 0 0 0 0
Lithuania NA NA NA NA__ __
0 1.6 2.9 3.2Moldova NA NA NA NA _ 0 0 0 _0_ _Russia NA NA NA NA 7,861.9 6,950.0 6,335.0 6,175.0_Tristan _ NA NA NA
_NA 1.3 0.8 0.6 0.7
Turkmenistan NA NA NA NA 110.0 90.0 85.0 81.0Ukraine` NA NA NA NA 95.0 87.0 85.0 85.0Uzbekistan NA NA _ NA NA 65.5 85.0 115.0 160.0Eurasia 12 ,503.0 12,140 .0 11,400 .0 10,412 .0 8,931 .4 7,956 .4 7,273.8 7,142.4
_-_BahrainCyprus _
52.00
_ 51.00
47.00
43.00
43.70
2.850
53.80
50.80
Iran 2,260.0 2,837.0 3,123.0 3,362.0 3,479.1 3,595.0 3,673.0 3,703.2_Iraq 2,705.0 2,951.0 2,070.0 305.0 425.1 526.7 572.5 585.0Israel 0.4 0.3 0.2 0.2 0.2 0.2 0.1 0.1Jordan 0.5 0.2 0.3 0.3 0.1 0.03 0.03 0.03Kuwait 1, 592.0-1,888.0 1, 240.0 190.0 1,092.2 1,905.1 2,110.0 2,152.4Lebanon 0 0 0 0 0 _ 0 0 0Oman 623.0
_651.0 695.0 708.0 _746.0 _780.8 816.0 861.3
Qatar 376.0 404.0 446.0 445.0 478.2 468.0 465.0 497.0Saudi Arabia
J5,585.2 5,567.1 7,030.1 8,795.0 9,044.7 8,902.3 9,105.9 9,236.6
Syria 266.0 342.0 390.0 _ 494.0 482.9 562.0 568.0 588.0United Arab Emirates _ 1,695.0 1,990.0 2,252.0 2,531.6 2,410.1 2,305.0 2,343.0 2,393.0Yemen 173.0 194.0 193.0 196.6 182.1 220.0 335.0 345.0_Middle East 15,328 .0 16,875 .6 17,486 .6 17,070 .7 18,384 .3 19,317.9 20,042.4 20,412.4
Algeria 1,160.0 1,225.0 1,305.0 1,370.0 1,354.0 1,307.3 1,320.0 1,346.8Angola 452.0 455.0 475.0 500.0 526.3 509.0 536.0 646.0_Benin
___5.0 i 4.0 4.0 4.0 5.6
-5.8 5.9 3.0
Botswana - 0 _0 _0 0 0 0 0 0Burkina FasoBurundi
00
00
00
00
00
00
00 0
Cameroon 163.0 170.0 161.0 153.3 140.4 126.9 107.9 111.0Cape Verde _ 0 0 0 0 _0 0 0 0Central African Republic _ 0 0
-0 0 0
J0 0 0
ChadJ
0 0 0 0 0 0 0 0Comoros _ 0 0 0 0 0 0 0 0Congo (Brazzaville) _i _ 144.0 164.0 165.0 156.0 174.0 181.0 180.0 188.0Con o Kinshasa 30.0 28.0 29.0 28.0 26.0 25.0 26.0 30.0
URL: http://www.eia .doe.gov/pub/international/iealf/tableg1.xls Page 10
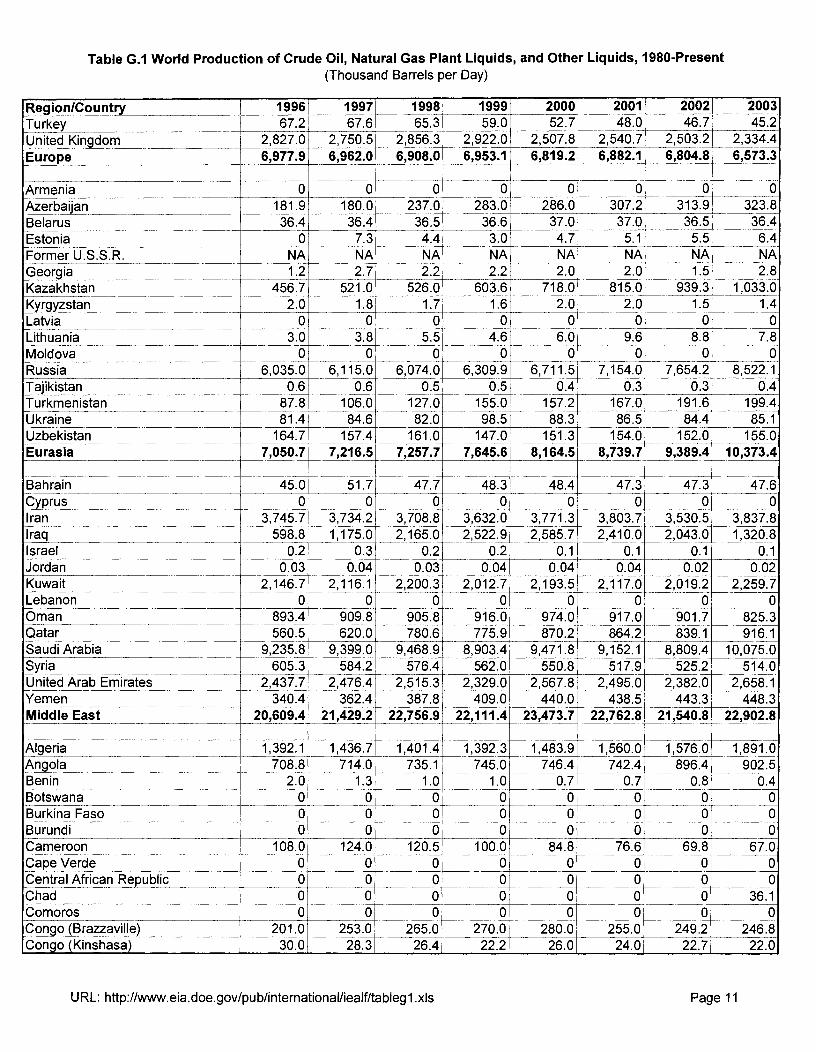
Table GA World Production of Crude Oil, Natural Gas Plant Liquids, and Other Liquids , 1980-Present(Thousand Barrels per Day)
Region/Country 1996 1997 1998 1999 2000 2001 - 2002 2003Turkey 67.2 67.6 65.3 59.0 52.7 _ 48.0 46.7 45.2United Kingdom 2,827.0 2,750.5 2,856.3 2,922.0 2,507.8 __ 2,540.7 2,503.2 2,334.4Europe 6,977 .9 6,962 .0 6,908 .0 6,953 . 1 6,819 .2 6,882 . 1 6,804.8 6,5713
Armenia 0 0 0 _ 0 0 _ 0 0Azerbaijan 181.9 180.0 237.0 283.0 286.0 307.2 313.9 323.8Belarus 36.4 36.4 36.5 36.6 37.0 37.0 36.5 36.4Estonia
_0 7.3 4.4 3.0 4.7 5.1 5.5 6.4
Former U.S.S.R. NA NA NA NA NA NA NA NAGeorgia 1.2 2.7 2.2 2.2 2.0 2.0 1.5 2.8
Kazakhstan 456.7- 521.0 526.0 603.6 718.0- - 815.0---- 939.3-- 1,033.0- - - -- -
Kyrgyzstan- -
2.0 1.8-
1.7 1.6 2.0 2.0 1.5 1.4Latvia 0 0 0 0 0 0 0 0Lithuania 3.0 3.8 5.5 4.6 6.0 9.6 _ 8.8 7.8Moldova 0 0 0 0 0 0 0 0Russia 6,035.0 6,115.0 6,074.0 6,309.9 6,711.5 __7,154.0 7,654.2 8,522.1Tajikistan 0.6 0.6 0.5 0.5 0.4 0.3 0.3 0.4Turkmenistan 87.8 106.0 127.0 155.0 157.2 167.0 191.6 _199.4Ukraine ___Uzbekistan
_ 81.4164.7
84.6157.4
82.0161.0
98.5147.0
_
--- 88.3151.3
_____86.5
154.0
_84.4
152.085.1
155.0Eurasia 7 ,050.7 7,216 .5 7,257.7 7,645.6 8,164 .5 8,739.7 9,389 .4 10,373.4
Bahrain 45.0 51.7 47.7 48.3 48.4 47.3 47.3 47.6Cyprus 0 0 0 0 0 0 0 0Iran _Iraq
3,745.7_ 598.8
3,734.2_1,175.0
3,708.82,165.0i
3,632.02,522.9
3,771.32,585.7
3,803.72,410.0
3,530.52,043.0
3,837.8`1,320.8
Israel 0.2 0.3 _ 0.2 0.2 0.1 0.1 0.1 0.1Jordan 0.03 0.04 0.03 0.04 0.04 0.04 0.02 0.02Kuwait 2,146.7 2,116.1
_2,200.3 2,01 2.7 2,193.5 2,117.0 2,019.2 2,259.7
Lebanon _ _ 0 _ 0 0.
0 0 0 0 0Oman _ 893.4 909.8 905.8 916.0 974.0 _ 917.0 901.7 825.3Qatar _ 560.5 620.0 780.6 775.9 870.2 864.2 839.1 916.1Saudi Arabia _ 9,235.8 9,399.0 9,468.9 8,903.4 9,471.8
_9,152.1 8,809.4 10,075.0
Syria _ - 605.3 584.2 576.4 562.0 550.8 517.9 525.2 514.0United Arab Emirates 2,437.7 2,476.4 2,515.3 2,329.0 2,567.8-2,495.0 2,382.0 2,658.1Yemen - 340.4 362.4 387.8 409.0 440.0 438.5 443.3 448.3Middle East 20,609 .4 21,429 .2 22,756 .9
_22,111 .4
_23,473 . 7 22,762 .8 21,540.8 22,902.8
-Algeria 1,392.1 1,436.7 1,401.4 1,392.3 1,483.9 1,560.0 1,576.0 1,891.0Angola 708.8
i714.0 735.1'
745.0 746.4 742.4 896.4 902.5Benin 2.0 1.3 1.0 1.0 0.7 0.7
_0.8 0.4
Botswana 0 0 0 0 0 0 0 0Burkina Faso _ 0 0 0 0 0 0 0 0Burundi 0` 0 0 0 0 0 0 0Cameroon 108.0 124.0 120.5 100.0 84.8 76.6 69.8 67.0Cape Verde 0 0 0 0 0 0 0 0Central African Republic-- - - 0 0- - 0 0 0 0 0 0Chad 0
-0 0 0 0 0
-0 36.1
Comoros 0 0 0_
0 0_
0_ _
0 0Congo (Brazzaville) 201.0 253.0 265.0 270.0 280.0 255.0 249.2 246.8,Congo Kinshasa 30.0 28.3 26.4
_22.2
_26.0
_24.0 22.7 22.0
URL: http://www.eia .doe.gov/pub/international /iealf/tableg1 . xls Page 11
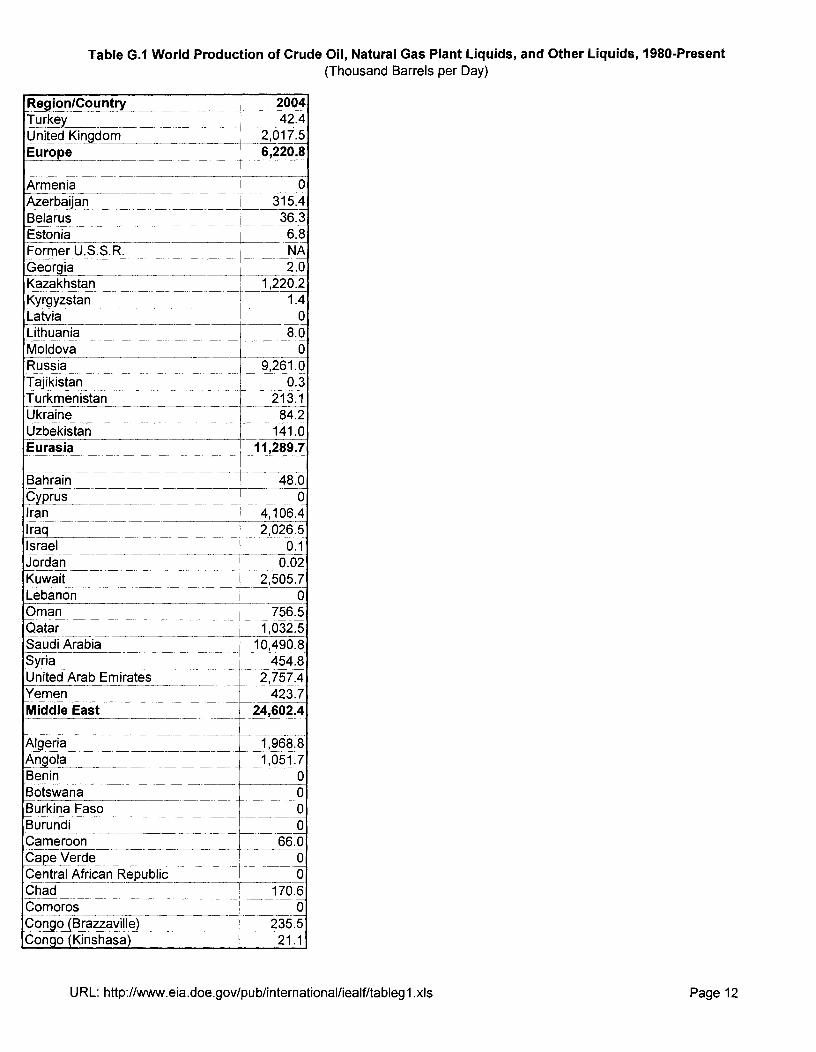
Table G.1 World Production of Crude Oil, Natural Gas Plant Liquids, and Other Liquids , 1980-Present(Thousand Barrels per Day)
Region/Country _ 2004Turkey 42.4United Kingdom_ 2,017.5Europe 6,220.8
Armenia _ 0Azerbaijan 315.4Belarus _
_36.3
Estonia _ _ 6.8Former U.S.S .R. NA_Georgia _ 2.0Kazakhstan 1,220.2K rgyzstan 1.4Latvia
^-------0
-!Lithuania _ 8.0Moldova 0Russia 9,261.0_Tajikistan__ 0.3Turkmenistan 213.1Ukraine 84.2Uzbekistan 141.0Eurasia
_11,289.7
Bahrain 48.0Cyprus 0Iran
^^^- --
_4,106.4
Iraq 2,026.5Israel -
_0.1
Jordan 0.02Kuwait 2,505.7_Lebanon 0Oman i 756.5_
Saudi Arabia--
10,490.8Syria ---_ _` - 454.8United Arab Emirates 2,757.4_Yemen
_423.7
Middle East 24,602.4
Algeria 1,968.8Angola
--1,051.7
Benin_ 0Botswana ___ 0Burkina Faso ^0Burundi 0_Cameroon 66.0Cape Verde 0Central African Republic 0Chad 170.6Comoros _ 0Congo (Brazzaville) 235.5
,Congo Kinshasa 21.1
URL: http://www.eia.doe.gov/pub/international/iealf/tablegl.xls Page 12
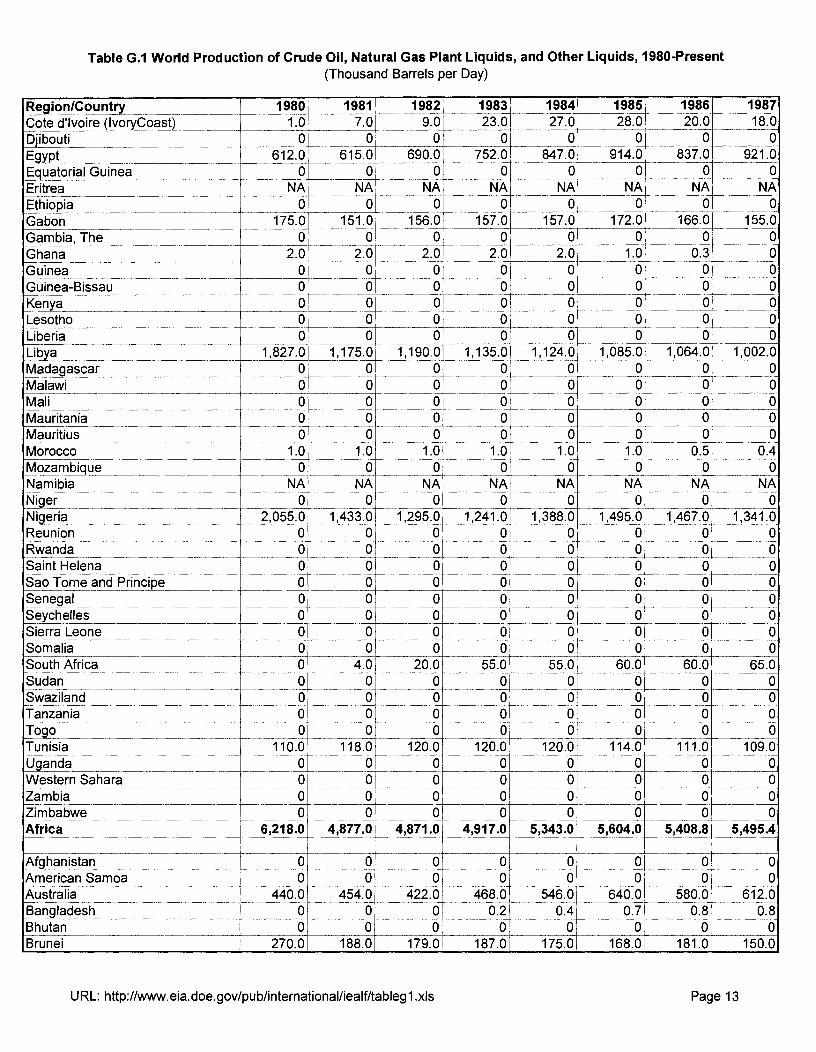
Table GA World Production of Crude Oil, Natural Gas Plant Liquids , and Other Liquids, 1980 -Present(Thousand Barrels per Day)
Region/Country 1980 1981 1982 1983 1984 1985 1986 1987Cote d'Ivoire (IvoryCoast) 1.0 7.0 9.0 23.0 27.0 -- 28.0 20.0 18.0Djibouti 0 _ 0 0 0 0 _ 0 0 0E ypt 612.0 615.0 690.0 752.0 847.0 914.0 837.0 921.0Equatorial Guinea 0 0 0 0 0 0 0 0Eritrea NA NA NA NA NA NA NA NAEthiopia 0 0 0 0 0 0 0 0Gabon 175.0 151.0 156.0 157.0 157.0 172.0 166.0 155.0Gambia, The 0 0 0 0 0 0 0 0Ghana 2 .0 2.0 2.0 2.0 2.0 1.0 0.3 __0Guinea
_0 0 0 0 0 0 0 0
Guinea-Bissau 0 0 0_
0 0 0 _0 0Kenya 0 0 0 0 0 0 0 0Lesotho 0 0 0 0 0 0 0 0Liberia 0 0 0 0 0 0 0 0Libya 1,827.0 1,175.0 1,190.0 1,135.0 1,124.0 1,085.0 1,064.0 1,00.2.0Madagascar 0 0 0 0 0 0
i0 0_
Malawi 0 0 0 0 0i
0 0 0Mali 0 0 0 0 0 0 0 0Mauritania 0
_0
_0 0
_0 0 0 0
Mauritius 0 0 0 0 0 0 0 0Morocco 1.0 1.0 1.0 1.0
_1.0 1.0 0.5 0.4
Mozambique 0 0 0 0 0 0 0 0Namibia NA NA NA NA NA NA NA NANiger 0 0 _ 0 0 0 0 _ 0 0Nigeria _ 2,055.0 1,4310 1,295.0 1,241.0 1,388.0 _ 1,495.0 1,467.0 1,341.0Reunion 0 0 0 0 0
^0 0^
0Rwanda 0 0
^0 0 0 0 0 0
Saint Helena _ 0 0 0 0 0 0 0 0Sao Tome and Principe 0 0 0 0 0 0 0 0Senegal 0 0 0 0 0 0 0 0Seychelles _ 0 0 0
_0 0 i0 0 0
Sierra Leone 0 0 0 0 0 0 0 0Somalia 0 0 0 0 0 0 _ 0 0South Africa 0 4.0 20.0 55.0
i55.0 60.0 60.0
i65.0
Sudan _ 0 0 0 0 0 0 0 0Swaziland 0 0 0 0 0 0 0 0Tanzania 0 0 0 0 0 0 0 0Togo 0 0 0 0 0 0 0 0Tunisia
_110.0 118.0 120.0 120.0
_` 120.0
_114.0 111.0 109.0
0 0 _ 0 _0 0 _ 0Western Sahara 0 0 0 0 0 0 0 0Zambia 0 0 0 0 0 0 0 0Zimbabwe 0 0 0 0 0 0 0 0Africa 6,218.0 4 ,877.0 4,871.0 4 ,917.0 5,343 .0
___
5,604 .0 5,408.8 5,495.4
Afghanistan 0 0 00^
0 _0 0 0American Samoa 0 0 0 0 _ 0 0 0 0Australia 440.0 454.0 422.0 468.0 546.0 640.0 580.0 612.0Bangladesh
i0 0 ^_0 0.2 0.4 0.7 0.8 0.8
Bhutan _ 0 _ 0 0 0 0 0 0 0Brunei 270.0 188.0 179.0 187.0 175.0 168.0 181.0 150.0
URL: http://www.eia.doe.gov/pub/international/iealf/tableg1.xls Page 13
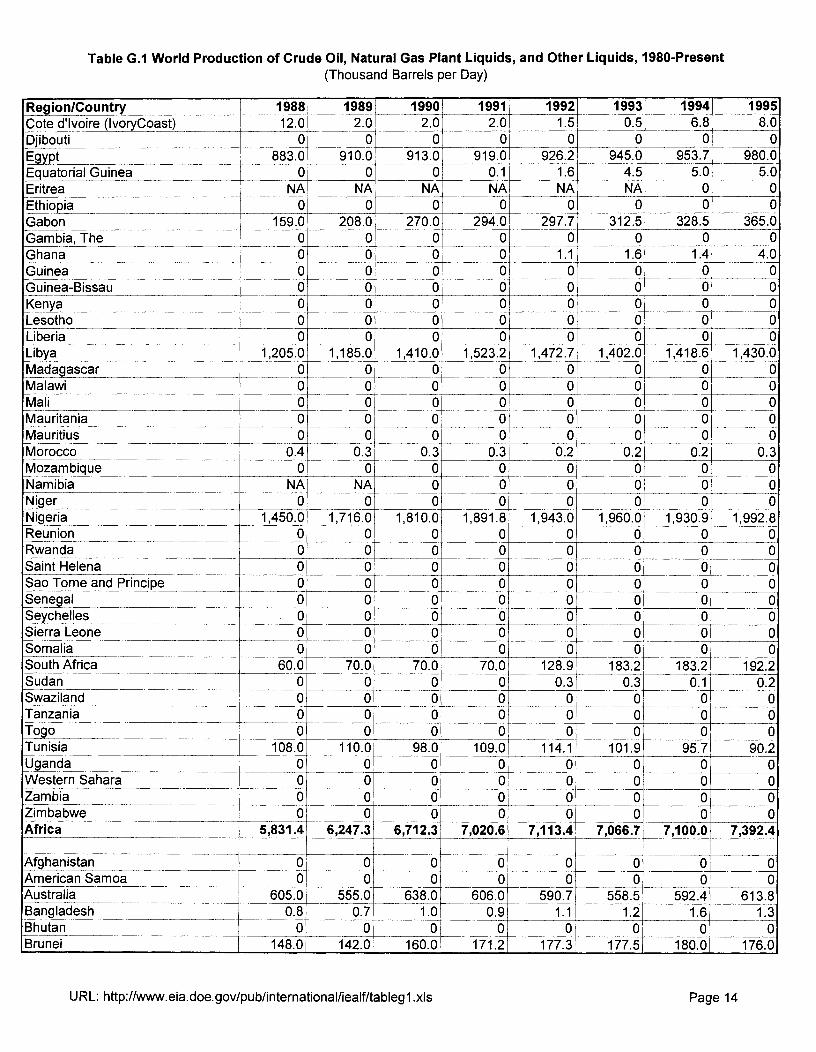
Table G.1 World Production of Crude Oil, Natural Gas Plant Liquids , and Other Liquids, 1980-Present(Thousand Barrels per Day)
Region/Count _ 1988 1989 1990 1991 1992 11913 _ 1994 1995Cote d'lvoire (IvoryCoast) 12.0 2.0 2.0 2.0 1.5 0.5 6.8 8.0D'ibouti 0 0 0 0 0 _ 0 0 0E pt 883.0 910.0 913.0 919.0 926.2 945.0 953.7 980.0_Equatorial Guinea 0 0 0 0.1 1.6 4.5 _ 5.0 5_.0Eritrea NA NA NA NA NA NA 0 0Ethiopia 0 0 0 0 0 0 0 0Gabon 159.0 208.0 270.0 294.0 297.7 _312.5 328.5 365.0_Gambia, The 0 0 0 0
_0 0 0 0
Ghana 0 0 0 0 1.1 _ 1.6 1.4 4.0Guinea 0 0 0 0 _ 0 0 0 0Guinea-Bissau 0 0 0 0 0 0 0 0Kenya 0 0 0 0 0 _ 0 0 0Lesotho_ 0 0 0 0 0 0 0 0Liberia_ 0 0 0 0 0 0 0 0Libya 1,205.0 1,185.0 1,410.0 1,523.2 1,472 .7
J1,402.0 1,418.6 1,430.0
Madagascar _ 0 0 0 0__
0 0 0 0Malawi _ 0 0 0 0 0 0 0 0Mali 0 0 0 0 0 0 0 0Mauritania 0 0 0 0 0 0 0 0Mauritius _ 0 0 0 0 0 0 0 0Morocco 0.4 0.3 0.3 0.2 0.2 0.2 0.3Mozambique _ 0 0 0 0 0 0 0 0Namibia _ NA NA 0 0 0 0 0 0Niger 0 0 0 ^0 0 0 0 ^ 0Nigeria 1,450.0
_1,716.0
_1,810.0 1,891.8 1, 943.0
_1, 960.0 1,930.9 -1,992.8
Reunion 0 0 _ 0 0 0 0 0 0Rwanda _ 0 0 0 0 0 0
_- 0 0
Saint Helena _ 0 0 0 0 0 0 0 0Sao Tome and Principe 0 0 0 0 0 0 0 0Senegal i 0 0 0 0 0 i 0 0 0Seychelles _ 0 - 0 0 0 0 0 0 0Sierra Leone 0 _ 0 0 0 0 0 0 0Somalia ___ __ 0 0
_0 0 0
_0 0 0
South Africa 60.0 70.0 70.0 70.0 12849 183.2 183.2 192.2Sudan _ 0 ^0 0 0 0.3
_0.3 0.1 0.2
Swaziland _i 0 0 _ 0 0 0 0 0 0Tanzania _ 0 0 0 0 0 0 0Togo 0 _ 0 0 0 ^0 0 0 0Tunisia 108.0
----110.0 _ 98.0 109.0
_114.1 101.9 95.7 90.2
Uganda 0 0 0--
0 0 0 0 0Western Sahara 0
__0
_0 0 0 0 0 0
Zambia 0 0_
0 0 0 0Zimbabwe 0 0 0 0 0 0 0 0Africa 5 ,831.4 6 ,247.3
_ _6,712 .3 7,026X---7,1---13.4 7,066 .7 7,100.0 7,392.4--
Af hanistan 0 0 0 0 0 ^ 0 0 0American Samoa 0 0 0 ' 0
_0 0 0
Australia 605.0 555.0 638.0 606.0_
590.7_558.5 592.4 613.8
Bangladesh 0.7 1.0 0.9 1.1 1.2_
1.6 1.3Bhutan 0 0 0 0 0 0 0 0Brunei 148.0 142.0 160.0 171.2
_177.3
_ _177.5 180.0 176.0
URL: http://www.eia .doe.gov/pub/international/iealf/tableg1 . xls Page 14

Table GA World Production of Crude Oil, Natural Gas Plant Liquids, and Other Liquids , 1980-Present(Thousand Barrels per Day)
Region/Country 1996 1997 1998 1999 2000 2001 2002 2003-Cote d'lvoire (IvoryCoast) 16.0 18.8 20.0
_
-- 15.0 11.5_
_'__11.0 18.4 33.0Djibouti 0 _0 0 _ 0 0 0 0 0Egypt 986.7 927.4 908.6 946.2 850.0 816.9 756.0 749.8
-- -Equatorial Guinea
--17.1 52.4 83.0 _ 102.0 _ 167.5 181.4 212.6 206.5
Eritrea_
0 0 0 0 0 0 0 0Ethiopia _ _0 0 0 0 _0 _ 0 0 0Gabon 368.4 370.4 352.0 331.0 315.0 270.0 251.2 241.4_Gambia, The 0 0 0
^0 0 0 0 0
Ghana_
6.0 5.0 5.0 6.0 7.0 _ 7.0 7.0 7.0Guinea 0 0 0 0 0 0 0__Guinea-Bissau 0 0 0 0 0 0 0 0Kendra-
_0 0 0 0 _ 0 0 0 0
Lesotho 0 0 0 0 0 0 0 0Liberia 0 0 0 0 0 0 0 0Libya 1,449.8 1,505.9 1,450.0 1,379. 0 1,470.0 1,428.5 1,383.5 1,485.5Madagascar 0 0 0 0
-0 0 __ 0 0
Malawi 0 0 _0 0 0 0 0 0Mali 0 0 0 0 0 0 0 0Mauritania 0 0 0 0 0 0 0 0Mauritius
,0 0 0 0 0 _ 0 0 0
Morocco_
5.3__
5.1 5.1 5.2 5.4 5.3 5.2Mozambique 0 0 0 0 0 0 0 0Namibia 0 0 0 0
_0 0 0 0
Niger 0 0 0 0 0 0 0 0Nigeria 2,000.5 2,132.5 2,153.5 2,129.9 2,165.0 2,256.2 2,117.9 2,275.0Reunion _0 0 ___0_____0__ 0 0 0 0Rwanda 0 0 0 0 0 0 0 0Saint Helena- 0 0 0 0 0 0 0 0Sao Tome and Principe
-0 0 0 0 0 _ 0 0 0
Senegal 0 0 0 0 0 0 0 0Seychelles
__ _ _0 0 0 i!_0 0 0
Sierra Leone- 0 0 0 0 0 0 0 _0Somalia 0 0 0 0 _ 0 0 0 0South Africa
` i195.2 196.2
_199.2 181.7 _ 188.7 _ 196.3 198.0 191.2
Sudan _ _ 2.0 5.0 10.0 69.0 186.0 209.1 238.8 269.7SwazilandTanzania
00
00
00
00
00
00
00
00---
Togo 0 0 0 0 0 0_
0 0Tunisia _ 88.0 85.0 _ 81.3 84.0 _ 80.7 72.6 78.8 77.6Uganda 0 0 0 0 0 0 0Western Sahara 0 - 0 0 - 0 0 0 0 0Zambia 0 0 0 0 0 0 0 0Zimbabwe 0 0 0 0 0 0 0 0Africa
_7 ,576.9 7,861 .0 7,817.0 7_,779.5 8,068.6 8,113 .2 8,082.1 8,707.9
Afghanistan 0 0 0 0 0 0 0 0American Samoa 0 _ 0
___'__ 0 _ 0 0 _0 0 0
Australia 631.7 658.7 614.0 611.0 792.6 732.0 707.5 594.0Bangladesh
^1.6 1.8 1.7
_1.6 _ 2.7 3.6 6.3 6.3
Bhutan __ __ 0 0 0_ _ 0 0 0 0Brunei 166.4 175.0
_179.4
_ _'204.0 215.0 217.2
_189.0 `195.9
URL: http://www.eia . doe.gov/pub/international/iealf/tableg1 . xls Page 15
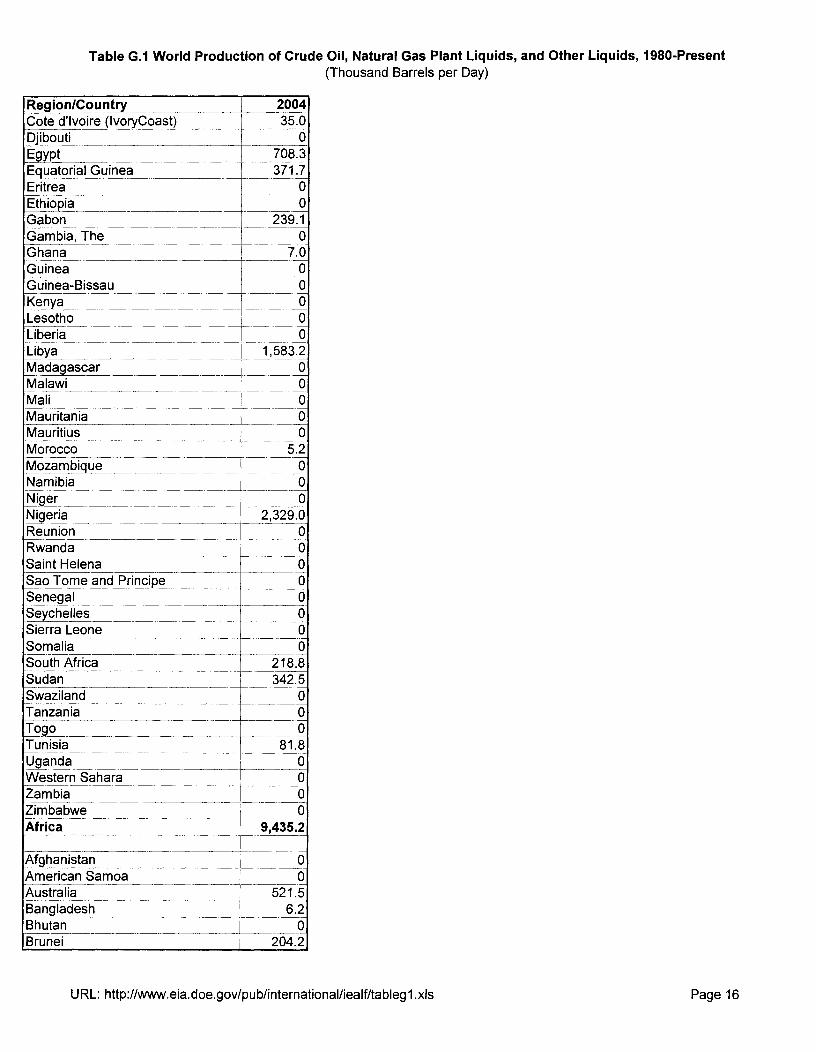
Table GA World Production of Crude Oil, Natural Gas Plant Liquids , and Other Liquids , 1980-Present(Thousand Barrels per Day)
Re ion/Country _ 2004d'lvoire (IvoryCoast)Cote 35.0_
Djibouti-^
0-E ypt 708.3
Equatorial Guinea 371.7Eritrea 0Ethiopia 0Gabon 239.1Gambia, The 0GhanaGuinea
i
Guinea-BissauKenyaLesotho
7.000
_00
Liberia i 0Libya 1,583.2_Madagascar _ 0Malawi 0Mali 0Mauritania 0Mauritius 0
^Morocco 5.2Mozambique 0Namibia ____ 0Ni e _ _ 0Nigeria 2,329.0Reunion 0Rwanda
_0
Saint Helena_
0Sao Tome and Principe 0Senegal 0_Seychelles_ _ 0Sierra Leone
^ ^
__0
Somalia 0South Africa
_218.8
Sudan 342.5Swaziland 0Tanzania 0_Togo __ ^ 0Tunisia 81.8Uganda _ 0_ _Western Sahara
_
Zambia _ 0ZimbabweAfrica 9,435.2
Afghanistan 0American Samoa 0Australia
_521.5
Banglade_sh _ 6.2Bhutan
^^0
Brunei_204.2
URL: http://www.eia .doe.gov/pub/international/iealf/tableg1 . xls Page 16
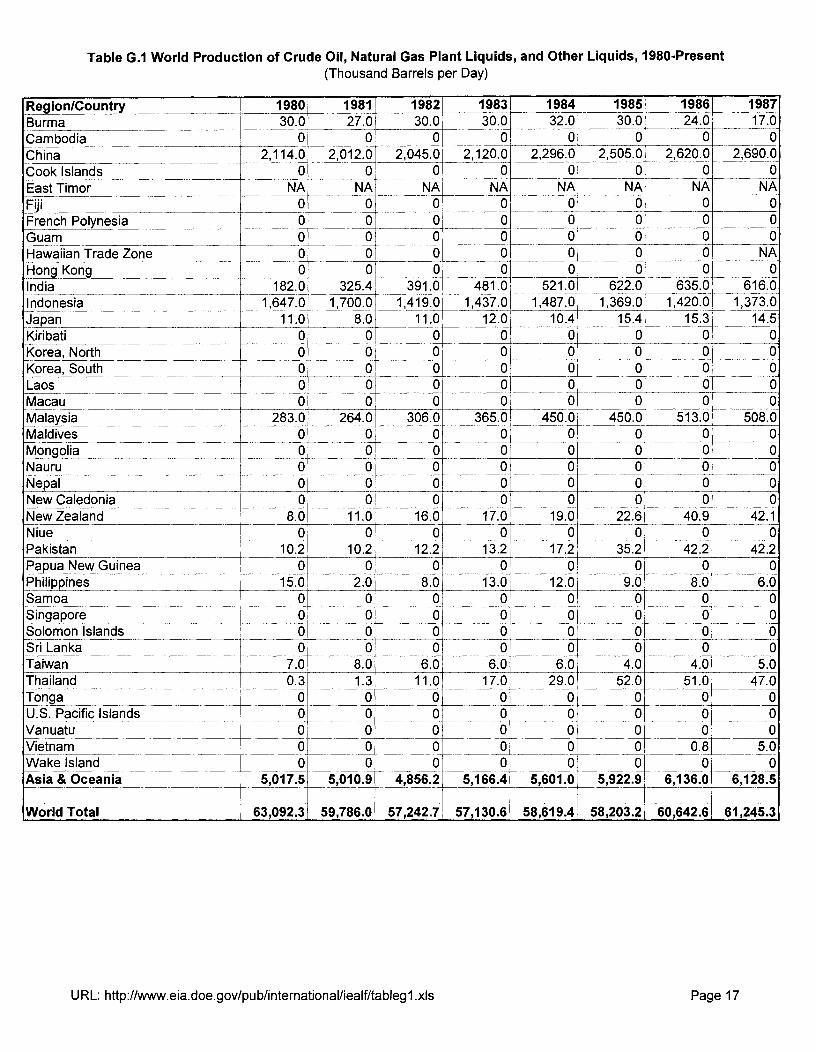
Table G . 1 World Production of Crude Oil, Natural Gas Plant Liquids, and Other Liquids, 1980-Present(Thousand Barrels per Day)
Region/Country 1980 1981 1982 1983 1984 1985 1986 1987Burma 30.0 27.0 30.0 30.0 32.0 30.0 24.0 17.0Cambodia 0 0 0 _0 0 0 0 0China 2,114.0
_2,012.0 2,045.0 2,120.0 2,296.0 2,505.0 2,620.0 2,690.0
Cook Islands 0 0 _ 0 0 0 0 0 0East Timor NA NA NA _NA N_ A NA NA NA
0 0 0 0 0 0 0 0French Polynesia 0 0 0 0 0 0 0 0Guam 0 0 0 0 0 0 0 0Hawaiian Trade Zone 0 0 0 0 0 0 0 NAHong Kong 0 0 0 0 0 _ 0 0 0India 182.0 325.4 391.0 481.0 _ 521.0 622.0 635.0 616.0Indonesia 1,647.0 1,700.0 1,419.0
_1,437.0 1,487.0 1,369.0 1,420.0 1,373.0
Japan 11.0 8.0 11.0 12.0 10.4 -,-, 15.4 15.3 14.5Kiribati 0 0 0 0 0 0
-0 0
Korea, North 0 0 0 0 0 0 0 0Korea, South 0 0 0 0 0 0 0 0Laos 0 0 0 _ 0 0 0 0 0_Macau
_0 0 0 0 0 0 0 0_
Malaysia,
283.0 264.0 306.0 365.0 450.0 _ 450.0 513.0 508.0Maldives 0 0 0 0 0 0 0 0Mongolia 0 0 0 0 0 0 0 0Nauru 0 0 0 0 0 0 0Nepal 0 0 0 0 0 0^ 0 0_New Caledonia 0 0 0 0 _0 0 0 0New Zealand 8.0 11.0 16.0 17.0 19.0 22.6 40.9 42.1Niue 0 0
---0 0 0 _0 0 0
Pakistan 10.2 10.2 12.2 13.2 17.2 35.2 42.2 42.2Papua New Guinea __ 0 0 0
---0 0 _ 0 0 0
Philippines 15.0 2.0 8.0 13.0 12.0 9.0 8.0 6.0Samoa 0 0 0 0 0 0 0 0Singapore 0 0 0 0 0 _0 0 0Solomon Islands 0 0 0 0 0 0 0 0Sri Lanka 0 0 0 0 0 0 0 0Taiwan 7.0 8.0 6.0 6.0 640 __44.0 4.0 5.0Thailand 0.3 1.3 11.0 17.0 29.0 52.0 51.0 47.0Tonga 0 0 0 0
_0 0 0 0
U.S. Pacific Islands 0 0 0 0 0 0 0 0Vanuatu
i0 0 0 0 0 0_ 0 0
Vietnam 0 0 0 0 0 0 0.8 5.0Wake Island 0 0 0 0 0 0 0 0Asia 8Oceania 5,017.5 5 ,010.9 4,856.2 5 , 166.4 5,601 .0 5,922.9 6,136 .0 6,128.5
World Total 63,092 .3 59,786 .0 57,242 .7 57,130.6 58,619 .4 58,203 .2 60,642 .6 61,245.3
URL: http://www.eia.doe.gov/pub/international/iealf/tableg1.xls Page 17
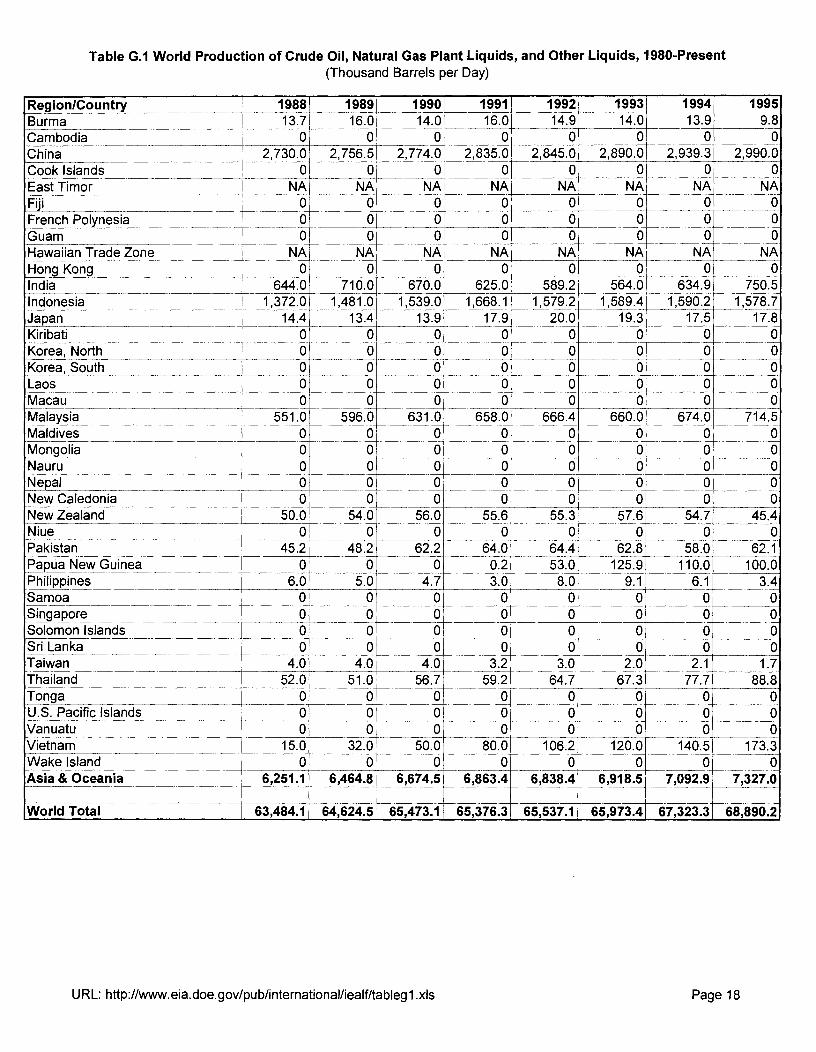
Table GA World Production of Crude Oil, Natural Gas Plant Liquids , and Other Liquids , 1980-Present(Thousand Barrels per Day)
_Region/Country 1988 _ 1989 1990 1991 1992 1993 1994 1995iBurma 13.7 16.0 14.0 16.0 14.9 14.0 13.9 9.8Cambodia 0 0 0 0 _ 0 0 0 0China 2,730.0 2,756.5 2,774.0 2,835.0 2,845.0 2,890.0 2,939.3 2,990.0Cook Islands 0 0 _ 0 0 0 _ 0 0 0East Timor NA NA NA NA NA NA NA NAFiji 0 0 0 0 _ 0 0 0 0French Polynesia 0 0 0 0 0 0 0 0Guam 0 0 0 0 __ 0 0 0 0
a Z_oneHawaiian Trad_
NA NA NA NA NA NA NA NA_Hong Kong 0 _ 0 0 0 0 0 0 0India 644.0 710.0 670.0 625.0 589.2 564.0 634.9 750.5_Indonesia 1,372.0 1,481.0 1,539.0 1,668.1 1,579.2 1,589.4 1,590.2 1,578.7Japan 14.4 13.4 13.9 17.9 20.0 19.3 17.5 17.8_Kiribati 0
_0 0 0 0
^0 0 0_ _
Korea, North-----orth_
0 0 0 0 0 0 0 0Korea, South 0 0 0 0 0 0 0 0__Laos
^_ 0
_0 0 0-0-- 0 0 0_
Macau 0_
_ 0 0,
__ 0 _ 0 _ 0 0 0
Malaysia 551.0 596.0 631.0 658.0 666.4 660.0-
674.0 714.5Maldives _ 0 _ 0 0 0 0 _0 0 0Mongolia 0 0 0 0 0
_0 0 0
Nauru 0 0 0 0 0_
0 0 0Nepal 0 0 0 0
_0 0 0 0
New Caledonia__
0 0 0 0 0 0 0 0New Zealand 50.0
_ _54.0 56.0 55.6 55.3 57.6 54.7 45.4
Niue_ _ 0 01
_ 0 ^0 0 _ 0 0 0Pakistan _ 45.2 48.2 62.2 64.0 64.4 62.8 58.0 62.1Papua New Guinea 0 0 0 0.2 53.0 125.9 110.0 100.0Philippines
i6.0 5.0 4.7 3.0 8.0 9.1 6.1 3.4
Samoa_ 0 _ 0 0 0 0 0 0 0Singapore _ 0 0 0 0 0 0 0 0Solomon Islands 0 _ 0 0 0 0 0 0 0Sri Lanka 0 0 0 0 0 0Taiwan 4.0 _ 4.0 4.0 3.2 ---3-.0 2.0 2.1 1.7Thailand _ 52.0 51.0 56.7 59.2 64.7 67.3 77.7 88.8Tonga _ 0 _ 0 0 0 0 0 0 0U.S. Pacific Islands 0 0 0 0 0 0 0 0Vanuatu ^0 0
_0
_0
_^ 0
_0 0 0
Vietnam 15.0 32.0 50.0 80.0_
106.2 120.0 140.5 173.3Wake Island 0 0
-0 0
_0
Asia & Oceania 6,251 . 1 6,464.8 6,674 .5_
6,863 .4 6,838 .4 6,918.5 7,092.9 7,327.0
World Total 63,484 . 1 64,624.5 65,473 . 1 65,376 .3 65,537.1 65,973 .4 67,323.3 68,890.2
URL: http://www.eia .doe.gov/pub/international/iealf/tableg1.xls Page 18

Table GA World Production of Crude Oil, Natural Gas Plant Liquids , and Other Liquids , 1980-Present(Thousand Barrels per Day)
Region/Country _ 1996 1997 _ 1998 _ 1999 _ 2000 -_2001 2002 2003Burma 8.2 9.2 11.2 9.7 12.3 10.2 15.2 15.2Cambodia 0 0 0 0 0 0 _ 0 0China 3,131.3
_3,200.3 3,198.2 3,195.0 3,248.8 3,300.0 3,389.7 3,408.9
Cook Islands 0 0 0 0 0 _0 0 0East Timor NA NA NA NA NA NA NA 0.0Fiji 0 0 0 0 __ 0 0 - 0 0French Polynesia 0 0 0 0 0 _-_ 0 0 0iGuam _Hawaiian Trade Zone
0NA
0NA
0NA
0NA NA
0NA
0NA
0NA
Hong Kong _0 0 0 0 0 0 0 _ 0India 731.0 759.6 751.4 742.7 736.3 742.4 779.8 782.0Indonesia 1,627.5 1,605.0 1,605.1 1,558.8 1,518.4- 1,421.6-- 1,329.0 1,233.0- --- - -Japan
-18.3
-17.5 -17.;
-16.3 -1 8.0 7. .3- 1 15.5 15.0
Kiribati 0 0 0_
0 0 0 0 _ 0_Korea, North 0
_^0
_0
_0
-0 0 0 0
Korea, South 0 0 0 0 0 0 0 0Laos 0 0 0 0 __0 0 0 0Macau 0 _ 0 0 0 0 0 0 0_Malaysia 727.0 762.0 820.0 788.0 _ 763.0 741.2 _785.5 830.9Maldives 0 0 0 0 0 0 0 0Mongolia 0 0 0 0 0 0 0 0Nauru 0 0 0 0 0 _ 0 0 0Nepal 0 0 0 0 0 0 _0
-0
New Caledonia 0 0 0 0 0 0 0 0New ZealandNiue
44.50
65.70
54.50
49.80
45.0_ 0
41.2_ 0
38.20
29.0- 0
Pakistan_58.0 60.0 _58_4 57.1_ 58.0 64.6 69.0 64.9_
Papua New Guinea 103.4 80.0 79.1__
96.6 70.1 67.5-
55.2 50.5Philippines 2.0
_1.0 0.8 0.9 1.1 8.5 9.9 13.8
Samoa - 0 0 0 0 0 0 0 0Singapore 0 0 0 0 0 _ 0 0 0Solomon Islands _0 0 0 0 0 0 0 0Sri Lanka 0 0 0 0 _ 0 _ 0 0 0Taiwan
_1.7 1.4 1.3 _ 1.0 1.0 1.0
Thailand 95.9 121.7 135.0 144.6 169.7 173.8 192.2 241.2_Tonga 0 0 _0 0 0 0 0 0U.S. Pacific Islands 0 0 0 0 0 0 0 0Vanuatu _ 0 - 0 0
_0
Vietnam 175.5 191.3 245.7 289.8 316.0 356.7 339.6 352.5Wake Island 0 0 0 0 0 0 0 0_Asia Oceania 7,524.6
_7,710 .5 7,773.3 7,767. 1 7,968 .0 7,898 . 9 7,922 .4 7,834.0
World Total 70,419 .6 72,613 . 1 74,024 .8 73,163.2 75,958.9 75,878 .8 75,039 .0 77,592.8
URL: http://www.eia . doe.gov/pub/intemational/iealf/tableg1.xls Page 19

Table GA World Production of Crude Oil, Natural Gas Plant Liquids, and Other Liquids, 1980 -Present(Thousand Barrels per Day)
Region/Country 2004Burma 20.2Cambodia 0China 3,485.3Cook Islands _ 0East Timor 51.9
0French Polynesia_
^0
Guam 0Hawaiian Trade-Zone NAHong Kong 0India 811.4Indonesia 1,168.6^Japan
_17.0_
Kiribati 0Korea, North ^_ 0Korea, South 0Laos 0Macau 0MalaysiaMaldives
850.4
Mongolia 0NauruNepal_ 0New Caledonia 0New Zealand _ 24.9Niue 0Pakistan 67.0_ _Papua New Guinea 45.6Philippines _ 25.0Samoa 0Singapore 0Solomon Is lands 0Sri Lanka 0Taiwan
_0.8_
Thailand 237.8Tonga 0U.S. Pacific Islands _ - ^0Vanuatu 0Vietnam
_403.3
Wake Island 0Asia Sz Oceania 7,941.2
World Total 80,938.0
URL: http://www.eia.doe.gov/pub/international/iealf/tableg1.xls Page 20