three brands. one company
TRANSCRIPT

Annual Report 2019
All good brands are

Three brands. One company. Great potential.
For the brand quality, we guarantee.


Content
Our Company Key Figures 4Highlights 2019 6IMMOFINANZ at a Glance 12Interview with the Executive Board 14Our Brands 20 IMMOFINANZ on the Capital Market 32
Corporate Governance Report of the Supervisory Board 38Corporate Governance Report 41
Group Management Report Economic Overview and Property Markets 51Portfolio Report 56Property Valuation 68 Financing 69Business Development 74EPRA Financial Indicators 78Risk Report 83Information on Equity 89 Consolidated Non-financial Statement for the 2019 Financial Year 92 Research & Development 114 Outlook 114
Consolidated Financial StatementsConsolidated Balance Sheet 118 Consolidated Income Statement 119 Consolidated Statement of Comprehensive Income 120 Consolidated Cash Flow Statement 121 Consolidated Statement of Changes in Equity 122Notes to the Consolidated Financial Statements 124 Auditor’s Report 212 Statement by the Executive Board 217
Financial Calendar 218Imprint 218
3

Key figures
Earnings
Assets
Investment property
2019 2018 Change in %
Rental income in MEUR 279.9 236.9 18.1%Results of asset management in MEUR 207.3 174.0 19.1%Results of property sales in MEUR -5.1 27.2 n. a.Results of property development in MEUR -12.4 -4.3 ≤ -100.0%Results of operations in MEUR 149.9 153.1 -2.1%Revaluations in MEUR 193.3 24.9 ≥ +100.0%EBIT in MEUR 345.6 159.1 ≥ +100.0%Financial results in MEUR 4.5 44.2 -89.9%EBT in MEUR 350.1 203.3 72.2%Net profit for the period in MEUR 352.1 217.5 61.9%FFO 1 before tax (sustainable FFO from asset management incl. S IMMO/CA Immo)1 in MEUR 137.4 105.6 30.2%FFO 1 per share before tax1 in EUR 1.29 0.96 34.4%
1 See the calculation under Business Development.
31 Dec. 2019 31 Dec. 2018 Change in %
Total number of properties 213 226 -5.8%Rentable space in sqm 2,001,063 1,891,627 5.8%Occupancy rate in % 96.8% 95.8% n. a.Gross return1 in % 6.2% 6.3%2 n. a.Invoiced rents return1 in % 6.5% 6.7% n. a.Portfolio value1 in MEUR 5,122.1 4,338.02 18.1%Unencumbered investment property in MEUR 1,434.0 749.0 91.5%
1 Based on expert appraisals (excl. IFRS 16) 2 Excl. reclassification effects, among others from IFRS 16
31 Dec. 2019 31 Dec. 2018 Change in %
Balance sheet total in MEUR 6,385.1 5,837.7 9.4%Equity as % of the balance sheet total in % 46.0% 48.0% n. a.Net financial liabilities in MEUR 2,483.1 1,793.5 38.4%Cash and cash equivalents in MEUR 341.2 631.8 -46.0%Loan-to-value ratio (net) in % 43.0% 37.3% n. a.Gearing in % 86.0% 64.1% n. a.Total average interest rate incl. costs for derivatives in % 1.9% 2.1% n. a.Average term of financial liabilities in years 4.01 3.31 21.2%
1 The convertible bond 2024 is presented in 2022 due to a put option for the bondholders; end of the bond term in 2024.
EUR 137.4 mnFFO 1 before tax
EUR 6.4 bnBalance sheet total 96.8 %
Occupancy rate

31 Dec. 2019 31 Dec. 2018 Change in %
EPRA net asset value in MEUR 3,563.7 3,086.0 15.5%EPRA net asset value per share in EUR 31.05 28.80 7.8%EPRA triple net asset value in MEUR 3,516.1 3,047.7 15.4%EPRA triple net asset value per share in EUR 30.63 28.44 7.7%EPRA vacancy rate2 in % 3.2% 4.1% n. a.
2019 2018 Change in %
EPRA earnings in MEUR 190.9 170.8 11.7%EPRA earnings per share in EUR 1.79 1.55 15.6%EPRA earnings after company-specific adjustments in MEUR 178.5 149.3 19.6%EPRA earnings per share after company-specific adjustments in EUR 1.67 1.35 23.7%EPRA net initial yield in % 5.7% 5.6% n. a.EPRA capital expenditure in MEUR 824.6 240.9 ≥ +100.0%
1 See calculations in the section on EPRA Financial Indicators2 The EPRA vacancy rate is based on the ratio of the estimated market rent for the vacant space in the standing investments to the total estimated market rent
for the standing investment portfolio.
OUR COMPANYKey figures
The plus and minus signs assigned to the changes reflect the business point of view: improvements are shown with a plus sign (+), deteriorations with a minus sign (-). Very high positive or negative per cent changes are reported as ≥+100% or ≤-100%. The designation “not applicable” (n. a.) is used when there is a change in the sign (i.e. from plus to minus or from minus to plus) and for changes in percentage rates.
EPRA1
Stock Exchange Data 31 Dec. 2019 31 Dec. 2018 Change in %
Book value per share in EUR 29.34 26.29 11.6%Share price at end of period in EUR 23.90 20.90 14.4%Discount of share price to EPRA NAV diluted per share in % 23.0% 27.4% n. a.Total number of shares 112,085,269 112,085,269 0.0%
thereof number of treasury shares 11,208,526 4,942,001 ≥ +100.0%Market capitalisation at end of period in MEUR 2,678.8 2,342.6 14.4%
2019 20182 Veränderung in %
Earnings per share (basic) in EUR 3.37 1.97 70.9%Earnings per share (diluted) in EUR 3.03 1.80 68.0%
EUR 31.05EPRA net asset value per share
EUR 3.37Earnings per share (basic)
5

Highlights 2019
January
S&P Global Ratings awards IMMOFINANZ a long-term issuer rating of “BBB-“, among others based on the rising demand in the company’s business sector. As the first Austrian real estate company, IMMOFINANZ successfully places a benchmark bond:
volume EUR 500 million.
March
Over 142 million guests visited IMMOFINANZ’s STOP SHOP retail parks and VIVO! shopping centers in 2018, for a sound year-on-year increase of 16.7%. That means roughly 20 million more customers for the Group’s retail properties. Good for tenants, who recorded a plus of roughly 5.0% in gross
turnover.
142million visitors – strong growth
in visitor frequency for STOP SHOP
and VIVO!
500million euro
benchmark bond and first investment
grade rating from S&P

With the Warsaw Spire Tower, IMMOFINANZ acquires a prime property in the Polish capital. The office tower is 220 meters high, has 49 floors and 71,600 sqm of usable space. Based on a property value of EUR 386 million, it is expected to generate approx. EUR 19.6 million of rental income annually and strengthen
IMMOFINANZ’s sustainable earning power.
IMMOFINANZ reports a further high-quality addition: The Palmovka Open Park in Prague represents a valuable addition to the Group’s office portfolio in the core Czech market and will be integrated into the myhive brand. The 25,800 sqm of rentable space is ex-pected to generate EUR 4.4 million of rental
income per year.
June July
220meters in height –
IMMOFINANZ acquires the top office
high-rise Warsaw Spire Tower
4.4million euro in rental income – acquisition
of the Palmovka Open Park office property
in Prague
7

August
63,500square meters –
further optimisation of
the Warsaw office portfolio
90 locations –
the STOP SHOP portfolio continues
its expansion course
IMMOFINANZ sells individual areas and land reserves at the EMPARK office complex to the Polish developer Echo Investment as part of measures to optimise the portfolio in Warsaw. Plans call for the construction of a multifunctional, mixed usage concept with residential, retail and office space at this loca-tion. IMMOFINANZ will continue the modern-isation projects currently in progress for the remaining four buildings, which have approx.
63,500 sqm of rentable space.
1 1
14
9
9
7
10
13
16
August
The acquisition of six fully rented retail parks in Slovenia and Poland (54,000 sqm of space in total) and the completion of two projects in Poland and Serbia (21,000 sqm in total) underscore the STOP SHOP expan-sion course. This brand has now grown to 90 locations – and the trend is still pointing
upward.

The Stoxx Europe 600 represents companies in 17 countries and serves as an important European benchmark index. IMMOFINANZ was included as of 23 September 2019 based on the con-tinuous improvement in the share price and the related growth in the market capitalisation of its free float. Inclusion in this index should lead to greater in-
terest by international investors.
With the myhive am Wienerberg, IMMOFINANZ not only has one of the largest office and commercial locations in the Austrian capital. The attractive long-term refinancing of the property also marks a milestone for the Group. The EUR 120 million, 15-year credit agreement with UniCredit Bank Austria further reduces IMMOFINANZ’s aver-
age financing costs.
September November December
IMMOFINANZ share added
to the well-known index
STOXX Europe
600
36,000square meter – repositioning of the VIVO!
shopping center in Bratislava
Financing struc-ture optimised with new credit agreement of
120million euro
IMMOFINANZ invested approx. EUR 25 million in the modernisation and repositioning of its shopping center in Bratislava, which was previously operated as the Polus City Center. Under IMMOFINANZ‘s VIVO! brand, this shopping complex now has 170 specialised retailers on 36,000 sqm. Major new anchor tenants include Lidl
and the LPP Group.
9

Key data on the standing investments by core market as of 31 December 2019
Warsaw Spire TowerWarsaw | PL | approx. 71,600 sqm
rentable space
bn carrying amount standing investments
EUR 4.7

22.5% Poland
6.9% Slovakia
12.1% Germany
11.4%Czech Republic
15.7% Austria 10.6%
Hungary
14.3% Romania
1 Return based on invoiced rents: The difference to the gross return under IFRS is explained by the accrual of rental incentives – e. g. the standard market practice of granting rent-free periods or allowances for fit-out costs. These incentives must be accrued on a straight-line basis over the contract term in accordance with IFRS (basis for gross return under IFRS) but are not included in the invoiced rent.
2 In declining order based on the carrying amount: Slovenia, Serbia and Croatia
Share of the standing investment portfolio EUR 4,749.5 million based on the carrying amount as of 31 December 2019
OUR COMPANYKey data on the standing investment portfolio
Austria
Number of properties 24 Carrying amount in MEUR 744.9 Carrying amount in % 15.7 Rentable space in sqm 236,657 Occupancy rate in % 95.1 Rental income Q4 2019 in MEUR 9.7 Gross return in % 5.2 Invoiced rents return in %1 5.0
Czech Republic
Number of properties 18 Carrying amount in MEUR 540.7 Carrying amount in % 11.4 Rentable space in sqm 218,615 Occupancy rate in % 96.9 Rental income Q4 2019 in MEUR 7.3 Gross return in % 5.4 Invoiced rents return in %1 4.9
Slovakia
Number of properties 20 Carrying amount in MEUR 329.1 Carrying amount in % 6.9 Rentable space in sqm 187,671 Occupancy rate in % 95.6 Rental income Q4 2019 in MEUR 5.8 Gross return in % 7.1 Invoiced rents return in %1 7.3
Other countries²
Number of properties 27 Carrying amount in MEUR 310.0 Carrying amount in % 6.5 Rentable space in sqm 217,378 Occupancy rate in % 99.3 Rental income Q4 2019 in MEUR 6.4 Gross return in % 8.3 Invoiced rents return in %1 8.3
Germany
Number of properties 5 Carrying amount in MEUR 573.7 Carrying amount in % 12.1 Rentable space in sqm 103,665 Occupancy rate in % 98.7 Rental income Q4 2019 in MEUR 5.6 Gross return in % 3.9 Invoiced rents return in %1 4.3
Hungary
Number of properties 23 Carrying amount in MEUR 504.6 Carrying amount in % 10.6 Rentable space in sqm 284,112 Occupancy rate in % 97.3 Rental income Q4 2019 in MEUR 8.6 Gross return in % 6.8 Invoiced rents return in %1 7.5
Poland
Number of properties 24 Carrying amount in MEUR 1,069.2 Carrying amount in % 22.5 Rentable space in sqm 410,124 Occupancy rate in % 98.2 Rental income Q4 2019 in MEUR 16.9 Gross return in % 6.3 Invoiced rents return in %1 7.0
Romania
Number of properties 17 Carrying amount in MEUR 677.3 Carrying amount in % 14.3 Rentable space in sqm 342,842 Occupancy rate in % 94.0 Rental income Q4 2019 in MEUR 13.4 Gross return in % 7.9 Invoiced rents return in %1 8.3
IMMOFINANZ
Number of properties 158 Carrying amount in MEUR 4,749.5Carrying amount in % 100.0 Rentable space in sqm 2,001,063 Occupancy rate in % 96.8 Rental income Q4 2019 in MEUR 73.8 Gross return in % 6.2 Invoiced rents return in %1 6.5
11

158Standing investments represent roughly 93% of the total property portfolio and are our most important earnings driver.
We create real estate solutions for our customers. In addition to the professional
management of these properties, we focus on value-creating growth through
our own development projects and acquisitions. Our portfolio is concentrated
on three brands: myhive for offices, STOP SHOP for retail parks and VIVO! for
shopping centers – always based on the goal to strengthen our standing invest-
ments and sustainable cash flow.
standing investments
Based on the carrying amount, approx. 50% of our standing investment portfolio is located in Austria, Germany and Poland.
IMMOFINANZ at a glance
EUR bn carrying amount 4.7

2.0
96.8 %
million sqm rentable space
Occupancy rate
This space is distributed primarily between our two core businesses – office (52%) and retail (48%) – with additional areas in our completed development projects.
Seven core markets represent the geographical focus of our business activities: Austria, Germany, Poland, Czech Republic, Slovakia, Romania and Hungary. Our local teams in each of these core markets are the guarantee for a strong service orientation and customer satisfaction.
Strengthening ties with existing tenants and acquiring new tenants are the main focus of our daily activities.
13

A year of milestones
If you were asked to briefly describe and rank the 2019 financial year – where would you start? Dietmar Reindl: It was a very good year and marked a milestone in our company’s history! The occupancy rate in our properties continued to improve – from an already high level – and set a new record at 96.8%. This is a direct result of our clear brand policy with innovative office and retail solutions as well as the commitment of our cus-tomer-oriented staffs. Our net profit rose by more than 60 per cent and, at roughly EUR 352 million, reached the highest level recorded in many years. Through profitable property acquisitions and the completion of construction projects, our portfolio grew by nearly EUR 1 billion to EUR 5.1 billion in 2019 – which confirms that IMOFINANZ has now reached a relevant size as a player in the European real estate sector. Stefan Schönauer: The development of our funds from operations, which is an important profitability indicator in the real estate branch, un-derscores this success. FFO 1 improved by more than 30 per cent to EUR 137.4 million in 2019. That means we clearly exceeded our guidance and demonstrates the success of the mea sures imple-mented in recent years to strengthen earnings. In other words, we delivered what we promised. As a reminder: In April 2017, during our repo-sitioning, we announced a goal to generate FFO 1 of more than EUR 100 million in the 2019 financial year. This guidance was raised to more than EUR 128 million with the publication of our 2019 half-year results. In the end, FFO 1 totalled EUR 137.4 million – or more than one-third above our original forecast. We also set a number of financing milestones during the past year: At the beginning of 2019, we received an investment grade rating from S&P and issued a benchmark bond for over EUR 500 million.
Dietmar Reindl: We used the last few years to create a solid foundation for IMMOFINANZ and position the company as an innovative provider of high-quality property solutions. Our customer orien-tation, investments in the quality of the standing in-vestments and the continuous improvement of our service offering have made us very successful. And this goes hand in hand with top performance in the financial area. IMMOFINANZ is very well prepared to deal with the current challenging environment and the related slowdown in global growth caused by the corona crisis: We took the necessary steps during the first days and weeks and implemented numerous measures to minimise the potential neg-ative impact on our Group.
An interview with the Executive Board – Dietmar Reindl and Stefan Schönauer – on the 2019 financial year: the occupancy rate set a new record, net profit reached the highest level in many years and the guidance for FFO 1 was definitely more than met.
Dietmar Reindl COO
“It was a very good year and marked a milestone in our company’s history!”

The Executive Board of IMMOFINANZ, from left to right: Stefan Schönauer and Dietmar Reindl
Stefan Schönauer: The sale of our investment in CA Immo during 2018 was an important part of our efforts to strengthen IMMOFINANZ in view of a possible economic slowdown. Our objectives here included the protection of liquidity, the fur-ther optimisation of financing costs and the diver-sification of our financing structure. And we made a great deal of progress in all key areas. Cash and cash equivalents totalled EUR 345 million at year-end 2019. Additionally, we concluded a revolving credit facility of EUR 100 million at the end of March 2020 to further improve the liquidity po-sition. Draw-downs are possible at our discretion
at any time during the two-year time frame, which give IMMOFINANZ added financial flexibility. Gearing, based on net LTV, currently equals 43 per cent which is clearly below our target of roughly 45 per cent, and our financing costs declined fur-ther to 1.91 per cent. As I mentioned, we also ac-cessed another important financing source in 2019 with the first-time receipt of an investment grade rating and the issue of a benchmark bond. This security represents the first benchmark bond with an investment grade rating issued by an Austrian real estate company.
15

You mentioned the growth of the portfolio to more than EUR 5.1 billion. Was part of your liquidity used for this purpose in 2019? Stefan Schönauer: Yes, due to the very profitable sale of our CA Immo investment in 2018 and the re-lated cash inflows of over EUR 500 million, we had a well-filled bank account. We invested part of this
surplus liquidity in office properties and the further expansion of our retail park platform to strengthen our earning power. Last year we also completed a share buyback programme and now hold 10 per cent of our own shares, which we purchased sub-stantially below the net asset value. Dietmar Reindl: One of the most spectacular deals in 2019 involved the Warsaw Spire in Poland, which we acquired from Ghelamco and Madison International Realty. It is the highest office tower in the entire CEE region with 49 floors. Together with the spire, meaning the attached tip, it mea-sures 220 meters in total. The tower is fully rented to well-known firms like Goldman Sachs, Samsung, JLL and Mastercard. We are now integrating the Warsaw Spire into our myhive office concept, with its focus on service, a comfortable atmosphere and community building. Our other office acquisition in the second half of 2019, the Palmovka Open Park
in Prague, will also be operated as a myhive. This location, in the heart of the rapidly growing adminis-trative center and directly adjoining an underground station, is absolutely top, with a wide range of ser-vices and the Vltava River as well as several public parks nearby. These acquisitions have strengthened both our standing on the market and the recogni-tion of our myhive brand. We also invested in our retail business during the past year, namely through the acquisition of six fully rented retail parks in Slovenia and Poland with roughly 54,000 sqm of rentable space in to-tal. These properties will become part of our STOP SHOP brand. The acquisition yield on this package was over 8.5 per cent. Our STOP SHOP portfolio now covers 90 locations in nine countries and has a book value of nearly one billion euro. Stefan Schönauer: Another acquisition at the beginning of 2019 covered the second half of the Na Příkopě 14, a building in the inner city of Prague, where we are now the sole owner. This revitalised prime street property on Prague‘s well-known shopping promenade, which is comparable to the Graben in Vienna, has an excellent inner-city loca-tion. In addition, this transaction marked the end of our last major joint venture in the real estate sector.
“We accessed another important financing source with the first-time receipt of an investment grade rating and the issue of a benchmark bond.” Stefan Schönauer CFO
IMMOFINANZ AGAnnual Report 2019
16

You repeatedly emphasise that the brand policy is a major success factor for your business. The myhive office brand was in-troduced at the end of 2016. What is your assessment so far? Are you satisfied? Dietmar Reindl: More than that. Our expecta-tions were clearly exceeded. When we launched the brand and the myhive concept more than three years ago, we were entering relatively new territo-ry. Modern office worlds with a comfortable, ho-tel-like atmosphere and community elements were not widely known in our markets. The introduction was, consequently, a courageous decision. We also invested a great deal to renovate the lobbies and create tenant lounges. And a design guideline was developed – inspired by hotels – to bring a friendly, comfortable atmosphere into the public areas. myhive’s second important feature is the commu-nity. The events and offerings organised by our community managers are extremely popular with our tenants and their staffs, and our internation-al community has grown to include more than 40,000 employees. Stefan Schönauer: The occupancy rate in our myhive office buildings has reached 95%, a top level in international comparison. That not only gives us higher rental income, but has substan-tially reduced our vacancy costs. We are now able to generate higher effective rents. All in all, the myhive concept has had a very positive effect on our sustainable cash flow. We also exam-ined this factor in detail: An analysis of the my-hive portfolio – excluding acquisitions, com-pletions and sales – shows an improvement of 16.4 percentage points on average in the occupancy rate since the roll-out. This higher occupancy rate combined with lower vacancy costs and the increase in net rents, in total, gen-erate a positive cash flow effect of more than EUR 4 million per year. Dietmar Reindl: Our agenda for 2019 included an upgrade for myhive – in the future, it will give our tenants even more flexibility with regard to the contract term, space and location. Today’s of-fice tenants want greater flexibility – that’s a very important trend in our branch. With our expanded offering, we can provide solutions that optimally meet tenants‘ needs. This is another pioneering role for IMMOFINANZ, but naturally a role that also adds up for us. A further plus: Our offering will be expanded to include all-inclusive space – which means the tenant doesn’t need to worry about planning the offices, watering the plants or cleaning. We can take care of everything when this is what is needed. These new, flexible offerings with shorter contract commitments also meet tenants‘ needs
in an uncertain market environment, just like we are currently experiencing in connection with the corona crisis. Our tenants can concentrate fully on their core business, and their office costs re-main flexible.
OUR COMPANYA year of milestones
“Our retail platform has grown to 100 locations and is fully rented.”Dietmar Reindl COO
17

And how was the performance in the retail sector with your STOP SHOP and VIVO! brands? Dietmar Reindl: Very good! We have increased our retail platform to 100 locations, expanded our position as the leading retail park operator, complet-ed major modernisation projects at our VIVO! shop-ping centers in Bratislava and in the Romanian city of Cluj and – what is particularly rewarding – we are fully rented. The occupancy rate in the retail portfo-lio is now at 98.3%, and at an even higher 98.8% in the STOP SHOPs. More is really not possible because you always need to have a certain level of technical vacancies for tenant turnover. And another point, the gross rental return is top at 8.1%. Visitor frequency has also increased significantly: Over 156 million customers visited our retail prop-erties in 2019, which means a plus of 14 million or roughly 10 per cent. By way of comparison: That represents roughly the entire population of Austria, Germany, Poland, Slovakia and Romania combined.
What are the main factors for the success of this concept? Dietmar Reindl: The focus of our STOP SHOP retail parks and VIVO! shopping centers is not on the national capitals, but on medium-sized and smaller cities primarily in Eastern and Southeastern Europe where there is still free market capacity.
Our positioning in the convenience segment and the high degree of standardisation in our properties make it possible for us to offer very attractive rents and operating costs. That, in turn, helps retailers to develop additional market capacity with high space productivity. Our tenant-friendly, cost-efficient VIVO! and STOP SHOP retail concepts and the strong focus on low-cost, everyday products create a good basis in today’s challenging situation and will also prove successful in an environment that will most likely be influenced by a temporary, but sub-stantial slowdown in economic growth.
Development projects as a share of the total portfolio fell from over 9% in the previous year to almost 4% in 2019. Were there no new projects in sight? Dietmar Reindl: No, that’s not the reason. The economic cycle had already been positive for a longer time in 2019 – and we didn’t want to take any excessive development risks. We also com-pleted several larger projects during the past two years, for example our FLOAT office building in the Düsseldorfer Medienhafen, where our tenant Uniper has relocated with roughly 2,500 employ-ees. In Vienna, we completed the renovation of a hotel and office tower on the Wienerberg, and in the Czech city of Třebíč we opened the extension to our STOP SHOP. This retail park now has nearly 22,000 square meters of rental space, which make it the largest STOP SHOP in our portfolio. Our general objective is to maintain a healthy balance between standing investments and devel-opment projects, which we want to hold at or below 10 per cent of the total portfolio. Our largest project at the present time is our first myhive office building in Germany: the myhive Medienhafen in Düsseldorf, which is scheduled for completion in 2021. And at the end of March 2020, we opened our STOP SHOP in the Polish city of Siedlce as planned. The share of shops which sell basic supplies is high in branch comparison, which has allowed a number of tenants to open despite the corona crisis.
Let’s take a look at the financial indica-tors: What were the main drivers for the substantial improvement in net profit dur-ing 2019? Stefan Schönauer: On the one hand, the prof-itable growth of the portfolio and the improve-ment in the occupancy rate were responsible for a sound increase of more than 18% in rental income to EUR 279.9 million and more than 19% in the results of asset management to EUR 207.3 million. The latter increase was also supported by a reduction in property expenses.
Stefan Schönauer CFO
“In the area of asset manage-ment, our efforts led to an improvement of more than 19% in results.“
IMMOFINANZ AGAnnual Report 2019
18

Our financial results were positively influenced, among others, by a decrease in financing costs – which were 5.6% lower than the previous year at EUR -64.6 million – and that based on a substan-tially higher financing volume. And we also bene-fited from strong positive valuation results, which totalled EUR 195.7 million and resulted, above all, from solid development in all our core markets in 2019. Below the line, net profit rose by more than 61% to EUR 352.1 million, and we saw a sound improvement in diluted earnings per share from EUR 1.80 to EUR 3.03.
What does that mean for the dividend? Stefan Schönauer: Our stated goal is to distrib-ute 75 per cent of FFO 1 to shareholders. This year’s annual general meeting was rescheduled to 1 October 2020 due to the Covid-19 crisis – here, the protection, safety and health of our sharehold-ers and staff are our top priority. We therefore decided to postpone our recommendation for the distribution of profit for the 2019 financial year and will present this information together with the publication of our half-year results for 2020. Until then, we will continuously monitor the effects of the Covid-19 crisis on our business. Dietmar Reindl: Today’s rapidly changing de-velopments make it impossible to fully assess the effects of the pandemic at the present time. How-ever, we are taking all possible steps to minimise the potential negative effects on the company. Included here, for example, are cost reductions and the reschedul-ing of non-critical investments to later years. And we are maintaining close contact with our tenants in order to master these challenges together. In recent years, we have successfully placed the company on a solid founda-tion with regard to earnings as well as costs. The results of these efforts are clearly visible in our 2019 indicators. Covid-19 represents a genuine head-wind for the global economy and for our markets, but we are also well po-sitioned to manage this phase. Conse-quently, we have already directed our attention to the future, so we can sup-port our tenants’ businesses with our property solutions when the economy restarts.
OUR COMPANYEin Jahr der Meilensteine
Dietmar Reindl COO
“IMMOFINANZ has a solid income and cost base. This is clearly visible in our 2019 indicators and also means we are well-positioned to meet the current challenges.”
19

Discover our offices – the working world redefined.
Our myhive offices represent roughly 52% of the carrying amount of our office standing investments. These properties have roughly 26,000 sqm of rentable space on average.
EUR 1,570.2 mn
carrying amount

23standing investmentsOur activities in the office sector are concentrated on the capital cities of our core markets and on the major office locations in Germany. We currently have 23 myhive locations with approx. 556,000 sqm of rentable space.
95.0%occupancy rateStrong customer orientation and investments in the quality of our buildings have led to an occupancy rate of 95.0% in our myhive offices.
21

Our brandsmyhive
myhive am WienerbergVienna | AT approx. 150,000 sqm of rentable space
Our international myhive brand places top priority on innovative office concepts with a wide range of services, excellent infrastructure and an active community. In the future, we will also offer even greater flexibility for contract commitments, space and location.
556,000 sqmrentable space

Our office solutions are as diverse as companies them-selves - size and facilities can be easily adapted to meet tenants' needs.
Characteristic features of our myhive office buildings: – Hotel atmosphere– Infrastructure– Community– Flexibility
Additional information on the office properties is provided in the Portfolio Report beginning on page 61.
7 locations in Poland with approx. 189,000 sqm of
rentable space
2 locations in the Czech
Republic with approx. 45,000 sqm of rentable space
4 locations in Austria
with approx. 108,000 sqm of rentable space
5 locations in Hungary with approx. 114,000 sqm of
rentable space 3 locations in Romania with
approx. 65,000 sqm of rentable space
2Slovakia approx.
36,000 sqm
Our offices meet the expectations on a modern working environment. With myhive, we create a friendly and lively atmosphere that includes numerous services for multi-tenant buildings.
OUR COMPANYOur brands – myhive
23

10
97.5%
standing investments
occupancy rateOur tenants value the high standardisation of VIVO! shopping centers. That improves cost efficiency and creates synergies – and everyone benefits. At 97.5%, the occupancy rate was stable at the end of 2019.
VIVO! was launched in 2014 as an IMMOFINANZ development project and subsequently rolled out to existing shopping centers.

The VIVO! shopping experience
carrying amount
Our VIVO! shopping centers represent roughly 43% of the carrying amount of our retail standing investments and generate approx. 43% of rental income.
EUR 716.5 mn
25

Our brandsVIVO!
Better shopping – better life. VIVO! is our shopping center brand. It is designed for cities with a catchment area of at least 200,000 residents and highlighted by strong anchor tenants and an attractive mix of international and local retailers.
314,000 sqmrentable space

4 locations in Poland with approx. 110,000 sqm of
rentable space
1 location in the Czech Republic
with approx. 22,000 sqm of rentable space 1
Slovakiaapprox. 36,000 sqm
4 locations in Romania with
approx. 146,000 sqm of rentable space
OUR COMPANYOur brands – VIVO!
Branch mix VIVO!only rented space
VIVO! is uncomplicated shopping with a special experience for the entire family. These shopping centers are normally single-storey and – with their standard-ised design and modern atmosphere – have a high recognition value. They are characterised by a balanced branch mix and modern food courts as well as a wide range of services and entertainment.
Characteristic features of the VIVO! shopping centers: – Combination of shopping enjoyment with a leisure character– Strong anchor tenants and an attractive branch mix– Sufficient parking spaces– Focus on the target group and its needs
Additional information on the retail sector is provided in the Portfolio Report beginning on page 64.
Fashion36.0%
Entertainment & fitness 12.2%
Restaurant & cafe 4.0%
Electronics & telecommunications
5.8%
Health & beauty
5.0%
Supermarket & food14.2%
Sports 6.8%
Shoes 5.1%
Others 10.9%
27

carrying amountWith good demand and manageable investments at every location, STOP SHOP is the ideal brand for fast portfolio growth.
Our STOP SHOP portfolio is growing: In 2019 six fully rented retail parks were acquired in Slovenia and Poland. A newly developed location in the Serbian city of Sremska Mitrovica also opened.
standing investments
89
EUR 951.2 mn

Simply wonderful, shopping together.
98.8%occupancy rateOur STOP SHOPs are almost fully occupied. Tenants value our professional support as well as the steady focus on standardisation in construction, rental and operations.
29

Our brandsSTOP SHOP
STOP SHOP is our brand for retail parks in Central and Eastern Europe. These likeable and convenient local suppliers are located in catchment areas of 30,000 to 150,000 residents and offer a broad range of products with good value for money.
16Slovakia
approx. 112,000 sqm
9 locations in Poland with approx. 48,000 sqm of
rentable space
10 locations in the Czech Republic
with approx. 74,000 sqm of rentable space
13 locations in Austria
with approx. 60,000 sqm of rentable space
1 location in Romania with
approx. 6,000 sqm of rentable space
2 Croatia approx. 13,000 sqm
14 Slovenia approx. 95,000 sqm
14 locations in Hungary with approx. 136,000 sqm of
rentable space
10Serbia
approx. 93,000 sqm

OUR COMPANYOur brands – STOP SHOP
Branch mix STOP SHOPonly rented space
Close cooperation with well-known retail brands creates a win-win situation. With efficient transport connections and extensive parking, these retail parks concentrate on price-conscious “smart shoppers” who value easy accessibility.
Fashion31.8%
Furniture & household
10.6%
Pet supplies2.2%
Toys2.9%
Electronics & telecommunications
7.6%
Health & beauty
9.4%
Supermarket & food11.6%
Sports 7.5%
Shoes 8.8%
Others 7.6%
The success of the STOP SHOP brand is based on a standardised approach: – Approx. 8,000 to 15,000 sqm of rentable
space at each location– Good traffic connections, lots of parking– High functionality with an attractive tenant
mix of international and national retailers– High recognition value through architectonic
features like open design and common areas with a canopy construction
Additional information on the retail sector is provided in the Portfolio Report beginning on page 64.
637,000 sqmrentable space
31

IMMOFINANZ AGAnnual Report 2019
32
IMMOFINANZ on the Capital Market
The market environment and the IMMOFINANZ share The first four months of 2019 brought a sound upward trend for the stock markets which was seen, in many cases, as a reaction to the previous year’s price corrections. A phase of inconsistent shifts over several months was followed by a strong increase in key indexes during the fourth quarter. The market was weakened by a number of factors – such as global trade conflicts, reduced growth forecasts and political uncertainties – which left their mark on share prices but were overshadowed by central bank monetary measures. Supported by the US Federal Reserve’s trend reversal towards interest rate cuts and an even more expansive policy by the European Central Bank, most of the stock exchanges closed 2019 with clearly positive price developments.
The pan-European EURO STOXX 50 matched the strong growth recorded by the US indexes with an increase of 25.4% in 2019. Vienna’s leading ATX index rose by 16.1%, while the two real estate branch indexes, the EPRA Developed Europe (ex UK) and EPRA Emerging Europe, increased by 21.7% and 39.8%, respectively.
The IMMOFINANZ share started the 2019 financial year at EUR 20.90 and, on 11 October, reached the annual high of EUR 26.40, or EUR 26.30 based on the closing price (plus 26.3%, resp. 25.8% since the beginning of the year). The placement of the IMMOFINANZ shares held by CA Immo with institutional investors in November was followed by a decline in the share price to EUR 23.40 and a recovery to EUR 23.90 at year-end. That represents an increase of 14.4% over the full 12-month period. The outbreak of the Covid-19 virus and the related market distortions were responsible for a decline in the IMMOFINANZ share to EUR 16.52 as of the editorial deadline for this report (7 April 2020).
Development of the IMMOFINANZ share vs. selected indexes Indexed as of 1 January 2019
Jän
Jän
Jän
Jän
Jän
Jän
Feb
Feb
Feb
Feb
Mär
Mär
Mär
Mär
Mär
Mär
Apr
Apr
Apr
Apr
Apr
Mai
Mai
Mai
Mai
Mai
Jun
Jun
Jun
Jun
Jun
Jul
Jul
Jul
Jul
Jul
Aug
Aug
Aug
Aug
Aug
Sep
Sep
Sep
ATXIMMOFINANZ share
Immobilien ATX (IATX)EURO STOXX 600EPRA/NAREIT Emerging Europe Index
Jan. 2019 Feb. March Apr. May June July Aug. Sep. Oct. Nov. Dec.
EPRA/NAREIT Developed Europe ex UK Index
120%
110%
100%
90%
130%
140%
150%

OUR COMPANYIMMOFINANZ on the Capital Market
33
Performance comparison 1 January to 31 December 2019 in % IMMOFINANZ share 14.4%ATX 16.1%Immobilien ATX 37.5%EURO STOXX 600 23.2%EPRA/NAREIT Developed Europe (ex UK) 21.7%EPRA/NAREIT Emerging Europe 39.8%
Key data on the share
ISIN AT0000A21KS2Segment ATX, WIGReuters IMFI.VIBloomberg IIA:AVFinancial year 2019 1 January to 31 December
Information on the IMMOFINANZ share 31 Dec. 2019 31 Dec. 2018 Change in % Book value per share in EUR 29.34 26.29 11.6%EPRA net asset value per share1 in EUR 31.05 28.80 7.8%EPRA triple net asset value per share1 in EUR 30.63 28.44 7.7%EPRA earnings per share1 in EUR 1.79 1.55 15.6%FFO 1 per share before tax (incl. S IMMO/CA Immo)1 in EUR 1.29 0.96 34.4%Share price at end of period in EUR 23.90 20.90 14.4%Share price high based on the closing rate in EUR 26.30 23.28 13.0%Share price low based on the closing rate in EUR 21.08 18.79 12.2%Discount of share price to EPRA NAV diluted per share in % 23.0% 27.4% n. a.Total number of shares 112,085,269 112,085,269 0.0%
thereof treasury shares 11,208,526 4,942,001 ≥ +100.0%Market capitalisation at the end of the period in MEUR 2,678.8 2,342.6 14.4%Free float2 in % approx. 72% approx. 73% n. a. 1 See the calculation under Business development 2 Calculation method as defined by the Vienna Stock Exchange, Prime Market rules
Share capital and distribution policy The share capital of IMMOFINANZ AG remained unchanged at EUR 112.1 million as of 31 December 2019 and is divided into 112,085,269 bearer shares.
The IMMOFINANZ share is positioned as a dividend stock, and the Executive and Supervisory Boards are committed to achieving and maintaining a sustainable dividend policy. The goal is to distribute 75% of FFO 1 to shareholders. Share buybacks are also a possible component of our distribution policy.
Sustainable dividend policy The annual general meeting on 22 May 2019 approved a dividend of EUR 0.85 per share for the 2018 financial year (2017: EUR 0.70). It was classified as a repayment of capital under Austrian law (§ 4 (12) of the Austrian Income Tax Act) and was therefore not subject to withholding tax for natural persons who are resident in Austria and who hold IMMOFINANZ shares as part of their private assets. The ex-dividend date was 24 May, and the dividend was paid on 28 May 2019.
The Executive and Supervisory Boards plan to only issue a recommendation for the distribution of profit for the 2019 financial year when the half-year results for 2020 are announced. The effects of the Covid-19 crisis will be monitored continuously up to that time.
Share buyback programmes A total of 9,708,526 shares, representing 8.66% of the shares issued, were repurchased from 16 July 2018 to 13 August 2019, and the share buyback programme 2018/2019 was therefore terminated prematurely. In connection with these repurchases, the reportable threshold of 5% was exceeded on 21 January 2019. The shares were repurchased over the stock exchange at a weighted average price of EUR 22.54 per share.
Subject to certain exceptions, e.g. when the total capital repayment exceeds the tax base of the purchased shares.

IMMOFINANZ AGAnnual Report 2019
34
Including repurchases made during the first half of 2018, we now hold 11,208,526 treasury shares which were repurchased at a weighted average price of EUR 22.34 per share. This reflects the statutory upper limit of 10% of the total IMMOFINANZ shares. Information on the share buyback programmes is available under www.immofinanz.com/en/investor-relations/shares/share-buyback-programmes.
26th annual general meeting The 26th annual general meeting of IMMOFINANZ AG was held on 22 May 2019 at the Wiener Stadthalle in Vienna. Resolutions by the shareholders included, among others, the election of Bettina Breiteneder and Sven Bienert to the Supervisory Board. Their term of office ends with the annual general meeting which will vote on the release from liability for the 2023 financial year. The Supervisory Board comprised six shareholder representatives at the end of the 2019 financial year: Michael Knap (Chairman), Rudolf Fries (Vice-Chairman), Christian Böhm and Nick J. M. van Ommen as well as the two newly elected members Bettina Breiteneder and Sven Bienert. The related documents and voting results can be found under www.immofinanz.com/en/investor-relations/general-meeting.
The 27th annual general meeting was postponed to 1 October 2020 due to the Covid-19 crisis.
Change on the Supervisory Board On 4 March 2020, after the end of the 2019 financial year, Rudolf Fries announced his intention to resign from the Supervisory Board. Mr. Fries informed the company on 28 February 2020, as previously reported, that he had sold the shares attributable to him. Bettina Breiteneder succeeded Rudolf Fries as Vice-Chairwoman of the Supervisory Board.
Shareholder structure IMMOFINANZ shares are widely held: the largest shareholder groups are long-term institutional investors from Europe and the USA, private investors in Austria and fixed ownership investors. Free float (based on the definition issued by the Vienna Stock Exchange for the Prime Market segment) equalled roughly 72% as of 31 December 2019. Including the announcements from 28 February 2020 (see below), free float declined to roughly 67%.
Two shareholders from Austria held over 4% as of 31 December 2019:
Number of
voting rights
Percentage (basis: share capital as of 31 Dec. 2019)
Last reporting date
S IMMO AG (via CEE Immobilien GmbH)1 13,388,358 11.9% 27 March 2018FRIES Family Foundation (via IFF Beteiligungs GmbH) and Rudolf Fries2 6,352,179 5.7% 29 Jan. 2019 1 Includes shares and other financial instruments of IMMOFINANZ 2 The number of shares is based on the holdings of the FRIES Family Foundation (via IFF Beteiligungs GmbH) and Rudolf Fries, for which a notification (4% threshold;
IFF Beteiligungs GmbH) and directors‘ dealings reports were filed. In contrast to previous reports, this number does not include additional shares held by companies attributable to and members of the Fries family which are not subject to legal reporting requirements. On 28 February 2020, IFF Beteiligungs GmbH and Rudolf Fries announced that they had sold 6,097,680, respectively 254,500 IMMOFINANZ shares. The sale price indicated in the directors‘ dealings reports was EUR 29.50 per share.
A report on 13 February indicated that Erste Asset Management GmbH, respectively investment funds under its management, had reduced their share of voting rights in IMMOFINANZ from the previous level of 4.94% to 3.92%. CA Immobilien Anlagen AG announced on 8 November 2019 that its holding had fallen below the 4% reporting threshold and that it no longer held any IMMOFINANZ shares.

OUR COMPANYIMMOFINANZ on the Capital Market
35
Shareholder structure as of 28 February 2020:
Number of
voting rights
Percentage (basis: share capital as of 31 Dec. 2019)
Last reporting date
S IMMO AG (via CEE Immobilien GmbH)1 13,388,358 11.9% 27 March 2018CARPINUS Holding GmbH (in future RPPK Immo GmbH) 12,000,000 10.7% 28 Feb. 2020 1 Includes shares and other financial instruments of IMMOFINANZ
We were informed through announcements on 28 February and 3 March 2020 – i.e. after the end of the reporting year – that CARPINUS Holding GmbH (in the future, RPPK Immo GmbH) had purchased 12,000,000 IMMOFINANZ shares, which represent an investment of approximately 10.71%. The indirect shareholders of CARPINUS Holding GmbH are Peter Korbačka and RPR Privatstiftung (Ronny Pecik).
There are no other reports of shareholdings over or under the reporting thresholds.
Detailed analysis Regular shareholder surveys help us to define the regional focal points for investor relations activities. The latest survey was carried out in February 2020 and shows the following picture: 29.6% of IMMOFINANZ shares are held by private investors in Austria. Institutional investors hold 33.8% of the free float shares, whereby most come from the USA (10.3%), Austria (7.5%) and the United Kingdom (3.7%). Fixed shareholdings by investors represent 22.6%, while a further 10.0% are treasury shares, which are also attributed to fixed shareholdings based on the free float definition of the Vienna Stock Exchange. The remaining 1.1% are unidentified investors or shares held by foreign private investors. A 2.9% component is attributable to trading accounts.
Structure of private and institutional investors
Fixed holdings 32.6%thereof treasury shares 10.0%
Private Austria 29.6%
Others1.1%
Institutional investors 33.8%
USA 10.3%Austria 7.5%
UK 3.7%GER 3.1%
NO 3.0%NL 1.0%
CH 0.7%FR 0.6%
PL 0.1%Others incl. trading 6.7%
Source: IPREO by IHS Markit, February 2020
Tradingaccounts2.9%

IMMOFINANZ AGAnnual Report 2019
36
IMMOFINANZ bonds and investment grade rating On 21 January 2019, IMMOFINANZ placed a fixed interest, unsecured, non-subordinated benchmark bond (ISIN XS1935128956) with a nominal value of EUR 500.0 million. The bond has a four-year term, a fixed coupon of 2.625% and a denomination of EUR 100,000.0 per bond certificate. It is listed on the regulated market of the Luxemburg Stock Exchange and the third market (MTF) of the Vienna Stock Exchange.
IMMOFINANZ received a long-term issuer rating of BBB- with stable outlook and the benchmark bond an issue rating of "BBB-" from S&P Global Ratings on 22 January 2019. As the reasons for its rating decision, S&P Global Ratings listed, among others, IMMOFINANZ’s market position as one of the largest commercial property owners in the CEE region, the stable occupancy level and the stable development of demand in the company’s business environment. S&P Global Ratings confirmed its rating in connection with the annual review in February 2020.
The convertible bond 2017–2024 (ISIN XS1551932046) was still outstanding as of 31 December 2019 with a nominal value of EUR 297.2 million. The conversion price was adjusted to EUR 21.38 (previously: EUR 22.20) in the second quarter to reflect the dividend payment. Following the receipt of the investment grade rating, the coupon was reduced by 50 basis points to 1.5% per year beginning with the interest payment period which started on 24 January 2019 in accordance with the bond terms.
Analysts‘ recommendations The following nine firms publish regular evaluations on IMMOFINANZ: Baader Helvea, Deutsche Bank, Erste Group, HSBC, Kepler Cheuvreux, Raiffeisen Centrobank, Société Générale, Wood & Company and Wiener Privatbank. These evaluations are updated regularly and can be reviewed on the IMMOFINANZ website under www.immofinanz.com/en/investor-relations/our-share/analyses.
Investor relations activities Our goal is to communicate an accurate picture of the Group and thereby ensure an appropriate valuation of IMMOFINANZ’s securities. We therefore maintain a transparent, extensive and continuous dialogue with our analysts, shareholders, bondholders and potential investors. In 2019 we took part in roughly 30 investor conferences, roadshows and information events – among others in Amsterdam, Boston, Cape Town, Frankfurt, London, Madrid, Montreal, Munich, New York, Paris, Prague, Seoul, Tel Aviv, Vienna, Warsaw, Zurich and Zürs (Austria). Numerous personal meetings and telephone conferences were held with investors and analysts to communicate key facts and figures and discuss the positive development of IMMOFINANZ. Investors and analysts also took regular advantage of the opportunity to gain a first-hand view of the quality of our properties and brands through visits to our various core markets.
The continuous and timely distribution of information is supported by our company website and blog (www.immofinanz.com) as well as our corporate newsletter. As an additional service for investors and analysts, our investor relations app provides up-to-date information on the share price as well as financial reports, presentations and corporate news. Our financial reporting dates can also be transferred directly to a personal calendar with a simple click.

OUR COMPANYIMMOFINANZ on the Capital Market
37
Financial calendar 2020 27 May 20201 Announcement of results for the first quarter of 2020 28 May 2020 Interim financial statements on the first quarter of 2020 26 August 20201 Announcement of results for the first half of 2020 27 August 2020 Financial report on the first half of 2020 21 September 2020 Record date for participation in the 27th annual general meeting 1 October 2020 27th annual general meeting 5 October 2020 Expected ex-dividend date 6 October 2020 Expected date for the determination of dividend rights (record date) 7 October 2020 Expected dividend payment date 25 November 20201 Announcement of results for the first three quarters of 2020 26 November 2020 Interim financial statements on the first three quarters of 2020 1 Publication after close of trading at the Vienna Stock Exchange
Your IR contact We would be happy to answer your questions and provide additional information on IMMOFINANZ and its share.
Bettina Schragl Simone Korbelius T: +43 1 88090 2290 T: +43 1 88090 2291 [email protected] [email protected]
myhive am Wienerberg Vienna | AT | approx. 150,000 m2 rentable space

IMMOFINANZ AGAnnual Report 2019
38
Dear Shareholders, 2019 was a very successful year for IMMOFINANZ, a year in which the operating business and sustainable earning power were significantly strengthened. Very attractive acquisitions in the office and retail sector as well as the completion of development projects increased the portfolio to substantially more than EUR 5 billion. Milestones were also reached in the financing area: With the receipt of an investment grade rating and the issue of an unsecured EUR 500 million benchmark bond, we not only developed a further, important source of financing on the international capital market but also achieved a very solid credit profile.
In our function as the Supervisory Board, we accompanied IMMOFINANZ and its Executive Board on all activities and, as in previous years, conscientiously performed the duties required by law and the articles of association. The Executive Board provided the Supervisory Board with extensive, ongoing and timely information on the development of business and the company’s asset, financial and earnings position and, in this way, met its information requirements at all times and in appropriate depth.
The Supervisory Board and Executive Board discussed the company’s economic position as well as major events and measures in seven meetings during the 2019 financial year. The current members of the Supervisory Board attended roughly 86% of the meetings, whereby none of the members were absent from more than half of the meetings. Detailed statistics on the attendance of the individual members can be found in the Corporate Governance Report beginning on page 44. Outside the framework of these meetings, the Supervisory Board remained in regular contact with the Executive Board and took a number of decisions through circular resolutions. The cooperation between the Supervisory Board and the Executive Board was consistently characterised by open discussions and constructive teamwork.
The Supervisory Board dealt extensively with the company’s strategic orientation, the further optimisation of the portfolio through the acquisition and sale of properties, the company’s management by the Executive Board and the financing situation as well as developments on the real estate and capital markets and the situation in IMMOFINANZ’s core countries.
The following subjects formed the focal points of discussions:
– The issue of a corporate bond with a volume of EUR 500.0 million in connection with the initial receipt ofan investment grade rating from S&P Global Ratings
– The strengthening of our position as a leading provider of high-quality office property solutions in our coremarkets through the acquisition of the fully rented Warsaw Spire office high-rise in Warsaw and thePalmovka Open Park office property in Prague
– The further expansion of the STOP SHOP retail park brand through the acquisition of five fully rentedlocations in Slovenia
– An increase in the efficiency of the real estate portfolio through the sale of selected areas in the WarsawEMPARK and the sale of further, primarily smaller, office buildings in Warsaw
– Evaluation, discussion and approval of the budget for the 2020 financial year
Report of the Supervisory Board

CORPORATE GOVERNANCEReport of the Supervisory Board
39
Changes on the Supervisory Board Bettina Breiteneder and Sven Bienert were elected to the Supervisory Board by the 26th annual general meeting on 22 May 2019, whereby shareholders followed a proposal by the Supervisory Board. Both are well-known managers with many years of experience in real estate and financing as well as extensive knowledge of supervisory board responsibilities. The nomination of these two candidates was preceded by an extensive evaluation process which included, among others, candidates recommended by shareholders.
Horst Populorum and Wolfgang Schischek resigned from the Supervisory Board at their own request with the end of the 26th annual general meeting on 22 May 2019. We would like to thank them for their commitment and contribution to the successful repositioning of IMMOFINANZ.
On 4 March 2020, after the end of the reporting year, Rudolf Fries resigned from the Supervisory Board with immediate effect. We would like to thank Mr. Fries for his more than ten years of engagement and commitment to the IMMOFINANZ Supervisory Board. Bettina Breiteneder succeeded Rudolf Fries as Vice-Chairwoman of the Supervisory Board.
Focal points of the committees In order to support the efficient performance of its duties, the Supervisory Board has established three committees: the Audit and Valuation Committee, the Strategy Committee and the Personnel and Nominating Committee.
The new members were appointed to committees at the constituent meeting of the Supervisory Board in May 2019. Information on the responsibilities of the committees, their composition and the attendance of the individual members is provided in the Corporate Governance Report beginning on page 44.
The Audit and Valuation Committee met four times during the past year. The agendas for these meetings included the discussion and examination of the individual and consolidated financial statements for 2018 as well as the company’s accounting process. Another focal point was the public tender in accordance with Art. 16 of the Directive on the Attachment to the Audit Report (“AP-VO”) to select the auditor for the individual and consolidated financial statements from 2020 to 2022.
In four of its six meetings, the Personnel and Nominating Committee dealt with preparations for the election of new members to the Supervisory Board. Another issue involved the extension of the Executive Board contract with CEO Oliver Schumy.
The Strategy Committee is responsible, above all, for ongoing discussions of the company’s strategy and positioning as well as advising the Executive Board on these issues. These responsibilities were met by the full Supervisory Board in 2019.
The Supervisory Board also completed a routine annual evaluation of its working efficiency, in particular with regard to its organisation and working procedures.
Changes on the Executive Board In March 2020, after the end of the reporting year, Oliver Schumy resigned from the Executive Board for personal reasons and by mutual agreement. We would like to thank Mr. Schumy for his valuable and long-lasting contribution to the successful reorientation of IMMOFINANZ. Dietmar Reindl and Stefan Schönauer now form the Executive Board and are responsible for all issues.
Approval of the 2019 financial statements The following documents were prepared by the Executive Board and audited by Deloitte Audit Wirtschaftsprüfungs GmbH, which was appointed as the auditor by the annual general meeting on 22 May 2019: the individual financial statements of IMMOFINANZ AG as of 31 December 2019 including the management report and the consolidated financial statements together with the group management report. All of these documents were awarded an unqualified opinion (pages 212–216).
The individual financial statements and consolidated financial statements as well as the related auditor’s reports were made available to all Supervisory Board members immediately after completion. These
CO
RP
OR
AT
E G
OV
ER
NA
NC
E

IMMOFINANZ AGAnnual Report 2019
40
documents were discussed by the Audit and Valuation Committee in detail in the presence of the auditor and the Executive Board and reviewed in accordance with § 96 of the Austrian Stock Corporation Act. Following this examination and discussion, the members of the Audit and Valuation Committee unanimously agreed to recommend the unqualified acceptance of these documents to the Supervisory Board. The Supervisory Board accepted the individual financial statements as of 31 December 2019, which are considered approved in accordance with § 96 (4) of the Austrian Stock Corporation Act. The consolidated financial statements as of 31 December 2019 were also accepted by the Supervisory Board. In accordance with L-Rule 60 of the Austrian Corporate Governance Code, the Supervisory Board reviewed and approved the expanded Corporate Governance Report which now also includes the consolidated Corporate Governance Report and the non-financial statement.
The IMMOFINANZ share is positioned as a sustainable dividend stock, and the goal is to distribute 75% of FFO 1 to shareholders. The annual general meeting was postponed to 1 October 2020 due to the Covid-19 crisis. The Executive and Supervisory Boards will announce a recommendation for the distribution of profit for the 2019 financial year when results for the first half of 2020 are published. The effects of the Covid-19 crisis on business operations will be monitored continuously up to that time.
Based on a recommendation by the Audit and Valuation Committee, the Supervisory Board approved a proposal to the annual general meeting for the 2019 financial year which calls for the appointment of Deloitte Audit Wirtschaftsprüfungs GmbH, Vienna, as the auditor for the 2020 financial year. This proposal follows a tender carried out in accordance with the applicable directive (“Art. 16 AP-VO”).
On behalf of the Supervisory Board, I would like to thank the members of the Executive Board and all IMMOFINANZ employees for their outstanding performance and strong commitment and also express our gratitude to shareholders for their confidence.
Our company has a conservative capital and financing structure and is well prepared to react quickly and flexibly to future challenges.
Vienna, 21 April 2020
Michael Knap Chairman

CORPORATE GOVERNANCECommitment to the Austrian Corporate Governance Code
41
CO
RP
OR
AT
E G
OV
ER
NA
NC
E
Corporate Governance Report expanded to include the Consolidated Corporate Governance Report
Commitment to the Austrian Corporate Governance Code IMMOFINANZ pursues responsible business activities that are designed to create and maintain sustainable, long-term value. In line with this orientation, the company strives to achieve a high degree of transparency for all stakeholders. The Austrian Corporate Governance Code* provides Austrian stock companies with a framework for corporate management and monitoring. The Executive Board and Supervisory Board of IMMOFINANZ AG are committed to compliance with the code, in the currently applicable version, and to the related transparency and principles of good management. IMMOFINANZ complied with all provisions of the code during the 2019 financial year.
Corporate Bodies and Remuneration The Executive Board
Oliver Schumy, Chief Executive Officer – Member of the Executive Board
from 1 3 2015 to 18 3 2020** – Born in 1971
Oliver Schumy was appointed to the Executive Board of IMMOFINANZ on 1 March 2015 and served as Chief Executive Officer beginning on 1 May 2015. In this function he was responsible for project development, transactions, legal affairs and human resources as well as corporate communications and investor relations. Mr. Schumy also served as a managing director of IMBEA IMMOEAST Beteiligungsverwaltung GmbH (IMBEA), a material IMMOFINANZ subsidiary.
Stefan Schönauer, Member of the Executive Board – Member of the Executive Board
since 11 3 2016 – Appointed up to 30 4 2021– Born in 1979
Stefan Schönauer has worked with IMMOFINANZ in leading positions since the end of 2008 and was appointed Chief Financial Officer on 11 March 2016. He is responsible for accounting, controlling, consolidation, taxes, financing, cash management, IT, procurement, risk management and internal audit. Mr. Schönauer also serves as a managing director of the material IMMOFINANZ subsidiary IMBEA.
Dietmar Reindl, Member of the Executive Board – Member of the Executive Board
since 1 5 2014 – Appointed up to 30 4 2021– Born in 1969
Dietmar Reindl has been with IMMOFINANZ in leading functions since 2012 and was appointed to the Executive Board in May 2014. He is responsible for the management of all commercial properties, for marketing and for project development (since mid-December 2019). Mr. Reindl also serves as a managing director of the material IMMOFINANZ subsidiary IMBEA.
The current version of the code (January 2020) is available on the website of IMMOFINANZ AG (www.immofinanz.com) and on the website of the Austrian Working Group for Corporate Governance (www.corporate-governance.at).
** Oliver Schumy resigned from the Executive Board of IMMOFINANZ AG by mutual agreement on 18 March 2020, i.e. after the end of the reporting year. The early termination of his contract was made by mutual agreement for personal reasons and effective immediately. His responsibilities were taken over as of 19 March 2020 by Stefan Schönauer (legal, investor relations, compliance & corporate legal) and Dietmar Reindl (human resources, public relations and transactions).
Corporate Governance Report

IMMOFINANZ AGAnnual Report 2019
42
The Supervisory Board
Michael Knap, Chairman of the Supervisory Board – First appointment in 2008 – Term ends in20202 – Born in 1944
Experience: Extensive experience in the areas of capital markets, corporate governance, financial analysis and investor representation; many years of management experience in the banking and insurance sector. Other functions: Vice-president of IVA Interessenverband für Anleger, Vienna
Rudolf Fries, Vice-Chairman of the Supervisory Board up to 4 March 20201 – First appointment in 2008 – Term ends in 2020 – Born in 1958
Experience: Extensive experience in the areas of corporate and company law as well as real estate. Other functions: Chairman of the supervisory board of EAG-Beteiligungs Aktiengesellschaft, Baden Attorney, partner in Eckert Fries Carter Rechtsanwälte GmbH, Baden
Christian Böhm, Member of the Supervisory Board – First appointment in 2010 – Term ends in 20202 – Born in 1958
Experience: Many years of management experience in the financial and insurance sector (pension funds). Other functions: Chairman of the management board of APK Pensionskasse AG, Vienna Chairman of the supervisory board of APK Versicherung AG, Vienna Member of the supervisory board of APK Vorsorgekasse AG, Vienna
Nick J. M. van Ommen, FRICS Member of the Supervisory Board – First appointment in 2008 – Term ends in 20202 – Born in 1946
Experience: Many years of management and supervisory board experience in the banking sector and in real estate companies; served as CEO of EPRA from 2000 to 2008. Functions in listed companies: Member of the supervisory boards of: W.P. Carey Inc., USA Brack Capital Properties N.V., Israel Other functions: Member of the supervisory boards of: Allianz Nederland Group N.V., Netherlands Allianz Benelux SA, Belgium
Bettina Breiteneder, Member of the Supervisory Board since 22 May 20193 – First appointment in 2019 – Term ends in 20234 – Born in 1970
Experience: Many years of management experience in real estate, CEO, supervisory board functions, finance, accounting, audits, corporate governance, capital markets, human resources and insurance Other functions: Member of the supervisory boards of: Die Erste österreichische Sparkasse Privatstiftung Generali Versicherung AG (chairwoman of the audit committee) Member of the directorate of the Wiener Konzerthaus
Sven Bienert, Member of the Supervisory Board since 22 May 2019 – First appointment in 2019 – Term ends in 20234 – Born in 1973
Experience: Extensive expertise in the areas of real estate, CEO, supervisory board functions, finance, accounting, audits, corporate governance and human resources Other functions: Member of the supervisory board of ZIMA Holding AG Member of the advisory board of MPC Real Estate Holding GmbH Member of the sustainability advisory board of DAW – Deutsche Amphibolin-Werke von Robert Murjahn Stiftung & Co KG

CORPORATE GOVERNANCECorporate Bodies and Remuneration
43
CO
RP
OR
AT
E G
OV
ER
NA
NC
E
Gov-Board
1 Rudolf Fries, Vice-Chairman of the Supervisory Board, resigned from this corporate body as of 4 March 2020. As reported, Mr. Fries informed the company on 28 February 2020 that he had sold the shares attributable to him. Bettina Breiteneder succeeded Rudolf Fries as Vice-Chairwoman of the Supervisory Board with immediate effect.
2 End of term: at the end of the annual general meeting which votes on the release from liability for the 2020 financial year (28th AGM in 2021) 3 Bettina Breiteneder succeeded Rudolf Fries as Vice-Chairwoman of the Supervisory Board effective as of 4 March 2020. 4 End of term: at the end of the annual general meeting which votes on the release from liability for the 2023 financial year (31st AGM in 2024) 5 End of term: at the end of the annual general meeting which voted on the release from liability for the 2018 financial year (26th AGM in 2019)
Term ends in 2019
Horst Populorum, Member of the Supervisory Board up to 22 May 20195 – First appointment in 2015 – Born in 1973
Experience: Extensive management experience in the food products and retail sectors Other functions: Held no other supervisory board positions
Wolfgang Schischek, Member of the Supervisory Board up to 22 May 20195 – First appointment in 2015 – Born in 1944
Experience: Many years of management and supervisory board experience in the industrial sector Other functions: Vice-chairman of the supervisory board of KBA-MÖDLING GmbH, Mödling; Member of the supervisory board of Kostwein Holding GmbH, Klagenfurt
Werner Ertelthalner, Member of the Supervisory Board up to 26 March 2019 – First appointment in 2016 – Born in 1987
Experience: Currently serves as a system expert in the IMMOFINANZ consolidation department Delegated by the IMMOFINANZ Works’ Council
Larissa Kravitz (formerly Lielacher), Member of the Supervisory Board up 15 July 2019 – First appointment in 2017 – Born in 1985
Experience: Currently serves as a risk manager at IMMOFINANZ Delegated by the IMMOFINANZ Works’ Council
Ankica Reichenbach, Member of the Supervisory Board from August to December 2019 – First appointment in 2019 – Born in 1977
Experience: Currently works in the consolidation area at IMMOFINANZ Delegated by the IMMOFINANZ Works’ Council
Philipp Obermair, Member of the Supervisory Board – First appointment in 2014 – Born in 1979
Experience: Currently serves as a risk and research manager and previously as a senior controller at IMMOFINANZ Delegated by the IMMOFINANZ Works’ Council
Maria Onitcanscaia, Member of the Supervisory Board since 26 March 2019 – First appointment in 2019 – Born in 1981
Experience: Currently serves as a group asset manager in the retail business at IMMOFINANZ Delegated by the IMMOFINANZ Works’ Council

IMMOFINANZ AGAnnual Report 2019
44
The terms of office of the members delegated to the Supervisory Board by the Works’ Council are unlimited.
Supervisory Board Committees and attendance
Members of the Supervisory Board Committees Audit and Valuation Committee Strategy Committee Personnel and Nominating Committee Betttina Breiteneder, Chairwoman (since May 2019)
Michael Knap, Chairman Michael Knap, Chairman
Michael Knap, Chairman (until May 2019), Vice-Chairman (since May 2019)
Nick J. M. van Ommen, FRICS, Vice-Chairman
Rudolf Fries, Vice-Chairman (until March 2020)
Rudolf Fries, Vice-Chairman (until May 2019), member (from May 2019 until March 2020)
Wolfgang Schischek (until May 2019) Horst Populorum (until May 2019)
Christian Böhm, financial expert Christian Böhm Bettina Breiteneder (since May 2019, since March 2020 Vice-Chairwoman)
Sven Bienert (since May 2019) Bettina Breiteneder (since May 2019) Sven Bienert (since March 2020) Philipp Obermair Sven Bienert (since May 2019) Werner Ertelthalner (until March 2019) Philipp Obermair Maria Onitcanscaia (since March 2019) Maria Onitcanscaia (since March 2019) Werner Ertelthalner (until March 2019) Larissa Kravitz (until July 2019) Ankica Reichenbach (until Dec. 2019)
The Supervisory Board monitors the Executive Board and provides support for the management of the company, particularly on decisions of fundamental importance. In addition to its primary function as a monitoring and support body, the Supervisory Board constantly strives to further improve the efficiency of its work through self-evaluation. The Supervisory Board had six members who were elected by the annual general meeting and two members delegated by the Works’ Council in 2019. Seven Supervisory Board meetings were held during the 2019 financial year. These meetings were attended by roughly 86% of the elected members, respectively nearly 87% including the meetings of the individual committees.
Attendance
Member Member sinceMeetings (Plenum) in %
Audit and Valuation
Committee in %
Personnel and Nominating Committee in %
Totalpresence
Totalpresence in %
Meetings/year 7 4 6 17 Michael Knap, Chairman 2008 7/7 100% 4/4 100% 6/6 100% 17 100%Rudolf Fries, Vice-Chairman 2008 5/7 71% 3/4 75% 5/6 83% 13 76%Christian Böhm 2010 7/7 100% 4/4 100% 11 100%Nick J. M. van Ommen 2008 5/7 71% 5 71%Wolfgang Schischek until May 2019 3/3 100% 3 100%Horst Populorum until May 2019 3/3 100% 4/4 100% 7 100%Bettina Breiteneder since May 2019 2/4 50% 1/2 50% 1/2 50% 4 50%Sven Bienert since May 2019 4/4 100% 2/2 100% 6 100%Average meeting attendance 36/42 86% 14/16 88% 16/18 89% 66/76 87%
1 Ms. Breiteneder was unable to attend one plenum meeting and one meeting of the Personnel and Nominating Committee (which were held on the same day) due to an accident.
Audit and Valuation Committee The Audit and Valuation Committee is responsible for monitoring accounting processes and supervising the audit of the separate and consolidated financial statements. This committee also monitors the effectiveness of the company’s internal control system, risk management and internal audit as well as property valuation. Bettina Breiteneder took over the chair of this committee immediately following her election to the Supervisory Board on 22 May 2019; she succeeds Michael Knap, who is now vice-chairman. The previous vice-chairman Rudolf Fries remained a member of the Audit and Valuation Committee. Christian Böhm serves as the Audit and Valuation Committee’s financial expert based on his professional experience and knowledge of finance and accounting. The committee members, as a whole, are well informed of the real estate sector. The

CORPORATE GOVERNANCECorporate Bodies and Remuneration
45
CO
RP
OR
AT
E G
OV
ER
NA
NC
E
Audit and Valuation Committee held four meetings in 2019, whereby 88% of the shareholder representatives were in attendance.
Strategy Committee The Strategy Committee is responsible, above all, for the regular evaluation of the company's strategy and orientation as well as consultations with the Executive Board on the definition of this strategy. These responsibilities were fulfilled by the full Supervisory Board in 2019.
Personnel and Nominating Committee The Personnel and Nominating Committee makes recommendations to the Supervisory Board for nominations to the Executive and Supervisory Boards and is responsible for determining the remuneration and preparing the employment contracts for the Executive Board members. In its capacity as a remuneration committee, the Personnel and Nominating Committee has at least one member with knowledge and experience in the area of remuneration policy. This committee met six times in 2019, whereby 89% of the shareholder representatives attended these meetings.
Appointments to the Supervisory Board In order to support the optimal succession for its members, the Supervisory Board developed a selection process based on a qualification matrix. The following graph provides an overview of this process:
The Personnel and Nominating Committee dealt extensively with issues involving appointments to the Supervisory Board. Based on IMMOFINANZ’s strategic positioning as a leading provider of commercial property solutions in its core markets and the goal to generate further value-creating growth through acquisitions and internal project development, the criteria and areas which require experience for the successful work and goal attainment of the Supervisory Board were evaluated. The expertise of the Supervisory Board members (shareholder representatives) was evaluated and aggregated in a qualification matrix.
Gov-Select

IMMOFINANZ AGAnnual Report 2019
46
Supervisory Board qualification matrix
Expertise in Michael Knap Rudolf FriesChristian
Böhm
Nick J. M. van Ommen,
FRICS
Bettina Breiteneder,
MRICS
Sven Bienert, SV MRICS
REV Real Estate
CEO/Executive Board/ Management
Supervisory Board Agendas
Finance
Compliance/Legal
Accounting/Audits
M&A/Investment Management
Corporate Governance
Capital Market
Human Resources
Insurance
Marketing
Austrian Market
CEE Markets = General experience in this area = Responsibility and/or working experience in this area
Executive Board remuneration The contracts with the members of the IMMOFINANZ Executive Board include fixed and variable remuneration components. The performance-based remuneration is linked, in particular, to sustainable, long-term and multi-year criteria and includes both qualitative and quantitative goals – for example, the fulfilment of budget targets, cash flow, annual results, implementation of a digitalisation concept, sale of non-strategic properties, optimisation of property financing, attainment of a specific rating level (target: investment grade) and occupancy rate. The variable component of the Executive Board remuneration is dependent on the target attainment in the respective financial year and is limited to 100% of the fixed remuneration. The target attainment for Executive Board members Reindl and Schönauer in 2019 equals 100% based on a resolution by the Personnel and Nominating Committee on 21 April 2020.
The members of the Executive Board do not receive any remuneration from the subsidiaries for management functions in these companies.
All Executive Board contracts include change of control clauses, which regulate the entitlements of the Executive Board members if their contracts are terminated prematurely due to a change in the control over the company. The entitlements of the individual Executive Board members from their respective contracts are limited to a maximum of two years, depending on the remaining contract term. The Executive Board contracts also include so-called “clawback” clauses, which give IMMOFINANZ the right to claim repayment of the variable remuneration if a member of the Executive Board is guilty of a criminal act or failure to act as confirmed by a binding legal judgment.
IMMOFINANZ has not granted any loans to the members of the Executive Board.

CORPORATE GOVERNANCECorporate Bodies and Remuneration
47
CO
RP
OR
AT
E G
OV
ER
NA
NC
E
Executive Board remuneration for the 2019 financial year
in EUR Oliver Schumy Dietmar Reindl Stefan Schönauer Total Fixed remuneration, gross 824,000 500,000 400,000 1,724,000Compensation in kind 174 11,694 11,694 23,563Total fixed remuneration 824,174 511,694 411,694 1,747,563Fixed remuneration as a % of total remuneration 47.9% 47.9% 48.2% 48.0%Total variable remuneration 790,476 490,476 390,476 1,671,429Variable remuneration as a % of total remuneration 46.0% 45.9% 45.7% 45.9%Contributions to pension fund1 80,000 50,000 40,000 170,000Contributions to employee benefit fund 24,704 15,333 12,273 52,311Total fund contributions 104,704 65,333 52,273 222,311Total remuneration 1,719,355 1,067,504 854,444 3,641,302 1 Defined contribution commitments
Directors’ and officers’ insurance (D&O insurance) with coverage of EUR 100 million was concluded for the corporate bodies of IMMOFINANZ. The related costs are carried by the company.
Supervisory Board remuneration The remuneration of the Supervisory Board for the current financial year is approved by the annual general meeting in the following year and paid out after this approval is received. A recommendation will be made to the next annual general meeting calling for remuneration of EUR 270,064.0 for the Supervisory Board for the 2019 financial year.
Each member receives fixed remuneration of EUR 25,125.3, whereby the chairman and vice-chairman of the Supervisory Board receive twice and one and a half times this amount, respectively. An additional payment of EUR 5,000.0 is made for services performed on a committee; the chairman and vice-chairman of a committee receive twice and one and a half times this amount, respectively. Bettina Breiteneder, Sven Bienert, Horst Populorum and Wolfgang Schischek will receive proportional remuneration for the 2019 financial year.
Recommended remuneration for 2019
in EUR Michael Knap Rudolf Fries Christian
Böhm
Nick J. M.van Ommen,
FRICSHorst
PopulorumWolfgang Schischek
Bettina Breiteneder Sven Bienert
Total 78,730 51,167 35,125 32,625 11,799 11,799 27,451 21,368

IMMOFINANZ AGAnnual Report 2019
48
Shareholdings of the Executive Board and Supervisory Board members as of 31 December 2019 Members of the IMMOFINANZ corporate bodies and closely related persons are required to report their transactions in financial instruments issued by the company. These reports (Directors' Dealings) are published on the IMMOFINANZ website. Following is an overview of the direct and indirect shareholdings of these members as reported to the company:
Member Number of IMMOFINANZ shares Oliver Schumy 36,200Dietmar Reindl 2,515Stefan Schönauer 5,000Michael Knap (and related persons) 156FRIES Family Foundation (through IFF Beteiligungs GmbH) and Rudolf Fries1 6,352,179Christian Böhm 1,000Nick J. M. van Ommen, FRICS 15,000Bettina Breiteneder 8,020Horst Populorum (and related persons) until 22 May 2019 7,148Wolfgang Schischek until 22 May 2019 22,080Philipp Obermair 50 1 The number of shares is based on the holdings of the FRIES Family Foundation (via IFF Beteiligungs GmbH) and Rudolf Fries, for which directors‘ dealings reports
were filed. In contrast to previous reports, this number does not include additional shares held by companies attributable to and members of the Fries family which are not subject to legal reporting requirements. On 28 February 2020, IFF Beteiligungs GmbH and Rudolf Fries announced that they had sold 6,097,680, respectively 254,500 IMMOFINANZ shares. The sale price indicated in the directors‘ dealings reports was EUR 29.50 per share.
Working procedures of the Executive Board and Supervisory Board The cooperation between the Executive Board and Supervisory Board of IMMOFINANZ is based on open and constructive discussions. The Executive Board provides the Supervisory Board with regular, timely and comprehensive information on the development of business and related issues and also prepares the documentation for the Supervisory Board’s meetings and resolutions. The rules of procedure for the Executive Board define the transactions and measures that require Supervisory Board approval. In addition, the Executive Board provides the Supervisory Board with information on issues of major importance outside the framework of scheduled meetings.
Independence and avoidance of conflicts of interest The members of the Executive Board are required to take their decisions independent of any personal interests and the interests of controlling shareholders. Moreover, these decisions must be based on well-founded knowledge and comply with all relevant legal regulations. Persons serving on the Executive Board must disclose any personal interests in the company’s transactions or other conflicts of interest to the Supervisory Board without delay and also inform their board colleagues. The Executive Board members may only accept appointments to a supervisory board with the consent of the IMMOFINANZ Supervisory Board. Key company employees must also have the approval of the Executive Board and Supervisory Board before they may accept a position on the corporate body of a non-Group company. A legal restraint on competition is also in place.
The members of the Supervisory Board are required to represent the interests of the company and must disclose any conflicts of interest without delay. They may not accept positions on the corporate bodies of any companies that compete with IMMOFINANZ.
Christian Böhm a member of the Supervisory Board, is the chairman of the management board of APK Pensionskasse AG. IMMOFINANZ makes pension fund contributions at ordinary market conditions to this firm for the company pensions of the Executive Board members. The contributions made in 2019 totalled EUR 170,000.0.
Apart from the above business relationship, there are no contracts between the members of the Supervisory Board or companies in which a member of the Supervisory Board holds a significant financial interest, on the one hand, and IMMOFINANZ or one of its subsidiaries, on the other hand.

CORPORATE GOVERNANCECorporate Bodies and Remuneration
49
CO
RP
OR
AT
E G
OV
ER
NA
NC
E
Criteria for the independence of the Supervisory Board The Austrian Corporate Governance Code (C-Rule 53) requires the majority of the supervisory board members elected by the annual general meeting to be independent of the company and its management board. A supervisory board member is considered to be independent when he or she has no business or personal relations with the company or its management board that constitute a material conflict of interest and are therefore capable of influencing the member’s behaviour.
The following independence criteria were defined by the IMMOFINANZ Supervisory Board and reflect the standards listed in Annex 1 to the Corporate Governance Code. All elected Supervisory Board members are independent based on these criteria. No member represents a shareholder with an investment of more than 10% or the interests of such a shareholder.
– The Supervisory Board member did not serve as a member of the Executive Board or a key employee of IMMOFINANZ or one of its subsidiaries during the past five years.
– The Supervisory Board member does not currently, or did not in the past year, maintain any business relations with IMMOFINANZ or one of its subsidiaries of a scope considered significant for the Supervisory Board member. The same applies to business relationships with companies in which the Supervisory Board member holds a considerable economic interest, but not for exercising functions on IMMOFINANZ’s corporate bodies. The approval of individual transactions by the Supervisory Board pursuant to L-Rule 48 does not automatically qualify the member as not independent.
– The Supervisory Board member did not act as an auditor of IMMOFINANZ or own an investment in the auditing company or work for the auditing company during the past three years.
– The Supervisory Board member is not a member of the management board of another company in which a member of the Executive Board of IMMOFINANZ serves on the supervisory board.
– The Supervisory Board member has not served on the Supervisory Board of IMMOFINANZ for more than 15 years. This does not apply to members who are shareholders with a direct investment in IMMOFINANZ or who represent the interests of such a shareholder.
– The Supervisory Board member is not closely related (direct offspring, spouse, life partner, parent, uncle, aunt, sibling, niece, nephew) to a member of the Executive Board or to persons specified in one of the above points.
Gov-Col
Support for women on the Executive Board and Supervisory Board and in key functions In the interest of the company, appointments to the Executive Board, Supervisory Board and key positions are based solely on professional and personal qualifications.
Women filled 34.0% of the management positions in 2019 (2018: 36.2%) and represented 59.0% of the total workforce (2018: 59.0%). In the IMMOFINANZ Group, women hold key management positions in central corporate functions and on the local country boards.
Men and women have equal opportunities for advancement at IMMOFINANZ, and all employees receive performance-based remuneration for their work.
Diversity concept IMMOFINANZ does not follow an abstractly defined diversity concept for appointments to the Executive Board or Supervisory Board. The Supervisory Board, which is responsible for appointments to the Executive Board and for issuing recommendations to the annual general meeting for elections to the Supervisory Board, considers the diversity aspects listed in § 243c (2) no. 2a of the Austrian Commercial Code (age, gender, education and professional experience) and the international aspects for supervisory board members which are discussed in L-Rule 52 of the Austrian Corporate Governance Code to be very important. Accordingly, these aspects are acknowledged and reflected in connection with specific appointment decisions or recommendations.

IMMOFINANZ AGAnnual Report 2019
50
However, the company does not consider it suitable or expedient to tie its decisions on recommendations or appointments to a diversity concept with abstractly defined goals. The Supervisory Board believes the decisive factors for recommended elections to the Supervisory Board and appointments to the Executive Board must involve aspects like expertise, specific requirements, experience, availability etc.
External evaluation IMMOFINANZ’s compliance with the provisions of the Austrian Corporate Governance Code was evaluated by the auditor, Deloitte Audit Wirtschaftsprüfung GmbH, in connection with a review of the Corporate Governance Report. The related auditor’s report is available for review on our website (www.immofinanz.com). The evaluation of the Corporate Governance Report for 2019 did not result in any objections.
Vienna, 21 April 2020
The Executive Board
Stefan Schönauer CFO
Dietmar Reindl COO

GROUP MANAGEMENT REPORTEconomic Overview and Property Markets
51
GR
OU
P M
AN
AG
EM
EN
T R
EP
OR
T
Economic Overview and Property Markets The following section presents a selection of key economic indicators on the IMMOFINANZ core markets. Included here are statistics on GDP growth, the inflation rate and the unemployment rate based on the autumn forecast published by the European Commission in November 2019 and on current Eurostat and/or OECD data. This information is followed by a summary of developments in the individual real estate market segments where IMMOFINANZ is active, which was drawn from market reports prepared by BNP Paribas, CBRE, JLL, Savills and EHL (data as of the end of Q3 or Q4 2019).
All forecasts reflect the period before the outbreak of the coronavirus in Italy and in the IMMOFINANZ core markets and do not include any possible related negative effects on future economic growth. The OECD substantially reduced its growth forecast in March 2020 and described the coronavirus as “the biggest danger for the global economy since the financial crisis“. Even under the best-case scenario of a less virulent spread of the virus outside China, global growth will presumably fall significantly during the first half-year because of interrupted supply chains, a drop in tourism and the deterioration of the business climate. The worldwide economy is now expected to decline from the already weak level of 2.9% in 2019 to 2.4% in 2020 but could recover with a modest increase of 3.3% in 2021. A broader surge of infections in the Asia-Pacific region and in industrial countries like China could, however, reduce global growth to 1.5% – which represents only half the increase projected for 2020 in the OECD’s November 2019 update. The OECD indicates that measures to contain the virus and the general loss of confidence would have such a strong impact on production and consumption that some countries, including Japan and the eurozone states, could slip into a recession.
Significant declines in economic growth and open-ended travel restrictions could also have a negative effect on the real estate transaction market, for example through reduced activity by Asian investors in the eurozone. A cutback in corporate expansion plans could also have an adverse impact on the office property market. In the retail sector, continuing fears of infection with the virus and the avoidance of public areas could lead to a decline in visitor traffic and, in turn, to lower revenues for retailers.
In view of these current developments, the economic summary does not include any projections or information on the economic outlook.
Austria The Austrian economy lost substantial momentum during the past year and, with an increase of 1.5%, reflected the eurozone average (2018: 2.7%). Positive impulses were provided, in particular, by private consumption, which was driven by growth in real incomes, rising employment and tax benefits provided by the “family bonus plus“. The inflation rate declined to 1.5% (2018: 1.7%), in part due to lower energy prices. Unemployment fell to 4.5% in 2019 (2018: 4.7%).
Group Management Report

IMMOFINANZ AGAnnual Report 2019
52
The transaction volume on the commercial property market in Austria rose by 17% to a record EUR 5.9 billion in 2019 (2018: EUR 4.1 billion). Office properties were again the most popular asset class, followed by residential and retail properties. Despite the limited supply on the office investment market, Austrian properties remain very popular with investors. The prime yield in the office sector fell substantially to 3.45% as a result of the strong investment pressure combined with the short supply.
Germany The German economy grew by only 1.0% in 2019 (2018: 1.7%), whereby a decline during the first six months was followed by slight recovery in second half-year. Uncertainties in the export sector and weaker global growth continued to have a negative impact, while positive factors included ongoing strong consumption by private households and sound employment situation. Inflation declined to 1.4% (2018: 1.7%) as the result of lower energy prices. The unemployment rate last equalled 3.2% (2018: 3.3%).
The commercial property market in Germany completed another record year in 2019, with the transaction volume rising by roughly 19% to EUR 73.4 billion (2018: EUR 61.5 billion). Office properties amounted to 53%, or EUR 38.7 billion, of this volume. Portfolio transactions quadrupled over the previous year to EUR 9.2 billion in 2019. On the buyers‘ side, 26.6% of the transactions were made by special funds and 9% by real estate companies. Strong demand combined with the limited range of alternatives led to a further decline in the prime yields for office properties. Berlin and Munich recorded new lows at 2.6%, and the prime yield in Düsseldorf dropped to 3.0%. The transaction volume in Düsseldorf was nearly 6% higher than the record prior year at EUR 4.1 billion in 2019.
OFFICE The production of new space on the Vienna officemarket fell substantially to 42,000 sqm in 2019(2018: 260,000 sqm). Take-up was only slightly lowerthan the previous year at 221,000 sqm (2018:230,000 sqm). This had a positive effect on thevacancy rate which fell to roughly 4.7%. Viennacurrently has nearly 11.1 million sqm of modernoffice space. Prime rents declined slightly toEUR 25.0/sqm/month.
RETAIL Retail completions totalled only 50,000 sqm in 2019. New construction is focused on retail parks, which outpaced the completion of shopping center space in 2020. Rental prices in retail parks were stable at EUR 8.0 to EUR 12.0/sqm/month in Vienna and slightly lower in the Austrian provinces. The prime yield for retail parks remained constant at 5.0%.
OFFICETake-up on the Düsseldorf office market rose by 29%year-on-year to a record 514,500 sqm in 2019. Roughly 101,500 sqm were completed. The total supply of officespace grew to 9.5 million sqm, and the vacancy rate fell to6.6%. Prime yields dropped 15 basis points to 3.15%. Atotal of 375,000 sqm are currently under constructionand should enter the market by the end of 2022. Prime rents increased slightly to EUR 28.5/sqm/month, and the average rent in the metropolitan region rose by 10% to roughly EUR 16.7/sqm/month.

GROUP MANAGEMENT REPORTEconomic Overview and Property Markets
53
GR
OU
P M
AN
AG
EM
EN
T R
EP
OR
T
Poland The Polish economy continued its strong growth with a plus of 4.1% in 2019 (2018: 4.8%). This sound development was supported, above all, by continuing high consumer demand and favourable conditions on the labour market. The inflation rate rose to 2.1% in 2019 (2018: 0.9%) owing to higher food prices and service costs, and the unemployment rate equalled 3.4%.
The commercial property investment market set a record for the third year in succession, with a year-on-year increase of 8% in transactions to approximately EUR 7.8 billion. Office properties were responsible for 49% of this volume, followed by retail properties with 25%. The acquisition of the Warsaw Spire by IMMOFINANZ was the largest office transaction on the Polish market in 2019. Investments by Asian property investors set a new record at EUR 1.7 billion, but an increasing number of transactions were closed by buyers from South Africa and the Middle East. Yields continued to decline due to the strong demand and equalled 4.5% for office properties. The prime yields for retail properties in secondary cities equalled roughly 5.0%.
Romania Economic growth in Romania remained on a downward trend, slowing to 3.0% in 2019 (2018: 3.6%). Private consumption again served as the most important driver and was strengthened by higher pensions and an increase in public sector salaries. At the same time, economic output slowed and proved to be a subduing factor. The inflation rate equalled 3.9% in 2019 (2018: 3.0%), and unemployment was stable at 3.8% as expected.
The commercial property market broke the billion euro-barrier and topped the previous year by 7% with a transaction volume of EUR 1.06 billion in 2019. Office properties comprised most of the transactions at 74%, followed by retail properties at 16%. Prime yields equalled 6.5% for shopping centers and declined slightly to 7% for office properties.
RETAIL
The sound economic environment was responsible for an increase of 280,000 sqm in retail space during 2019, and a further 390,000 sqm are currently under construction. The volume of modern retail space in Poland has now reached 12.3 million sqm. Prime rents in retail parks range from EUR 9.5 toEUR 12.0/sqm/month.
OFFICE
Take-up on the Warsaw office market rose slightlyyear-on-year to approx. 878,000 sqm in 2019. At theend of December, the Warsaw market had 5.6 millionsqm of office space in total. Completions fell to162,000 sqm, which represents the lowest level since2011, but a further 800,000 sqm are currently underconstruction. 2020 should therefore see a newrecord level of completions, whereby 70% are alreadypre-rented. The vacancy rate declined further to7.8%. Rents in the city center range from EUR 15.0 to EUR 22.0/sqm/month and from EUR 12.0 toEUR 15.0/sqm/month at less central locations.
OFFICE RETAIL The sound state of the economy has supporteddynamic growth in the Romanian retail sector:171,000 sqm were completed in 2019 (2018:367,000 sqm). The country now has over3.75 million sqm of modern retail space. Rental levelsare stable, with prime rents ranging from EUR 55.0 toEUR 60.0/sqm/month in shopping centers and fromEUR 8.0 to EUR 15.0/sqm/month in retail parks.
Completions of 293,000 sqm in 2019 increased the supply on the Bucharest office market to3.2 million sqm. A total of 386,000 sqm were rentedduring the past year. The vacancy rate rose to 9.8% by year-end (2018: 8.1%). Rental levels were stablein properties at good locations. Prime rents range upto EUR 18.5/sqm/month in the city center and fromEUR 10.0 to approx. EUR 16.0/sqm/month in the surrounding districts.

IMMOFINANZ AGAnnual Report 2019
54
Slovakia Growth in Slovakia slowed to 2.5% in 2019 (2018: 4.0%) due to a decline in export activity and weakness in the automobile branch. The inflation rate rose to 2.9% in 2019 (2018: 1.9%), chiefly as the result of higher prices for energy, food and services. Unemployment fell to a new low of 5.8% at year-end (2018: 6.1%).
Transactions on the commercial property market totalled nearly EUR 770 million in 2019. The volume would have been higher, but a number of transactions were postponed to 2020. Office properties were also the most popular asset class in 2019 at EUR 308 million (40%), followed by industrial properties at EUR 262 million (34%) and retail properties at EUR 139 million (18%). Prime yields equalled 5.25% for office properties and 5.75% for retail properties.
Czech Republic The Czech economy grew by 3.3% in 2019 (2018: 3.0%), with private consumption and government spending serving as the main drivers. The investment rate dropped sharply last year following the end of substantial support from the EU Structural Fund in 2018. Another negative factor was the economic slowdown in the neighbouring countries. Inflation was clearly higher at 2.6%, compared with 1.6% one year earlier. The unemployment rate equalled 2.0% in 2019 (2018: 2.1%).
The transaction volume on the real estate investment market totalled EUR 3.1 billion in 2019, which represents an increase of 14% over the prior year level of EUR 2.6 billion. Office properties were again the most popular asset class with a volume of EUR 1.3 billion, followed by retail properties with a volume of EUR 602.5 million.
Hungary Economic growth rose from 4.3% in the previous year to 5.1% in 2019, supported by a robust construction sector and substantial investments in the automobile branch. The inflation rate increased to 3.4% (2018: 2.8%), while unemployment fell to 3.4% (2018: 3.7%).
RETAIL
The volume of modern retail space in Slovakia recently increased by 13,700 sqm to 2.1 million sqm. A further 120,000 sqm are currently under development. The prime yield for retail properties equals 5.75%.
OFFICE
The market for modern office properties in Bratislavacovered 1.84 million sqm at year-end 2019, androughly 130,700 sqm with a pre-rental quota ofnearly 20% are currently under construction. Thevacancy rate recently rose to 8.7%, above all owing tocompletions with more vacant space. Rents in the citycenter range from EUR 12.0 to EUR 15.0/sqm/month,and prime rents equal EUR 17.0/sqm/month.
RETAIL The healthy economic environment was reflected in growth of 5.0% in retail revenues during 2019. The volume of retail space rose by 21,500 sqm and was nearly constant at approx. 2.4 million sqm. 14,000 sqm are currently under construction. Due to the limited supply of space, shopping center rents rose by up to 3.4%
OFFICE The office market in Prague has approx.3.67 million sqm of modern space and roughly246,700 sqm currently under construction. Thevacancy rate has declined to 5.5% but is expected torise slightly in the coming years due to scheduledcompletions. Rents are increasing slightly, with primerents equalling EUR 23.0/sqm/month. The prime yield declined to 4.25%.

GROUP MANAGEMENT REPORTEconomic Overview and Property Markets
55
Investments on the commercial property market generally matched the previous year at EUR 1.7 billion in 2019, whereby the share of national investors rose to 74%. Office properties were the most popular asset class at EUR 834 million, followed by retail properties at EUR 483 million. The prime yields equalled 5.25% for office properties and 5.5% for retail properties.
RETAIL
The retail trade in Hungary reported an increase of 6% in revenues during 2019. Growth in the non-food segment reached an above-average 9.3% and was supported by an increase of 11.4% in purchasing power. Retail space totalling 10,700 sqm opened in 2019, and a further 73,600 sqm are currently under construction. Prime yields were stable at 5.5% for the retail trade and 7.5% for retail parks.
OFFICE
Take-up rose to 637,100 sqm in 2019, and the vacancy rate fell from 7.3% in the previous year to ahistoric low of 5.6%. Completions represented onlyone-third of the 2018 level at 70,500 sqm, but571,400 sqm are under construction. Rents averageEUR 13.0/sqm/month and prime rents EUR 15.3/sqm/month.
STOP SHOP Gödöllö HU | approx. 10,100 sqm rentable space

IMMOFINANZ AGAnnual Report 2019
56
Portfolio Report The IMMOFINANZ portfolio covered 213 properties as of 31 December 2019 (31 December 2018: 226) with a combined value of EUR 5,122.1 million (31 December 2018: EUR 4,338.0 million). These properties are located, above all, in the core markets of Austria, Germany, Poland, Czech Republic, Slovakia, Hungary and Romania. Standing investments represent the largest component at EUR 4,749.5 million, or 92.7% of the carrying amount, and 2.0 million sqm which generate steady rental income. The development projects total EUR 199.4 million, or 3.9% of the carrying amount. Pipeline projects are responsible for EUR 173.2 million, or 3.4%, and include future planned development projects, undeveloped land, real estate inventories and properties that are intended for sale.
The portfolio is focused on three clearly defined brands with a high degree of standardisation: myhive stands for innovative, international office solutions, STOP SHOP for retail parks and VIVO! for shopping centers. Properties in these three brands were responsible for 68.2% of the carrying amount of the standing investment portfolio at year-end 2019 and 74.9% of rental income (Q4 2019). A further 14.0% of the carrying amount is attributable to office buildings which are rented to single tenants. The largest of these properties is the City Tower in Vienna, which is leased to the Austrian government, followed by the trivago Campus and FLOAT in Dusseldorf.
Structure of the property portfolio Total carrying amount: MEUR 5,122.1
A geographical analysis shows 50.6% of the property portfolio in Austria, Germany and Poland, i.e. in so-called “developed markets” as defined by FTSE EPRA/NAREIT.
The initial application of IFRS 16 in the first quarter of 2019 leads to differences between the amounts presented in the portfolio report and on the balance sheet. Expert appraisals or internal valuation form the basis for the property values in the portfolio report, whereby the internal valuations cover roughly EUR 1.0 million of the total carrying amount. The reported property values also include capitalised rights of use for building rights.
* Properties that are held for sale and fall under IFRS 5 are, as in the past, not included in the portfolio report (see section 4.9 in the consolidated financial statements).
Pipeline projects incl.real estate inventories 3.4%
Standing investments92.7%
Development projects3.9%

GROUP MANAGEMENT REPORTPortfolio Report
57
GR
OU
P M
AN
AG
EM
EN
T R
EP
OR
T
Property portfolio by core market and classification
Property portfolio Number of properties
Standinginvestments
in MEUR
Developmentprojectsin MEUR
Pipelineprojects
in MEUR2
Property portfolio in MEUR
Propertyportfolio
in % Austria 30 744.9 93.6 30.5 869.0 17.0%Germany 8 573.7 67.6 0.5 641.7 12.5%Poland 26 1,069.2 10.5 0.0 1,079.7 21.1%Czech Republic 18 540.7 0.0 0.0 540.7 10.6%Hungary 27 504.6 2.5 11.2 518.4 10.1%Romania 47 677.3 24.2 94.3 795.8 15.5%Slovakia 21 329.1 0.0 1.2 330.3 6.4%Other countries1 36 310.0 1.0 35.5 346.4 6.8%IMMOFINANZ 213 4,749.5 199.4 173.2 5,122.1 100.0% 92.7% 3.9% 3.4% 100.0% Rounding differences may result from the use of automatic data processing equipment for the addition of rounded amounts and percentage rates. 1 In declining order based on the carrying amount: Slovenia, Serbia, Croatia, Turkey, Bulgaria 2 Including real estate inventories (Cologne and Adama) totalling EUR 0.9 million
Property acquisitions IMMOFINANZ acquired a number of office and retail properties in 2019 and, in doing so, significantly strengthened the standing investment portfolio as well as its sustainable earning power.
At the end of January 2019, IMMOFINANZ acquired the second half of the investment in Na Příkopě 14, a building in the heart of Prague, and became the sole owner of this prime high street property. Na Příkopě 14 is located on one of the best-known shopping streets in the city center and has roughly 17,000 sqm of exclusive retail and modern office space on ten floors. The extensive revitalisation of this historical building was completed in 2014 and recognised with LEED Gold certification.
Another acquisition involved the Palmovka Open Park in Prague (closing: 8 July 2019). This office property consists of three buildings with 25,800 sqm of rentable space. The property value agreed with the seller amounts to EUR 76.4 million, and the expected rental income totals EUR 4.4 million per year. The property was acquired at a gross return of 5.8%.
The largest acquisition in 2019 involved the Warsaw Spire Tower in Warsaw, Poland, with approximately 71,600 sqm of rentable space. The property value agreed with the seller for this office high-rise totals EUR 386 million. With expected annual rental income of EUR 19.6 million based on invoiced rents and a gross return of 5.1%, this acquisition makes an important contribution to strengthening the earning power of the IMMOFINANZ portfolio. The transaction closed on 11 July 2019.
Six fully rented retail parks in Slovenia and Poland with 54,000 sqm of rentable space in total were acquired during August 2019. The expected annual rental income based on invoiced rents totals EUR 6.6 million, which represents a gross return of 8.6%.
Investments IMMOFINANZ invested a total of EUR 905.3 million in the property portfolio during 2019 (2018: EUR 240.2 million). Most of these expenditures were directed to the Warsaw Spire Tower (Warsaw), Na Přikopě and Palmovka Open Park (Prague) office properties and to various STOP SHOPs.
Property sales The portfolio optimisation also includes the sale of properties that are no longer part of the core business. These sales focus, above all, on properties that are no longer compatible with IMMOFINANZ’s portfolio because of their size, location, quality or other features. The proceeds from these portfolio optimisation sales are invested to expand the portfolio, in other words in development projects and acquisitions.
Properties with a value of EUR 119.4 million (excl. proceeds from the sale of real estate inventories) were sold in 2019. Included here, among others, are several office properties in Budapest, Bucharest and Vienna as well as various non-core properties and land reserves in Poland and Romania. Four buildings and one parcel of land

IMMOFINANZ AGAnnual Report 2019
58
in the Warsaw EMPARK area were also sold to the Polish developer Echo Investment, whereby selected sites are intended for residential construction projects. The transaction will close in two phases, presumably in 2020 and 2021. Four office buildings in the EMPARK with roughly 63,500 sqm of rentable space and an occupancy rate of 95.7% will remain in IMMOFINANZ’s standing investment portfolio.
Structure of the property portfolio by asset class and classification Total carrying amount: MEUR 4,987.4 (excl. Others); in MEUR
Selected details on the carrying amount of IMMOFINANZ’s property portfolio as of 31 December 2019 are provided in the following table:
Property portfolio by brand and classification
Property portfolio Number of properties
Standinginvestments
in MEUR
Developmentprojectsin MEUR
Pipelineprojects
in MEUR1
Property portfolio in MEUR
Propertyportfolio
in % Office 69 3,024.4 185.4 58.6 3,268.4 63.8%
thereof myhive 28 1,570.2 167.2 0.0 1,737.3 33.9%Retail 115 1,672.9 14.0 32.1 1,719.0 33.6%
thereof VIVO!/ Shopping Center 11 716.5 0.2 0.0 716.7 14.0%thereof STOP SHOP/ Retail Park 96 951.2 13.8 4.8 969.8 18.9%
Others 29 52.2 0.0 82.4 134.7 2.6%IMMOFINANZ 213 4,749.5 199.4 173.2 5,122.1 100.0% 1 Including real estate inventories (Cologne and Adama) totalling EUR 0.9 million
Standing investments With a 92.7% share of the total property portfolio, the standing investments are the major source of earnings for IMMOFINANZ. These properties are held to generate rental income. The most important objectives for their management include a continuous increase in quality and efficiency, the strengthening of ties with existing tenants and the acquisition of new tenants and the continuing improvement of the portfolio.
Acquisitions and completions led to an increase of more than EUR 1 billion, or 27.7%, in the standing investment portfolio during 2019. The 158 standing investments had a combined carrying amount of EUR 4,749.5 million as of 31 December 2019 (31 December 2018: 157 investments and EUR 3,719.1 million carrying amount). Of this total, 63.7% are attributable to office properties and 35.2% to retail properties. The focal point of the standing investments based on the carrying amount are the markets in Poland (EUR 1,069.2 million), Austria (EUR 744.9 million) and Romania (EUR 677.3 million).
These properties have 2,001,063 sqm of rentable space (31 December 2018: 1,891,627 sqm). The standing investment portfolio has a gross return of 6.2% based on IFRS rental income and a return of 6.5% based on
Standing investments3,024.4
Development projects 185.4
Pipeline projects incl.real estate inventories 58.6
Office
Standing investments1,672.9
Development projects14.0
Pipeline projects incl.real estate inventories 32.1
Retail

GROUP MANAGEMENT REPORTPortfolio Report
59
GR
OU
P M
AN
AG
EM
EN
T R
EP
OR
T
invoiced rents. The difference is explained by the accrual of rental incentives – e.g. the standard market practice of granting rent-free periods or allowances for fit-out costs. These incentives must be accrued on a straight-line basis over the contract term in accordance with IFRS (basis for gross return under IFRS) but are not included in the invoiced rent.
The occupancy rate rose to a new record level of 96.8% in 2019 (31 December 2018: 95.8%). According to the EPRA’s calculation formula, the vacancy rate equals 3.2% (31 December 2018: 4.1%). The EPRA vacancy rate is based on the ratio of the estimated market rent for the vacant space in the standing investments to the total estimated market rent for the standing investment portfolio (additional information on the EPRA financial indicators can be found beginning on page 78). IMMOFINANZ rented roughly 300,800 sqm of the total rentable space in 2019 (excl. Other standing investments; 2018: 312,400 sqm). Of this total, 144,000 sqm represented new rentals and 156,800 sqm contract extensions. The strongest growth in 2019 was recorded on the rental markets in Slovakia, Poland and Romania, whereby the take-up ranged from 20.0% to 22.5% of IMMOFINANZ’s rentable space in the respective core country. The average unexpired lease term (WAULT*) weighted by rental income rose to 4.3 years as of 31 December 2019.
The following graph shows the distribution of IMMOFINANZ’s standing investment portfolio as of 31 December 2019 by country, based on the carrying amount:
Average unexpired lease term weighted by rental income, excl. open-ended contracts.
Poland 22.5% Austria 15.7% Romania 14.3% Czech Republic11.4%
Hungary10.6%
Slovakia 6.9%
Germany 12.1% Other countries 6.5%
myhive am Wienerberg Vienna | AT | approx. 150,000 sqm of rentable space

IMMOFINANZ AGAnnual Report 2019
60
Standing investments by core market
Standing investments Number of properties
Carrying amountin MEUR
Carrying amountin %
Rentable spacein sqm
Rented space in sqm
Occupancy ratein %
Austria 24 744.9 15.7% 236,657 225,095 95.1%Germany 5 573.7 12.1% 103,665 102,277 98.7%Poland 24 1,069.2 22.5% 410,124 402,811 98.2%Czech Republic 18 540.7 11.4% 218,615 211,849 96.9%Hungary 23 504.6 10.6% 284,112 276,342 97.3%Romania 17 677.3 14.3% 342,842 322,336 94.0%Slovakia 20 329.1 6.9% 187,671 179,497 95.6%Other countries2 27 310.0 6.5% 217,378 215,894 99.3%IMMOFINANZ 158 4,749.5 100.0% 2,001,063 1,936,100 96.8%
Standing investments
Rental income Q4 2019 in MEUR
Gross return(invoiced rents
return) in %
Carrying amountfinancingin MEUR
Financing costsfloating interest
in %1
Financing costs incl. derivatives
in % LTV in % Austria 9.7 5.2% (5.0%) 298.2 1.3% 2.0% 40.0%Germany 5.6 3.9% (4.3%) 313.4 0.4% 0.9% 54.6%Poland 16.9 6.3% (7.0%) 559.5 1.5% 2.0% 52.3%Czech Republic 7.3 5.4% (4.9%) 308.7 1.5% 1.7% 57.1%Hungary 8.6 6.8% (7.5%) 242.6 1.4% 1.9% 48.1%Romania 13.4 7.9% (8.3%) 0.0 0.0% 0.0% 0.0%Slovakia 5.8 7.1% (7.3%) 142.4 1.8% 2.2% 43.3%Other countries2 6.4 8.3% (8.3%) 87.6 1.9% 1.9% 28.3%IMMOFINANZ 73.8 6.2% (6.5%) 1,952.5 1.3% 1.8% 41.1%Development projects and pipeline projects 0.9 56.3 1.5% 2.4% Rental income from sold properties and adjustments 1.7 0.0 0.0% 0.0% Group financing 0.0 792.0 0.0% 2.2% IMMOFINANZ 76.5 2,800.8 1.3% 1.9% Market value property portfolio in MEUR 5,122.1EPRA NAV S IMMO shares (19.5 million shares)3
in MEUR 515.8Cash and cash equivalents4 in MEUR -345.1 Properties/liabilities held for sale (asset & share deals) in MEUR 27.5 132.0IMMOFINANZ in MEUR 2,483.1 5,769.9Net LTV in % 43.0%
1 Financing costs based on nominal outstanding liability 2 In declining order based on the carrying amount: Slovenia, Serbia, Croatia 3 19.5 million S IMMO shares at the EPRA NAV of EUR 26.45 per share as of 31 December 2019 4 Cash and cash equivalents, incl. cash and cash equivalents from assets held for sale
Further increase in like-for-like rental income A like-for-like analysis (i.e. acquisitions, completions and sales are deducted to facilitate comparison with the 2018 financial year) shows an increase of EUR 5.5 million, or 2.9%, in rental income to EUR 192.2 million. The increase in the office sector equalled 2.6%, while the rental income from retail properties rose by 3.3%. Two VIVO! shopping centers were modernised and repositioned in 2019 and are therefore not included in the like-for-like rental income of the retail properties.

GROUP MANAGEMENT REPORTPortfolio Report
61
GR
OU
P M
AN
AG
EM
EN
T R
EP
OR
T
Standing investments like-for-like by core market
Standing investments like-for-like1
Number of properties
Carrying amount
in MEUR
Carrying amount
in %
Rental income 2019
in MEUR
Rental income 2018
in MEUR
Change inrental income
in MEUR Austria 23 700.7 22.2% 34.8 34.1 0.6Germany 2 131.4 4.2% 6.9 6.5 0.4Poland 21 647.9 20.5% 40.0 39.4 0.6Czech Republic 16 343.7 10.9% 20.2 19.3 0.9Hungary 23 504.6 16.0% 31.1 29.4 1.7Romania 16 489.3 15.5% 34.0 33.4 0.6Slovakia 19 216.5 6.9% 15.7 15.1 0.5Other countries 11 121.8 3.9% 9.7 9.5 0.2IMMOFINANZ 131 3,155.9 100.0% 192.2 186.7 5.5Rental income from properties sold/ acquired, IFRS 15 and IFRS 16 adjustments and development projects 87.7 IMMOFINANZ 279.9
Standing investments like-for-like by asset class and brand
Standing investments like-for-like1
Number of properties
Carrying amount
in MEUR
Carrying amount
in %
Rental income 2019
in MEUR
Rental income 2018
in MEUR
Change inrental income
in MEUR Office 48 1,994.3 63.2% 104.5 101.9 2.7
thereof myhive 21 1,089.5 34.5% 56.3 55.2 1.1Retail 80 1,160.9 36.8% 87.7 84.9 2.8
thereof VIVO!/Shopping Center 8 415.9 13.2% 31.5 30.4 1.1thereof STOP SHOP/Retail Park 71 739.8 23.4% 55.7 53.9 1.7
Others 3 0.7 0.0% 0.0 0.0 0.0IMMOFINANZ 131 3,155.9 100.0% 192.2 186.7 5.5
Rounding differences may result from the use of automatic data processing equipment for the addition of rounded amounts and percentage rates. 1 This calculation only includes the properties which were fully owned by IMMOFINANZ during both periods. In other words, the calculation excludes new acquisitions,
completions and sales. The VIVO! Bratislava (Slovakia) and VIVO! Cluj-Napoca (Romania) shopping centers are not included in the like-for-like analysis because they were undergoing extensive modernisation.
Office standing investments The carrying amount of the 53 office standing investments totalled EUR 3,024.4 million as of 31 December 2019 (31 December 2018: 60 standing investments and EUR 2,235.4 million). These assets represented 63.7% of the standing investment portfolio and 53.3% of the rental income from standing investments in the fourth quarter of 2019. A regional analysis shows the focal points of the IMMOFINANZ properties in the core markets of Poland (EUR 779.0 million), Austria (EUR 573.0 million) and Germany (EUR 566.3 million).
The office standing investments have 1,035,844 sqm of rentable space (31 December 2018: 1,003,941 sqm). Based on annualised rents (Q4 2019: EUR 39.3 million), the office portfolio generated a gross return of 5.2% and a return of 5.6% based on invoiced rents. The office properties in the myhive brand represent a carrying amount of EUR 1,570.2 million and generated a gross return of 5.5%, respectively 6.0% based on invoiced rents.
The occupancy rate in the office portfolio rose to 95.3% in 2019 (31 December 2018: 93.7%), and the myhive offices have an occupancy rate of 95.0%. Based on the EPRA’s calculation formula, the vacancy rate equals 4.2% (31 December 2018: 5.8%). The take-up in the office segment amounted to approximately 149,800 sqm in 2019: nearly 69,500 sqm represented new rentals and 80,300 sqm contract extensions.

IMMOFINANZ AGAnnual Report 2019
62
The office portfolio has a balanced tenant structure. The ten largest tenants are responsible for 21.8% of the space in the office standing investments, and no single tenant has rented more than 3.4% of the total space in these properties. The WAULT rose to 4.6 years as of 31 December 2019 (31 December 2018: 4.1 years).
The ten largest standing investments in the office portfolio based on the carrying amount (in declining order) are the Warsaw Spire (Warsaw), FLOAT (Düsseldorf), myhive am Wienerberg (Vienna), trivago Campus (Düsseldorf), City Tower Vienna (Vienna), Na Příkopě 14 (Prague), myhive Átrium Park (Budapest), BBC Gamma (Prague), Cluster Produktionstechnik (Aachen) and myhive S-Park (Bucharest). An overview of the IMMOFINANZ office properties can be found under www.immofinanz.com/en/office/office-search.
Key data on the office standing investments by category
Standing investments Number of properties
Carrying amountin MEUR
Carrying amountin %
Rentable spacein sqm
Rented space in sqm
Occupancy ratein %
IMMOFINANZ 53 3,022.9 100.0% 1,035,844 986,684 95.3%
thereof myhive 23 1,568.2 51.9% 556,016 528,151 95.0%
Standing investments
Rental income Q4 2019 in MEUR1
Gross return(invoiced rents
return) in %
Carrying amount financingin MEUR
Financing costs floating interest
in %1
Financing costs incl. derivatives
in % LTV in % IMMOFINANZ 39.3 5.2% (5.6%) 1,304.7 1.1% 1.6% 43.2%
thereof myhive 21.5 5.5% (6.0%) 708.9 1.3% 1.9% 45.2% 1 Financing costs based on nominal outstanding liability
Average unexpired lease term weighted by rental income, excl. open-ended contracts.
Average unexpired lease term weighted by rental income, excl. open-ended contracts.
trivago Campus Düsseldorf | GER | approx. 35,600 sqm of rentable space

Romania
Number of properties 9 Carrying amount in MEUR 321.2 Carrying amount in % 10.6 Rentable space in sqm 190,916 Occupancy rate in % 90.2 Rental income Q4 2019 in MEUR 5.5 Gross return in % 6.9
25.8%Poland
1.9%Slovakia
18.7%Germany
13.2%Czech Republic
18.9%Austria 9.9%
Hungary
10.6%Romania
The office sector in the IMMOFINANZ core markets
1 Croatia
Austria
Number of properties 10 Carrying amount in MEUR 573.0 Carrying amount in % 18.9 Rentable space in sqm 166,226 Occupancy rate in % 93.6 Rental income Q4 2019 in MEUR 7.1 Gross return in % 5.0
Czech Republic
Number of properties 7 Carrying amount in MEUR 398.6 Carrying amount in % 13.2 Rentable space in sqm 122,536 Occupancy rate in % 95.8 Rental income Q4 2019 in MEUR 4.6 Gross return in % 4.6
Slovakia
Number of properties 2 Carrying amount in MEUR 58.7 Carrying amount in % 1.9 Rentable space in sqm 35,592 Occupancy rate in % 92.3 Rental income Q4 2019 in MEUR 0.9 Gross return in % 6.0
Other countries1
Number of properties 1 Carrying amount in MEUR 28.3 Carrying amount in % 0.9 Rentable space in sqm 15,995 Occupancy rate in % 99.0 Rental income Q4 2019 in MEUR 0.5 Gross return in % 6.4
Germany
Number of properties 4 Carrying amount in MEUR 566.3 Carrying amount in % 18.7 Rentable space in sqm 103,665 Occupancy rate in % 98.7 Rental income Q4 2019 in MEUR 5.5 Gross return in % 3.9
Hungary
Number of properties 9 Carrying amount in MEUR 299.4 Carrying amount in % 9.9 Rentable space in sqm 148,792 Occupancy rate in % 96.7 Rental income Q4 2019 in MEUR 4.3 Gross return in % 5.8
Poland
Number of properties 11 Carrying amount in MEUR 779.0 Carrying amount in % 25.8 Rentable space in sqm 252,122 Occupancy rate in % 97.8 Rental income Q4 2019 in MEUR 10.9 Gross return in % 5.6
IMMOFINANZ
Number of properties 53 Carrying amount in MEUR 3,024.4 Carrying amount in % 100.0 Rentable space in sqm 1,035,844 Occupancy rate in % 95.3 Rental income Q4 2019 in MEUR 39.3 Gross return in % 5.2
Share of the standing investment portfolio EUR 3,024.4 million based on the carrying amount as of 31 December 2019
GR
OU
P M
AN
AG
EM
EN
T R
EP
OR
T
GROUP MANAGEMENT REPORTPortfolio Report
63

IMMOFINANZ AGAnnual Report 2019
64
Retail standing investments The carrying amount of the 100 standing investments in the retail sector totalled EUR 1,672.9 million as of 31 December 2019 (31 December 2018: 93 standing investments and EUR 1,475.5 million). These properties represented 35.2% of the standing investment portfolio and generated 46.0% of the rental income from standing investments in the fourth quarter of 2019. The largest regional markets are Romania with EUR 355.4 million, Poland with EUR 290.2 million and Slovakia with EUR 270.5 million. The STOP SHOP retail parks have a carrying amount of EUR 951.2 million and a gross return of 8.1%, respectively 8.1% based on invoiced rents. The VIVO! shopping centers have a carrying amount of EUR 716.5 million; they generate a gross return of 8.1% and an invoiced rental return of 8.2%.
The retail standing investments have 955,039 sqm of rentable space (31 December 2018: 887,685 sqm). Based on annualised rents (Q4 2019: EUR 33.9 million), the retail portfolio has a gross return of 8.1%, respectively 8.2% (invoiced rents).
The occupancy rate in the retail properties remains stable at 98.3% (31 December 2018: 98.2%), whereby the STOP SHOPs and VIVO!s are rented at 98.8% and 97.5%, respectively. Take-up in the retail properties amounted to roughly 151,000 sqm in 2019 and includes approximately 74,500 sqm of new rentals and 76,500 sqm of contract extensions. Major new rentals over 5,000 sqm each included the Romanian VIVO! Cluj-Napoca, the Czech VIVO! Hostivař in Prague and the Slovakian VIVO! Bratislava.
IMMOFINANZ relies on a balanced tenant mix and the inclusion of recreational and entertainment opportunities to create an optimal environment for retailers and their customers. All larger IMMOFINANZ retail properties have numerous solid international and local anchor tenants, but no single retailer has rented more than 4.1% of the total space in these properties. Retailers from the fashion sector in the discount and medium price segment are the largest tenant group based on rented space, followed by food products. Other important tenant groups are health & beauty, furniture & household, shoes, sports, electronics & telecommunications and entertainment & fitness. The WAULT rose to 3.8 years as of 31 December 2019 (31 December 2018: 3.7 years).
Branch mix – retail Only rented space in standing investments as of 31 December 2019
IMMOFINANZ recorded further strong growth in the number of visitors to its retail properties in 2019: More than 156 million customers visited the STOP SHOP retail parks and VIVO! shopping centers. That represents an increase of roughly 14 million visitors, or nearly 10%, over the previous year. On a like-for-like basis, i.e. after an adjustment for acquisitions, sales and completions, the number of visitors rose by 1.5% to approximately 143 million.
Average unexpired lease term weighted by rental income, excl. open-ended contracts.
Health &beauty 7.9%
Others9.6%
Shoes7.6%
Supermarket &food 12.4%
Fashion 32.9% Sports7.2%
Furniture & household7.7%
Electronics &telecommunications7.0%
Entertainment & fitness
5.3%
Toys2.4%

17.3%Poland
16.2%Slovakia
8.5%Czech Republic
7.6%Austria 12.3%
Hungary
21.2%Romania
1 Slovenia, Serbia, Croatia
Romania
Number of properties 5 Carrying amount in MEUR 355.4 Carrying amount in % 21.2 Rentable space in sqm 151,926 Occupancy rate in % 98.8 Rental income Q4 2019 in MEUR 7.9 Gross return in % 8.8
Hungary
Number of properties 14 Carrying amount in MEUR 205.2 Carrying amount in % 12.3 Rentable space in sqm 135,320 Occupancy rate in % 97.9 Rental income Q4 2019 in MEUR 4.3 Gross return in % 8.4
Other countries1
Number of properties 26 Carrying amount in MEUR 281.7 Carrying amount in % 16.8 Rentable space in sqm 201,383 Occupancy rate in % 99.3 Rental income Q4 2019 in MEUR 6.0 Gross return in % 8.5
Poland
Number of properties 13 Carrying amount in MEUR 290.2 Carrying amount in % 17.3 Rentable space in sqm 158,002 Occupancy rate in % 98.9 Rental income Q4 2019 in MEUR 5.9 Gross return in % 8.2
Czech Republic
Number of properties 11 Carrying amount in MEUR 142.1 Carrying amount in % 8.5 Rentable space in sqm 96,079 Occupancy rate in % 98.3 Rental income Q4 2019 in MEUR 2.7 Gross return in % 7.7
Slovakia
Number of properties 18 Carrying amount in MEUR 270.5 Carrying amount in % 16.2 Rentable space in sqm 152,079 Occupancy rate in % 96.4 Rental income Q4 2019 in MEUR 5.0 Gross return in % 7.4
Austria
Number of properties 13 Carrying amount in MEUR 127.7 Carrying amount in % 7.6 Rentable space in sqm 60,251 Occupancy rate in % 98.5 Rental income Q4 2019 in MEUR 2.2 Gross return in % 6.8
IMMOFINANZ
Number of properties 100 Carrying amount in MEUR 1,672.9 Carrying amount in % 100.0 Rentable space in sqm 955,039 Occupancy rate in % 98.3 Rental income Q4 2019 in MEUR 33.9 Gross return in % 8.1
The retail sector in the IMMOFINANZ core markets
Share of the standing investment portfolio EUR 1,672.9 million based on the carrying amount as of 31 December 2019
GR
OU
P M
AN
AG
EM
EN
T R
EP
OR
T
65GROUP MANAGEMENT REPORTPortfolio Report

IMMOFINANZ AGAnnual Report 2019
66
The ten largest standing investments in the retail portfolio based on the carrying amount (in declining order) are the VIVO! Cluj-Napoca (Romania), VIVO! Bratislava (Slovakia), VIVO! Lublin (Poland), VIVO! Constanţa (Romania), VIVO! Baia Mare (Romania), VIVO! Stalowa Wola (Poland), VIVO! Piła (Poland), VIVO! Krosno (Poland), VIVO! Hostivař (Czech Republic) and STOP SHOP Veszprém (Hungary). An overview of the IMMOFINANZ retail properties can be found under www.immofinanz.com/en/retail/retail-search.
Key data on the retail standing investments by category
Standing investments Number of properties
Carrying amountin MEUR
Carrying amountin %
Rentable spacein sqm
Rented space in sqm
Occupancy ratein %
IMMOFINANZ 100 1,672.9 100.0% 955,039 939,236 98.3%
thereof VIVO!/Shopping Center 10 716.5 42.8% 313,610 305,836 97.5%thereof STOP SHOP/Retail Park 89 951.2 56.9% 636,996 629,658 98.8%
Standing investments
Rental income Q4 2019 in MEUR
Gross return(invoiced rents
return) in %
Carrying amountfinancingin MEUR
Financing costsfloating interest
in %1
Financing costs incl. derivatives
in % LTV in % IMMOFINANZ 33.9 8.1% (8.2%) 644.9 1.6% 2.1% 38.6%
thereof VIVO!/Shopping Center 14.5 8.1% (8.2%) 205.0 1.7% 2.2% 28.6%thereof STOP SHOP/Retail Park 19.3 8.1% (8.1%) 439.9 1.6% 2.0% 46.2%
1 Financing costs based on nominal outstanding liability
Development projects The development projects had a carrying amount of EUR 199.4 million as of 31 December 2019, which represents 3.9% of the total property portfolio (31 December 2018: EUR 397.5 million and 9.2%). This amount includes EUR 177.5 million of active development projects and EUR 22.0 million of projects in the preparation or concept phase, for which outstanding construction costs are not yet available. The expected fair value of the active projects on completion amounts to EUR 324.0 million. The core markets of Germany and Austria represent the focus of these activities based on an expected fair value after completion of EUR 160.3 million respectively EUR 102.4 million.
The development projects in preparation include the extensive modernisation of a further office building in Vienna and the expansion of a STOP SHOP retail park.
The following development projects were reclassified to standing investments in 2019: the FLOAT office building (Germany), the myhive am Wienerberg hotel/office building (Austria), the STOP SHOP retail park in Sremska Mitrovica (Serbia) and the expansion of the STOP SHOP in Třebič (Czech Republic).
Current focus of development activities
Germany
Düsseldorf Following the trivago Campus and FLOAT, the third office project in the Medienhafen is currently under construction for IMMOFINANZ’s standing investment portfolio. This high-rise is designed as a multi-tenant building and will be the first myhive office building in Germany. The myhive Medienhafen will have approximately 21,000 sqm of rentable space on 16 floors, and completion is scheduled for 2021.
Austria The two development projects currently in progress involve the modernisation of existing office buildings: the location for the myhive am Wienerberg with approximately 12,500 sqm and the Ungargasse in Vienna’s third district with roughly 17,200 sqm of planned usable space. These projects are scheduled for completion in 2020.

GROUP MANAGEMENT REPORTPortfolio Report
67
GR
OU
P M
AN
AG
EM
EN
T R
EP
OR
T
Poland The STOP SHOP in the Polish city of Siedlce has roughly 14,200 sqm of rentable space and opened on 26 March 2020, subject to the government restrictions related to Covid-19. It is fully rented and represents the tenth STOP SHOP location in Poland.
Romania At the IRIDE Business Park in Bucharest, the IRIDE 18 and 19 office buildings are currently undergoing modernisation and integration in the myhive concept. The office buildings are expected to have roughly 10,000 sqm and 18,000 sqm of rentable space.
Development projects by core market
Development projects
Number of properties
Carrying amount
in MEUR
Carrying amount
in %
Outstandingconstruction
costs in MEUR
Plannedrentable space
in sqm
Expected fair value after
completion in MEUR
Expected rentalincome at full
occupancyin MEUR
Expected yield after
completion in %
Austria 2 76.2 42.9% 26.2 25,898 102.4 4.1 4.1%Germany 1 66.8 37.6% 60.9 21,253 160.3 5.8 4.5%Poland 1 10.3 5.8% 7.9 14,191 20.2 1.6 8.7%Romania 2 24.2 13.7% 16.9 27,956 41.1 3.6 8.8%Active projects 6 177.5 100.0% 111.9 89,298 324.0 15.1 5.2%Projects in preparation 6 22.0 IMMOFINANZ 12 199.4
Pipeline projects Pipeline projects include planned development projects, undeveloped land and/or temporarily suspended projects. The closing for the hotel in the Gerling Quartier in Cologne, which was sold through a forward purchase, took place during the first quarter of 2019, and the remaining real estate inventories in Cologne as well as the Romanian Adama (in total, EUR 0.9 million) are therefore no longer reported separately, but together with the pipeline projects. The pipeline projects had a carrying amount of EUR 173.2 million as of 31 December 2019 (31 December 2018, including real estate inventories: EUR 221.4 million). Romania represents the focal point of these projects at EUR 94.3 million. As part of its corporate strategy, IMMOFINANZ intends to further reduce the scope of pipeline projects through selected sales.
Assets held for sale The assets held for sale totalled EUR 154.6 million as of 31 December 2019 (including capitalised rights of use for building rights) and are not included in this portfolio report (31 December 2018: EUR 57.2 million). Concrete sale plans have been approved for these properties, and their sale is intended in the near future. Details are provided in note 4.9 to the consolidated financial statements.

IMMOFINANZ AGAnnual Report 2019
68
Property Valuation IMMOFINANZ prepares its consolidated financial statements in accordance with International Financial Reporting Standards (IFRS) and arranges for the regular valuation of its properties by independent experts. These external appraisals are carried out each year as of 30 June and 31 December. The valuation of the property portfolio also follows the EPRA’s Best Practices Policy Recommendations for the application of the fair value method as defined in IFRS.
As of 31 December 2019, CBRE was responsible for the appraisal of the entire IMMOFINANZ portfolio (EUR 5.1 billion). Internal appraisals covered roughly 1.0%.
Development of property valuation in 2019 Revaluations totalled EUR 193.3 million in 2019 (2018: EUR 24.9 million). This positive result is primarily attributable to the strong market climate in Austria and Germany during the second half of 2019, but was also supported by the revaluation of investment property in all IMMOFINANZ core countries.
Development of property valuation like-for-like A like-for-like analysis – i.e. after an adjustment for new acquisitions, completions and sales to improve comparability – shows a positive valuation effect of EUR 122.7 million in 2019 (2018: EUR 10.7 million). In addition to Austria and Germany, developments were also positive in the individual CEE countries.
Standing investments like-for-like by core market Standing investments like-for-like1
Number of properties
Carrying amountin MEUR
Carrying amount in %
Valuation effects2019 in MEUR
Austria 23 700.7 22.2% 57.6Germany 2 131.4 4.2% 14.2Poland 21 647.9 20.5% 8.4Czech Republic 16 343.7 10.9% 3.6Hungary 23 504.6 16.0% 24.4Romania 16 489.3 15.5% 11.0Slovakia 19 216.5 6.9% 3.7Other countries 11 121.8 3.9% -0.1IMMOFINANZ 131 3,155.9 100.0% 122.7
Standing investments like-for-like by asset class Standing investments like-for-like1
Number of properties
Carrying amountin MEUR
Carrying amount in %
Valuation effects2019 in MEUR
Office 48 1,994.3 63.2% 97.6
thereof myhive 21 1,089.5 34.5% 31.2Retail 80 1,160.9 36.8% 25.1
thereof VIVO!/Shopping Center 8 415.9 13.2% 3.4 thereof STOP SHOP/Retail Park 71 739.8 23.4% 21.8
Others 3 0.7 0.0% 0.0IMMOFINANZ 131 3,155.9 100.0% 122.7 1 This calculation only includes the properties which were fully owned by IMMOFINANZ during both financial years. In other words, the calculation excludes new
acquisitions, completions and sales. The VIVO! Bratislava (Slovakia) and VIVO! Cluj-Napoca (Romania) shopping centers are not included in the like-for-like analysis because they are currently undergoing extensive modernisation.

GROUP MANAGEMENT REPORTFinancing
69
GR
OU
P M
AN
AG
EM
EN
T R
EP
OR
T
Financing The objectives of IMMOFINANZ’s financing strategy are to ensure sufficient liquidity at all times, to achieve and maintain a balanced capital structure and maturity profile and to also optimise financing costs. The best possible structuring of debt financing is an important priority and, in addition to successful property management, represents a decisive factor for the results generated by the company’s business activities.
Financing with a total volume of EUR 1,298.1 million was concluded in 2019. That represents approximately 45.9% of the total financial liabilities as of 31 December 2019 and involves extensions as well as new financing.
In the area of property financing, the strategic combination of individual properties in a particular brand or asset class into specific portfolios also led to the realisation of more attractive conditions in 2019. Specific examples include the refinancing of the STOP SHOP portfolio in Hungary with a volume of EUR 120.0 million, acquisition financing for the Warsaw Spire in Poland at EUR 230.0 million and refinancing of EUR 120.0 million for the myhive location on Vienna’s Wienerberg with a 15-year term.
IMMOFINANZ AG received a long-term issuer rating of BBB- with stable outlook from S&P Global Ratings in January 2019. Based on this investment grade rating, a EUR 500 million corporate bond with a fixed coupon of 2.625% per year was issued. The net proceeds were used during the first quarter of 2019 to refinance existing collateralised financial liabilities and for general corporate purposes. S&P Global Ratings confirmed its initial rating as part of the annual review process in February 2020.
Financial liabilities amounted to EUR 2.8 billion as of 31 December 2019 (31 December 2018: EUR 2.4 billion). Cash and cash equivalents, including cash held for sale, totalled EUR 345.1 million (31 December 2018: EUR 632.0 million), and net debt, i.e. debt after the deduction of cash and cash equivalents held by the Group, equalled EUR 2.5 billion (31 December 2018: EUR 1.8 billion). The decline in cash and cash equivalents resulted, among others, from the share buyback programme 2018/2019, which was concluded in August 2019, and from the acquisition of several standing investments, e. g. the Warsaw Spire and Palmovka Open Park office properties.
Robust balance sheet structure IMMOFINANZ has a robust balance sheet structure with an equity ratio of 46.0% (31 December 2018: 48.0%) and a net loan-to-value ratio (net LTV) of 43.0% (31 December 2018: 37.3%).
The net LTV shows the carrying amount of financing less cash and cash equivalents in relation to the total carrying amount of the properties and the EPRA NAV for the roughly 19.5 million S IMMO AG (S IMMO) shares held by IMMOFINANZ.
* Excluding lease liabilities of EUR 83.3 million in accordance with the application of IFRS 16; incl. IFRS 5

IMMOFINANZ AGAnnual Report 2019
70
Development of average financing costs
Development of net LTV
Calculation of net LTV as of 31 December 2019
Amounts in
TEUR
Carrying amount of financing1 2,828,248.6 - Cash and cash equivalents2 -345,141.8 Net carrying amount of financing 2,483,106.8 Carrying amount of property3 & EPRA NAV of S IMMO shares4 5,769,873.1 Net LTV 43.0% 1 Including IFRS 5 values, excluding IFRS 16 values 2 Cash and cash equivalents, incl. cash and cash equivalents in assets held for
sale 3 Excluding rights of use, values as per IFRS 16 4 19.5 million S IMMO shares at the EPRA NAV of EUR 26.45 per share
as of 31 December 2019
Further reduction in financing costs Financing costs declined to EUR -64.6 million in 2019 (2018: EUR -68.4 million). The average financing costs for IMMOFINANZ equalled 1.91% per year as of 31 December 2019, including the derivatives used for interest rate hedging (31 December 2018: 2.14% per year).
Term structure The weighted average remaining term of the financial liabilities equals four years (2018: 3.25 years). The following graph shows the term structure by year for IMMOFINANZ as of 31 December. The financing scheduled to expire in 2020 totalled EUR 203.0 million as of 31 December 2019 (31 December 2018: EUR 278.9 million).
30 Apr. 14 30 Apr. 15 30 Apr. 16 31 Dec. 16 31 Dec. 17 31 Dec. 19
3.67%
1.91%
3.75%
3.50%
3.25%
3.00%
2.75%
2.50%
2.25%
2.00%
1.75%
Average weighted interest rate incl. hedging costs and fixed interest rates
3.24%
2.97% 3.02%
2.31%2.14%
31 Dec. 18
30 Apr. 14 30 Apr. 15 30 Apr. 16 31 Dec. 16 31 Dec. 17 31 Dec. 18
52.50%
37.29%
55%
50%
45%
40%
35%
50.30%49.36% 49.00%
40.77%
31 Dec. 19
43.04%

GROUP MANAGEMENT REPORTFinancing
71
GR
OU
P M
AN
AG
EM
EN
T R
EP
OR
T
Term structure of financial liabilities by financial year as of 31 December 2019 in MEUR
The convertible bond 2024 is presented in 2022 due to a put option for the bondholders.
Unencumbered property In addition to properties which carry external financing and are encumbered through standard market collateral (e.g. mortgages, pledge of company shares), EUR 1,434.0 million, or 27.3%, of the total property carrying amount was not externally financed and therefore unencumbered as of 31 December 2019 (31 December 2018: EUR 749.0 million or 17.0%). This year-on-year increase resulted primarily from the refinancing of collateralised financial liabilities through the net proceeds received from the corporate bond 2019-2023. Including the S IMMO shares (valued at the EPRA NAV), which are not encumbered by any financing, this value increases to EUR 1,949.8 million or 33.8% (31 December 2018: EUR 749.0 million or 15.6%).
Unencumbered property by asset class Unencumbered property in total: MEUR 1,434.0
Composition of financial liabilities The financial liabilities held by IMMOFINANZ consist of amounts due to financial institutions as well as liabilities from bonds. The composition of these liabilities as of 31 December 2019 is as follows:
Weighted average interest rate of the financial liabilities Outstanding liability
in TEUR as of 31 Dec. 2019Weighted average interest
rate incl. derivatives in %1
Convertible bond2 285,807.6 1.50%Corporate bond 506,161.4 2.63%Bank liabilities3 2,036,279.5 1.79%IMMOFINANZ 2,828,248.6 1.91% 1 Calculation basis: actual remaining debt (nominal amount) 2 Coupon reduced by 50 basis points to 1.50% as of 24 January 2019 following the receipt of an investment grade rating 3 Incl. IFRS 5
The remaining balance of the financial liabilities held by IMMOFINANZ totalled EUR 2,828.6 million as of 31 December 2019. As of that date, all financing was denominated in euros.
Office51.2%
Retail40.0%
Others8.8%

IMMOFINANZ AGAnnual Report 2019
72
Bank liabilities The total volume of refinancing, long-term extensions and new financing from bank liabilities amounted to EUR 798.1 million in 2019 (2018: EUR 735.3 million).
A total of EUR 521.5 million is attributable to the office properties. Included here is long-term acquisition financing of EUR 230.0 million for the Warsaw Spire and EUR 53.9 million for the Palmovka Open Park in Prague. The remaining EUR 237.6 million represent long-term standing investment financing for the FLOAT in Düsseldorf and the myhive am Wienerberg in Vienna.
In the retail sector, refinancing of EUR 276.5 million was concluded for STOP SHOPs in Hungary, Slovenia and the Czech Republic.
Financing sources as of 31 December 2019
Derivatives IMMOFINANZ uses derivatives to hedge against interest rate increases. The volume of financial liabilities hedged through interest rate derivatives amounted to EUR 1,694.1 million as of 31 December 2019 (31 December 2018: EUR 1,354.3 million). In total, 90.7% of financial liabilities are hedged against interest rate risk (31 December 2018: 73.8%); 59.6% via interest rate derivatives, and a further 31.1% represent financial liabilities with fixed interest rates.
Derivatives1 Floating leg
Market value incl. interest & CVA/DVA
as of 31 Dec. 2019 in TEUR
Notional amount in TEUR
Average hedgedreference interest
rate Interest rate swap 3-M-EURIBOR -18,637.9 1,694,130.0 0.16%IMMOFINANZ AG -18,637.9 1,694,130.0 1 Including IFRS 5 (For information on held-for-sale assets, see section 4.9 in the consolidated financial statements).
An interest rate swap exchanges floating for fixed interest payments. Therefore, floating rate liabilities that are hedged with a swap can be regarded as fixed interest rate liabilities from an economic standpoint.
The interest rates used for discounting and the calculation of variable payment flows are based on interest rate curves for each currency and matching maturities that are observable on the market. In accordance with IFRS 13 (Fair Value Measurement), the resulting market values are adjusted to include a credit value adjustment (CVA) and a debt value adjustment (DVA).
UniCredit Group 16.1%
Convertible bond/ Corporate bond
28.0%
DZHYP AG5.0%
Erste Group 14.4%
pbb DeutschePfandbrief-bank 7.0%
Helaba4.5 %
BerlinHyp
4.9%
Hamburg Commercial
Bank AG4.9%
RaiffeisenGroup 10.9%
Others4.2%

GROUP MANAGEMENT REPORTFinancing
73
GR
OU
P M
AN
AG
EM
EN
T R
EP
OR
T
Financial liabilities – type of interest rate as of 31 December 2019
Bonds The outstanding nominal value of the bonds totalled EUR 797.2 million as of 31 December 2019 (31 December 2018: EUR 297.2 million). It is attributable to the convertible bond issued in January 2017 with a term ending in 2024 and a put option for the investors at the nominal amount in 2022 as well as a corporate bond that was issued in January 2019 and has a term ending on 27 January 2023.
The development of the bonds in 2019 is shown below:
ISIN MaturityInterest
rate in %
Nominal value as of
31 Dec. 2018in TEUR
Repurchases/ redemptions/ conversions/
new issues 2019 in TEUR
Nominal value as of
31 Dec. 2019in TEUR
Corporate bond 2019–2023 XS1935128956 27 Jan. 2023 2.63% 0 500,000 500,000Convertible bond 2017–2024 XS1551932046 24 Jan. 20221 1.50%2 297,200 0 297,200IMMOFINANZ 2.21% 297,200 500,000 797,200 1 Put option expires in 2022; end of the bond term in 2024 2 Coupon reduced by 50 basis points to 1.50% as of 24 January 2019 following the receipt of an investment grade rating
The dividend payment of EUR 0.85 per share in May 2019 resulted in an adjustment of the conversion price for the convertible bond 2017–2024 to EUR 21.3772 (31 December 2018: EUR 22.2000). The IMMOFINANZ share closed at EUR 23.90 on 31 December 2019, and the convertible bond was therefore “in the money” at the end of the 2019 financial year.
In connection with the issue of the corporate bond, IMMOFINANZ AG has committed to comply with standard financial covenants. These covenants will be calculated on the basis of the consolidated IFRS financial statements.
Financial covenant Threshold Value as of
31 Dec. 2019 Net Debt to Value Ratio1 Max. 60.0% 44.3%Secured Net Debt to Value Ratio1 Max. 45.0% 30.3%Interest Coverage Ratio Min. 150.0% 479.2% 1 These values are based on the latest calculation as per the bond terms on or before 31 December 2019.
Floating interest rate, thereof hedged59.6%
Floating interest rate9.3%
Fixed interest rate31.1%
Hedging quota90.7%

IMMOFINANZ AGAnnual Report 2019
74
Business Development IMMOFINANZ successfully continued its strong earnings performance and significantly strengthened its earning power during 2019. Rental income rose by 18.1% (including reclassifications within the results of asset management following the initial application of IFRS 16) to EUR 279.9 million. After an adjustment for the IFRS 16 effects, the increase equalled 11.2%. The decline in rental income resulting from the sale of non-strategic properties was more than offset by acquisitions – e.g. two prime office properties in Warsaw and Prague – and by completions. The results of asset management increased by 19.1% to EUR 207.3 million. The valuation results from standing investments were substantially higher at EUR 195.7 million and, as a consequence, the operating profit more than doubled to EUR 345.6 million. Net profit grew by 61.9% to EUR 352.1 million, and FFO 1 from the standing investment business improved by 30.2% to EUR 137.4 million.
Income statement A condensed version of the consolidated income statement is presented below:
All amounts in TEUR 2019 20181
Rental income 279,879 236,905Results of asset management 207,339 174,047Results of property sales -5,079 27,201Results of property development -12,377 -4,332Other operating income 6,156 6,140Other operating expenses -46,144 -49,949Results of operations 149,895 153,107Revaluation result from standing investments and goodwill 195,683 5,955Operating profit (EBIT) 345,578 159,062Financial results 4,473 44,240Earnings before tax (EBT) 350,051 203,302Net profit for the period from continuing operations 347,517 217,297Net profit or loss from discontinued operations 4,602 250Net profit or loss 352,119 217,547 1 The prior year data were adjusted.
Results of asset management The results of asset management include rental income, other revenues, operating income and operating costs as well as the expenses directly attributable to investment property. Rental income rose by 18.1%, or EUR 43.0 million, to EUR 279.9 million in 2019. After an adjustment for reclassifications of EUR 16.4 million within the results of asset management following the initial application of IFRS 16, the increase equalled EUR 26.6 million, or 11.2%, to EUR 263.5 million. The margin equalled 79.0% (adjusted results of asset management/adjusted rental income; 2018: 75.6%) after an adjustment for the IFRS 16 effects and personnel expenses from the asset management business.
Property expenses totalled EUR -57.4 million and were 10.2% lower than the previous year (2018: EUR -64.0 million). The vacancy costs included in operating expenses fell by 4.4% to EUR -8.2 million. In total, the results of asset management improved by 19.1% to EUR 207.3 million (2018: EUR 174.0 million).
Results of property sales and property development The results of property sales amounted to EUR -5.1 million, whereby the previous year included a substantial positive effect from the recycling of accumulated historical foreign exchange differences to the income statement (2018: EUR 27.2 million). The implementation of the portfolio strategy continued in 2019 with property sales totalling EUR 175.1 million (asset and share deals).

GROUP MANAGEMENT REPORTBusiness Development
75
GR
OU
P M
AN
AG
EM
EN
T R
EP
OR
T
The results of property development totalled EUR -12.4 million (2018: EUR -4.3 million) and were influenced, among others, by higher construction costs for development projects and expenses for real estate inventories.
Results of operations Other operating expenses amounted to EUR -46.1 million and were 7.6% lower than the previous year (2018: EUR -49.9 million). The results of operations totalled EUR 149.9 million for the 2019 financial year (2018: EUR 153.1 million).
Revaluation Results from the revaluation of investment property and goodwill increased significantly to EUR 195.7 million (2018: EUR 6.0 million). This improvement was supported, above all, by the sound market development in Germany and Austria as well as positive trends on the other IMMOFINANZ core markets in the CEE region.
Financial results and taxes Financing costs amounted to EUR -64.6 million and were 5.6% lower than the previous year (2018: EUR -68.4 million) in spite of the higher financing volume (plus 16.6%) that resulted from property acquisitions. Average financing costs, including hedging, fell to 1.91% per year (31 December 2018: 2.14%). Other financial results equalled EUR -9.0 million and were higher than the previous year (2018: EUR -2.5 million), primarily due to the valuation of interest rate derivatives in the current low-interest environment.
The share of profit/loss from equity-accounted investments amounted to EUR 78.4 million (2018: EUR 108.2 million). The S IMMO investment represented the main component in 2019 (EUR 76.9 million), whereby EUR 90.1 million were attributable to the previous investment in CA Immo in 2018. Financial results were again positive and amounted to EUR 4.5 million (2018: EUR 44.2 million).
Net profit Net profit from continuing operations improved by a substantial 59.9% to EUR 347.5 million (2018: EUR 217.3 million). The results of discontinued operations were positively influenced, above all, by tax reimbursements from Russia in the first quarter and equalled EUR 4.6 million (2018: EUR 0.3 million). As reported in connection with the sale of the Russian portfolio to the FORT Group at the end of 2017, IMMOFINANZ participated in a positive outcome of proceedings for the reimbursement of withholding and property taxes.
Net profit rose by 61.9% to EUR 352.1 million in 2019 (2018: EUR 217.5 million). Basic earnings per share equalled EUR 3.37 (2018: EUR 1.97) and diluted earnings per share EUR 3.03 (2018: EUR 1.80).

IMMOFINANZ AGAnnual Report 2019
76
Funds from operations (FFO) The development of sustainable funds from operations, an important profitability indicator for the real estate branch, underscores IMMOFINANZ’s stronger earning power. FFO 1 from the standing investment business (before tax and including the dividend from S IMMO) rose by 30.2% to EUR 137.4 million (2018: EUR 105.6 million). With these results, IMMOFINANZ exceeded the increased guidance for FFO 1 announced in August 2019 – which was set at more than EUR 128.0 million – by 7.4%. FFO 1 per share (before tax) increased by 34.4% to EUR 1.29 (2018: EUR 0.96), including the respective dividend payments from S IMMO (in 2019) and CA Immo (in 2018).
After the inclusion of future interest payments for the corporate bond 2023 which was issued in January 2019 (coupon: 2.625%, first coupon payment in January 2020), FFO 1 adjusted over the quarters for this effect (before tax, including the S IMMO dividend) equals EUR 125.3 million or EUR 1.18 per share.
Funds from operations (FFO) All amounts in TEUR P&L 2019 Adjustments FFO 2019 FFO 2018 Results of asset management 207,339 423 207,762 174,375Results of property sales -5,079 5,079 Results of property development -12,377 12,377 Other operating income 6,156 -3,059 3,097 5,519Other operating expenses -46,144 3,248 -42,896 -37,324Results of operations 149,895 18,068 167,963 142,570Other revaluation results 195,683 -195,683 Operating profit (EBIT) 345,578 -177,615 167,963 142,570
Financing costs -64,558 Financing income 1,179 Foreign exchange differences -1,510 Other financial results -9,018 Net profit or loss from equity-accounted investments 78,380
Financial results 4,473 -48,638 -44,165 -57,536Earnings before tax (EBT)/ FFO 1 before tax (excl. S IMMO/CA Immo) 350,051 -226,253 123,798 85,034FFO 1 per share before tax in EUR 1.16 0.77 Dividends from S IMMO/CA Immo 13,650 20,552EBT/FFO 1 before tax incl. S IMMO/CA Immo 137,448 105,586FFO 1 per share before tax incl. S IMMO/CA Immo in EUR 1.29 0.96 Including accrued interest on the bond 2023 FFO 1 before tax (incl. S IMMO/CA Immo) 137,448 Accrued interest corporate bond 2023 -12,118 -12,118 FFO 1 before tax (incl. S IMMO/CA Immo) adjusted 125,330 FFO 1 per share adjusted for accrued interest in EUR 1.18 Number of shares (as per EPS formula) for the calculation: 106,567,143 110,243,185

GROUP MANAGEMENT REPORTBusiness Development
77
GR
OU
P M
AN
AG
EM
EN
T R
EP
OR
T
Balance sheet The condensed balance sheet is shown below:
All amounts in TEUR 31 Dec. 2019 in % 31 Dec. 2018 in % Investment property 4,985,257 3,893,568 Property under construction 199,439 83.6% 397,540 75.3%Real estate inventories 868 46,932 Assets held for sale 154,622 57,162 Other assets 55,771 0.9% 107,413 1.8%Equity-accounted investments 478,191 7.5% 397,671 6.8%Trade and other receivables 169,826 2.7% 305,628 5.2%Cash and cash equivalents 341,161 5.3% 631,754 10.8%Assets 6,385,135 100.0% 5,837,668 100.0% Equity 2,937,145 46.0% 2,800,341 48.0%Liabilities from convertible bonds 285,807 4.5% 284,638 4.9%Financial liabilities 2,580,381 40.4% 2,140,884 36.7%Trade and other payables 197,667 3.1% 199,025 3.4%Other liabilities 108,849 1.7% 74,050 1.3%Deferred tax liabilities 275,286 4.3% 338,730 5.8%Equity and liabilities 6,385,135 100.0% 5,837,668 100.0%
The value of the property portfolio amounted to EUR 5.3 billion and represented 83.6% of total assets as of 31 December 2019. These properties are reported on the balance sheet under the following positions: investment property, property under construction, real estate inventories and non-current assets held for sale. Non-current assets held for sale include properties as well as other assets which will be transferred to the buyer in the event of a sale.
Investment property increased by EUR 1.1 billion to EUR 5.0 billion during the 2019 financial year. This growth resulted, above all, from the acquisition of two office properties in Warsaw and Prague during the third quarter of 2019. It also reflected the acquisition of a retail park portfolio and the reclassification of completed development projects in Germany. The application of IFRS 16 led to an increase of EUR 63.5 million in investment property.
The equity-accounted investments totalled EUR 478.2 million, whereby EUR 474.7 million are attributable to S IMMO. Based on the roughly 19.5 million shares held by IMMOFINANZ, the book value of the S IMMO share equals EUR 24.3.
Financial liabilities rose by EUR 439.5 million, or 20.5%, year-on-year to EUR 2.6 billion in 2019. Of this total, EUR 65.4 million are attributable to lease liabilities and reflect the initial application of IFRS 16. The remaining increase is related primarily to financing for acquisitions made during the third quarter (above all, the Warsaw Spire). In the first quarter of 2019, IMMOFINANZ issued an unsecured corporate bond with a volume of EUR 500.0 million; the net proceeds were used to refinance existing secured financial liabilities and for general corporate purposes.

IMMOFINANZ AGAnnual Report 2019
78
EPRA Financial Indicators IMMOFINANZ is a member of the European Public Real Estate Association (EPRA), the interest group for listed real estate companies which is headquartered in Brussels. EPRA’s mission is to promote, develop and represent the European public real estate sector. Its objectives are achieved through the provision of better information to investors and stakeholders, active involvement in the public and political debate, improvement of the general operating environment, promotion of best practices and the cohesion and strengthening of the real estate industry.
With its Best Practices Recommendations (EPRA BPR), the EPRA has created a standardised framework for improving the comparability between real estate companies – above and beyond IFRS. IMMOFINANZ publishes detailed information on the EPRA indicators based on these recommendations as part of its commitment to full transparency. The non-financial statement (starting on page 92) also provides further non-financial indicators on IMMOFINANZ’s performance, including environment and employee-related issues, in line with the principles and criteria defined in the “EPRA Sustainability Best Practices Recommendations Guidelines – Third Version September 2017“.
Net asset value (NAV) and triple net asset value (NNNAV) Net asset value is calculated in accordance with the Best Practices Recommendations issued by the European Public Real Estate Association. The EPRA NAV concept is used to present the fair value of equity on a long-term basis in order to give investors an overview of a company’s sustainable asset position. The calculation of EPRA NAV also includes the undisclosed reserves in real estate inventories as well as the (negative) fair value of derivative financial instruments. Undisclosed reserves are not included in carrying amounts according to IFRS accounting rules, while the (negative) fair values of derivative financial instruments regularly serve as a means of hedging long-term financing so these gains or losses will remain hypothetical as of the balance sheet date. The deferred taxes on these items are included. The EPRA NAV concept also calls for the inclusion of the deferred taxes on investment property which would be incurred when these assets are sold. Goodwill, which arises as a technical figure due to the recognition of deferred taxes on business combinations, is deducted.
Triple net asset value is also calculated in accordance with the EPRA’s Best Practices Recommendations. The calculation of EPRA NNNAV involves an adjustment to reverse the (negative) fair value of derivative financial instruments from the NAV calculation. In addition, financial liabilities are restated at their fair value. Asset deals generally result in the full realisation of deferred taxes, while the assumption for sales through share deals is that IMMOFINANZ will (economically) bear 50% of the deferred tax liabilities.
The EPRA NNNAV calculation also includes the deferred taxes from the adjustments to derivative financial instruments and from the fair value measurement of financial liabilities. The objective is to give investors an overview of the current value of all assets and liabilities.

GROUP MANAGEMENT REPORTEPRA Financial Indicators
79
GR
OU
P M
AN
AG
EM
EN
T R
EP
OR
T
The results of the NAV and NNNAV calculations are shown below:
31 December 2019 31 December 2018
in TEUR in EUR per share in TEUR in EUR per share Equity excl. non-controlling interests 2,960,094 2,816,934 Diluting effects of convertible bond 2024 285,807 0 Diluted equity excl. non-controlling interests after an adjustment for convertible bonds and the exercise of options 3,245,901 2,816,934
Undisclosed reserves in real estate inventories 2.1 202.0 Fair value of derivative financial instruments 18,311 12,515 Deferred taxes on investment property 327,275 283,502 Deferred taxes on real estate inventories and derivative financial instruments -3,590 -2,641 Goodwill resulting from deferred taxes -24,184 -24,507
Number of shares excl. treasury shares (in 1,000) 100,877 107,143Potential shares (in 1,000) 13,903 0EPRA NAV (diluted) 3,563,715 31.05 3,086,005 28.80Fair value of derivative financial instruments -18,311 -12,515 Effect of fair value measurement of financial liabilities -30,240 -15,499 Deferred taxes on derivative financial instruments and the fair value measurement of financial liabilities 11,150 6,485 Deferred taxes on investment property -10,253 -16,793 EPRA NNNAV (diluted) 3,516,061 30.63 3,047,683 28.44
The diluted EPRA NAV per share rose to EUR 31.05 as of 31 December 2019 (31 December 2018: basic EUR 28.80), and the diluted EPRA NNNAV per share increased to EUR 30.63 (31 December 2018: basic EUR 28.44).
The calculation of the EPRA NAV and EPRA NNNAV as of 31 December 2019 – in contrast to 31 December 2018 – included the diluting effects that would result from the conversion of the IMMOFINANZ convertible bond 2024 because the bond was “in the money” as of that date. The dilution equalled EUR 1.45 per share. The basic EPRA NAV per share would therefore equal EUR 32.49, which would represent a year-on-year increase of 12.8%.
The book value per share rose by 11.6% to EUR 29.34 (31 December 2018: EUR 26.29). After an adjustment for the dividend payment, this represents an increase of 14.8%.

IMMOFINANZ AGAnnual Report 2019
80
EPRA NAV Bridge
1 Number of shares as of 31 December 2018 in thousand: 107,143 (basic) 2 Number of shares as of 31 December 2019 in thousand: 114,780 (diluted)
EPRA earnings per share EPRA earnings per share is a result of operating activities and an important indicator of the extent to which current dividend payments are covered by operating results.
All amounts in TEUR 2019 20181
Weighted average number of shares (in 1,000) 106,567 110,243Net profit or loss from continuing operations excl. non-controlling interests 354,286 218,046Revaluation of investment properties and development properties -197,372 -23,337Results of property sales 5,078 -27,203Goodwill impairment, negative differences and earn-out effects on income 323 100Changes in fair value of financial instruments 8,932 3,845Acquisition costs on share deals 0 22Taxes in respect of EPRA adjustments 19,747 4,994EPRA adjustment in respect of joint ventures and non-controlling interests -142 -5,633EPRA earnings 190,852 170,834EPRA earnings per share in EUR 1.79 1.55 Company-specific adjustments Sale CA Immo 0 -66,067Result from incentivised conversion of the convertible bond 2018 0 19One-time effects in other operating expenses -3,983 12,207Valuation S IMMO -14,350 25,129Foreign exchange gains and losses 1,510 -95Deferred taxes in respect of company-specific adjustments 4,448 7,238Company-specific adjusted EPRA earnings 178,476 149,264EPRA earnings per share after company-specific adjustments in EUR 1.67 1.35 1 The comparative data were adjusted.
EPRA earnings per share rose by 15.6% to EUR 1.79, respectively by 23.7% to EUR 1.67 per share after company-specific adjustments.
28.80 -0.85
-1.45
2.63
1.85
31,0
0.06
31 Dec.20181
Dividend Convertible bonddilution
OthersRevaluationEquity andearnings per share
excl. revaluation
31 Dec.20192
31.05

GROUP MANAGEMENT REPORTEPRA Financial Indicators
81
GR
OU
P M
AN
AG
EM
EN
T R
EP
OR
T
EPRA net initial yield The EPRA net initial yield shows the ratio of annualised rental income, less non-recoverable property expenses (net rental income – projected over a full financial year) to the total portfolio value of the standing investments. For this calculation, the fair values of the properties are increased by the estimated purchasers’ costs. The EPRA net initial yield is a comparative benchmark for portfolio valuation. Its goal is to assist investors in comparing the value of different real estate portfolios.
All amounts in TEUR 2019 2018 Investment property 5,005,974 3,924,486Investment property – proportional share of joint ventures 1,267 54,508
less undeveloped land -166,756 -180,507less undeveloped land – proportional share of joint ventures 0 -1,690
Total property portfolio 4,840,485 3,796,797Allowance for estimated purchasers’ costs 94,874 72,139Gross value of total standing investment portfolio 4,935,359 3,868,936Annualised cash rental income 311,939 248,734Annualised cash rental income – proportional share of joint ventures 0 1,992Non-recoverable property operating expenses -28,452 -34,628Non-recoverable property operating expenses – proportional share of joint ventures -5 -92Annualised net rental income 283,482 216,005EPRA net initial yield 5.7% 5.6%
The EPRA net initial yield increased from 5.6% to 5.7%.
EPRA vacancy rate The EPRA vacancy rate represents the ratio of the estimated market rents for vacant space to the estimated market rents for the entire standing investment portfolio. Its goal is to provide investors with an indicator for evaluating vacancies in the standing investments based on the estimated market rents.
EPRA vacancy rate by core market Standing investments 31 December 2019 31 December 2018 Austria 4.9% 5.5%Germany 1.7% 0.5%Poland 1.7% 4.3%Czech Republic 3.2% 4.0%Hungary 2.8% 4.2%Romania 5.0% 5.0%Slovakia 5.5% 3.4%Other countries 0.7% 0.4%IMMOFINANZ 3.2% 4.1%
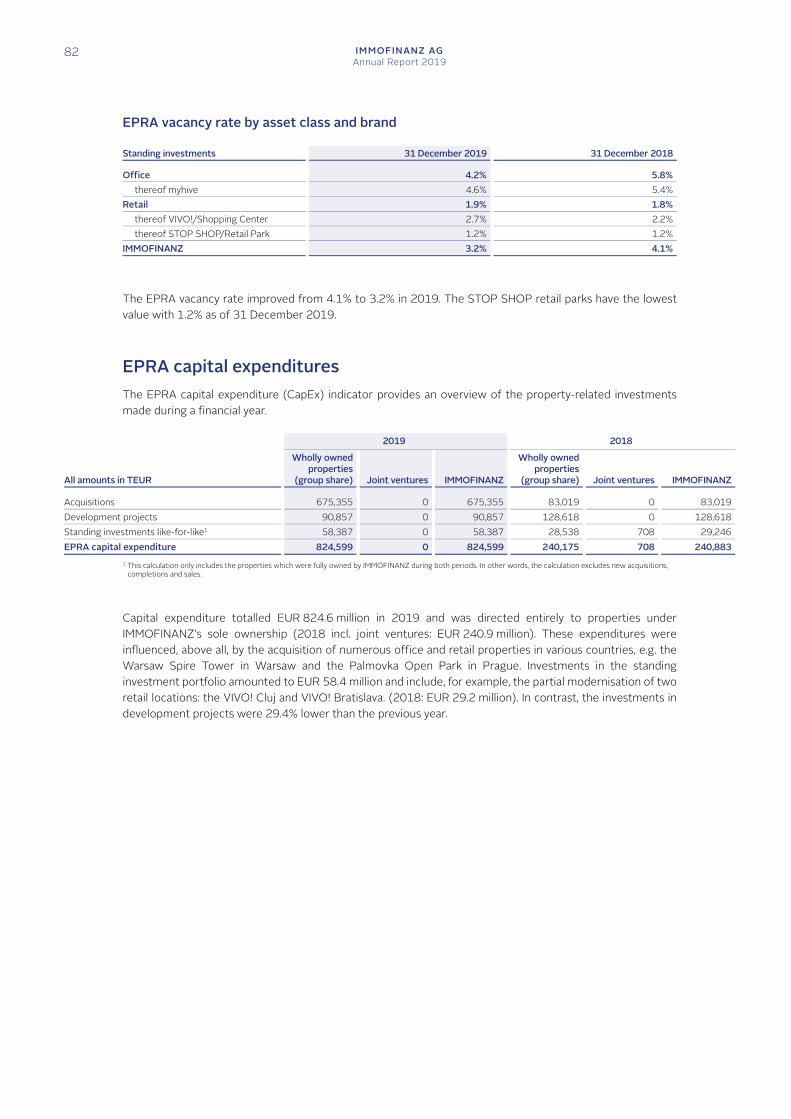
IMMOFINANZ AGAnnual Report 2019
82
EPRA vacancy rate by asset class and brand Standing investments 31 December 2019 31 December 2018 Office 4.2% 5.8%
thereof myhive 4.6% 5.4%Retail 1.9% 1.8%
thereof VIVO!/Shopping Center 2.7% 2.2%thereof STOP SHOP/Retail Park 1.2% 1.2%
IMMOFINANZ 3.2% 4.1%
The EPRA vacancy rate improved from 4.1% to 3.2% in 2019. The STOP SHOP retail parks have the lowest value with 1.2% as of 31 December 2019.
EPRA capital expenditures The EPRA capital expenditure (CapEx) indicator provides an overview of the property-related investments made during a financial year.
2019 2018
All amounts in TEUR
Wholly owned properties
(group share) Joint ventures IMMOFINANZ
Wholly owned properties
(group share) Joint ventures IMMOFINANZ Acquisitions 675,355 0 675,355 83,019 0 83,019Development projects 90,857 0 90,857 128,618 0 128,618Standing investments like-for-like1 58,387 0 58,387 28,538 708 29,246EPRA capital expenditure 824,599 0 824,599 240,175 708 240,883
1 This calculation only includes the properties which were fully owned by IMMOFINANZ during both periods. In other words, the calculation excludes new acquisitions, completions and sales.
Capital expenditure totalled EUR 824.6 million in 2019 and was directed entirely to properties under IMMOFINANZ’s sole ownership (2018 incl. joint ventures: EUR 240.9 million). These expenditures were influenced, above all, by the acquisition of numerous office and retail properties in various countries, e.g. the Warsaw Spire Tower in Warsaw and the Palmovka Open Park in Prague. Investments in the standing investment portfolio amounted to EUR 58.4 million and include, for example, the partial modernisation of two retail locations: the VIVO! Cluj and VIVO! Bratislava. (2018: EUR 29.2 million). In contrast, the investments in development projects were 29.4% lower than the previous year.

GROUP MANAGEMENT REPORTRisk Report
83
GR
OU
P M
AN
AG
EM
EN
T R
EP
OR
T
Risk Report As an international real estate investor, property owner and project developer, IMMOFINANZ is exposed to a variety of general and branch-specific risks in its business operations. An integrated risk management process provides the Group with a sound basis for the timely identification of potential risks and the assessment of the potential consequences.
Based on the hedging and management instruments currently in use, no material risks can be identified at the present time that could endanger the company’s standing as a going concern. An overall evaluation of the risk situation for the 2019 financial year showed no major changes. The uncertainty factors for IMMOFINANZ and for the entire market environment in the 2020 financial year have increased significantly as a result of the Covid-19 pandemic. The possible effects of Covid-19 are addressed at the end of this risk report.
IMMOFINANZ has anchored the procedures for handling risk in a Group-wide risk management system, which is integrated in business practices and reporting paths and has a direct influence on processes and strategic decisions. Risk management takes place at all levels through internal guidelines, reporting systems and the internal control system (ICS) which is monitored by the internal audit department.
Structure of risk management The goal of risk management is to implement the strategy defined by the Executive Board with a minimum of risk. This implementation transfers the Group’s strategic goals to the operating processes in which the measures for the identification, prevention and management of risks are embedded.
The structure of risk management is based on the rules of the Austrian Corporate Governance Code and the integrated framework of the COSO ERM, an internationally accepted framework concept for the design of risk management systems.
The Executive Board, as a whole, is responsible for risk management in the IMMOFINANZ Group and defines the corporate goals and related risk strategy.
Risk management is a staff function which reports directly to the Chief Financial Officer (CFO). It monitors the corporate risks that are not related to specific business areas, aggregates risk data and reports, and actively supports the business areas and country organisations in the identification of risks and economically feasible countermeasures. Risk management reports regularly to the CFO and each quarter to the Supervisory Board.
At the business area and country organisation levels, the heads of the respective business area or country organisation are responsible for risk management. Risk positions are reported to the Executive Board at least once each quarter by the business area managers and at least twice per year by the country management. Acute risks are reported immediately to the Executive Board.
Committee of Sponsoring Organisations of the Treadway Commission – Enterprise Risk Management; www.coso.org
RESPONSIBILITIES AND REPORTING PATHS
Supervisory Board
Employees Employees Employees
Executive Board
Department heads/Country management Risk management

IMMOFINANZ AGAnnual Report 2019
84
Risk management process The identification of risks is the first step in the risk management process. Every employee is responsible for identifying risks in his or her area of activity. These risks are recorded in a risk catalogue, evaluated and flow into the budgeting process. Risk reporting also includes a review to ensure that all risks are covered.
The business area heads and country managers also use early warning indicators, e.g. visitor frequency measurements or tenant surveys, wherever appropriate.
The identified risks are managed according to their nature and potential effects and, where possible, avoided or directly addressed. In cases where this is not possible, the risks are minimised with economically reasonable measures, transferred to third parties or carried by IMMOFINANZ and monitored continuously.
These risks are aggregated and reported to the Executive Board as part of regular risk communications. Acute material risks must be reported immediately
Risk classification The recorded risks are classified under the following categories: market risk, property-specific risks and business and other risks.
The following section describes the risk areas that are considered significant for IMMOFINANZ and explains the measures implemented to manage the related individual risks. Financial risk factors are described in section 7.2 to the consolidated financial statements.
Market and property-specific risks The development of the real estate markets is dependent on cyclical and macroeconomic factors. The related risks include events on the global financial and capital markets as well as political, micro- and macroeconomic issues in the countries where IMMOFINANZ is active. These factors can have a significant effect on the market value of properties, earnings and development plans as well as investment and sales activities.
Concentration risk and the risk associated with the property portfolio are addressed through the diversification of property investments by sector and region. IMMOFINANZ focuses on two commercial asset classes – office and retail – in Austria, Germany and CEE. In addition to the diversification of the portfolio by sector and region, a differentiated tenant structure is also important for minimising risk. IMMOFINANZ has a balanced and diversified tenant mix.

GROUP MANAGEMENT REPORTRisk Report
85
GR
OU
P M
AN
AG
EM
EN
T R
EP
OR
T
Major market and property-specific risks
Description of risk Effects Measures Rental risks – Loss of income due to vacancies – Proactive rental management (close cooperation
with tenants, high service orientation, continuous optimisation of offering and tenant mix)
– Default on rental payments due to deterioration of economic environment or tenant bankruptcies
– Continuous monitoring of rental status, credit evaluation of tenants, security deposits, diversification of tenants
– Decline in rental income due to intense competition – Selection of attractive locations, granting of incentives for tenants
– Rental price reductions or costly incentives to retain tenants
– Review and release of rental contracts and incentives as per corporate approval guidelines, granting of rental price reductions for a limited period
– Inflation risk – Index clauses in rental contracts – Reduction in income through limitations on use – Investments in quality and maintenance management,
selection of professional service providers Project development risks – A location turns out to be suboptimal in relation to
demand, competitive behaviour or economic power – Market, competitive and site analyses, if necessary
exit from certain regions – Delays in initial rentals – Definition of minimum pre-rental levels – A project cannot be realised as planned, e.g. because
of problems with financing, approvals or historical protection
– Extensive analyses and project planning, timely communications with banks and public authorities, thorough due diligence
– Construction defects lead to delays and higher costs – Continuous monitoring of construction progress and quality
– Problems arise with general contractors or subcontractors
– Selection of experienced business partners and continuous control of all contractors
– A project cannot be realised as planned due to higher costs or delays
– Detailed project organisation, regular cost, quality and schedule controls, variance analyses, selection of experienced partners, transfer of risks
Property valuation risks – High dependence on macroeconomic environment, calculation method and underlying assumptions: decline in valuation due to negative market developments or as a result of lower “return” on the property
– Market studies, analyses and forecasts, portfolio optimisation, continuous maintenance and modernisation
Transaction risks – High dependence on transaction market liquidity: a transaction is not realised as planned, e.g. because the seller drops out or the desired price is not achievable
– Market analyses, legal, economic and technical due diligence, checklists for the transaction process, analysis of effects on the portfolio

IMMOFINANZ AGAnnual Report 2019
86
Major business and other risks
Description of risk Effects Measures Strategic business risks – Increase in similar risks in the portfolio – Diversification by sector and region – Capital market movements make it difficult to raise
equity or debt – Balanced structure of equity and debt
– Loans for projects and transactions are not available – Medium-term planning, capital and liquidity management; investment grade rating provides access to new capital market segment
Financial risks – See note 7.2 to the consolidated financial statements
Legal and tax risks – Legal disputes with tenants, business partners, investors or public authorities
– Continuous monitoring of legal developments, creation of provisions
– Changes in national tax schemes result in subsequent tax liabilities
– Continuous monitoring of legal developments, compliance with disclosure requirements
Organisational risks – IT risks materialise, e.g. failure of technical systems, unauthorised data access or manipulation
– Group-wide IT governance and compliance, continuous updating of security standards, penetration tests, connections to geographically separate back-up data processing facility, strengthen awareness among employees through specialised IT training
– Environmental risks, e.g. extreme weather conditions, natural disasters or man-made damages like ground contamination, can result in damages to properties
– Insurance to cover environmental damages
– HR risks like staff turnover lead to the loss of top performers or capacity bottlenecks
– Personnel development and appropriate remuneration and bonus systems
– Compliance risks materialise, which can result in penalties and damage to the company’s reputation
– Strict compliance with legal regulations and regular training for employees
– Procurement risks, e.g. dependence on suppliers and subcontractor bankruptcies, can lead to supply shortages
– Optimisation of supplier base, development of sourcing strategies, ongoing and comprehensive evaluation of suppliers
– Implementation of digitalisation strategy – Sufficient resources for individual projects, professional project management throughout the Group, proactive management of digitalisation process
Investment risks – Fluctuations in the value of the S IMMO investment – Continuous monitoring and evaluation
Monitoring and control of the risk management system The risk management system is monitored and controlled through two corporate channels. On the one hand, internal audit evaluates the effectiveness of risk management and contributes to its improvement. On the other hand, the auditor reviews the effectiveness of risk management in accordance with C-Rule 83 of the Austrian Corporate Governance Code (in the version released in January 2020) and reports to the Executive Board on the results of this analysis.
Evaluation of the functionality of the risk management system Deloitte Audit Wirtschaftsprüfungs GmbH, Vienna, evaluated the effectiveness of IMMOFINANZ’s risk management system during the period from December 2019 to February 2020. This analysis covered the design and implementation of the measures and organisational procedures instituted by the company, but not their application in the sense of operating effectiveness. Based on the knowledge gained by Deloitte during the related activities, no circumstances were identified that would lead to the assumption that the risk management system instituted by IMMOFINANZ as of 31 December 2019 – based on the comprehensive framework for corporate risk management according to COSO – is not functional.

GROUP MANAGEMENT REPORTRisk Report
87
GR
OU
P M
AN
AG
EM
EN
T R
EP
OR
T
Risks in the 2019 financial year Market and property-specific risks The risks arising from the composition of the portfolio, rentals and project development as well as the purchase and sale of properties remained basically unchanged, in total, compared with the 2018 financial year.
The overall occupancy rate for IMMOFINANZ’s portfolio equalled 96.8% as of 31 December 2019, which represents an increase of 1.0 percentage points since 31 December 2018. The occupancy rate rose to 95.3% (31 December 2018: 93.7%) in the office properties and remained stable at 98.3% (31 December 2018: 98.2%) in the retail properties.
The development projects currently under realisation by IMMOFINANZ (property under construction) have a combined carrying amount of EUR 177.5 million (31 December 2018: EUR 277.5 million), and the outstanding construction costs for these development projects totalled EUR 111.9 million as of 31 December 2019 (31 December 2018: EUR 95.7 million). The pipeline projects, including real estate inventories, had a carrying amount of EUR 173.2 million as of 31 December 2019 (31 December 2018: EUR 221.4 million).
Business and other risks IMMOFINANZ is also exposed to other risks in connection with its business activities. These legal, compliance, environmental, tax and human resources risks remained generally unchanged in comparison with the 2018 financial year.
Information security risks The progressive digitalisation of corporate processes is connected with an increase in the number of information security risks. Data protection therefore represents a key focal point for the IT projects currently in progress. The protection of data outside the company and the sensitive handling of data inside the company have top priority for IMMOFINANZ. In addition to current projects, activities include the creation of greater awareness among employees for data protection and IT security. This goal was reflected in training for all employees on the issue of cybersecurity in 2019. Corporate processes were also evaluated with regard to data security and data protection as part of process management in order to meet the highest security standards. The related efforts were further strengthened with the introduction of the Austrian Data Protection Regulation (“Datenschutzgrundverordnung”, DSGVO) in May 2018, and the probability that a risk will occur in this area is therefore seen as low. Another aspect to improve IT security is Business Continuity Management (BCM). Based on the previously established processes, the risk to critical corporate processes can be considered minimal.
Other legal proceedings In certain East European countries, legal uncertainty could arise in connection with land ownership. This applies, above all, to the VIVO! Cluj shopping center.
Sustainability risks Sustainability risks can have negative effects on corporate interests. Real estate companies like IMMOFINANZ are, for example, increasingly exposed to climate risks as a result of climate change. Sustainability risks are assigned to the respective risk categories as part of risk management and managed within this framework. Detailed information related to the environment, customers/tenants and employees as well as responsible business practices can be found in the non-financial statement (beginning on page 92).
Investments IMMOFINANZ AG acquired 19,499,437 bearer shares in S IMMO AG through share purchase contracts dated 18 April 2018. The transaction closed on 21 September 2018. The S IMMO share is listed in the Prime Segment of the Vienna Stock Exchange and is therefore exposed to market price risks. The equity method is used to account for this investment: as of 31 December 2019, the carrying amount of the S IMMO investment equalled EUR 474.7 million, which represents 7.4% of IMMOFINANZ’s total assets. The purchase of these shares was not financed externally.

IMMOFINANZ AGAnnual Report 2019
88
Features of the internal control system IMMOFINANZ’s internal control system (ICS) comprises a wide range of measures and processes to protect assets and to ensure the accuracy and reliability of accounting. The goal of the ICS is to prevent or identify errors and therefore allow for early correction. The ICS also supports compliance with the major legal directives and the business policies defined by the Executive Board.
The ICS is integrated in individual process flows. The key features of the ICS in accounting processes are the appropriate segregation of duties, the application of the four-eyes principle in all order and invoice release procedures, compliance with internal guidelines (e.g. IMMOFINANZ’s IFRS accounting manual), the review of accounting data by Group controlling for correctness, plausibility and completeness, the integration of preventive and detective controls in processes as well as automatic key controls through specific software settings.
Monitoring by internal audit Internal audit is responsible for the independent review of the effectiveness of the ICS and, in this way, contributes to its quality control. This department also evaluates the effectiveness of risk management and supports its continuous improvement. Based on an annual audit plan approved by the Supervisory Board, the internal audit department independently and regularly reviews operating processes and business transactions. The priorities for this schedule are defined in accordance with risk criteria and organisational goals.
The results of the audits are reported to the IMMOFINANZ Executive Board on a regular basis and to the Supervisory Board twice each year. As part of an annual report, the internal audit department gives an account of its performance and presents a summary of the major audit areas and results.
Risks related to the Covid-19 pandemic In March 2020, the Covid-19 pandemic reached the countries in which IMMOFINANZ owns real estate. The immediate effects involved property-specific risks, e.g. rental income lost due to the government-ordered closing of businesses, special legal regulations for rent cutbacks, and the reduction in rents caused by the declining commercial viability of retail properties (including turnover-based rents). IMMOFINANZ’s project development activities have been affected by the limitations placed on construction which, in turn, are connected with a risk of project delays. Indirect risks can also be expected to materialise in the coming months since the Covid-19 pandemic has led to a significant decline in global economic activity. Included here are the market risks which will be triggered by the general economic slowdown and the related recessionary effects. The yields in individual market segments could also shift over the long term due to changed risk profiles and altered investor expectations for these assets. The property-specific risks resulting from rising vacancies caused by tenant bankruptcies and subsequent risks related to the rental of this vacant space could, in combination with weaker economic activity, make business more difficult. General business risks can also have a negative effect on the company through higher risk premiums on financing caused by the rise in bankruptcies as well as possible distortions on the capital market as the result of an increase in receivables defaults.
IMMOFINANZ is actively working to anticipate all these developments and thereby minimise the impact on the company. Specific measures include extensive, solution-oriented cooperation with tenants to prevent bankruptcies and ensure the rapid resumption of economic activity as well as the protection of the company's long-term liquidity in order to be equipped for potential distortions on the capital market.

GROUP MANAGEMENT REPORTInformation on Equity
89
GR
OU
P M
AN
AG
EM
EN
T R
EP
OR
T
Information on Equity The share capital of IMMOFINANZ AG remained unchanged at EUR 112,085,269.0 as of 31 December 2019. It is divided into 112,085,269 zero par value shares with voting rights, each of which represents a proportional share of EUR 1.00 in share capital.
Treasury shares Holding and buyback of treasury shares IMMOFINANZ and its subsidiaries held a total of 11,208,526 treasury shares, representing a proportional share of EUR 11,208,526.0, or 10%, of share capital as of 31 December 2019. Of this total, 1,500,000 shares are held by IMBEA IMMOEAST Beteiligungsverwaltung GmbH, a wholly owned subsidiary, and 9,708,526 shares directly by IMMOFINANZ. As of 31 December 2018, IMMOFINANZ and its subsidiaries held 4,942,001 treasury shares which represented approximately 4.41% of share capital.
Share buyback programme 2018/2019 IMMOFINANZ repurchased 9,708,526 of its shares, or roughly 8.66% of share capital, between 16 July 2018 and 13 August 2019 as part of the share buyback programme 2018/2019. The weighted average price of these repurchases equalled EUR 22.54 per share, and the total purchase price amounted to EUR 218,804,070.4.
A total of 6,266,525 shares, or roughly 5.59% of share capital, were repurchased for a weighted average price of EUR 22.97 per share between 2 January 2019 and 13 August 2019. The total purchase price for the shares repurchased in 2019 was EUR 143,964,644.9.
The share buyback programme 2018/2019 was based on authorisations by the annual general meetings on 11 May 2018 and on 22 May 2019, both in accordance with § 65 (1) no. 8 of the Austrian Stock Corporation Act.
Development of treasury shares during the 2019 financial year
Date Number of
shares Circumstances/authorisationProportional share
of share capitalPurchase price
in EUR
December 2018 4,942,001
Purchases in share buyback programme 1/2018 and 2018/2019(§ 65 (1) no. 8 of the Austrian Stock
Corporation Act) 4.4% 106,412,628
January–August 2019 6,266,525
Purchases in share buyback programme 2018/2019
(§ 65 (1) no. 8 of the Austrian StockCorporation Act) 5.6% 143,964,645
December 2019 11,208,526 10.0% 250,377,273
Authorisations of the annual general meeting to purchase and sell treasury shares The annual general meeting on 22 May 2019 authorised the Executive Board, with the consent of the Supervisory Board, to repurchase the company’s shares in accordance with § 65 (1) no. 8 and (1b) of the Austrian Stock Corporation Act at an amount equalling up to 10% of share capital for 30 months. The shares may be purchased over the stock exchange or over the counter. The Executive Board was also authorised, with the consent of the Supervisory Board, to exclude the proportional subscription rights of shareholders.
Information on the repurchase of shares as part of the share buyback programme 2018/2019 is provided in the above section.
This annual general meeting also authorised the Executive Board, with the consent of the Supervisory Board, to sell or use treasury shares in another manner than over the stock exchange or through a public offering in accordance with § 65 (1b) of the Austrian Stock Corporation Act for five years, whereby the proportional purchase rights of shareholders can be excluded.

IMMOFINANZ AGAnnual Report 2019
90
Authorised capital The annual general meeting on 11 May 2018 authorised the Executive Board, with the consent of the Supervisory Board, pursuant to § 169 of the Austrian Stock Corporation Act to increase the company’s share capital by up to EUR 50,000,000.0 through the issue of up to 50,000,000 new shares (i.e. 5,000,000 new shares after the 10:1 reverse stock split) in exchange for cash or contributions in kind. The authorisation is valid up to 19 June 2023. This authorised capital may also be issued under the exclusion of subscription rights, e.g. in connection with a capital increase in exchange for cash contributions of up to EUR 11,208,526.0 (i.e. 10% of share capital) as well as for contributions in kind, the fulfilment of greenshoe options or the settlement of peak amounts up to EUR 22,417,053.0 (i.e. 20% of share capital). The 20% limit also includes any new shares to be delivered in connection with the exchange or subscription rights of a convertible bond that was issued during the term of the authorised capital under the exclusion of subscription rights.
This authorisation has not been used to date and is therefore available in full.
Change of control provisions Convertible bond 2024 In accordance with the issue terms of the convertible bond 2024 (issued in January 2017), the conversion price will be reduced in line with the remaining term of the bond when a controlling investment (also taking into account the reduced threshold defined by the articles of association) in the company, as defined in the Austrian Takeover Act, is acquired. The bondholders are also entitled to tender their securities and to demand immediate repayment at the nominal value plus accrued interest as of the respective date. Details on these provisions are provided in the terms and conditions for the convertible bond 2024 (also see note 4.13 in the consolidated financial statements).
Corporate bond 2023 In accordance with the issue terms of the EUR 500 million bond 2023, issued in January 2019, the bondholders are entitled under the following circumstances to put their bonds and demand immediate repayment at 101% of the nominal value plus accrued interest as of the respective date. This provision takes effect when a controlling investment (also taking into account the reduced threshold defined by the articles of association) in the company, as defined in the Austrian Takeover Act, is acquired and results in a mandatory takeover offer. Details on these provisions are provided in the terms for the bond 2023.
Margin loan IMMOFINANZ arranged for a margin loan of EUR 140 million in September 2018 to serve as partial financing for the acquisition of an investment in S IMMO AG. The related contract included cancellation rights for the lender in the event of a change of control. The loan was repaid in full at the beginning of February 2019.
Property financing The property financing concluded by IMMOFINANZ and its subsidiaries generally includes standard market cancellation rights for the lenders in the event of a change of control.
Executive Board and Supervisory Board The employment agreements with the members of the Executive Board include change of control clauses that may lead to the cancellation of a contract. The company and the members of the Executive Board have concluded compensation agreements that will take effect when a controlling investment (also taking into account the reduced threshold defined by the articles of association) in the company, as defined in the Austrian Takeover Act, is acquired. Depending on the remaining term of the Executive Board member, the respective contract entitlement will equal two years at most.
There are no such agreements for the members of the Supervisory Board or for employees.
The company has no other significant agreements which would enter into force, change or terminate in the event of a change of control that results from a takeover bid.

GROUP MANAGEMENT REPORTInformation on Equity
91
GR
OU
P M
AN
AG
EM
EN
T R
EP
OR
T
Amendments to the articles of association, board appointments and dismissals In accordance with § 21 of the articles of association of IMMOFINANZ AG, the annual general meeting passes its resolutions based on a simple majority of the votes cast and, for resolutions that require a majority of capital, based on a simple majority of the share capital represented at the time of voting, unless legal regulations require a different majority. The same applies to amendments to the articles of association and to the premature dismissal of members from the Supervisory Board.
The person chairing the respective meeting casts the deciding vote in the event of a tie in voting on the Supervisory Board in accordance with the articles of association. This also applies to the election to and dismissal of members from the Executive Board.
The Corporate Governance Report included in this annual report, which was expanded to the consolidated Corporate Governance Report, is available on the company’s website under www.immofinanz.com.
Significant holdings Information reported to the company and directors’ dealings reports show the following investments and attributed voting rights under stock corporation law which exceeded 4% of share capital as of 31 December 2019:
– S IMMO AG (through CEE Immobilien GmbH): 11.94% – FRIES Family Foundation (through IFF Beteiligungs GmbH) and Rudolf Fries: 5.7%
The scope of the investment was determined on the basis of the shares held by the FRIES Family Foundation (through IFF Beteiligungs GmbH) and shares held
directly by Rudolf Fries for which a shareholding notification (4% threshold) (IFF Beteiligungs GmbH) and directors‘ dealings reports were filed. In contrast to previous reports, this number does not include additional shares held by companies attributable to and members of the Fries family which are not subject to legal reporting requirements. On 28 February 2020, IFF Beteiligungs GmbH and Rudolf Fries announced that they had sold 6,097,680, respectively 254,500 IMMOFINANZ shares. The sale price indicated in the directors‘ dealings reports was EUR 29.50 per share.
Furthermore, we were notified through reports on 28 February 2020 that CARPINUS Holding GmbH (in the future: RPPK Immo GmbH) had purchased a total of 12,000,000 IMMOFINANZ shares which represent an investment of roughly 10.71%. The indirect shareholders of CARPINUS Holding GmbH are Peter Korbačka and the RPR private foundation (Ronny Pecik).

IMMOFINANZ AGAnnual Report 2019
92
Consolidated Non-financial Statement for the 2019 Financial Year The core business of IMMOFINANZ is the management and development of retail and office properties in selected Central and East European countries. The portfolio comprised 213 properties with a total value of EUR 5.1 billion as of 31 December 2019. Activities in the office sector are focused on the international myhive brand as well as other office buildings – e.g. for occupancy by single tenants – in the capital cities of the core countries and the major office locations in Germany. The office portfolio was responsible for 63.8% of the total portfolio value and 53.3% of the rental income from the standing investments at the end of the 2019 financial year. The expansion of the retail portfolio is based on the STOP SHOP and VIVO! brands which are designed, above all, for secondary and tertiary cities. The retail portfolio was responsible for 33.6% of the total portfolio value and 46.0% of the rental income from the standing investments at year-end 2019. IMMOFINANZ’s goal is to compile and maintain a high-quality, profitable portfolio of commercial properties. Additional details are provided under “Portfolio report”.
About this report IMMOFINANZ has not been required to issue a consolidated non-financial statement/consolidated non- financial report in accordance with § 267a (1) of the Austrian Commercial Code since the 2019 financial year. However, as company of interest to the general public, IMMOFINANZ is voluntarily issuing a non-financial statement in accordance with § 267a of the Austrian Commercial Code.
Non-financial performance indicators The consolidated non-financial statement provides information on the non-financial performance indicators (in acc. with § 267 (2) of the Austrian Commercial Code).
The following table presents an overview of the pages in this annual report which include the non- financial performance indicators, including data on environmental and employee-related issues, required by § 267 (2) of the Austrian Commercial Code. It also indicates where the corresponding information can be found on the voluntary non-financial statement prepared according to § 267a of the Austrian Commercial Code. Recognised frameworks were used to meet legal requirements. Additional information on these frameworks is provided in the section on Reporting standards (see page 93)
IMMOFINANZKey non-financial performance indicators, incl. information on the following subject areas1
Material topics for IMMOFINANZ Reference EPRA Code GRI Code
Environmental issues Responsibility towards the environment
96–101, 113
Elec-Abs, DH&C-Abs, Fuels-Abs, Energy-Int, GHG-Dir-Abs, GHG-Indir-Abs, GHG-Int, Water-Abs, Water-Int, Cert-Tot
302-1, 302-2, CRE1, 305-1, 305-2, 305-3, CRE3, 303-1, CRE2, CRE8
Employee-related issues Responsibility towards employees
104–108 Diversity-Emp, Emp-Training, Emp-Dev, Emp-Turnover
102-41, 401-1, 403-2, 404-1, 404-3, 405-1
Social issues2 Responsibility towards tenants and customers
102–104 Comty-Eng, H&S-Asset, H&S-Comp
413-1, 416-2
Respect for human rights2 Responsible business practices
108–110 204-1, 406-1
Fight against corruption and bribery2 Responsible business practices
109–111 Gov-Board, Gov-Select, Gov-CoI
205-2, 205-3, 206-1, 418-1, 415-1
1 Management report in acc. with § 267 (2) of the Austrian Commercial Code 2 Voluntary non-financial statement in acc. with § 267a of the Austrian Commercial Code

GROUP MANAGEMENT REPORTConsolidated Non-financial Statement
93
GR
OU
P M
AN
AG
EM
EN
T R
EP
OR
T
Reporting limits & coverage This report covers IMMOFINANZ AG and all consolidated subsidiaries (see section 8 in the Consolidated financial statements). The portfolio comprised 213 properties as of 31 December 2019, whereby 170 prop-erties formed the basis for NFI reporting due to the availability of a monitoring system. The properties were included in the report based on the financial control principle.
Reporting standardsThe reported indicators are based on the EPRA (European Public Real Estate Association) Sustainability Best Practices Recommendations Guidelines (2017); the selected indicators are listed in an index on page 111 of the non-financial report. The report was also prepared in line with the GRI Standards for sustainability reporting which were issued by the Global Reporting Initiative. The GRI reporting option “GRI referenced” was applied; the GRI Standards were therefore only used selectively for specific disclosures. The selected indica-tors can be found in the GRI Index (see page 112).
Performance indicatorsEnvironmental indicators – portfolioThe portfolio presentation is based on asset classes (office and retail). The indicators cover 68 office properties with approximately 1.2 million sqm of rentable space in total and 102 retail properties with approximately 980,000 sqm (thereof 85 STOP SHOPs and 10 VIVO!). Due to the different availability of data, the compre-hensive presentation of consumption indicators is not possible at the present time. The number of included buildings and the coverage rate of the rented space are therefore noted on the respective indicator tables. The consumption data for energy and water is based on utility company invoices. The applicable data was, in part, not available as of 31 December, and the calculation of the energy indicators for 2019 was therefore estimated with prior year values in some cases. The share of estimated values is indicated in the respective tables.
IMMOFINANZ reports on the water and energy consumption of the owner (IMMOFINANZ). When tenants purchase energy and/or water directly from a utility company, the related amounts are not included in this con-sumption because there is no access to the necessary data. In order to permit comparability, the consumption levels are presented as intensity values. Rented space is used in this report since it represents a standardised factor for the different types of building use.
Environmental indicators – own office buildings The indicators for the operation of office buildings used directly by IMMOFINANZ are presented separately. Most of these commercial buildings are owned by IMMOFINANZ and used together with tenants. Statistics on IMMOFINANZ’s energy consumption are not collected separately at the present time, and this data is there-fore extrapolated on the basis of tenant consumption. Buildings rented externally cannot be included in the presentation at the present time because there is no access to the consumption data. Activities are current-ly in progress to extend monitoring. IMMOFINANZ’s own consumption is shown separately in the appendix beginning on page 113. The total office space used by IMMOFINANZ forms the basis for the presentation of intensity values.
CO2 footprintThe calculation of the CO2 footprint is based on the GHG Protocol Corporate Standard. Emissions are pre-sented as CO2-equivalents. The emissions from the combustion of natural gas are calculated using national emission factors. Electricity emissions are based on the applicable country mix or, when available, the supplier mix. Regional data from the utility company is used for district heating; average values are used if this data is not available. For the motor vehicle pool, the current emission factors published by the Austrian Federal Environmental Agency are used.
Employee indicatorsThe indicators in the section Employees are based on the headcount (HC) of all fully consolidated compa-nies as of 31 December (excluding the Executive Board, employees on parental or military leave, students, trainees and young professionals). Indicators calculated on a different basis are designated by a footnote. The underlying data for the calculation of the indicators was generated by IMMOFINANZ’s human resources administration software.
External auditThis report was not subjected to an external audit.

IMMOFINANZ AGAnnual Report 2019
94
Sustainability at IMMOFINANZ
Our understanding of sustainability IMMOFINANZ is one of the leading commercial real estate specialists in Central and Eastern Europe and an active portfolio manager for more than 210 office and retail properties. The size of this portfolio creates a re-sponsibility towards our stakeholders, the environment and society in economic, social and ecological respects.
A corporate code forms the basis for the awareness of our responsibility as well as all entrepreneurial activities and decisions within the company. It defines the decisive attitude and values for responsible management at IMMOFINANZ.
IMMOFINANZ views itself as a partner for its stakeholders and is closely connected, above all, with its ten-ants and their customers through its quality and safety promise. Sustainability aspects are integrated in the planning, construction and operation of our properties in order to meet the needs of our stakeholders and minimise the environmental impact of business activities. Through the use of environmentally friendly tech-nologies and the systematic improvement of the energy efficiency of the portfolios, we are working to reduce the CO2 footprint of our standing investment portfolio.
The fundamental pillar for our actions is formed by our employees. We are committed to creating a work-ing environment throughout the entire company which is characterised by openness and mutual respect. At IMMOFINANZ, the Executive Board is responsible for the strategic orientation and sustainable development of the company. The Supervisory Board accompanies and advises the Executive Board. Future plans include the stronger integration of sustainability issues in management.
The strategic focal points of sustainability management are based on the materiality analysis which was carried out in 2017 (also see page 95–96). The operational implementation of measures represents an integral part of the daily responsibilities of the department and country heads and their staffs. They report to their super visors and/or to the Executive Board on the progress and results of their activities and monitor goal attainment. In addition, important information, issues and data are exchanged on a regular basis at the department head level. Corporate Communications & Investor Relations is responsible for transmitting the relevant information to shareholders and the general public – and is also responsible for the preparation of this non-financial report.
One strategic goal for the coming years is the further development of our sustainability management. In line with the increased monitoring of consumption data in our portfolio, the focus for 2020 will be placed on the continued implementation of measures currently in progress. A separate project group has also been tasked with the preparation of a climate neutrality strategy for IMMOFINANZ.
Our stakeholdersThe core business of IMMOFINANZ covers the rental and management of office and retail properties as well as project development and the sale of real estate. On the one hand, these activities touch basic human needs and, on the other hand, they are also connected with an impact on the environment and society. The continu-ous exchange and acceptance of our business by our various stakeholders is very important for the economic success of our business model. Consequently, we actively include their viewpoints and concerns in the focus of our business and the further development of our offering.
Our most important stakeholders are our tenants, their employees and the people who visit our retail proper-ties, potential tenants, employees, shareholders, investors and analysts, the buyers and sellers of commercial properties and politics at the local and national level. Other interest groups include suppliers and service pro-viders, banks and the media.
We maintain regular contact with our tenants, conduct annual surveys and include tenants’ concerns and wish-es in the further development of our offering. The continuous dialogue with our employees involves surveys, annual employee assessments, various workshops, a lively intranet platform and an active open-door policy throughout the Group. Real estate buyers and sellers can expect fast decision processes as well as reliable and prudent actions from IMMOFINANZ. These groups are treated as dependable partners. We supply our shareholders, investors, analysts, rating agencies and financing banks with transparent and comprehensive

GROUP MANAGEMENT REPORTConsolidated Non-financial Statement
95
GR
OU
P M
AN
AG
EM
EN
T R
EP
OR
T
information and are committed to an open and constructive dialogue. We believe in extensive public relations, hold regular meetings with the press and always work to answer inquiries as quickly as possible.
Close contacts with our suppliers and service providers are an important issue, above all in the design and processing of contracts. Politics, above all at the local level, are an important partner for the realisation of con-struction works and development projects. Our focus here is on a professional exchange with all involved par-ties, where we also attempt to address the concerns of the population and the needs of urban development.
Membership in associations – support for external initiatives IMMOFINANZ is actively involved in numerous initiatives, associations and organisations in the real estate branch and business sector which are dedicated to the advancement of the branch, research and teaching as well as the representation of interests.
We are a member, among others, of the following organisations: Aktienforum, Austrian Council of Shopping Centers, Austrian Proptech Initiative, Cercle Investor Relations Austria, EPRA European Public Real Estate, Handelsverband Retail Association Austria, Industriellenvereinigung, Institut für interne Revision, LBA Leitbetriebe GmbH, Austrian Controller Institute, Polish Council of Shopping Centers, PRVA – Public Relations Verband Austria, RICS – Royal Institution of Chartered Surveyors and Vereinigung österreichischer Projektentwickler.
Materiality analysisThe selection of the focal points for sustainability management, the monitoring of the performance indicators and the content of reporting are based on a materiality analysis which was carried out in 2017 and was also valid for 2019. The subject areas also reflect the specific EPRA recommendations for the real estate branch.
Identification and review of material topicsThe preselection of potential material topics for IMMOFINANZ resulted from the analysis of tenant and em-ployee surveys as well as criteria that represent a focal point for investors and service providers in the ESG area (Environmental Social Governance). Also addressed were subject areas which are regularly reviewed by various rating agencies.
Analysis and prioritisationThe preselected potential material topics were analysed and prioritised in an internal workshop with manag-ers and staff from the following corporate areas: Asset Management Office and Retail, Project Development, Group Procurement, IT, Human Resources, Controlling, Consolidation, Corporate Legal Affairs & Compliance, Research and Corporate Communications & Investor Relations. The first step involved the identification and assessment of the impact of IMMOFINANZ’s products and services on the environment and society. It covered the importance not only for the company, but also for its internal and external stakeholders (shareholders, tenants, employees, suppliers and business partners).
The list of material topics covered the following: energy efficiency and resource conservation in the standing investments and development projects as well as the related savings, sustainable investments in the quality of the standing investment portfolio, sustainability certifications, tenant satisfaction and the related attainment/protection of a high occupancy rate, human resources development and employee satisfaction, diversity in the workforce, responsible procurement policies and compliance and anti-corruption.
The topics identified as material were then assigned to four areas – the environment, tenants/customers, employees and responsible business practices – which form the structure for this sustainability report.
ValidationThe results of the workshops were validated by management.

IMMOFINANZ AGAnnual Report 2019
96
ImplementationThe results of the materiality analysis flow into the further development of concepts and measures related to the material topics and set the focal points for sustainability monitoring and reporting.
The following individual areas of responsibility were defined:Environment IMMOFINANZ is committed to the responsible use of natural resources, the utilisation of climate-friendly technologies, a systematic energy savings strategy, the refurbishment of building substance which is worth preserving and the construction of efficient new buildings. The expansion of sustainability certification, sustainable energy management and the development of a climate-neutral strategy are three of the most important issues in this area.
Customers/tenants Central strategic focal points are the creation and protection of tenant loyalty through high customer satis-faction and the acquisition of new tenants. The IMMOFINANZ brands represent a service and quality promise which support these efforts. Investments in the quality of the properties and strong customer orientation with a wide variety of services are further important issues.
Employees The expertise and commitment of its employees are key requirements for IMMOFINANZ’s long-term success. Numerous activities in the area of human resources create an environment in which talents can optimally develop and cooperation is promoted at all levels.
Responsible business practices IMMOFINANZ is committed to business practices that are based on integrity, honesty, fairness, transparency and responsibility. Compliance and the fight against corruption, a sustainable procurement policy and human rights represent the basis for all activities.
Detailed information on the individual areas, the underlying goals and measures as well as potential risks is provided in the following sections.
Responsibility towards the environment Respect for the environment is an important element in the management and development of our portfolio. We take a proactive approach, use environmentally friendly technologies and work continuously and systemat-ically to improve our company’s environmental efficiency. That not only reduces operating costs and emissions, but also contributes to environmental protection and tenant satisfaction.
Our corporate goals include the steady reduction of energy consumption as well as an increase in the energy efficiency of the standing investment portfolio and the related energy savings. Prior to the start of new activ-ities or projects, the related environmental impact is estimated, and the results are integrated in the decision process. Plans also include the gradual expansion of sustainability certification for development projects and standing investments. These certifications reduce environmental risks and help to improve the environmen-tally friendly use of space as well as increase efficiency.
Potential risks for the environment and society Buildings are a source of greenhouse gas emissions. IMMOFINANZ is therefore working continuously on comprehensive measures to safeguard and improve the energy efficiency in its standing investments. For development projects, energy efficiency becomes an important issue as early as the planning phase. Devel-opment projects or modernisation activities can also have an impact on the environment through the use of harmful building materials. Here IMMOFINANZ makes sure construction is sustainable with highly standardised specifications for buildings and furnishings as well as the careful selection of business partners.
Sustainable energy management Energy efficiency is not only a function of the building itself. On the contrary, the energy consumption in the properties managed by IMMOFINANZ is heavily dependent on tenant behaviour and, to a large extent, lies within tenants’ responsibility. IMMOFINANZ supports efficient behaviour in this area through numerous meas-ures, including communications.

GROUP MANAGEMENT REPORTConsolidated Non-financial Statement
97
GR
OU
P M
AN
AG
EM
EN
T R
EP
OR
T
As a means of optimising energy efficiency, energy auditing was introduced in 2017. Energy consumption in the standing investments is reviewed at regular intervals and appropriate countermeasures are defined. The audits of 33 standing investment properties in 2017 were followed by similar inspections at ten standing in-vestments in 2018 and 15 buildings in Germany, Slovenia, Hungary and Slovakia (approximately 181,000 sqm of rentable space in total) during 2019. Structural and building technology optimisation measures were then implemented with the support of energetic analyses. The goal for 2020 is to carry out energy audits at a min-imum of 15 standing investment buildings.
Opportunities for energy savings are regularly developed in cooperation with the property and facility man-agers. Examples of the results are the conversion to LED lighting and the replacement of cooling equipment. The facility managers are instructed to implement energy optimisation measures as defined in standardised contracts which call for regular energy management and controlling. The goal is to steadily reduce resource consumption, while improving the building quality through energy savings measures and the reasonable use of natural resources.
The expansion of the portfolio led to a year-on-year increase of 1.7% in the total energy consumption during 2019. However, the energy consumption per square meter of rented space was reduced by 10% below the previous year – above all due to substantial savings in the office properties. The total energy consumption in 2019 consisted of 64% electricity, 18% district heating and 19% natural gas. Details on energy consumption are also provided in the table on pages 98–99.
IMMOFINANZ installed its first photovoltaic system in 2019 on the roof of a STOP SHOP retail park in Austria. Pilot projects are also planned in other countries, among others a STOP SHOP in Bratislava, to prepare for the installation of large-scale photovoltaic equipment. IMMOFINANZ is also continuously evaluating additional opportunities for energy reduction and the use of alternative, less CO2-intensive energy sources.
With the photovoltaic equipment at the STOP SHOP in Stockerau (Austria), vacant roof ar-eas are now used for sustainable energy generation. A total of 1,008 photovoltaic modules were installed on roughly 4,000 sqm. The system started operations in the second half of 2019 and delivers alternative energy. The roof of this retail park can generate up to 400,000 KWh of electricity per year at peak performance. That represents the yearly ener-gy consumption of 115 households. IMMOFINANZ wants to increase the share of renewa-ble energy with this project: surplus electricity is fed into the Vienna grid and made available to the general public. This sustainable solar energy can save up to 155 tonnes of CO2 per year – which represents the CO2 emissions of roughly 1.2 million motor vehicle kilometers. Other opportunities are currently under evaluation. This project puts vacant roof areas to practical use and also makes a positive contribution to the carbon footprint.
EXAMPLE
CO2 footprintThe real estate sector contributes to the emission of greenhouse gases, above all through energy consump-tion during the construction and operation of properties. At the same time, climate change has changed the requirements on the technical features and construction of buildings. Current construction must master the effects of global warming, while also minimising the building’s own CO2 emissions.
Contracts have already been concluded for IMMOFINANZ‘s entire standing investment portfolio in Austria (office as well as retail) which require the purchase of green electricity (100% hydropower and green energy). Compared with the average Austrian electricity mix, this will prevent more than 2,000 tonnes of CO2 emissions per year in Austria.
The portfolio’s CO2 footprint can be seen on pages 98–99. The calculation of the CO2 emissions is based on the energy consumption measured by the meter and charged to the tenants. Therefore, the related emissions are classified as indirect (Scope 3). This data shows that the increase in the portfolio led to 7.1% more CO2e compared with the previous year, but an analysis of the CO2e emissions per square meter shows a reduction of 5.2%.

IMMOFINANZ AGAnnual Report 2019
98
Sustainable energy management
CO2 footprint
Total portfolio consumption Office RetailEPRA/GRI Code Unit Indicator Scope 2019 2018 Change 2019 2018 Change 2019 2018 Change
Total energy consumptionGRI 302-2 (2016) kWh Energy Total energy
provided by landlord371,682,239 365,407,379 1.7% 291,693,270 284,460,805 2.5% 79,988,969 80,946,574 -1.2%
Coverage rate rented space (%) 67.6% 65.9% 97.8% 93.3% 31.7% 33.8%Electricity consumptionElec-Abs kWh Electricity Total electricity
provided by landlord236,248,060 228,682,736 3.3% 173,439,970 164,316,559 5.6% 62,808,090 64,366,177 -2.4%
Coverage rate rented space (%) 67.6% 65.9% 97.8% 93.3% 31.7% 33.8%Number of buildings 99/170 90/156 66/68 58/64 33/102 32/92
Share of projections (%) 14.5% 3.4% 14.2% 5.1% 15.2% 0.5%Elec-LfL kWh Electricity Total electricity
provided by landlord194,871,625 204,995,444 -4.9% 135,439,823 143,185,878 -5.4% 59,431,802 61,809,566 -3.8%
Coverage rate rented space (%) 67.6% 98.8 36.1%Number of buildings 76/128 45/46 31/82
Share of projections (%) 11.4% 3.9% 15.6% 6.3% 15.6% 0.5%District heating/cooling consumptionDH&C-Abs kWh District heating Total district heating
provided by landlord66,080,442 64,884,799 1.8% 62,077,504 61,040,088 1.7% 4,002,938 3,844,711 4.1%
Coverage rate rented space (%) 67.6% 65.9% 97.8% 93.3% 31.7% 33.8%Number of buildings 99/170 90/156 66/68 58/64 33/102 32/92
Share of projections (%) 26.1% 1.7% 27.8% 0.8% 18.8% 5.2%DH&C-Lfl kWh District heating Total district heating
provided by landlord52,886,456 53,943,326 -2.0% 48,883,518 50,098,615 -2.4% 4,002,938 3,844,711 4.1%
Coverage rate rented space (%) 67.6% 98.8% 36.1%Number of buildings 76/128 45/46 31/82
Share of projections (%) 27.1% 2.1% 18.8% 1.0% 18.8% 5.2%Fuel consumptionFuels-Abs kWh Natural gas Total natural gas
provided by landlord69,353,737 71,839,844 -3.5% 56,175,796 59,104,158 -5.0% 13,177,941 12,735,686 3.5%
Coverage rate rented space (%) 67.6% 65.9% 97.8% 93.3% 31.7% 33.8%Number of buildings 99/170 90/156 66/68 58/64 33/102 32/92
Share of projections (%) 14.6% 11.1% 10.6% 9.9% 20.4% 12.5%Fuels-Lfl kWh Natural gas Total natural gas
provided by landlord57,629,511 60,604,079 -4.9% 44,451,570 47,868,393 -7.1% 13,177,941 12,735,686 3.5%
Coverage rate rented space (%) 67.6% 98.8% 36.1%Number of buildings 76/128 45/46 31/82
Share of projections (%) 11.8% 6.5% 20.4% 9.1% 20.4% 3.8%Energy intensityEnergy-Int CRE1
kWh/sqm Energy per square meter of rented space
Total energy provided by landlord
256 284 -10.0% 255 291 -12.3% 258 264 -2.0%
Rented space (sqm) 1,452,580 1,284,880 1,142,957 977,893 309,623 306,988
Total portfolio consumption Office RetailEPRA/GRI Code Unit Indicator Scope 2019 2018 Change 2019 2018 Change 2019 2018 ChangeGreenhouse gas emissionsGHG-Indir-Abs GRI 305-3 (2016)
tCO2e Scope 3 emissions Total energy provided by landlord
111,033 103,646 7.1% 87,437 80,098 9.2% 23,596 23,549 0.2%
GHG-Int CRE3
kg CO2e/sqm Scope 3 emissions per square meter of rented space
Total energy provided by landlord
76 81 -5.2% 77 82 -6.6% 76 77 -0.7%
Rented space (sqm) 1,452,580 1,284,880 1,142,957 977,893 309,623 306,988

GROUP MANAGEMENT REPORTConsolidated Non-financial Statement
99
GR
OU
P M
AN
AG
EM
EN
T R
EP
OR
T
Total portfolio consumption Office RetailEPRA/GRI Code Unit Indicator Scope 2019 2018 Change 2019 2018 Change 2019 2018 Change
Total energy consumptionGRI 302-2 (2016) kWh Energy Total energy
provided by landlord371,682,239 365,407,379 1.7% 291,693,270 284,460,805 2.5% 79,988,969 80,946,574 -1.2%
Coverage rate rented space (%) 67.6% 65.9% 97.8% 93.3% 31.7% 33.8%Electricity consumptionElec-Abs kWh Electricity Total electricity
provided by landlord236,248,060 228,682,736 3.3% 173,439,970 164,316,559 5.6% 62,808,090 64,366,177 -2.4%
Coverage rate rented space (%) 67.6% 65.9% 97.8% 93.3% 31.7% 33.8%Number of buildings 99/170 90/156 66/68 58/64 33/102 32/92
Share of projections (%) 14.5% 3.4% 14.2% 5.1% 15.2% 0.5%Elec-LfL kWh Electricity Total electricity
provided by landlord194,871,625 204,995,444 -4.9% 135,439,823 143,185,878 -5.4% 59,431,802 61,809,566 -3.8%
Coverage rate rented space (%) 67.6% 98.8 36.1%Number of buildings 76/128 45/46 31/82
Share of projections (%) 11.4% 3.9% 15.6% 6.3% 15.6% 0.5%District heating/cooling consumptionDH&C-Abs kWh District heating Total district heating
provided by landlord66,080,442 64,884,799 1.8% 62,077,504 61,040,088 1.7% 4,002,938 3,844,711 4.1%
Coverage rate rented space (%) 67.6% 65.9% 97.8% 93.3% 31.7% 33.8%Number of buildings 99/170 90/156 66/68 58/64 33/102 32/92
Share of projections (%) 26.1% 1.7% 27.8% 0.8% 18.8% 5.2%DH&C-Lfl kWh District heating Total district heating
provided by landlord52,886,456 53,943,326 -2.0% 48,883,518 50,098,615 -2.4% 4,002,938 3,844,711 4.1%
Coverage rate rented space (%) 67.6% 98.8% 36.1%Number of buildings 76/128 45/46 31/82
Share of projections (%) 27.1% 2.1% 18.8% 1.0% 18.8% 5.2%Fuel consumptionFuels-Abs kWh Natural gas Total natural gas
provided by landlord69,353,737 71,839,844 -3.5% 56,175,796 59,104,158 -5.0% 13,177,941 12,735,686 3.5%
Coverage rate rented space (%) 67.6% 65.9% 97.8% 93.3% 31.7% 33.8%Number of buildings 99/170 90/156 66/68 58/64 33/102 32/92
Share of projections (%) 14.6% 11.1% 10.6% 9.9% 20.4% 12.5%Fuels-Lfl kWh Natural gas Total natural gas
provided by landlord57,629,511 60,604,079 -4.9% 44,451,570 47,868,393 -7.1% 13,177,941 12,735,686 3.5%
Coverage rate rented space (%) 67.6% 98.8% 36.1%Number of buildings 76/128 45/46 31/82
Share of projections (%) 11.8% 6.5% 20.4% 9.1% 20.4% 3.8%Energy intensityEnergy-Int CRE1
kWh/sqm Energy per square meter of rented space
Total energy provided by landlord
256 284 -10.0% 255 291 -12.3% 258 264 -2.0%
Rented space (sqm) 1,452,580 1,284,880 1,142,957 977,893 309,623 306,988
Total portfolio consumption Office RetailEPRA/GRI Code Unit Indicator Scope 2019 2018 Change 2019 2018 Change 2019 2018 ChangeGreenhouse gas emissionsGHG-Indir-Abs GRI 305-3 (2016)
tCO2e Scope 3 emissions Total energy provided by landlord
111,033 103,646 7.1% 87,437 80,098 9.2% 23,596 23,549 0.2%
GHG-Int CRE3
kg CO2e/sqm Scope 3 emissions per square meter of rented space
Total energy provided by landlord
76 81 -5.2% 77 82 -6.6% 76 77 -0.7%
Rented space (sqm) 1,452,580 1,284,880 1,142,957 977,893 309,623 306,988

IMMOFINANZ AGAnnual Report 2019
100
Total portfolio consumption Office RetailEPRA/GRI Code Unit Indicator Scope 2019 2018 Change 2019 2018 Change 2019 2018 ChangeWater consumptionGRI 303-1 (2016) Water-Abs
Liter Water from municipal sources Total water provided by landlord
699,082,226 684,862,823 2.1% 544,549,786 520,395,703 4.6% 154,532,440 164,467,120 -6.0%
Coverage rate rented space (%) 67.6% 65.9% 97.8% 93.3% 31.7% 33.8%Number of buildings 99/170 90/156 66/68 58/64 33/102 32/92
Share of projections (%) 27.5% 5.4% 31.9% 6.9% 20.1% 2.9%Water-Lfl Liter Water from municipal sources Total water
provided by landlord639,815,107 626,233,763 2.2% 492,922,577 476,167,643 3.5% 146,892,530 150,066,120 -2.1%
Coverage rate rented space (%) 67.6% 98.8% 36.1%Number of buildings 76/128 45/46 31/82
Share of projections (%) 24.1% 7.5% 18.6% 10.5% 18.6% 3.1%Water intensityCRE2 Water-Int Liter/sqm Liter per square meter
of rented spaceTotal water provided by landlord
481 535 -10.0% 476 532 -10.5% 499 544 -8.2%
Rented space (sqm) 1,452,580 1,280,484 13.4% 1,142,957 977,893 16.9% 309,623 302,591 2.3%
EPRA Code LEED BREEAM Greenbuilding Total certified buildings Change in total (%)
Cert-TotCRE8
2019 2018 2019 2018 2019 2018 2019 2018Number of certified buildings 9 7 19 13 0 1 28 21 33.3%Certified area (sqm) 143,923 96,237 450,277 341,716 0 34,022 594,200 471,975 25.9%Share of certified area in the standing investment portfolio1
7.0% 5.2% 22.0% 18.6% 0,0% 1.8% 29.0% 25.7% 3.3%
1 The above certified area also includes the space in properties held for sale, in contrast to the data provided in the portfolio report.
Water consumption
Sustainability certifications
Water consumption The water consumption in buildings is heavily dependent on tenant behaviour and, consequently, largely out-side IMMOFINANZ’s control. However, measures to reduce consumption have been identified together with the property und facility managers. One example is the upgrading of washbasins with aerators which reduce the waterflow.
The total water consumption rose by 2.1% year-on-year due to the increase in the portfolio, but the consump-tion per square meter of supply area was reduced by 10% (for details see pages 100–101).
MobilityIMMOFINANZ is working to meet the rising demand by tenants for sustainable mobility offerings. Activities in-clude, for example, the installation of e-charging stations and weatherproof bicycle parking areas at all myhive office locations. Cooperation agreements have also been reached at individual locations with companies that provide car sharing, scooters, e-bikes and e-scooters. A survey was conducted during the past year at the myhive am Wienerberg office location in Vienna – which has a total of 3,400 employees – and will be used to optimise the current mobility offering.
Sustainability certifications Certification according to environmental standards is currently planned for development projects and standing investments in the office and VIVO! portfolios. Office buildings are generally certified according to BREEAM and LEED, while shopping centers are generally certified under BREEAM.
BREEAM (BRE Environmental Assessment Method) is the leading and most frequently used certification method for buildings. It defines the highest standards for sustainable design and has become the de facto benchmark for describing the environmental impact of a building. In 2019 several IMMOFINANZ office build-ings received BREEAM or LEED certification, including the FLOAT in Düsseldorf as well as the myhive Crown Point, myhive Crown Tower and myhive Park Postepu in Warsaw.

GROUP MANAGEMENT REPORTConsolidated Non-financial Statement
101
GR
OU
P M
AN
AG
EM
EN
T R
EP
OR
T
Total portfolio consumption Office RetailEPRA/GRI Code Unit Indicator Scope 2019 2018 Change 2019 2018 Change 2019 2018 ChangeWater consumptionGRI 303-1 (2016) Water-Abs
Liter Water from municipal sources Total water provided by landlord
699,082,226 684,862,823 2.1% 544,549,786 520,395,703 4.6% 154,532,440 164,467,120 -6.0%
Coverage rate rented space (%) 67.6% 65.9% 97.8% 93.3% 31.7% 33.8%Number of buildings 99/170 90/156 66/68 58/64 33/102 32/92
Share of projections (%) 27.5% 5.4% 31.9% 6.9% 20.1% 2.9%Water-Lfl Liter Water from municipal sources Total water
provided by landlord639,815,107 626,233,763 2.2% 492,922,577 476,167,643 3.5% 146,892,530 150,066,120 -2.1%
Coverage rate rented space (%) 67.6% 98.8% 36.1%Number of buildings 76/128 45/46 31/82
Share of projections (%) 24.1% 7.5% 18.6% 10.5% 18.6% 3.1%Water intensityCRE2 Water-Int Liter/sqm Liter per square meter
of rented spaceTotal water provided by landlord
481 535 -10.0% 476 532 -10.5% 499 544 -8.2%
Rented space (sqm) 1,452,580 1,280,484 13.4% 1,142,957 977,893 16.9% 309,623 302,591 2.3%
EPRA Code LEED BREEAM Greenbuilding Total certified buildings Change in total (%)
Cert-TotCRE8
2019 2018 2019 2018 2019 2018 2019 2018Number of certified buildings 9 7 19 13 0 1 28 21 33.3%Certified area (sqm) 143,923 96,237 450,277 341,716 0 34,022 594,200 471,975 25.9%Share of certified area in the standing investment portfolio1
7.0% 5.2% 22.0% 18.6% 0,0% 1.8% 29.0% 25.7% 3.3%
1 The above certified area also includes the space in properties held for sale, in contrast to the data provided in the portfolio report.
The certified area totalled approximately 594,200 sqm at the end of 2019, which represents 29.0% of the space in the standing investment portfolio (year-end 2018: 472,000 sqm, resp. 26.0%). That represents a year-on-year increase of 3%. A further eight properties with 220,000 sqm in total were in the certification process or preparing for certification at year-end 2019. In the IMMOFINANZ office portfolio, nearly 68% of the rentable space were certified or preparing for certification at the end of 2019.
Summary and outlookThe IMMOFINANZ portfolio has been the focus of an optimisation and concentration process in recent years, which has led to a focus on two asset classes and three brands as well as the sale of properties that no longer fit with the corporate strategy. The next step began in 2017 with the development of a Group-wide, standard-ised recording process for energy consumption data.
The goal is to continuously reduce resource consumption, while maintaining or improving the quality of build-ing use through energy savings measures. This will help to realise energy savings and reduce the portfolio’s CO2 footprint. Since the beginning of the 2020 financial year, a separate project group has been dealing with measures to make the IMMOFINANZ property portfolio climate-neutral over the long term.
Another objective is to expand the space in the standing investments which is covered by sustainability certifi-cations. Compliance with project development and refurbishment standards is guaranteed by a development process guideline. It applies to all companies in the IMMOFINANZ Group and regulates all construction-related activities.

IMMOFINANZ AGAnnual Report 2019
102
Responsibility towards tenants and customers
The satisfaction of IMMOFINANZ’s tenants is an essential factor for achieving and maintaining high occupancy levels and strong tenant loyalty. This, in turn, is the guarantee for efficient property management. Tenant loyalty through high customer satisfaction and the acquisition of new tenants therefore represent a strategic focus of activities. IMMOFINANZ has issued an asset management process guideline to regulate all processes involving rentals, from the initial contact with the tenant to ongoing tenant support.
Potential risks The loss of a dissatisfied anchor tenant in the retail sector or difficulties in re-letting and the resulting reduc-tion in visitor frequency could have an impact on other tenants or reduce the offering. IMMOFINANZ minimises this risk with a strong customer orientation and proactive rental management. Moreover, IMMOFINANZ is responsible for compliance with legal construction and safety regulations for the protection of building users.
Brand policy and investments in quality The IMMOFINANZ property portfolio follows a clearly defined brand policy: myhive represents the offices of the future, STOP SHOPs are retail parks and VIVO! are full-featured shopping centers. These brands are a quality promise to tenants and create security and trust. A high degree of standardisation based on extensive criteria catalogues for presentation, furnishings and design also supports a sustainable procurement policy.
myhive offices are characterised by a pleasant atmosphere in the public areas, a wide range of services and top infrastructure and provide space for communicative and lively interaction between tenants and their employ-ees – for example through attractive communication zones, tenant lounges and regular events like after-work get-togethers, business breakfasts with expert discussions and the organisation of sport activities (also see the detailed description in the brand section).
Networking between tenants is given particularly high priority. Designated community managers are responsi-ble for supporting exchanges between tenants, identifying possibilities for cooperation, brokering the neces-sary contacts and organising events (among others, sport activities). A specially designed, international myhive office app was also introduced. It provides a wide range of information on the latest events in the respective of-fice building and in the myhive community, promotes communication between experts in different companies at the same location and also supports IMMOFINANZ‘s central services, for example through a direct feedback tool. In this way, tenants can register for events, submit suggestions and requests, and also file damage reports quickly and easily.
In order to hold the occupancy rate and customer satisfaction at a high level over the long term, IMMOFINANZ makes targeted investments in the quality of its properties.
The VIVO! Cluj and VIVO! Bratislava underwent extensive modernisation in 2019. At the VIVO! Bratislava, the renovation of 15,000 sqm of rentable space in a former supermarket led to the acquisition of an attractive mix of different retailers for these areas. The new positioning of the shopping center included the redesign of many exterior and interior areas, for example: the facade and lighting concept, an improvement in parking facilities, quiet zones, the installation of additional escalators and the introduction of a new culinary con-cept – the so-called “VIVO! Market“, which expands the shopping center’s gastronomic offering. In the VIVO! Cluj, the modernisation covered roughly 22,000 sqm as well as the addition of new anchor tenants, such as Peek & Cloppenburg, as well as an improved recreational and entertainment offering. The location-specific improvements were made in close coordination with tenants and reflect any special local shopping habits.
Nine “200minutes“ after-work events with more than 2,800 guests in total were held at the myhive am Wienerberg in 2019. The themes included, among others, Carnival, Lent, Spring Awakens, a Retro-Party, a Summer Special, an Oktoberfest, a Halloween party and a concluding Christmas event. This myhive community was also very successful from an athletic standpoint, as can be seen in eleven sporting events and 335 medals. Whether indoors at badminton, soccer, bowling and curling or outdoors at beach volleyball, football, golf or tobogganing – fun and action were always guaranteed. The nine expert breakfasts dealt with subjects like cybersecurity and success strategies and formed the supporting programme for discussions and networking.
EXAMPLE

GROUP MANAGEMENT REPORTConsolidated Non-financial Statement
103
GR
OU
P M
AN
AG
EM
EN
T R
EP
OR
T
The further development of the myhive brand also continued during 2019 to give tenants greater flexibility and support the more sustainable and resource-conserving fit-out of rental space. Modular office layouts and standardised fittings allow for shorter contract terms and eliminate the need for extensive renovation on tenant turnover. A separate myhive office design with partition wall systems and high-quality, functional fur-niture was created for this purpose. The office areas can also be rented together with all-inclusive service, i.e. including infrastructure and IT support as well as cleaning and plant care. This expanded myhive concept will be rolled out gradually to the myhive locations beginning in 2020.
Evaluation of customer satisfaction In addition to one-on-one meetings with tenants, IMMOFINANZ has carried out regular tenant surveys in its office properties for many years to evaluate customer satisfaction. Based on the results, individualised optimi-sation measures are then implemented at the respective locations. The design and expansion of the myhive of-fice brand also reflects the suggestions and requirements defined by these surveys. The tenant survey in 2019 was carried out in all IMMOFINANZ office markets. The focal points included an evaluation of the customer orientation, the assessment of IMMOFINANZ’s image and the satisfaction with employees’ understanding of tenants’ needs. This last point shows the greatest improvement compared with the 2017 survey.
Tenant satisfaction in the retail segment is measured by two different survey methods – qualitative and quan-titative. We meet our most important anchor tenants regularly to evaluate past and future cooperation. At regular intervals, we also survey all our tenants: The analysis conducted in late autumn 2019 also focused on customer orientation, the assessment of IMMOFINANZ’s image and the satisfaction with employees’ under-standing of tenants’ needs. These surveys covered 680 office tenants and 1,700 retail tenants as well as 320 IMMOFINANZ employees in 2019 and will be continued in the coming years.
In the retail sector, visitor surveys are carried out at regular intervals in the shopping centers and retail parks. The focal points include the catchment area, demographic data, purchasing behaviour and the brand recogni-tion of the respective property, satisfaction with the offering and branch mix as well as ideas and suggestions for improvement. These results and conclusions from the frequency counts in the individual retail properties are shared with the tenants and flow into measures to optimise the branch mix, improve the arrangement of tenants and increase frequency.
Customer orientation “Triple 90”, an internal initiative, was launched in 2018 to increase customer orientation throughout the organisation. IMMOFINANZ employees were invited to register for participation in innovation groups, which then developed suggestions to strengthen the focus on customers. The best concepts were announced at the end of 2018 and gradually implemented during 2019. The recommendations include a regular newsletter for tenants with information on progress and developments in the individual IMMOFINANZ brands as well as an internal quiz for employees to increase the knowledge of the portfolio and customers.
Building safetyThe IMMOFINANZ buildings must meet the individual needs of tenants and their customers, but also guar-antee their health and safety. These properties are built and operated in accordance with the applicable legal regulations and adapted whenever necessary, to meet new legal requirements. Building safety directives can include, for example, fire protection measures and emergency exits.

IMMOFINANZ AGAnnual Report 2019
104
In rented buildings, the tenants carry out regular reviews of compliance with legal requirements in their rented areas as part of occupational safety inspections. Any deviations are reported, where necessary, to the facility manager who is responsible for correction of the deficiencies. H&S-Asset; H&S-Comp; GRI 416-2
Summary and outlookIn addition to the above-mentioned measures which include the integration of additional properties in the myhive brand and refurbishments in the VIVO! shopping centers, plans include the strengthening of customer orientation, among others through digitalisation. A mobile application will also be developed to digitalise the accounting process for the expanded myhive office concept.
Responsibility towards employees The expertise and commitment of its employees are key requirements for IMMOFINANZ’s long-term suc-cess. Numerous activities in the area of human resources create an environment where talents can optimally develop and cooperation is promoted at all levels. These activities are directed, in particular, to underscoring IMMOFINANZ’s attractiveness as an employer and to retaining and further developing employees. Risks associated with qualifications and expertise are addressed and minimised with the measures described below.
Potential risks IMMOFINANZ minimises the risks arising from negative effects on employees’ health, a lack of motivation or continuing education through targeted measures for human resources development and health management.
Employee structure IMMOFINANZ had a total workforce of 311 as of 31 December 2019 (31 December 2018: 333), which rep-resents an annual average* of 306 (2018: 345). Employees from 20 nations currently work for IMMOFINANZ. Their average age is 37.3 years (2018: 36.6 years). The percentage of women reflected the previous year and equalled 59% as of 31 December 2019.
IMMOFINANZ had employees on site in nine countries during 2019. Austria is the main location for roughly half these employees, while the others work in Central and Eastern Europe. Most (2019: 89%) of our employ-ees work on a full-time basis. IMMOFINANZ wants to give its employees stability and planning security, and nearly all employment contracts are unlimited. Temporary employees represented less than 1% of the total workforce in 2019.
Total number of employees by employment type 2019 2018 ChangeFull-time 277 302 -8.3%
thereof female 154 167 -7.8%thereof male 123 135 -8.9%
Part-time 34 31 9.7%thereof female 28 28 0.0%thereof male 6 3 100.0%
2019 2018Employees by region
Total number Share Total number Share Change in totalAustria 158 50.8% 163 48.9% -3.1%Romania 41 13.2% 34 10.2% 20.6%Poland 38 12.2% 38 11.4% 0.0%Hungary 21 6.8% 28 8.4% -25.0%Czech Republic 18 5.8% 24 7.2% -25.0%Germany 13 4.2% 19 5.7% -31.6%Slovakia 13 4.2% 21 6.3% -38.1%Other1 9 2.9% 6 1.8% 50.0%
1 Locations with less than ten employees (Croatia, Serbia)
* Excluding the Executive Board and parental leave; the calculation is based on the absolute number of employees at the end of the month/number of months.

GROUP MANAGEMENT REPORTConsolidated Non-financial Statement
105
GR
OU
P M
AN
AG
EM
EN
T R
EP
OR
T
Social dialogue The employment relationships with the workforce in Austria are governed by the collective agreement for sal-aried employees in property management companies. The compensation for non-tariff employees is based on national and standard branch salary schemes. IMMOFINANZ has also concluded several agreements with the Works Council, which provided added improvements for the workforce. A corporate code confirms the com-pany’s commitment to respect the rights of employees and the freedom of assembly. IMMOFINANZ works to achieve and maintain a long-term, constructive dialogue with the Works Council.
IMMOFINANZ places high value on the application of uniform standards in dealing with employees. The Exec-utive Board and the Works Council meet at least once each quarter to discuss the current development of the company, and additional meetings are organised on short-term notice to consider important issues.
Continuous human resources development In the area of human resource development, training is focused on technical as well as social and methodolog-ical skills. An important instrument for management is the annual appraisal discussion between employees and their supervisors, which includes the definition of clear goals and individual training activities. As in previous years, appraisal discussions were held with all employees in 2019. These meetings also provide an opportunity to obtain feedback from employees on issues related to personal well-being, development and cooperation as well as suggestions for improvement. Emp-Dev; GRI 404-3
TrainingAs in previous years, IMMOFINANZ made a wide range of training and continuing education programmes available to its employees in 2019. The human resources department is responsible for ongoing personnel development as well as the preparation of a succession plan for key positions in the core areas. A total of 9,453 training hours were completed in 2019, which represent 30.4 hours per employee (HC). Language courses accounted for roughly 39% of these hours (2018: 46%), followed by external training courses and seminars. The number of training hours per employee was higher in 2018, above all due to stronger demand for language courses.
GRI Code 2019 2018GRI 102-41 Percentage of total employees covered by collective bargaining agreements 50.8% 48.9%
Average hours of training per year and employee
2019 2018EPRA/ GRI Code Training hours Total hours
Hours per employee Total hours
Hours per employee
Change in hours/HC
Emp-TrainingGRI 404-1
9,453 30.4 11,427 34.3 -11.4%By genderFemale 6,776 37.2 8,090 41.5 -10.3%Male 2,677 20.8 3,337 24.2 -14.2%By age group< 30 years 2,073 34.0 2,908 38.8 -12.3%30-50 years 7,142 30.4 8,282 34.5 -11.9%> 50 years 238 15.9 237 13.2 20.5%By employee category Management 1,479 31.5 1,389 29.5 6.6%Non-management 7,974 30.2 10,038 35.1 -13.9%
IMMOFINANZ Academy The IMMOFINANZ Academy is the corporate institution for training and continuing education, with individual instruction in the form of specific courses and group programmes serving as important elements. Internal courses led by IMMOFINANZ experts are also part of the curriculum. Examples include workshops on the brand strategy and the IMMOFINANZ Real Estate Training series.

IMMOFINANZ AGAnnual Report 2019
106
Training programmes With the apprenticeship programme started in 2016, IMMOFINANZ offers ambitious young men and women training opportunities as real estate agents (“Immobilienkaufmann”) and finance/accounting assistants. The “Young Professional” talent promotion programme, which was established in 2017 and successfully continued in 2019, is directed to students and recent university graduates. It follows a rotation scheme and concentrates on knowledge transfer in the operating business and finance departments.
The Leadership Curriculum represents the Group-wide training series for managers, in which individual mod-ules deal with various management issues. The internal exchange and transfer of know-how provide support for employees in management functions. In this way, IMMOFINANZ creates optimal development opportuni-ties for managers.
Health management and work-life balance As a real estate manager and developer, IMMOFINANZ’s operations are primarily office-based and the risk of work accidents is therefore comparatively low. Health management is, consequently, based on healthcare and sport offerings.
Employees can take advantage of flexible and semi-flexible working hours and part-time working models which include a flexible working time regulation. The flexible time frame basically ranges from 6:00 am to 8:00 pm. There is no general core time, and employees can independently determine the beginning and end of their workday. These rules help employees to balance private needs with full-time employment, which leads to an increase in satisfaction and better performance and also supports IMMOFINANZ’s attractiveness as an employer.
IMMOFINANZ also provides wide-ranging support for its employees outside the workplace: teambuilding and promotion for the work-life balance represent key elements. Included here are a sixth holiday week after three years with the company, sport offerings like participation in the Vienna City Marathon or Business Run, coach-ing vouchers and various voluntary employee benefits.
As support for our employees’ health, a company physician holds regular office hours at the headquarters in Vienna. Her responsibilities include, among others, compliance with legal requirements as well as vaccination drives, preventive medical check-ups and eye examinations as well as consultations on healthcare issues – all of which are intended to address typical office medical problems on a timely basis. The number of days lost to illness declined slightly to 2.29% in 2019.
Health and safety inspections are held once at year at IMMOFINANZ’s own office locations with the partic-ipation of the safety officer, company physician and Works Council representatives. These inspections are designed to evaluate occupational safety risks and compliance with legal work and safety regulations. The results are evaluated by HR management and the Executive Board, and measures for improvement are ap-proved. In addition to this annual meeting, IMMOFINANZ has specially trained employees who serve as safety ombudspersons and can address any problems on an ad-hoc basis.
GRI Code Occupational health and safety employees1 2019 2018
H&S-EmpGRI 403-2 (2016)
Number of work-related injuries 1 2Injury rate (in %)2 <0.01% <0.01%Total lost days3 3 1Lost day rate (in %)4 0.01% <0.01%Absences in days5 795 1.022Absentee rate (in %)6 2.29% 2.85%Work-related fatalities 0 0
1 Based on employees in Austria (51% of the total workforce). Plans include the collection of occupational safety data for all employees beginning in 2020.
2 Number of occupational accidents / total hours worked3 Number of days lost due to occupational accidents4 Number of days lost due to occupational accidents / total hours worked5 Number of absence days (work-related accidents and illness)6 Number of absence days / total days worked

GROUP MANAGEMENT REPORTConsolidated Non-financial Statement
107
GR
OU
P M
AN
AG
EM
EN
T R
EP
OR
T
Attractive employerThe many initiatives in the area of human resources have received considerable attention: On kununu, the larg-est employer ranking platform in Europe with roughly 4.0 million ratings on more than 930,000 companies (as of February 2020), IMMOFINANZ received above-average gradings which have improved steadily in recent years.
In the study “BEST RECRUITERS 2018/19“ (carried out by BEST RECRUITERS | CAREER Verlag, Vienna), IMMOFINANZ was ranked second in the real estate segment and awarded the BEST RECRUITERS seal in bronze. The issues analysed here included the company’s online recruiting presence, online job advertisements and interaction with candidates. Positive factors included, among others, the speed and efficiency of the application process.
IMMOFINANZ ranks among the “Top 1 Per Cent” of employers in Austria. This was confirmed by the inde-pendent “Leading Employers“ study in an extensive analysis and IMMOFINANZ was recognised as a “Leading Employer 2019“. The study evaluated more than 40,000 companies from different branches and regions re-garding their attractiveness as employers. It was based on the evaluation of publicly available data including, among others, the following criteria: employee offering, employee satisfaction, CSR, talent communication and image. The objective was to take a comprehensive view of employer qualities instead of focusing on individual approaches.
The number of employees leaving the company declined substantially in 2019 and led to a reduction of four percentage points in the turnover rate.
As of: February 2020 As of February 2019KUNUNU Scores in comparison Ranking Points Gradings Ranking Points GradingsIMMOFINANZ ★★★★ 4.19 197 ★★★★ 4.16 166Branch average (Properties/Facility Management) ★★★ 3.35 39,311 ★★★ 3.33 29,727kununu average ★★★ 3.39 3,985,000 ★★★ 3.36 3,187,000
More information under www.kununu.com/at/immofinanz
New employees1 2019 2018Change in
totalEPRA/ GRI Code New employee hired Total number
Rate of new hires Total number
Rate of new hires
Emp- TurnoverGRI 401-1 (2016)
60 19.3% 68 20.4% -11.8%By genderFemale 33 18.1% 41 21.0% -19.5%Male 27 20.9% 27 20.0% 0.0%By age group< 30 years 23 37.7% 33 44.0% -30.3%30-50 years 37 15.7% 34 14.0% 8.8%> 50 years 0 0.0% 1 6.0% -100.0%By regionAustria 30 19.0% 30 18.0% 0.0%Germany 5 38.5% 4 21.0% 25.0%Czech Republic 4 22.2% 4 17.0% 0.0%Hungary 2 9.5% 4 14.0% -50.0%Poland 3 7.9% 6 16.0% -50.0%Romania 13 31.7% 15 44.0% -13.3%Serbia 2 25.0% 0 0.0% 100.0%Russia 0 0.0% 1 17.0% -100.0%Croatia 1 100.0% 0 0.0% 100.0%Slovakia 0 0.0% 4 19.0% -100.0%
1 Excl. employees returning from parental leave. trainees. students and young professionals; the calculation is based on the number of employees in the respective category at the end of the year.

IMMOFINANZ AGAnnual Report 2019
108
DiversityEqual opportunity and the equal treatment of employees without differentiation according to gender, age or national/ethnic origin are part of IMMOFINANZ’s corporate DNA. As stated in the Corporate Code, we are committed to creating a group-wide working environment which is characterised by openness and mutual respect. The HR department considers diversity to be very important, in particular with regard to age, gender, national/ethnic origin, religion, education and professional background. Accordingly, specific appointments or recommendations are based not only on criteria like expertise, individual requirements, experience, availability but also on the above aspects.
A compliance officer is available as an independent ombudsperson to answer questions and deal with potential conflicts. No discrimination incidents were reported in 2019. GRI 406-1
Employee turnover 2019 2018Change in
total EPRA/ GRI Code Employee departures1 Total number Turnover rate Total number Turnover rate
Emp- TurnoverGRI 401-1 (2016)
64 17.0% 93 21.0% -31.2%By genderFemale 36 16.0% 40 16.0% -10.0%Male 28 18.0% 53 27.0% -47.2%By age group< 30 years 21 22.0% 16 17.0% 31.3%30-50 years 43 16.0% 67 21.0% -35.8%> 50 years 0 0.0% 10 36.0% -100.0%
1 Departures excl. parental leave; turnover as per Schlüter formula: Departures /(Number as of 1.1. + additions)
Diversity of governance bodies and employees 2019 2018 Change in
total number of employees
EPRA/GRI Code
Total number of employees Share
Total number of employees Share
Employees in governance bodies1
Diversity- EmpGRI 405-1
By genderFemale 0 0.0% 0 0.0% 0.0%Male 3 100.0% 3 100% 0.0%By age group < 30 years 0 0.0% 0 0.0% 0.0%30-50 years 2 66.7% 2 66.7% 0.0%> 50 years 1 33.3% 1 33.3% 0.0%Employees with management responsibilty2
By gender Female 16 34.0% 17 36.2% -5.9%Male 31 66.0% 30 63.8% 3.3%By age group < 30 years 0 0.0% 0 0.0% 0.0%30-50 years 44 93.6% 43 91.5% 2.3%> 50 years 3 6.4% 4 8.5% -25.0%Non-management employees3By gender Female 166 62.9% 178 62.2% -6.7%Male 98 37.1% 108 37.8% -9.3%By age group < 30 years 61 23.1% 75 26.2% -18.7%30-50 years 191 72.3% 197 68.9% -3.0%> 50 years 12 4.5% 14 4.9% -14.3%
1 Executive Board2 All managers, e.g. team leaders, head ofs, country boards; excl. Executive Board3 Employees without management responsibility

GROUP MANAGEMENT REPORTConsolidated Non-financial Statement
109
GR
OU
P M
AN
AG
EM
EN
T R
EP
OR
T
Responsible business practices
IMMOFINANZ is committed to business practices that are based on integrity, honesty, fairness, transparency and responsibility. Mutual trust as a fundamental understanding forms the basis for constructive cooperation within the company and with business partners. All activities are based on compliance and the fight against corruption, a sustainable procurement policy and human rights.
The Executive Board has approved several corporate guidelines for these areas, which are binding for all em-ployees and member companies of the IMMOFINANZ Group:
The Corporate Code serves as the basis for all business activities and decisions in the IMMOFINANZ Group. In particular, it includes guidelines for respecting fundamental rights, integrity and fairness, a ban on discrimina-tion as well as for relations with competitors, customers and associations.
The Anti-corruption Guideline is based on the UN Convention against Corruption and summarises the princi-ples and rules of conduct for dealing with corruption.
The Compliance Guideline covers the legal prohibitions on the use of insider information through insider transactions and the unlawful disclosure of insider information. In addition, an e-learning tool for training on capital market compliance was introduced in 2017. A compliance officer is also available to answer employees’ questions at any time. Further details are provided in the consolidated Corporate Governance Report (begin-ning on page 41).
Potential risks The acceptance of gifts, corruption, bribery, discrimination and conflicts of interest carry an inherent risk of damage to the company’s reputation as well as the risk of detrimental transactions for the IMMOFINANZ Group. These guidelines are intended to prevent such consequences. There are currently no indications of risks of corruption, and the ongoing measures will ensure added training for and create a greater awareness among employees.
IMMOFINANZ’s wide range of business relationships is accompanied by a risk that a company with lower eth-ical standards could be involved. IMMOFINANZ minimises this risk with the careful and responsible selection of business partners. The risk of human rights violations is considered low because nearly all of our suppliers (> 99%) are located in Europe.
Compliance trainingIMMOFINANZ employees receive regular training on the principles of the compliance guidelines. An inter-active e-learning programme on dealing with insider information was introduced in 2019. It includes several case studies with accompanying questions. Another e-learning tool introduced during the past year covers Group-wide anticorruption training; its goals are to provide practical examples for reviewing behavioural prin-ciples and requirements and create a greater awareness among employees for potential conflicts of interest. All IMMOFINANZ employees and the Executive Board received compliance training in both 2018 and 2019. Anti-corruption training is mandatory for all employees and is held according to an annual schedule. GRI 205-2
Sustainable procurement policy The development of long-standing business relationships based on sustainability and continuity represents the focal point for relations with suppliers and business partners. As an international corporation, IMMOFINANZ worked with suppliers from 28 countries in 2019. In order to ensure sustainability in procurement and main-tain long-term cooperative relationships, 95% of all suppliers come directly from IMMOFINANZ’s operating markets. The support for local suppliers and contribution to added value in the operating markets is, therefore, a central concern.

IMMOFINANZ AGAnnual Report 2019
110
GRI 204-1
The selection of business partners is based on the corporate Procurement Guideline, which specifies the rules and procedures for all purchasing activities at IMMOFINANZ. This guideline reflects the principles defined by the Corporate Code and requires the careful and responsible selection of suppliers. A central objective is to minimise the supplier risks arising from child labour, forced labour and compulsory labour and from an insufficient social assessment of suppliers.
In addition to the responsible selection of suppliers, IMMOFINANZ works continuously to intensify the com-munication with its business partners. The medium-term goal is the implementation of a supplier relationship management tool (SRM), whereby the starting point for this interactive platform will be formed by the newly planned Enterprise-Resource Planning System (ERP).
Respect for human rights The respect for and compliance with human rights, and above all the dignity of the individual, has high priority for IMMOFINANZ. In addition to compliance with national constitutional and legal requirements, IMMOFINANZ places special importance on compliance with the conventions of the International Labour Organisation (ILO) for the freedom of assembly, the abolition of forced labour and child labour and discrimination. Violations of human rights – above all forced labour and child labour – are strictly rejected and IMMOFINANZ’s business partners are expected to observe these ethical standards. Information on diversity and discrimination can be found on page 108.
Fight against corruption and bribery The Anti-Corruption Guideline issued by IMMOFINANZ is based on the UN Convention against Corruption and summarises the principles and rules of conduct for dealing with corruption. Its goals are to ensure legally com-pliant behaviour by employees, business partners and customers; to prevent conflicts of interest from arising; to sensitise employees for potential conflicts of interest and thereby protect them from criminal offenses; and to prevent damage to IMMOFINANZ’s reputation as a result of improper practices. The guideline includes, among others, rules for the acceptance and granting of advantages, donations and sponsoring, the use of intermediaries and the prevention of money laundering. IMMOFINANZ does not make any political donations. No incidents of corruption were identified in 2019. GRI 205-3; GRI 415-1
Data security IMMOFINANZ started at an early point in time to address the extended requirements for the protection of personal data which are required by the Data Protection Regulation (“Datenschutzgrundverordnung”, DSGVO) which took effect in May 2018. This regulation significantly expands the obligations of responsible organisa-tions and the rights of involved parties, but also brings a massive increase in the sanctions for violations of data protection. Consequently, compliance with the applicable data protection rules is a legal requirement and an essential goal for the IMMOFINANZ Group.
The measures and investments required to apply the Data Protection Regulation were defined and imple-mented by corporate legal affairs und compliance, legal and IT together with all other business areas.
A Data Protection Guideline regulates the processing of personal data in accordance with legal regulations and defines the related obligations for all employees of the IMMOFINANZ Group. It also requires the creation of a register which lists all processing activities. Compliance with this guideline is mandatory and is intended to make certain the Group’s behaviour complies with data protection regulations, in particular the protection of involved persons’ rights. Other objectives include the definition of processes for dealing with these personal rights, the prevention of data protection violations and the avoidance of fines.
IMMOFINANZ’s suppliers Origin
Operating markets1 95% Other 5%1 The following operating markets were classified as “significant locations of operations”: Austria, Germany, Czech Republic, Slovakia, Romania, Hungary, Poland and Serbia.

GROUP MANAGEMENT REPORTConsolidated Non-financial Statement
111
GR
OU
P M
AN
AG
EM
EN
T R
EP
OR
T
The organisational measures to protect data and comply with data protection regulations include mandatory training for employees by the data protection coordinator. An interactives online training programme on cyber security was introduced during 2019 in cooperation with Kaspersky Labs. It covers a number of modules, for example on the “principles of cybersecurity” and “passwords and accounts” and was completed by all em-ployees. In addition, several recommendations from the ISO 27002 standards were implemented on control mechanisms and operating measures for the monitoring and reaction to data violations and cyberattacks. Internal and external reviews were conducted in cases where extensive changes to existing systems were involved or new applications were introduced.
IMMOFINANZ is unaware of any justified complaints by third parties or the supervisory authorities over the protection of customer data in 2018 or 2019. GRI 418-1
EPRA indexThis sustainability report was prepared in accordance with the principles and criteria defined by the EPRA Sustainability Best Practices Recommendations Guidelines – Third Version September 2017, a reporting framework issued by the European Public Real Estate Association (EPRA). A description of the overall recom-mendations is provided in the section “About this report” on page 92.
EPRA CodePage number Comment
Responsibility towards the environment Elec-Abs Total electricity consumption 98–99DH&C-Abs Total district heating & cooling consumption 98–99Fuels-Abs Total fuel consumption 98–99Energy-Int Building energy intensity 98–99,
113GHG-Dir-Abs Total direct greenhouse gas (GHG) emissions 113 The reported emissions are based on the energy
consumption charged to tenants, therefore they are classified as indirect emissions (Scope 3).
GHG-Indir-Abs Total direct greenhouse gas (GHG) emissions 98–99GHG-Int Greenhouse gas (GHG) emissions intensity from
building energy consumption98–99
Water-Abs Total water consumption 100–101 Water is drawn exclusively from municipal utility companies.
Water-Int Building water intensity 100–101Cert-Tot Type and number of sustainably certified assets 100–101Responsibility towards tenants and customersComty-Eng Community engagement, impact assessments
and development programmes103 IMMOFINANZ carries out regular tenant surveys
(see page 103). The related reporting is under development.
H&S-Asset Asset health and safety assessments 103–104 There is no standardised recording of assessments at the present time; the reporting is under develop-ment. A description is provided on pages 103–104.
H&S-Comp Asset health and safety compliance 103–104 There is no standardised recording of non-compli-ance incidents at the present time; the reporting is under development. A description is provided on pages 103–104.
Responsibility towards employeesDiversity-Emp Employee gender diversity 108Emp-Training Training and development 105Emp-Dev Employee performance appraisals 105Emp-Turnover Employee turnover and retention 107, 108Responsible business practicesGov-Board Composition of the highest governance body 41–45Gov-Select Nominating and selecting the highest
governance body45–46
Gov-CoI Process for managing conflicts of interest 48–49

IMMOFINANZ AGAnnual Report 2019
112
GRI Index This sustainability report was prepared in accordance with the principles and criteria defined by the GRI Stand-ards issued by the Global Reporting Initiative, an internationally recognised framework for sustainability re-porting. IMMOFINANZ applies the reporting option “GRI-referenced”, therefore GRI only applies for specific content. This document refers to the selective disclosures on the GRI Standards in the following index:
GRI Standard DisclosurePage number Comment/Omission
GRI 101: Foundation: 2016GRI 102: General Disclosures: 2016102-41 Collective bargaining agreements 105Responsibility towards the environment
GRI 302: Energy 2016302-1 Energy consumption within the organisation 113302-2 Energy consumption outside of the organisation 98–99302-3 Energy intensity 113
G4 Sector Disclosures: Construction and Real estate
CRE1 Building energy intensity 98–99
GRI 305: Emissions 2016
305-1 Direct GHG emissions (Scope 1) 113305-2 Energy indirect GHG emissions (Scope 2) 113305-3 Other indirect GHG emissions (Scope 3) 98–99305-4 GHG emissions intensity 113
G4 Sector Disclosures: Construction and Real estate
CRE3 Greenhouse gas emissions intensity from buildings 98–99
GRI 303: Water 2016 303-1 Water withdrawal by source 100–101, 113
Water is drawn exclusively from municipal utility companies.
G4 Sector Disclosures: Construction and Real estate
CRE2 Building water intensity 100–101CRE8 Type and number of sustainability certification, rating and labeling schemes for new construction, management, occupation and redevelopment
100–101
Responsibility towards tenants and customersGRI 413: Local communities 2016
413-1 Operations with local community engagement, impact assessments, and development programmes
103 The data is not available at the present time; the reporting is under development. A description of the tenant survey is provided on page 103.
GRI 416: Customer health and safety 2016
416-2 Incidents of non-compliance concerning the health and safety impacts of products and services
103–104 The data is not available at the present time; the reporting is under development. A description is provided on pages 103–104.
Responsibility towards employeesGRI 401: Employment 2016 401-1 New employee hires and employee turnover 107, 108GRI 403: Occupational health and safety 2016
403-2 Types of injury and rates of injury, occupational diseases, lost days, and absenteeism, and number of work- related fatalities
106
GRI 404: Training and education 2016
404-1 Average hours of training per year and employee 105404-3 Percentage of employees receiving regular performance and career development reviews
105
GRI 405: Diversity and equal opportunity 2016
405-1 Diversity of governance bodies and employees 108
GRI 406: Non-discrimination 2016
406-1 Incidents of discrimination and corrective actions taken 108
Responsible business practices
GRI 205: Anti-corruption 2016205-2 Communication and training about anti-corruption policies and procedures
109
205-3 Confirmed incidents of corruption and actions taken 110GRI 204: Procurement practices 2016
204-1 Proportion of spending on local suppliers 110
GRI 206: Anti-competitive behaviour 2016
206-1 Legal actions for anti-competitive behaviour, anti-trust,and monopoly practices
There were no legal proceedings in 2019 based on anti-competitive behaviour, cartel- or monopoly building.
GRI 418: Customer privacy 2016 418-1 Substantiated complaints concerning breaches of customer privacy and losses of customer data
110–111
GRI 415: Public policy 2016 415-1 Political contributions 110

GROUP MANAGEMENT REPORTConsolidated Non-financial Statement
113
GR
OU
P M
AN
AG
EM
EN
T R
EP
OR
T
Environmental indicators for IMMOFINANZ locationsThe consumption of water and energy and the related environmental impact at IMMOFINANZ’s own office lo-cations represent only a very limited component in relation to the entire portfolio. The indicators are therefore collected and reported separately for the monitoring and management of the direct impact.
Energy Own office locationsEPRA/GRI Code Unit Indicator 2019 2018 ChangeTotal energy consumptionGRI 302-1 (2016) kWh Total energy 2,745,749 2,926,313 -6.2%Fuel consumption
GRI 302-1 (2016) kWhNatural gas 354,466 381,578 -7.1%Petrol 80,366 79,741 0.8%Diesel 487,737 614,445 -20.6%
Electricity consumption GRI 302-1 (2016) kWh Electricity 1,275,341 1,301,140 -2.0%District heating/cooling consumption GRI 302-1 (2016) kWh District heating 547,840 549,408 0.3%Energy intensity GRI 302-3 (2016) kWh/sqm Energy per square meter 339 319 6.3%
Coverage rate (%) 88.0% 75.1%Number of buildings 8/11 7/11
Share of projections (%) 100.0% 100.0%
Water Own office locationsEPRA/GRI Code Unit Indicator Scope 2019 2018 ChangeWater consumptionGRI 303-1 (2016) Liter Water from municipal sources Total water 4,423,953 4,419,571 0.1%
Liter/sqm
Water from municipal sources/ Total space
Total water 547 482 13.4%
Coverage rate (%) 90.7% 90.4%Number of buildings 8/11 7/11
Share of projections (%) 100.0% 100.0%
Emissions Own office locationsEPRA/GRI Code Unit Indicator Scope 2019 2018 ChangeTotal energy consumptionGRI 305-1 (2016) tCO2e Scope 1 Total energy 253 298 -15.1%GRI 305-2 (2016) tCO2e Scope 2 Total energy 380 381 0.2%
tCO2e Scope 1+2 Total energy 633 678 -6.7%GRI 305-4 (2016) kgCO2e/
sqmScope 1+2/Total space Total energy 78 74 5.7%
Coverage rate (%) 90.7% 90.4%Number of buildings 8/11 7/11

IMMOFINANZ AGAnnual Report 2019
114
Research & Development Technological and social change have an influence on the real estate sector. In order to be optimally positioned to also offer efficient and profitably manageable property solutions in the future, IMMOFINANZ routinely monitors the changes in work processes and tenants’ demands on space and building concepts. This process was reflected in the conclusion of a research and development contract between IMMOFINANZ and the Vienna University of Technology (TU Wien). The project “Next Gen Real Estate and Facility Management Initiative“ will address the effects of digitalisation on the real estate sector and facility management. The Vienna University of Technology is also working together with Stanford University Mechanical on this assignment.
Outlook IMMOFINANZ expanded its standing investment portfolio by more than EUR 1.0 billion to EUR 4.7 billion through high-quality acquisitions and completions during the 2019 financial year. Strong customer orientation, investments in the quality of properties and the continuous improvement of the service offering for tenants supported an increase in the occupancy rate to 96.8%. FFO 1 from the standing investment business rose by 30.2% to EUR 137.4 million. Moreover, the company has a conservative capital and financing structure and is therefore well prepared to react quickly and flexibly to the current challenging environment.
The concrete effects of the Covid-19 pandemic cannot be conclusively assessed at the present time due to the rapidly changing developments but are under continuous evaluation. IMMOFINANZ is taking all steps possible to minimise the potential negative effects on the company.
Expected market environment March 2020 brought a significant deterioration in the situation surrounding the impact of Covid-19 in Europe, which has become a focal point of this pandemic. Government restrictions and measures to limit the spread of Covid-19 have been implemented in all countries where IMMOFINANZ owns and operates properties. In addition to measures which touch everyday life, retail businesses have been shut down temporarily. Exceptions have generally been made for stores which sell basic supplies like supermarkets and pharmacies, drugstores, post offices, banks, pet food shops etc. Moreover, access to public areas has been limited or similar recommendations have been issued.
In view of these developments, experts expect significant negative effects on the global economy which cannot be predicted at the present time. The OECD reduced its growth outlook substantially at the beginning of March 2020 and describes the coronavirus as the “biggest danger for the global economy since the financial crisis“. The OECD indicates that the measures implemented to contain the virus and the general loss of confidence could have such a strong impact on production and consumption that some countries, including the eurozone states, would be pushed into a recession. On 23 March 2020, the International Monetary Fund (IMF) warned of a recession that would be more severe than the global financial crisis in 2008. The pandemic would have “severe“ economic effects and the outlook for this year is therefore negative. Expectations point to a "recession at least as bad as during the global financial crisis – or worse". A recovery is expected in 2021.
A significant decline in growth or slip into recession as well as an increase in unemployment would presumably increase the general reluctance of consumers to spend. Continuing danger of infection with the virus and, as a result, the avoidance of public areas could have a negative effect on visitor frequency and retail turnover. A reduction in corporate expansion plans and a decline in the demand for space could, in turn, have a negative impact on the office property market. Challenging framework conditions can also be expected on the transaction market for real estate.

GROUP MANAGEMENT REPORTResearch & Development | Outlook
115
GR
OU
P M
AN
AG
EM
EN
T R
EP
OR
T
Property portfolio IMMOFINANZ’s standing investment portfolio totalled approximately EUR 4.7 billion as of 31 December 2019: roughly EUR 3.0 billion, or 64%, of office properties and EUR 1.7 billion, or 35%, of retail properties.
The above-mentioned government restrictions will have an effect on IMMOFINANZ’s retail locations in the involved countries. Visitor frequency in the IMMOFINANZ retail locations from the beginning of January to mid-March 2020 reflected the comparable 2019 level due to a very strong start into the year. However, declines have recently been noted as a result of the government actions – whereby the extent differs from country to country, depending on the specific restrictions.
Longer revenue losses as the result of mandatory shop closures will have a negative impact on the economic position of retailers, also for the entire financial year. This can lead to a difficult cost situation for individual tenants. However, the tenants in IMMOFINANZ’s cost-efficient retail concepts – VIVO! for shopping centers and STOP SHOP for retail parks – benefit from generally low rental and operating costs. This represents a clear competitive advantage.
IMMOFINANZ maintains an active dialogue with its tenants to jointly master these challenges and takes its responsibility towards the retailers, their employees and their customers very seriously.
The concrete effects of the Covid-19 pandemic and temporary individual support measures for tenants cannot be conclusively evaluated at the present time due to the dynamically changing situation but are under continuous monitoring. In order to largely offset potential, temporary declines in rental income from the retail business on a cash flow basis as far as possible, a cost savings programme has already been implemented. It includes, among others, the postponement of non-essential investments as well as the reduction of overheads. In addition, all economic support measures announced by the various national governments will be evaluated.
After the government restrictions and other measures to contain Covid-19 are loosened, the retail segment cannot initially expect a high level of social interaction through shopping. The STOP SHOP brand with its characteristic direct access from the parking area to the individual shops will meet this possible change in consumer behaviour.
The office sector could also be affected by government ordered shutdowns, which could also lead to a decline in rental income, the reduction of rented space or the general loss of tenants. However, the flexible rental concepts of the myhive brand offer an interesting option. Shorter term contracts and lower investment requirements meet the needs of tenants in an uncertain market environment.
Financing and the capital market IMMOFINANZ has a conservative capital and financing structure and is well positioned to react quickly and flexibly to future challenges. This was underscored by the receipt of an investment grade rating as well as the issue of the company’s first benchmark bond in January 2019, which marked a milestone in the further diversification of financing sources. IMMOFINANZ’s investment grade rating (BBB- with a stable outlook from S&P Global Ratings) remained unchanged during the 2019 financial year, and the rating and stable outlook were recently confirmed on 20 February 2020.
IMMOFINANZ and its subsidiaries are in discussions with all financing banks to protect the Group’s strong liquidity position and to react to the special situation caused by Covid-19. In order to be prepared for a potential decline in rental income, agreements have been proactively reached with the financing banks to temporarily suspend interest and/or principal payments and/or to waive the review of covenants.
Furthermore, IMMOFINANZ concluded an unsecured, revolving credit line of EUR 100.0 million as of 31 March 2020. It can be used within two years and provides the Group with greater financial flexibility.
On the capital market, IMMOFINANZ is positioned as a sustainable dividend stock and the goal is to distribute 75% of the FFO 1 generated by the company to shareholders. The annual general meeting was postponed to

IMMOFINANZ AGAnnual Report 2019
116
1 October 2020 due to the Covid-19 crisis. The Executive and Supervisory Boards plan to issue a recommendation for the use of profit for the 2019 financial year together with the announcement of results for the first half of the 2020 financial year. The effects of the Covid-19 crisis on the company’s business activities will be monitored continuously up to that time.
IMMOFINANZ has held 19.5 million shares of S IMMO since September 2018. Following a capital increase by S IMMO in January 2020, this represents an interest of 26.5%. IMMOFINANZ is continuing to hold all options open in connection with this investment, including the resumption of discussions with S IMMO on the combination of the two companies.
This outlook reflects the Executive Board’s assessments as of 8 April 2020 and includes statements and forecasts concerning the future development of IMMOFINANZ. The forecasts represent estimates that are based on the information available at the present time. If the underlying assumptions do not occur or risks – as indicated in the risk report – materialise, actual results could differ from the statements made here. This annual report does not represent a recommendation to buy or sell IMMOFINANZ AG securities.
Significant events occurring after the end of the 2019 financial year are reported in section 7.6 of the notes to the consolidated financial statements.
Vienna, 8 April 2020
The Executive Board
Stefan Schönauer, CFO Dietmar Reindl, COO

CONSOLIDATED FINANCIAL STATEMENTS 117
CO
NS
OL
IDA
TE
D F
INA
NC
IAL
STA
TE
ME
NT
S
Consolidated Financial Statements
Consolidated Balance Sheet ................................................................................. 118 Consolidated Income Statement ........................................................................ 119 Consolidated Statement of Comprehensive Income .............................. 120 Consolidated Cash Flow Statement ................................................................. 121 Consolidated Statement of Changes in Equity ........................................... 122 1. General Principles .................................................................................................. 124 2. Scope of Consolidation ...................................................................................... 130 3. Information on Operating Segments .......................................................... 136 4. Notes to the Consolidated Balance Sheet ............................................... 143 5. Notes to the Consolidated Income Statement ...................................... 173 6. Notes to the Consolidated Cash Flow Statement ............................... 182 7. Other Disclosures .................................................................................................. 186 8. Group Companies .................................................................................................. 205 9. Release of the Consolidated Financial Statements ............................ 211 Auditor’s Report .......................................................................................................... 212 Statement by the Executive Board ................................................................... 217

118 IMMOFINANZ AGAnnual Report 2019
Consolidated Balance Sheet All amounts in TEUR Notes 31 12 2019 31 12 2018 Investment property 4.1 4,985,257 3,893,568Property under construction 4.2 199,439 397,540Other tangible assets 3,628 1,109Intangible assets 4.4.1 24,619 24,926Equity-accounted investments 4.5 478,191 397,671Trade and other receivables 4.6 65,396 88,185Income tax receivables 759 82Other financial assets 4.7 10,449 11,969Deferred tax assets 4.8 2,992 58,697Non-current assets 5,770,730 4,873,747 Trade and other receivables 4.6 104,430 217,443Income tax receivables 13,324 10,630Assets held for sale 4.9 154,622 57,162Real estate inventories 4.10 868 46,932Cash and cash equivalents 4.11 341,161 631,754Current assets 614,405 963,921 Assets 6,385,135 5,837,668 Share capital 4.12 112,085 112,085Capital reserves 4.12 4,465,194 4,465,259Treasury shares 4.12 -250,378 -106,414Accumulated other equity -166,611 -183,324Retained earnings -1,200,196 -1,470,672Equity attributable to owners of IMMOFINANZ AG 2,960,094 2,816,934Non-controlling interests -22,949 -16,593Equity 2,937,145 2,800,341 Liabilities from convertible bonds 4.13 281,344 278,694Financial liabilities 4.14 2,307,684 1,802,563Trade and other payables 4.15 50,475 40,902Income tax liabilities 2 92Provisions 4.16 18,135 17,936Deferred tax liabilities 4.8 275,286 338,730Non-current liabilities 2,932,926 2,478,917 Liabilities from convertible bonds 4.13 4,463 5,944Financial liabilities 4.14 272,697 338,321Trade and other payables 4.15 147,192 158,123Income tax liabilities 4.8 5,795 16,028Provisions 4.16 36,262 38,433Liabilities held for sale 4.9 48,655 1,561Current liabilities 515,064 558,410 Equity and liabilities 6,385,135 5,837,668

CONSOLIDATED FINANCIAL STATEMENTS 119
CO
NS
OL
IDA
TE
D F
INA
NC
IAL
STA
TE
ME
NT
S
Consolidated Income Statement All amounts in TEUR Notes 2019 2018 1 Rental income 5.1.1 279,879 236,905Operating costs charged to tenants 5.1.2 85,470 90,813Other revenues 1,311 6,059Revenues 366,660 333,777Expenses from investment property 5.1.4 -57,441 -63,988Operating expenses 5.1.2 -101,880 -95,742Results of asset management 5.1 207,339 174,047Results of property sales 5.2 -5,079 27,201Results of property development 5.3 -12,377 -4,332Other operating income 5.4 6,156 6,140Other operating expenses 5.5 -46,144 -49,949Results of operations 149,895 153,107Revaluation result from standing investments and goodwill 5.7 195,683 5,955Operating profit (EBIT) 345,578 159,062Financing costs 5.9 -64,558 -68,374Financing income 5.9 1,179 6,906Foreign exchange differences -1,510 95Other financial results 5.9 -9,018 -2,548Net profit or loss from equity-accounted investments 5.8 78,380 108,161Financial results 5.9 4,473 44,240Earnings before tax (EBT) 350,051 203,302Current income tax 5.10 -8,552 -23,635Deferred tax 5.10 6,018 37,630Net profit or loss from continuing operations 347,517 217,297Net profit or loss from discontinued operations 2.4 4,602 250Net profit or loss 352,119 217,547
Thereof attributable to owners of IMMOFINANZ AG 358,888 217,261Thereof attributable to non-controlling interests -6,769 286
Basic earnings per share in EUR 5.11 3.37 1.97Net profit or loss from continuing operations per share in EUR 3.32 1.97Net profit or loss from discontinued operations per share in EUR 0.04 0.00
Diluted earnings per share in EUR 5.11 3.03 1.80Net profit or loss from continuing operations per share in EUR 2.99 1.80Net profit or loss from discontinued operations per share in EUR 0.04 0.00
1 The comparable prior year figures were adjusted accordingly (see section 1.6).

120 IMMOFINANZ AGAnnual Report 2019
Consolidated Statement of Comprehensive Income All amounts in TEUR Notes 2019 2018 Net profit or loss 352,119 217,547Other comprehensive income (reclassifiable) Currency translation adjustment -2,620 -42,277
Thereof changes during the financial year -1,845 -9,965Thereof reclassification to profit or loss 2.3 / 2.4 -775 -32,312
Other comprehensive income from equity-accounted investments 4.5 -3,100 -1,320Thereof changes during the financial year -2,567 -2,323Thereof reclassification to profit or loss -1,060 776Thereof income taxes 527 227
Total other comprehensive income (reclassifiable) -5,720 -43,597Other comprehensive income (not reclassifiable) Other comprehensive income from equity-accounted investments 4.5 21,633 -10,335
Thereof changes during the financial year 29,954 -13,329Thereof income taxes -8,321 2,994
Total other comprehensive income (not reclassifiable) 21,633 -10,335Total other comprehensive income after tax 15,913 -53,932Total comprehensive income 368,032 163,615
Thereof attributable to owners of IMMOFINANZ AG 375,601 166,743Thereof attributable to non-controlling interests -7,569 -3,128

CONSOLIDATED FINANCIAL STATEMENTS 121
CO
NS
OL
IDA
TE
D F
INA
NC
IAL
STA
TE
ME
NT
S
Consolidated Cash Flow Statement All amounts in TEUR Notes 2019 2018 Earnings before tax (EBT) 350,051 203,302Earnings before tax (EBT) from discontinued operations 2.4 4,602 420Revaluations of investment properties 2.4 / 5.7 -193,348 -24,905Goodwill impairment and subsequent price adjustments 225 0Write-downs and write-ups on real estate inventories (including impending losses from forward sales) 5.3 1,206 10,427Write-downs and write-ups on receivables and other assets 2,493 2,343Net profit or loss from equity-accounted investments 5.8 -78,379 -108,161Foreign exchange differences and fair value measurement of financial instruments 9,860 3,285Net interest income/expense 61,876 60,433Results from deconsolidation 2.3 / 2.4 -1,736 -33,399Other non-cash income/expense/reclassifications -33 -3,007Gross cash flow before tax 156,817 110,738Income taxes paid -15,983 -9,569Gross cash flow after tax 140,834 101,169Change in real estate inventories 65,180 -5,044Change in trade and other receivables 5,992 -6,228Change in trade payables and other liabilities -5,867 888Change in provisions -551 -5,492Cash flow from operating activities 205,588 85,293Acquisition of investment property and property under construction -248,489 -258,063Business combinations and other acquisitions, net of cash and cash equivalents (EUR 10.3 mill.; 2018: EUR 0.0 mill.) -267,388 0Consideration paid for business combinations in prior periods 0 -325Consideration transferred/paid from disposal of discontinued operations, net of cash and cash equivalents 6. -5,151 7,736Consideration transferred from disposal of subsidiaries, net of cash and cash equivalents (EUR 1.5 mill.; 2018: EUR 0.0 mill.) 6. 14,651 77,351Acquisition of other non-current assets -2,718 -708Acquisition of equity accounted investments and increase in receivables from other net investment positions 0 -391,849Disposal of investment property and property under construction 94,021 247,001Disposal of other non-current assets 175 14,718Disposal of equity-accounted investments and cash flows from other net investment positions 3,757 764,058Dividends received from equity-accounted investments 4.5 16,219 24,072Interest or dividends received from financial instruments 891 914Cash flow from investing activities -394,032 484,905Increase in financial liabilities plus decrease in blocked cash and cash equivalents 1,025,874 790,274Repayment of financial liabilities plus increase in blocked cash and cash equivalents -837,306 -938,049Redemption of convertible bonds 4.13 0 -17,286Derivatives -15,138 -11,215Interest paid -39,200 -52,737Distributions 4.12 -88,113 -77,928Transactions with non-controlling interest owners 152 -1,850Share buyback 4.12 -144,029 -106,478Cash flow from financing activities -97,760 -415,269Net foreign exchange differences -661 -2,190Change in cash and cash equivalents -286,865 152,739Cash and cash equivalents at the beginning of the period (consolidated balance sheet item) 631,754 477,889Plus cash and cash equivalents in discontinued operations and disposal groups 252 1,378Cash and cash equivalents at the beginning of the period 6. 632,006 479,267Cash and cash equivalents at the end of the period 6. 345,141 632,006Less cash and cash equivalents in discontinued operations and disposal groups 4.9 3,980 252Cash and cash equivalents at the end of the period (consolidated balance sheet item) 341,161 631,754

122 IMMOFINANZ AGAnnual Report 2019
Consolidated Statement of Changes in Equity
All amounts in TEUR Notes Share capital Capital
reserves Treasury shares Balance on 31 December 2018 112,085 4,465,259 -106,414 Other comprehensive income 4.12 Net profit or loss Total comprehensive income Share buyback 4.12 -65 -143,964 Distributions 4.12 Transactions with non-controlling interest owners Disposal of non-controlling interests 2.4 Balance on 31 December 2019 112,085 4,465,194 -250,378 Balance on 31 December 2017 1,116,174 3,452,324 0 Effects of the initial application of IFRS 9 Effects of the initial application of IFRS 15 Balance on 1 January 2018 1,116,174 3,452,324 0 Other comprehensive income Net profit or loss Total comprehensive income Share buyback -64 -106,414 Issue of shares (for incentivised conversion of the convertible bond 2011–2018) 4,678 4,232 Increase in share capital from internal funds 750,000 -750,000 Ordinary capital decrease -1,758,767 1,758,767 Reclassification of the valuation reserve recorded under other comprehensive income Distributions Transactions with non-controlling interest owners Disposal of non-controlling interests Balance on 31 December 2018 112,085 4,465,259 -106,414

CONSOLIDATED FINANCIAL STATEMENTS 123
CO
NS
OL
IDA
TE
D F
INA
NC
IAL
STA
TE
ME
NT
S
Accumulated other equity Revaluation
reserve (former AFS reserve) IAS 19 reserve
Hedge accounting
reserve
Currency translation
reserveRetained earnings Total
Non- controlling
interests Total equity
-8,886 -385 -925 -173,128 -1,470,672 2,816,934 -16,593 2,800,34121,653 -20 -2,473 -2,447 16,713 -800 15,913
358,888 358,888 -6,769 352,11921,653 -20 -2,473 -2,447 358,888 375,601 -7,569 368,032
-144,029 -144,029 -88,113 -88,113 -88,113 -299 -299 451 152 0 762 762
12,767 -405 -3,398 -175,575 -1,200,196 2,960,094 -22,949 2,937,145
4,323 -414 0 -133,870 -1,617,016 2,821,521 -13,478 2,808,043-1,096 2,723 1,627 1,627
4,633 4,633 4,6333,227 -414 0 -133,870 -1,609,660 2,827,781 -13,478 2,814,303
-10,364 29 -925 -39,258 -50,518 -3,414 -53,932 217,261 217,261 286 217,547
-10,364 29 -925 -39,258 217,261 166,743 -3,128 163,615 -106,478 -106,478
8,910 8,910 0 0 0 0
-1,749 1,749 0 0 -77,928 -77,928 -90 -78,018 -2,094 -2,094 244 -1,850 0 -141 -141
-8,886 -385 -925 -173,128 -1,470,672 2,816,934 -16,593 2,800,341

124 IMMOFINANZ AGAnnual Report 2019
1. General Principles
1.1 Reporting company IMMOFINANZ AG is the parent company of the IMMOFINANZ Group, a listed real estate company in Austria. Its registered headquarters are located at Wienerbergstrasse 11, 1100 Vienna. The business activities of IMMOFINANZ cover the development, acquisition, rental and best possible commercial utilisation of proper-ties. The IMMOFINANZ AG share is listed in the Prime Market segment of the Vienna Stock Exchange and in the main market segment of the Warsaw Stock Exchange.
1.2 Basis of reporting These consolidated financial statements cover the financial year from 1 January to 31 December 2019. They were prepared in accordance with §245a (1) of the Austrian Commercial Code and in agreement with Inter-national Financial Reporting Standards (IFRS), as adopted by the EU.
The consolidated financial statements are presented in the euro, which is the functional currency of the parent company. All financial information reported in the euro is rounded to thousand euros, unless indicated other-wise. The use of automatic data processing equipment can lead to rounding differences in the addition of rounded amounts and percentage rates.
Uniform accounting policies are used to measure the assets and liabilities of all Group companies, whereby these items are basically measured individually. Disposal groups represent an exception to this practice and are reported under “assets held for sale” and “liabilities held for sale” (see section 4.9). In addition, impairment losses are calculated in part on the basis of cash-generating units if the recoverable amount of specific assets (goodwill) cannot be determined separately (see section 4.4.2).
Assets and liabilities are generally measured at amortised cost. For financial assets and liabilities, this involves the application of the effective interest rate method. In contrast, different measurement methods are applied to the following material positions:
– Investment property and property under construction are measured at fair value. – Derivative financial instruments are measured at fair value. – Provisions are measured at the present value of the expected settlement amount. – Deferred tax assets and deferred tax liabilities are measured at their nominal value based on the temporary
differences as of the balance sheet date and the tax rate expected when the existing differences are realised. – Non-current assets and disposal groups held for sale are measured at the lower of the carrying amount or
fair value less costs to sell unless they are excluded from the valuation requirements defined in IFRS 5. This applies, in particular, to investment property that is measured based on the fair value model.
Notes to the Consolidated Financial Statements

CONSOLIDATED FINANCIAL STATEMENTSGeneral Principles
125
CO
NS
OL
IDA
TE
D F
INA
NC
IAL
STA
TE
ME
NT
S
Fair value is not always available as an observable market price, but must often be determined on the basis of various valuation parameters. Depending on the availability of observable parameters and the importance of these parameters for the general assessment procedure, the fair values are classified in different levels on the fair-value hierarchy:
– Level 1: quoted prices (unadjusted) on active markets for identical assets or liabilities – Level 2: valuation parameters that do not reflect the quoted prices defined for Level 1, but which can be
derived directly (as a price) or indirectly (from prices) for the asset or liability – Level 3: valuation parameters for assets or liabilities that are not based on observable market data
1.3 Judgments and estimation uncertainty
1.3.1 Judgments The following notes provide information on judgments made in the application of accounting methods which have the greatest influence on the amounts recognised in the consolidated financial statements: – Full consolidation (see section 2.2.2): assessment of the existence of control over subsidiaries in cases where
control is not based solely on the ownership interest (de facto control) and assessment of the existence of joint control or significant influence when a majority holding does not convey control over an investment
– Full consolidation (see section 2.2.2): assessment of whether the acquisition of property companies represents business combinations in the sense of IFRS 3 (characteristics of a business)
– Equity accounting (see section 2.2.3): assessment of the existence of significant influence in contrast to the assumption of such influence at an ownership interest of 20% or more and evaluation of the existence of objective indications of impairment
– Functional currency (see section 2.5.1): determination of the functional currency of a foreign operation, above all when this currency differs from the currency of the subsidiary’s headquarter’s country
– Rental income (see section 5.1.1): assessment of whether an adjustment to a rental agreement substantially represents a new rental relationship
– Information on financial instruments (see section 7.1): identification and accounting treatment of embedded derivatives
1.3.2 Assumptions and estimates The preparation of consolidated financial statements requires the Executive Board to make assumptions and estimates related to the application of accounting methods and the amounts reported for assets, liabilities, income and expenses. Actual results can vary from these estimates. The estimates and underlying assumptions are reviewed regularly, and any changes to these estimates are recognised prospectively. The following notes provide information on assumptions and estimation uncertainty which can lead to a significant risk that a ma-terial adjustment will be required during the financial year ending on 31 December 2020:
– Valuation assumptions and existing uncertainty (see section 4.1.3): determination of the fair value of invest-ment property and property under construction
– Goodwill (see section 4.4.2): determination of the recoverable amount within the scope of impairment tests – Equity-accounted investments (see section 4.5): determination of the recoverable amount within the scope
of impairment tests for investments in associates – Conditional purchase price receivables (see section 2.4): determination of the fair value of conditional pur-
chase price receivables – Contingent receivables (see section 2.4): contingent receivables may only be recognised when their realisa-
tion as income is highly probable – Deferred taxes (see section 4.8): assessment of the usability of deferred tax assets (above all from loss
carryforwards) – Real estate inventories (see section 4.10): determination of the net realisable value of inventories

126 IMMOFINANZ AGAnnual Report 2019
– Provisions (see section 4.16): determination of the expected settlement amount and the related present value
– Financial instruments (see section 7.1.3): determination of the fair value of primary and derivative financial instruments
– Contingent liabilities and guarantees (see section 7.3): assessment of the expected claims from obligations not reported on the balance sheet
1.4 First-time application of standards and interpretations The following new or revised standards and interpretations were applied for the first time in 2019:
Standard Content Published by the IASB
(adopted by the EU)
Mandatory application for IMMOFINANZ
Effects on IMMOFINANZ
New standards and interpretations IFRS 16 Leases 13 January 2016
(31 October 2017)1 January 2019 Yes
IFRIC 23 Uncertainty concerning income tax treatment 7 June 2017 (23 October 2018)
1 January 2019 Yes
Changes to standards and interpretations IFRS 9 Clarification of the classification of financial
assets with negative prepayment penalty 12 October 2017 (22 March 2018)
1 January 2019 No
IAS 28 Clarification of the applicability of IFRS 9 to financial instruments due from/to associates and joint ventures which are not accounted for at equity
12 October 2017 (8 February 2019)
1 January 2019 No
IAS 19 Clarification of the treatment of plan amend-ments, curtailments and settlement of pension obligations
7 February 2018 (13 March 2019)
1 January 2019 No
Various Annual improvements to IFRS 2015-2017 12 December 2017 (14 March 2019)
1 January 2019 No
IFRS 16: Leasing IFRS 16 replaced the previous rules for the recognition and measurement of leases (IAS 17) as of 1 January 2019. It introduced extensive changes to lease accounting for the lessee, while the rules for lessors remain largely unchanged. The changeover to the new standard was based on the modified retrospective approach, and the comparative prior year data were not adjusted.
IFRS 16 standardises the accounting presentation of leasing contracts for the lessee, in that all future leases must be reported on the balance sheet as rights of use for the leased assets and as lease liabilities for the related payment obligations. The lease liability represents the present value of the remaining lease payments as of the initial application date. Discounting is based on the incremental borrowing rate, whereby the weighted average incremental borrowing rate equalled 3.7% as of 1 January 2019. Depending on the underlying lease product, the incremental borrowing rates consist of a currency- and maturity-based reference interest rate plus risk premiums.
For short-term leases (under 12 months) and low-value leases (under EUR 5,000), IMMOFINANZ applies the practical expedients provided by IFRS 16. The practical expedient to waive the separation of lease and non-lease components was not applied. The initial measurement of the right of use does not include initial direct costs. Contracts concluded prior to 1 January 2019 which were classified as leases under IAS 17 and IFRIC 4 were not remeasured in accordance with IFRS 16. No onerous contracts were identified during the initial ap-plication of this standard.

CONSOLIDATED FINANCIAL STATEMENTSGeneral Principles
127
CO
NS
OL
IDA
TE
D F
INA
NC
IAL
STA
TE
ME
NT
S
IMMOFINANZ is the lessee of leasehold rights in Poland, Austria and Germany and, to a lesser extent, the lessee of buildings, land and other assets (autos and other items of furniture, fixtures and office equipment).
The recognition of rights of use in accordance with IFRS 16 led, above all, to an increase in investment prop-erty, property under construction and non-current financial liabilities. These rights of use reflected the amount of the lease liabilities as of the initial application date and, consequently, there was no effect on equity. The rights of use for investment property and property under construction will be subsequently measured at fair value in accordance with IAS 40 and therefore represent the related lease liabilities as of the balance sheet date. The lease payments for leasehold rights are generally indexed and, as a result, regularly represent the current market price. The average remaining term of the leases for leasehold rights equalled 61.3 years as of 31 December 2019 (2018: 65.7 years). As a rule, these leases do not include purchase options.
The effects of the initial application of IFRS 16 on the involved balance sheet positions are shown in the fol-lowing table:
All amounts in TEUR 31 12 2018as reported
Effects of the initial applica-
tion of IFRS 16 1 1 2019adjusted
Investment property 3,893,568 58,889 3,952,457Property under construction 397,540 12,236 409,776Other tangible assets 1,109 1,056 2,165Non-current assets 4,873,747 72,181 4,945,928Assets held for sale 57,162 1,147 58,309Current assets 963,921 1,147 965,068Assets 5,837,668 73,328 5,910,996 Equity 2,800,341 0 2,800,341Financial liabilities 1,802,563 71,418 1,873,981
Thereof lease liabilities (1 to 5 years) 0 1,653 1,653Thereof lease liabilities (over 5 years) 0 69,765 69,765
Non-current liabilities 2,478,917 71,418 2,550,335Financial liabilities 338,321 763 339,084
Thereof lease liabilities (up to 1 year) 0 763 763Financial liabilities held for sale 0 1,147 1,147Current liabilities 558,410 1,910 560,320Equity and liabilities 5,837,668 73,328 5,910,996
Based on the operating lease obligations held by IMMOFINANZ as of 31 December 2018, the transition to the lease liabilities reported as of 1 January 2019 is as follows:
All amounts in TEUR 1 1 2019 Minimum lease payments from non-cancellable operating leases as of 31 December 2018 193,935Discounting of minimum lease payments at the incremental borrowing rate -120,112Less practical expedients from the application -495
Thereof for short-term leases -319Thereof for low-value leases -176
Additional lease liability from the initial application of IFRS 16 as of 1 January 2019 73,328Thereof current lease liabilities 763Thereof non-current lease liabilities 71,418Thereof lease liabilities held for sale 1,147

128 IMMOFINANZ AGAnnual Report 2019
With regard to accounting by the lessor, the revenues previously included under operating costs charged to tenants – which are not contrasted by the provision of services in the narrower sense of the term, but only represent the reimbursement of costs connected with legal ownership of the property (i.e. property tax and building insurance) – have been reported as rental income since 1 January 2019 in the sense of IFRS 16. The revenues from advertising space and telecommunications equipment, which were previously included in other revenues, have also been reported as rental income in the sense of IFRS 16 since 1 January 2019. These reclassifications have no effect on the calculation of FFO or earnings as reported on the consolidated income statement, but only involve a change in presentation under the results of asset management. Property taxes and building insurance totalled EUR 12.1 million as of 31 December 2019, and the revenues from advertising space and telecommunications equipment amounted to EUR 4.3 million.
IFRIC 23: Uncertainty over income tax treatment IFRIC 23 includes supplementary provisions to IAS 12 which clarify uncertainties over the tax treatment of certain circumstances and the acceptance of the chosen treatment by the tax authority. Uncertainty arises in connection with income tax treatment when the application of the respective tax law to a specific transaction is not clear and is therefore (also) dependent on the interpretation of the tax authority – which was unknown at the time the financial statements are prepared. This uncertainty in the measurement of current and deferred taxes may only be recognised when it is probable that the related tax will be paid or refunded.
The initial application of IFRIC 23 had no quantitative effects for IMMOFINANZ. The evaluation of risks arising from the uncertainty of income tax treatments as of 31 December 2019 involved three cases in Austria, Germany and Poland. IMMOFINANZ evaluated the underlying accounting basis for the related tax risks with scenario analyses and estimates by the involved attorneys and tax advisors.
As a result of the analysis, IMMOFINANZ assumes that the tax authorities will accept the uncertain amounts of EUR 10.8 million in the related proceedings and also assumes that the risks have been appropriately ac-counted for since the start of the proceedings. Since the evaluation by the tax authorities in Austria and other countries is not easy to predict and the refund of previous payments is not considered sufficiently probable for the recognition of a contingent liability, these prepayments were not included in the consolidated financial statements as of 31 December 2019. The evaluation of the circumstances relevant for the IMMOFINANZ Group did not result in any material quantitative effects at year-end.
1.5 Standards and interpretations applicable in the future
1.5.1 Standards and interpretations adopted by the EU, but not yet applied The following changes to standards and interpretations had been adopted by the EU as of the balance sheet date, but did not require mandatory application in the 2019 financial year and were not applied prematurely:
Standard Content Published by the IASB
(adopted by the EU)
Mandatory application for IMMOFINANZ
Expected effects on IMMOFINANZ
Changes to standards and interpretations IAS 1, IAS 8
Definition of materiality 31 October 2018 (29 November 2019)
1 January 2020 No
Conceptual Framework
Amended references to the revised Conceptual Framework
29 March 2018 (29 November 2019)
1 January 2020 No

CONSOLIDATED FINANCIAL STATEMENTSGeneral Principles
129
CO
NS
OL
IDA
TE
D F
INA
NC
IAL
STA
TE
ME
NT
S
1.5.2 Standards and interpretations announced, but not yet adopted by the EU The following changes or revisions to standards and interpretations had been published as of the balance sheet date, but have not yet been adopted by the EU and are therefore not applicable:
Standard Content Published by the IASB
Expected mandatory application for IMMOFINANZ
Expected effects on IMMOFINANZ
New standards and interpretations IFRS 14 Rate-regulated activities 30 January 2014 Not adopted by the EU NoIFRS 17 Insurance contracts 18 May 2017 Not adopted by the EU NoChanges to standards and interpretations IFRS 10, IAS 28
Sale or contribution of assets between an investor and an associate or joint venture
11 September 2014 Postponed Yes
IFRS 9, IAS 39 and IFRS 7
Change involving certain reliefs for hedge accounting requirements
26 September 2019 1 January 2020 No
IFRS 3 Clarification of IFRS 3 business combinations
22 October 2018 1 January 2020 No
Various Annual improvements to IFRS 2016-2018
7 February 2018 1 January 2020 No
1.6 Change in comparative information The income statement for the 2018 financial year was adjusted to provide a more transparent presentation of the development of outstanding purchase price receivables from discontinued operations. The reclassifi-cation of compounding effects totalling EUR 1.1 million (2018: EUR 1.0 million) from financial results to dis-continued operations better reflects the share of earnings on the consolidated income statement.

130 IMMOFINANZ AGAnnual Report 2019
2. Scope of Consolidation
2.1 Development of the scope of consolidation
Scope of consolidation Subsidiaries
full consolidationJoint ventures
at equityAssociates
at equity Total Balance on 31 December 2018 281 6 12 299Companies initially included
Other acquisitions 9 -2 -1 6Companies no longer included
Sales -13 -2 -3 -18Mergers -12 0 0 -12Liquidations -37 0 -1 -38
Balance on 31 December 2019 228 2 7 237Thereof foreign companies 158 2 0 160Thereof in liquidation 11 0 0 11Thereof intragroup merger resolution adopted 2 0 0 2
An overview of the companies included in the consolidated financial statements is provided in section 8.
The nine subsidiaries included under other acquisitions include, among others, WS Tower Sp. z o.o. Pl. Europe-jski 1 S.K.A., NP Investments a.s. and FMZ Lublin Sp. z o.o. as well as Palmovka 0, s.r.o., Palmovka 3, s.r.o. and Palmovka 4, s.r.o.
For 21 of the 37 companies liquidated in 2019, the tax authority assessment and the deletion from the com-pany register were still incomplete at year-end. These companies are, however, presented as deconsolidated as of 31 December 2019 for reasons of immateriality.
Initially consolidated subsidiaries which do not constitute a business on the acquisition date are not considered business combinations in the sense of IFRS 3 and are included in the above table as other acquisitions.
The subsidiaries with an investment of less than 100% (see section 8) have no material non-controlling interests.
Restrictions defined by the articles of association, contracts or legal regulations as well as protective rights held by non-controlling interests can limit the ability of IMMOFINANZ to gain access to the Group’s assets, to transfer these assets between Group companies or to utilise the coverage potential of these assets to meet liabilities. Information on the existing limitations is provided in sections 7.1.4 and 7.3.1.
No business combinations as defined in IFRS 3 were carried out in 2019.
2.2 Consolidation methods
2.2.1 Basis for consolidation Standardised accounting and valuation principles as well as uniform options and judgments are applied by all companies included in the consolidated financial statements. Material interim profits – which arise, at most, from the intragroup transfer of investments in other companies, treasury shares, receivables or properties – are eliminated. The financial statements of all companies included through full consolidation and joint ventures accounted for at equity were prepared as of the same balance sheet date as the consolidated financial state-ments. For associates, the latest available financial statements form the basis for accounting. In cases where a different balance sheet date is used, any necessary adjustments are recognised when applying the equity-

CONSOLIDATED FINANCIAL STATEMENTSScope of Consolidation
131
CO
NS
OL
IDA
TE
D F
INA
NC
IAL
STA
TE
ME
NT
S
method of accounting for material transactions or other events that occur between the associate’s balance sheet date and IMMOFINANZ’s balance sheet date.
2.2.2 Full consolidation A subsidiary is an entity that is controlled by a parent company. A subsidiary is included in the consolidated financial statements through full consolidation from the date on which IMMOFINANZ attains control over the subsidiary and up to the date on which control ends.
A controlling influence based on voting rights is generally presumed to exist when the direct or indirect interest in an entity exceeds 50%. In individual cases (see section 8.), interests over 50% are contrasted by statutory rights for a co-investor or the absence of a connection between IMMOFINANZ’s control over the investee and the receipt of variable returns. A co-investor may be assumed to have such statutory rights, above all, when there are wide-ranging requirements for unanimity or the co-investor’s agreement on decisions over material activities (e.g. the sale of investment property). Investments with a share of voting rights less than 50% are reviewed to determine whether control is established by other factors.
The acquisition of a subsidiary requires a decision as to whether the entity represents a business in the sense of IFRS 3. Assessing whether acquired property assets represent a business in the sense of IFRS 3 involves discretionary judgment and, frequently, a detailed analysis of the acquired processes and structures, above all with respect to asset and property management. If a business is acquired the acquisition method defined by IFRS 3 is applied. The related transaction costs are treated as an expense and deferred taxes on temporary differences between the fair value of the acquired property assets and their respective tax bases are recog-nised in full. At IMMOFINANZ, goodwill (see section 4.4.2) regularly results as a technical figure because of the obligation to record deferred taxes on the difference between the fair value and the tax base of the acquired real estate assets. The acquisition method is not applied if the acquired entity does not represent a business. The acquisition of shell companies and pure land-owning companies does not normally involve a business. In this case the acquisition costs, including transaction costs, are allocated to the acquired assets and assumed liabilities based on their fair value; deferred taxes are not recognised (initial recognition exemption); and good-will does not arise.
2.2.3 Equity method IMMOFINANZ’s interests in equity-accounted investments comprise shares in joint ventures and associates.
IFRS 11 differentiates between joint ventures and joint operations. The joint arrangements in which IMMOFINANZ is involved generally represent joint ventures. A joint venture is a joint arrangement under which the co-investors exercise joint control over a company and (only) have rights to the company’s net assets. There are no direct claims or obligations arising from the company’s assets and liabilities.
Associates are companies over which IMMOFINANZ can exercise significant influence. Significant influence is the power to participate in an investee’s financial and operating policy decisions without control or joint con-trol. It is generally presumed (but can be refuted) when the direct or indirect interest in the investee equals or exceeds 20%. The possibilities for influence created by company law (e.g. through seats on a supervisory board) or other available opportunities can also lead to significant influence when an interest is less than 20%. With respect to shares in real estate funds, IMMOFINANZ does not have significant influence, even with an interest of 20% or more, because it is not represented in the fund’s operating management or this influence is excluded by the fund’s legal structure (see section 8.).
In accordance with the equity method of accounting, investments in associates or joint ventures are initially recognised at cost, including transaction costs, as of the acquisition date. Any surplus of the acquisition cost over the acquired share of identifiable assets and assumed liabilities and contingent liabilities at fair value is recognised as goodwill. Negative differences are recognised immediately to profit or loss. Goodwill represents part of the carrying amount of the investment and is not tested separately for impairment. After initial recog-nition, the carrying amount of the investment is increased or decreased by the proportional share of the in-vestee’s profit or loss and other comprehensive income attributable to IMMOFINANZ until significant influence or joint control ends. Any losses recorded by an associate or joint venture which exceed IMMOFINANZ’s in-vestment in this entity are not recognised. Such losses are only recognised when the Group has a legal or actual obligation to cover the losses. The investments in companies accounted for at equity are assessed for

132 IMMOFINANZ AGAnnual Report 2019
indications of impairment as of every balance sheet date in accordance with IAS 28. If any such indications are identified, the investments are tested for impairment in accordance with IAS 36.
2.3 Sale of subsidiaries An overview of the subsidiaries deconsolidated in 2019 is provided in section 8.
The following table summarises the effects on various balance sheet items as well as the deconsolidation results from the sale of subsidiaries, with the exception of the effects reported under section 2.4 for discon-tinued operations:
All amounts in TEUR 2019 Investment property (see 4.1) 13,460Receivables and other assets 86,673Investment properties held for sale 18,390Assets held for sale 202Cash and cash equivalents held for sale 252Cash and cash equivalents 1,251Financial liabilities -58,714Other liabilities -45,799Provisions -169Deferred tax liabilities -296Liabilities held for sale -1,561Net assets sold 13,689 Consideration received in cash and cash equivalents 15,411Less net assets sold -13,689Less non-controlling interests -756Reclassification of foreign exchange differences to profit or loss 770Results from deconsolidation 1,736 Consideration received in cash and cash equivalents 15,411Less cash and cash equivalents sold -1,503Net inflow of cash and cash equivalents 13,908
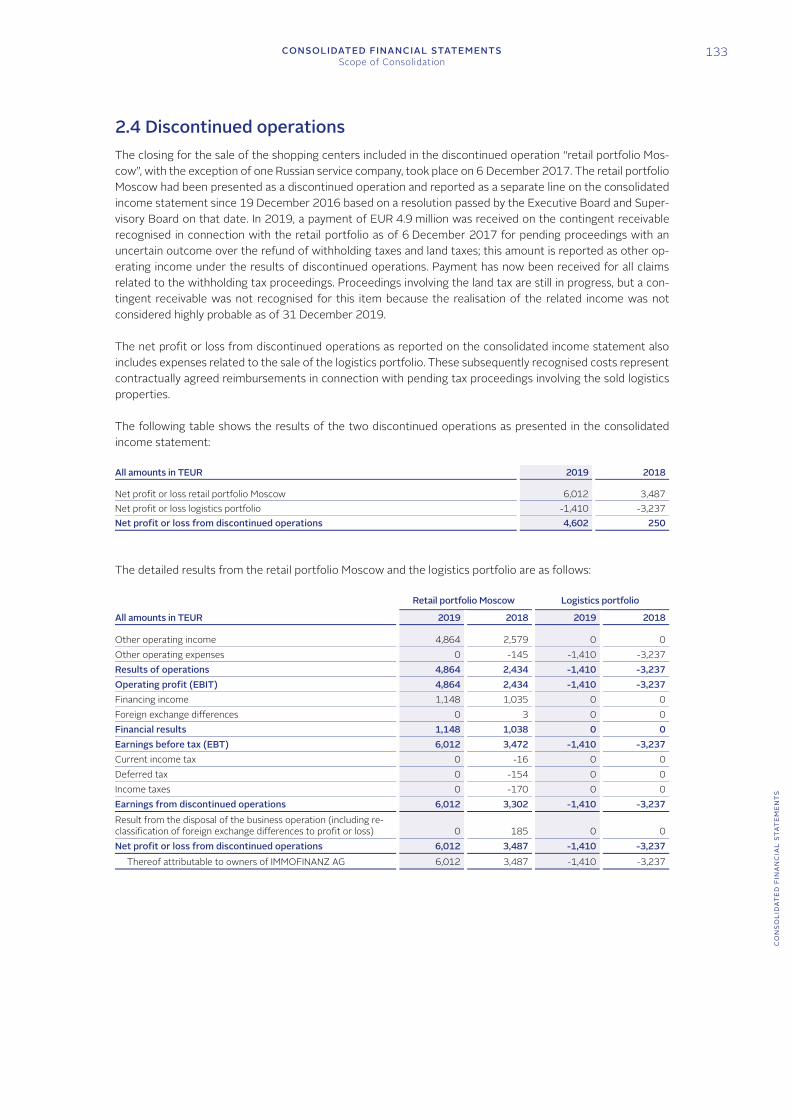
CONSOLIDATED FINANCIAL STATEMENTSScope of Consolidation
133
CO
NS
OL
IDA
TE
D F
INA
NC
IAL
STA
TE
ME
NT
S
2.4 Discontinued operations The closing for the sale of the shopping centers included in the discontinued operation “retail portfolio Mos-cow”, with the exception of one Russian service company, took place on 6 December 2017. The retail portfolio Moscow had been presented as a discontinued operation and reported as a separate line on the consolidated income statement since 19 December 2016 based on a resolution passed by the Executive Board and Super-visory Board on that date. In 2019, a payment of EUR 4.9 million was received on the contingent receivable recognised in connection with the retail portfolio as of 6 December 2017 for pending proceedings with an uncertain outcome over the refund of withholding taxes and land taxes; this amount is reported as other op-erating income under the results of discontinued operations. Payment has now been received for all claims related to the withholding tax proceedings. Proceedings involving the land tax are still in progress, but a con-tingent receivable was not recognised for this item because the realisation of the related income was not considered highly probable as of 31 December 2019.
The net profit or loss from discontinued operations as reported on the consolidated income statement also includes expenses related to the sale of the logistics portfolio. These subsequently recognised costs represent contractually agreed reimbursements in connection with pending tax proceedings involving the sold logistics properties.
The following table shows the results of the two discontinued operations as presented in the consolidated income statement:
All amounts in TEUR 2019 2018 Net profit or loss retail portfolio Moscow 6,012 3,487Net profit or loss logistics portfolio -1,410 -3,237Net profit or loss from discontinued operations 4,602 250
The detailed results from the retail portfolio Moscow and the logistics portfolio are as follows:
Retail portfolio Moscow Logistics portfolio
All amounts in TEUR 2019 2018 2019 2018 Other operating income 4,864 2,579 0 0Other operating expenses 0 -145 -1,410 -3,237Results of operations 4,864 2,434 -1,410 -3,237Operating profit (EBIT) 4,864 2,434 -1,410 -3,237Financing income 1,148 1,035 0 0Foreign exchange differences 0 3 0 0Financial results 1,148 1,038 0 0Earnings before tax (EBT) 6,012 3,472 -1,410 -3,237Current income tax 0 -16 0 0Deferred tax 0 -154 0 0Income taxes 0 -170 0 0Earnings from discontinued operations 6,012 3,302 -1,410 -3,237Result from the disposal of the business operation (including re-classification of foreign exchange differences to profit or loss) 0 185 0 0Net profit or loss from discontinued operations 6,012 3,487 -1,410 -3,237
Thereof attributable to owners of IMMOFINANZ AG 6,012 3,487 -1,410 -3,237

134 IMMOFINANZ AGAnnual Report 2019
The influence of the discontinued operations on the consolidated cash flow statement (condensed) is as follows:
Retail portfolio Moscow Logistics portfolio
All amounts in TEUR 2019 2018 2019 2018 Cash flow from operating activities 0 -1,110 0 0Cash flow from investing activities 4,864 2,568 -10,015 5,150Net cash flow from discontinued operations 4,864 1,458 -10,015 5,150
The cash flows reported in the above table for 2018 comprised cash flows from discontinued operations, cash received as a reimbursement for withholding and land taxes as well as cash inflows from the final payments on outstanding purchase price receivables. The cash flows reported for 2019 consisted primarily of further reim-bursements for withholding and land taxes as well as cash outflows for pending tax proceedings involving the sold logistics segment.
2.5 Foreign currency translation
2.5.1 Functional currency The Group reporting currency is the euro. For subsidiaries and equity-accounted investments that prepare their financial statements in a foreign currency, the determination of the functional currency is based on the primary (macro)economic environment in which the respective company operates. One determining factor is the currency in which the majority of cash flows, goods and services are denominated and settled in the rele-vant country.
When the functional currency of a subsidiary cannot be clearly identified, IAS 21 allows management to use its judgment to determine the functional currency that most faithfully represents the economic effects of the underlying transactions and events. Management has principally designated the euro as the functional currency for the subsidiaries in Romania, Poland, Czech Republic and Hungary; however, the local currency remains the functional currency for individual service and management companies. This decision reflects the fact that mac-roeconomic developments in these countries are influenced by the eurozone. In addition, the leases concluded by IMMOFINANZ in these countries and real estate financing are generally denominated in the euro.
2.5.2 Translation of financial statements from foreign subsidiaries, joint ventures and associates
In accordance with IAS 21, the modified current rate method is used to translate the financial statements of the Group’s subsidiaries, joint ventures and associates whose functional currency is not the euro. The assets and liabilities in the financial statements to be consolidated are translated at the mean exchange rate on the balance sheet date, while the income statement positions are translated at the weighted average exchange rate for each quarter.
Foreign currency translation is based on the exchange rates issued by the European Central Bank and by local national banks.

CONSOLIDATED FINANCIAL STATEMENTSScope of Consolidation
135
CO
NS
OL
IDA
TE
D F
INA
NC
IAL
STA
TE
ME
NT
S
The following table lists the exchange rates in effect on the balance sheet date and the average exchange rates for the key currencies from IMMOFINANZ’s viewpoint:
Currency Closing rate on
31 12 2019 Closing rate on
31 12 2018Average rate
2019Average rate
2018 BGN 1.95583 1.95583 1.95583 1.95583CHF 1.08540 1.12690 1.11398 1.15572CZK 25.41000 25.72500 25.65708 25.64438HRK 7.44258 7.41758 7.41703 7.42515RSD 117.59280 118.19460 117.90992 118.21095RUB 69.95630 79.71530 72.55145 73.93892TRY 6.68430 6.05880 6.36618 5.63557UAH 26.58000 31.77500 29.10388 32.30751USD 1.12340 1.14500 1.12402 1.18246

136 IMMOFINANZ AGAnnual Report 2019
3. Information on Operating Segments
3.1 Internal reporting The chief operating decision-maker of IMMOFINANZ is the Executive Board as a collegial body. Internal re-porting to the Executive Board is based on the classification of data into seven regional core markets (Austria, Germany, Czech Republic, Slovakia, Hungary, Romania and Poland). Within the core markets, rental income is reported by asset class (office, retail and others). Regions with a lower volume of business are aggregated under “Other non-core countries”. The presentation of segment results is based on internal reporting to the Executive Board (management approach), whereby the statement of comprehensive income only includes the continuing operations.
3.2 Transition from operating segments to Group results There are no material transactions between the segments, and the elimination of intersegment amounts is therefore not reported separately. Central services are allocated to the operating segments based on actual expenses. Service companies that only work for a particular segment are allocated to that segment.
Investments in holding companies that cannot be assigned to a specific segment and non-operating subsidi-aries are included in the transition column. Also included in this column is elimination of immaterial interseg-ment transactions.
3.3 Information on reportable operating segments Segment assets consist primarily of investment properties, property under construction, goodwill, properties held for sale and real estate inventories. Segment investments include additions to investment property and property under construction as well as rights of use as defined in IFRS 16. Liabilities are not allocated to the individual segments for internal reporting purposes.
The results of asset management and operating profit (EBIT) are used to assess performance and to allocate resources. The development of financial results and tax expense in the Group is managed centrally. Separate country boards, which report regularly to the chief operating decision-maker, were established for the core markets. EBIT in the “total” column reflects the same position on the income statement; the reconciliation to earnings before tax can be seen in the income statement.
The accounting and valuation methods applied by the reportable segments comply with the accounting and valuation methods used to prepare IMMOFINANZ’s consolidated financial statements.

CONSOLIDATED FINANCIAL STATEMENTSInformation on Operating Segments
137
CO
NS
OL
IDA
TE
D F
INA
NC
IAL
STA
TE
ME
NT
S
3.4 Regions as operating segments The allocation of revenues and non-current assets to the individual regions is based on the location of the property.
– Austria: The business segment Austria is a major focal point for the office standing investments. These prop-erties include, among others, the myhive Twin Towers and the City Tower Vienna. This portfolio also includes retail properties under the STOP SHOP brand and properties in the other asset class.
– Germany: This business segment is the location for the TRIVAGO as well as the FLOAT office complex in Düsseldorf which was completed in 2019 and for the Campus Aachen. IMMOFINANZ’s third major property in Germany is the myhive Medienhafen which is currently under development.
– Poland: This country represents a further focal point for the office standing investments. The portfolio in Poland was strengthened in 2019, above all, by the acquisition of the Warsaw Spire in the third quarter of 2019. Other key office locations include the myhive Park Postępu, myhive IO-1 building and myhive Nimbus Office in Warsaw as well as the EMPARK Mokotòw Business Park. This operating segment also contains retail properties like the VIVO! shopping centers in Lublin, Stalowa Wola, Piła and Krosno as well as nine retail parks under the STOP SHOP brand.
– Czech Republic: The office portfolio in the Czech Republic was increased by two major office acquisitions in 2019. In addition to the full takeover of the Na Příkopě property from the joint venture partner, IMMOFINANZ also acquired the Palmovka Open Park office complex in Prague. Other important properties include the BB Centrum Gamma and myhive Pankrac House as well as retail properties under the VIVO! and STOP SHOP brands.
– Slovakia: The core business in Slovakia lies primarily in the retail asset class with the VIVO! Bratislava and STOP SHOP retail parks. This portfolio also includes office properties like the myhive Vajnorská.
– Hungary: This portfolio covers a balanced mix of office properties like the myhive Átrium Park and myhive Haller Gardens as well as several retail parks under the STOP SHOP brand.
– Romania: The business segment Romania consists primarily of office properties like the myhive S-Park and IRIDE Business Park as well as retail properties like the VIVO! Cluj-Napoca and VIVO! Constanta shopping centers.
– Other countries: This business segment consists primarily of STOP SHOP retail parks in Slovenia, Serbia and Croatia, which were expanded during 2019 by further acquisitions in Slovenia and development projects in Serbia. It also includes an office property in Zagreb and properties in the other asset class in Turkey.
3.5 Information on key customers IMMOFINANZ had no individual customers who accounted for 10% or more of revenues in the 2019 or 2018 financial year.

138 IMMOFINANZ AGAnnual Report 2019
3.6 Segment reporting Information on IMMOFINANZ’S reportable segments is provided in the following section:
Austria Germany
All amounts in TEUR 2019 2018 2019 2018 Office 25,580 29,606 19,151 9,287Retail 11,614 10,938 0 65Other 4,912 7,118 2,160 1,142Rental income 42,106 47,662 21,311 10,494Operating costs charged to tenants 9,823 11,965 3,964 3,271Other revenues 220 551 0 0Revenues 52,149 60,178 25,275 13,765Expenses from investment property -13,277 -16,041 -2,189 -6,663Operating expenses -12,735 -13,313 -4,839 -3,815Results of asset management 26,137 30,824 18,247 3,287Results of property sales -1,768 -3,019 -156 959Results of property development 8,578 -5,161 -9,443 3,217Other operating income 1,065 1,118 528 372Other operating expenses -2,634 -702 -2,185 -4,902Results of operations 31,378 23,060 6,991 2,933Revaluation result from standing investments and goodwill 47,349 -19,583 75,386 -552Operating profit (EBIT) 78,727 3,477 82,377 2,381 31 12 2019 31 12 2018 31 12 2019 31 12 2018 Investment property 796,143 737,800 586,258 279,080Property under construction 93,610 70,360 67,560 239,680Goodwill 0 0 0 0Investment properties held for sale 5,476 21,600 0 8,292Real estate inventories 0 0 520 46,284Segment assets 895,229 829,760 654,338 573,336 2019 2018 2019 2018 Segment investments 55,970 30,116 61,001 86,582

CONSOLIDATED FINANCIAL STATEMENTSInformation on Operating Segments
139
CO
NS
OL
IDA
TE
D F
INA
NC
IAL
STA
TE
ME
NT
S
Poland Czech Republic
All amounts in TEUR 2019 2018 2019 2018 Office 32,514 22,883 12,204 9,833Retail 22,279 19,743 12,913 10,355Other 6,023 3,545 1,951 918Rental income 60,816 46,171 27,068 21,106Operating costs charged to tenants 19,281 21,434 8,125 7,154Other revenues 238 2,533 113 236Revenues 80,335 70,138 35,306 28,496Expenses from investment property -8,765 -10,965 -3,035 -4,456Operating expenses -24,353 -24,229 -8,230 -7,322Results of asset management 47,217 34,944 24,041 16,718Results of property sales -3,898 -4,157 -455 6,401Results of property development -2,404 -5,257 -107 -944Other operating income 288 1,666 141 93Other operating expenses -2,911 -3,290 -1,648 -1,534Results of operations 38,292 23,906 21,972 20,734Revaluation result from standing investments and goodwill 12,371 -2,702 16,396 -4,002Operating profit (EBIT) 50,663 21,204 38,368 16,732 31 12 2019 31 12 2018 31 12 2019 31 12 2018 Investment property 1,096,219 716,610 543,333 332,080Property under construction 10,549 43,550 0 7,440Goodwill 32 32 7,056 7,056Investment properties held for sale 138,448 1,480 0 0Real estate inventories 0 0 0 0Segment assets 1,245,248 761,672 550,389 346,576 2019 2018 2019 2018 Segment investments 472,812 7,048 194,783 10,404

140 IMMOFINANZ AGAnnual Report 2019
Slovakia Hungary
All amounts in TEUR 2019 2018 2019 2018 Office 2,936 2,778 13,915 13,375Retail 18,599 17,659 16,820 15,411Other 750 442 2,363 2,080Rental income 22,285 20,879 33,098 30,866Operating costs charged to tenants 9,055 9,884 11,885 12,117Other revenues 82 438 385 334Revenues 31,422 31,201 45,368 43,317Expenses from investment property -8,243 -4,596 -7,124 -5,825Operating expenses -8,633 -8,837 -14,159 -12,696Results of asset management 14,546 17,768 24,085 24,796Results of property sales 499 371 1,181 422Results of property development -154 -141 -398 221Other operating income 149 100 119 66Other operating expenses -1,410 -1,366 -1,725 -2,027Results of operations 13,630 16,732 23,262 23,478Revaluation result from standing investments and goodwill 6,197 1,611 11,887 14,654Operating profit (EBIT) 19,827 18,343 35,149 38,132 31 12 2019 31 12 2018 31 12 2019 31 12 2018 Investment property 330,347 303,600 515,881 527,252Property under construction 0 0 2,530 2,600Goodwill 184 184 2,385 2,708Investment properties held for sale 0 0 245 0Real estate inventories 0 0 0 0Segment assets 330,531 303,784 521,041 532,560 2019 2018 2019 2018 Segment investments 19,604 9,946 1,345 1,184

CONSOLIDATED FINANCIAL STATEMENTSInformation on Operating Segments
141
CO
NS
OL
IDA
TE
D F
INA
NC
IAL
STA
TE
ME
NT
S
Romania Other countries
All amounts in TEUR 2019 2018 2019 2018 Office 16,175 15,122 1,349 1,270Retail 28,621 27,493 19,365 9,910Other 7,175 5,577 510 355Rental income 51,971 48,192 21,224 11,535Operating costs charged to tenants 19,031 21,921 4,306 3,067Other revenues 239 1,890 34 77Revenues 71,241 72,003 25,564 14,679Expenses from investment property -12,406 -13,554 -2,402 -1,888Operating expenses -24,223 -22,552 -4,708 -2,978Results of asset management 34,612 35,897 18,454 9,813Results of property sales 549 2,602 -1,031 23,622Results of property development -8,340 60 -109 3,673Other operating income 3,221 2,069 86 38Other operating expenses -3,938 -58 -710 -2,182Results of operations 26,104 40,570 16,690 34,964Revaluation result from standing investments and goodwill 20,990 11,865 5,107 4,664Operating profit (EBIT) 47,094 52,435 21,797 39,628 31 12 2019 31 12 2018 31 12 2019 31 12 2018 Investment property 771,595 736,554 345,481 260,592Property under construction 24,230 31,270 960 2,640Goodwill 13,529 13,529 998 998Investment properties held for sale 5,762 25,336 0 0Real estate inventories 348 648 0 0Segment assets 815,464 807,337 347,439 264,230 2019 2018 2019 2018 Segment investments 19,301 998 80,488 93,896

142 IMMOFINANZ AGAnnual Report 2019
Total reportable segments
Reconciliation to consolidated financial statements IMMOFINANZ
All amounts in TEUR 2019 2018 2019 2018 2019 2018 Office 123,824 104,154 0 0 123,824 104,154Retail 130,211 111,574 0 0 130,211 111,574Other 25,844 21,177 0 0 25,844 21,177Rental income 279,879 236,905 0 0 279,879 236,905Operating costs charged to tenants 85,470 90,813 0 0 85,470 90,813Other revenues 1,311 6,059 0 0 1,311 6,059Revenues 366,660 333,777 0 0 366,660 333,777Expenses from investment property -57,441 -63,988 0 0 -57,441 -63,988Operating expenses -101,880 -95,742 0 0 -101,880 -95,742Results of asset management 207,339 174,047 0 0 207,339 174,047Results of property sales -5,079 27,201 0 0 -5,079 27,201Results of property development -12,377 -4,332 0 0 -12,377 -4,332Other operating income 5,597 5,522 559 618 6,156 6,140Other operating expenses -17,161 -16,061 -28,983 -33,888 -46,144 -49,949Results of operations 178,319 186,377 -28,424 -33,270 149,895 153,107Revaluation result from standing investments and goodwill 195,683 5,955 0 0 195,683 5,955Operating profit (EBIT) 374,002 192,332 -28,424 -33,270 345,578 159,062 31 12 2019 31 12 2018 31 12 2019 31 12 2018 31 12 2019 31 12 2018 Investment property 4,985,257 3,893,568 0 0 4,985,257 3,893,568Property under construction 199,439 397,540 0 0 199,439 397,540Goodwill 24,184 24,507 0 0 24,184 24,507Investment properties held for sale 149,931 56,708 0 0 149,931 56,708Real estate inventories 868 46,932 0 0 868 46,932Segment assets 5,359,679 4,419,255 0 0 5,359,679 4,419,255 2019 2018 2019 2018 2019 2018 Segment investments 905,304 240,174 0 0 905,304 240,174

CONSOLIDATED FINANCIAL STATEMENTSNotes to the Consolidated Balance Sheet
143
CO
NS
OL
IDA
TE
D F
INA
NC
IAL
STA
TE
ME
NT
S
4. Notes to the Consolidated Balance Sheet
4.1 Investment property Investment property includes land, buildings and/or parts of buildings that are held to generate rental income or for capital appreciation. The space used by the Group is immaterial and is therefore included under invest-ment property. Properties acquired at the start of the development process are classified as property under construction when the necessary decisions have been taken as of the acquisition date. Otherwise all other real estate acquisitions are recognised as investment property.
4.1.1 Development of investment property Details on the development of the fair value of investment property are presented in the following section. Foreign exchange differences resulting from the translation of foreign company assets at the rates in effect at the beginning and the end of the year are presented separately.
The development of investment property is as follows:
All amounts in TEUR 2019 2018 Beginning balance 3,893,568 3,729,519Deconsolidations (see 2.3) -13,460 -57,977Change in scope of consolidation 117,569 0Currency translation adjustments -2,363 -9,290Additions 684,636 111,556Disposals -60,148 -46,041Revaluation 190,982 10,553Reclassifications 252,473 140,314Reclassification from IFRS 5 0 38,860Reclassification to IFRS 5 -78,000 -23,926Ending balance 4,985,257 3,893,568 The additions are related primarily to the acquisition of the Warsaw Spire in Poland and the Palmovka Open Park office complex in Prague as well as retail parks in Slovenia assigned to the STOP SHOP brand and invest-ments in retail properties in Bratislava and Cluj-Napoca.
The disposals in 2019 consisted almost entirely of standing investments in the core countries of Austria, Romania and Hungary. The largest disposal involved the sale of office properties in Vienna and Budapest.
The change in the scope of consolidation involves one property in the office class in the Czech Republic and one retail property in Poland.
The reclassifications are related chiefly to transfers of EUR -33.1 million (2018: EUR -47.8 million) from in-vestment property to property under construction and EUR 269.3 million (2018: EUR 182.5 million) from property under construction to investment property.
The reclassifications to assets held for sale consisted primarily of five office properties in Poland. The assets reclassified as held for sale in the previous year were sold during 2019.
The additions to investment property include rights of use totalling EUR 58.9 million from the initial applica-tion of IFRS 16. As of 31 December 2019, the rights of use included under investment property totalled EUR 63.5 million. The reclassifications to assets held for sale include rights of use totalling EUR 1.2 million from the initial application of IFRS 16. The rights of use reclassified to assets held for sale amounted to

144 IMMOFINANZ AGAnnual Report 2019
EUR 4.3 million as of 31 December 2019 (see section 4.9). Details on the effects of the initial application of IFRS 16 are provided in section 1.4.
4.1.2 Accounting policies The fair value of the standing investments as of 31 December 2019 and in the previous year was generally determined with the so-called hardcore and top-slice method.
Under the hardcore and top-slice method, the net income generated by a property – up to the market rent (the so-called hardcore component) – is capitalised at a normal market interest rate as a perpetual yield over the entire term (term of the rental contract plus subsequent rental). The top-slice component (i.e. the net income that exceeds or falls below the market rent) is then discounted at a risk-adjusted market interest rate if necessary. The amount of the risk premium is dependent on the probability of vacancy. Quantitative infor-mation on the parameters used for valuation is provided in section 4.1.3.
The valuation of undeveloped land is based on a comparable value method. This method uses the realised purchase prices from other sites with a similar location and size to determine the value of the target property.
Properties under construction, development objects and investment properties that were acquired for possi-ble redesign and renovation (redevelopment) are also measured at fair value using the residual value method. Properties whose development has been suspended are valued according to the sales comparison approach. The hardcore and top-slice method is also applied to standing investments that were transferred to property under construction due to upcoming refurbishment or upgrading until detailed redevelopment plans are avail-able. As soon as detailed redevelopment plans are available, valuation is based on the residual value method. The appraiser is responsible for selecting the valuation method. Differences to the above-mentioned proce-dure are therefore possible.
Changes in the fair value of investment properties, properties under construction, properties held for sale and properties sold are recognised to profit or loss and reported on the income statement under revaluation (see section 5.7).
The accounting of investment property in accordance with the fair value model requires regular revaluation. In IMMOFINANZ, the valuation of, de facto, all properties is carried out by independent appraisers in accordance with the recommendations of the European Public Real Estate Association (EPRA).
The IMMOFINANZ properties were appraised by CBRE as of 31 December 2019. Internal valuations were used in a very limited number of cases.
The valuations by these external appraisers are based on their market knowledge and the inspection of the properties as well as supplied information, e.g. rental lists, rental contracts, land register excerpts and invest-ment budgets. This data is reviewed by the appraisers, who verify its plausibility through comparisons with market data. The experts also make estimates, among others, for the occupancy, future rental income, sched-uled investments and expected returns. This process is accompanied by the members of IMMOFINANZ‘s asset management and controlling staffs. The results of the property valuation process are coordinated with IMMOFINANZ’s Executive Board.

CONSOLIDATED FINANCIAL STATEMENTSNotes to the Consolidated Balance Sheet
145
CO
NS
OL
IDA
TE
D F
INA
NC
IAL
STA
TE
ME
NT
S
A Group guideline and the contract concluded by IMMOFINANZ with each appraiser require the inspection of all properties as part of the initial valuation. Starting with the first follow-up valuation, the appraisers are re-quired to inspect at least 10% of the properties in each country of their assigned portfolio and to examine all newly acquired properties each year.
IMMOFINANZ properties are appraised for the preparation of the consolidated financial statements as of 31 December and for the preparation of the consolidated interim financial statements as of 30 June. Internal valuations are carried out for the preparation of the interim financial statements as of 31 March and 30 Sep-tember.
4.1.3 Valuation assumptions and existing valuation uncertainty IFRS 13 requires the classification of assets and liabilities measured at fair value in three fair value hierarchy levels based on the determining input factors. All investment properties are classified under Level 3 of the fair value hierarchy because of the various parameters used in property valuation that are not directly or indirectly observable on the market (see the following table for information on the most important non-observable input factors).
The investment properties are assigned to classes based on their respective characteristics, features and risks. The criteria used for allocation include the business segments and the asset classes (office, retail and others). The office, retail and others asset classes were aggregated into the following country groups based on specific homogeneity criteria: West (Austria, Germany), CEE (Poland, Czech Republic, Slovakia, Hungary, Romania) and Other Countries.
This aggregation results in the following classes: – Office – in each of the country groups West, CEE, Other Countries – Retail – in each of the country groups West, CEE, Other Countries – Other – in each of the country groups West, CEE, Other Countries
The valuation of investment properties is generally based on the hardcore and top-slice method (see section 4.1.2). The following table shows the non-observable input factors used for valuation and also lists the key input parameters for each class of standing investments. A minimum and maximum value is shown for each input parameter in the class; consequently, the various parameters are generally not related to the same prop-erty. In addition to the minimum and maximum amounts, a weighted average and median amount are provided for each input parameter within the individual classes.
The input parameters presented in the following tables for 2019 and 2018 are to be understood as follows:
– Lettable space in sqm: the total gross space available for rental by tenants (excluding parking areas) – Market rent per sqm and month in EUR: the appraiser’s estimate of the monthly rent for which a property
could be rented by knowledgeable and willing parties under appropriate conditions and without compulsion in an arm’s length transaction
– Actual rent per sqm and month in EUR: the monthly rent in square meters based on expected rents for the first year
– Capitalisation rate in %: yield based on the expected income from the property – Vacancy rate in %: the actual vacancy rate as of the balance sheet date – Weighted average remaining term of the rental contracts in years: a weighted average of the remaining terms
is developed on the basis of the existing rental agreements for a property
Depending on the estimates of risk – which are based, in general, on the asset class, the country and current market circumstances and, in particular, on the condition of the building, its location and occupancy rate – different capitalisation rates are applied to the individual properties. The assumptions underlying the valuation, e.g. for market rents, rental default risks, vacancies or maintenance costs, are based on market assessments, on derived data or on the appraisers’ experience.

146 IMMOFINANZ AGAnnual Report 2019
The following tables also include the investment property classified held for sale (see section 4.9) in cases where current appraisals were available as of the balance sheet date.
Office
2019 Lettable space
in sqm
Market rent per sqm,
month and property in EUR
Actual rent per sqm,
month and property in EUR
Capitalisation rate in %
Vacancy rate in %
West min 2,194 6.53 6.32 2.90 0.00 max 66,394 24.65 22.97 5.45 11.11 weighted average 19,278 14.51 14.87 4.17 2.59 median 13,857 13.87 14.72 4.28 0.06CEE min 5,914 8.85 6.86 4.10 0.00 max 71,606 23.26 24.44 10.00 31.20 weighted average 19,736 13.89 11.06 7.36 4.74 median 17,067 13.76 10.44 7.50 2.85Other Countries min 15,995 11.93 9.35 7.75 0.99 max 15,995 11.93 9.35 7.75 0.99 weighted average 15,995 11.93 9.35 7.75 0.99 median 15,995 11.93 9.35 7.75 0.99
Retail
2019 Lettable space
in sqm
Market rent per sqm,
month and property in EUR
Actual rent per sqm,
month and property in EUR
Capitalisation rate in %
Vacancy rate in %
West min 2,174 6.05 5.77 5.00 0.00 max 9,480 13.90 14.10 6.10 37.48 weighted average 4,635 11.24 11.96 5.63 2.88 median 4,368 11.44 12.58 5.70 0.00CEE min 2,636 5.12 6.17 6.15 0.00 max 62,603 20.28 19.54 9.25 15.58 weighted average 11,557 10.07 10.86 7.53 1.78 median 7,587 9.57 10.26 7.50 0.00Other Countries min 1,657 7.27 4.86 7.50 0.00 max 13,112 12.10 18.38 8.50 9.38 weighted average 7,746 9.88 10.00 8.01 0.70 median 7,626 9.94 10.10 7.75 0.00

CONSOLIDATED FINANCIAL STATEMENTSNotes to the Consolidated Balance Sheet
147
CO
NS
OL
IDA
TE
D F
INA
NC
IAL
STA
TE
ME
NT
S
Office
2018 Lettable space
in sqm
Market rent per sqm,
month and property in EUR
Actual rent per sqm,
month and property in EUR
Capitalisation rate in %
Vacancy rate in %
West min 2,194 6.40 5.63 3.55 0.00 max 66,507 19.59 18.25 5.85 26.08 weighted average 17,210 14.11 13.01 4.66 4.05 median 9,606 13.94 13.21 4.80 0.18CEE min 1,437 8.79 5.05 5.15 0.00 max 57,724 17.47 13.20 9.60 28.13 weighted average 16,829 12.97 9.21 7.77 6.86 median 14,542 12.37 9.35 7.75 3.92Other Countries min 15,995 11.81 8.84 7.75 0.93 max 15,995 11.81 8.84 7.75 0.93 weighted average 15,995 11.81 8.84 7.75 0.93 median 15,995 11.81 8.84 7.75 0.93
Retail
2018 Lettable space
in sqm
Market rent per sqm,
month and property in EUR
Actual rent per sqm,
month and property in EUR
Capitalisation rate in %
Vacancy rate in %
West min 2,174 5.57 4.80 4.90 0.00 max 9,480 13.81 13.58 7.50 7.99 weighted average 4,635 11.77 11.56 5.59 0.61 median 4,368 11.97 12.01 5.60 0.00CEE min 2,636 5.12 4.73 6.10 0.00 max 62,983 20.59 20.05 9.25 17.27 weighted average 11,395 9.79 9.66 7.55 2.05 median 8,047 9.16 9.40 7.50 0.00Other Countries min 1,657 7.23 5.56 7.50 0.00 max 13,176 11.91 13.39 8.50 9.25 weighted average 7,493 9.75 6.16 8.06 0.56 median 7,208 9.64 9.97 8.50 0.00
An increase in the rent per square meter would lead to an increase in fair value, while a decrease in this pa-rameter would cause a decrease in fair value. An increase in the capitalisation rate or the vacancy rate would lead to a reduction in fair value, while a reduction in these input factors would result in a higher fair value.
The following tables show the input factors for properties valued with the sales comparison approach (undeveloped land and vacant buildings):
Office 2019 Land in sqm Price per sqm in EUR West min 1,478 980.17 max 8,723 1,136.67 weighted average 5,101 1,058.42 median 5,101 1,058.42CEE min 1,790 98.97 max 110,134 550.03 weighted average 33,599 394.63 median 11,235 464.76

148 IMMOFINANZ AGAnnual Report 2019
Retail 2019 Land in sqm Price per sqm in EUR CEE min 18,568 44.98 max 126,500 186.88 weighted average 78,626 107.66 median 84,718 99.38Other Countries min 30,000 39.00 max 39,471 84.11 weighted average 34,736 61.56 median 34,736 61.56
Other 2019 Land in sqm Price per sqm in EUR CEE min 2,686 130.05 max 210,319 431.87 weighted average 76,655 220.65 median 46,808 160.34
Office 2018 Land in sqm Price per sqm in EUR West min 4,256 664.94 max 8,723 800.18 weighted average 6,490 755.84 median 6,490 732.56CEE min 2,162 107.00 max 214,576 550.22 weighted average 62,306 168.40 median 16,243 538.66
Retail 2018 Land in sqm Price per sqm in EUR CEE min 18,475 13.02 max 126,500 187.42 weighted average 54,094 69.09 median 24,582 50.04Other Countries min 30,000 39.00 max 39,471 84.11 weighted average 34,736 64.63 median 34,736 61.56
Other 2018 Land in sqm Price per sqm in EUR CEE min 2,686 44.97 max 210,319 431.87 weighted average 65,771 122.55 median 44,222 135.42
An increase in the price per square meter would lead to an increase in fair value, while a decrease would result in a lower fair value.

CONSOLIDATED FINANCIAL STATEMENTSNotes to the Consolidated Balance Sheet
149
CO
NS
OL
IDA
TE
D F
INA
NC
IAL
STA
TE
ME
NT
S
The following tables show a transition calculation from the beginning balance to the ending balance for the various property classes:
Office All amounts in TEUR West CEE Other Countries Total Balance on 1 January 2018 805,370 1,387,449 32,384 2,225,203Deconsolidations 0 -57,318 0 -57,318Foreign exchange differences 0 0 363 363Additions 7,890 9,262 0 17,152Disposals 0 -8,345 0 -8,345Revaluation of properties in the portfolio as of the balance sheet date -21,729 21,694 99 64Revaluation of properties no longer in the portfolio as of the balance sheet date 0 1,434 0 1,434Reclassifications 119,399 3,944 -437 122,906Reclassification to IFRS 5 -16,500 0 0 -16,500Balance on 31 December 2018 894,430 1,358,120 32,409 2,284,959Balance on 1 January 2019 894,430 1,358,120 32,409 2,284,959Change in scope of consolidation 0 106,480 0 106,480Foreign exchange differences 0 0 -95 -95Additions 26,390 508,813 0 535,203Disposals -29,169 -24,958 0 -54,127Revaluation of properties in the portfolio as of the balance sheet date 112,412 37,790 -142 150,060Revaluation of properties no longer in the portfolio as of the balance sheet date -1,857 949 0 -908Reclassifications 177,552 -1,175 -162 176,215Reclassification to IFRS 5 0 -77,755 0 -77,755Balance on 31 December 2019 1,179,758 1,908,264 32,010 3,120,032
Retail All amounts in TEUR West CEE Other Countries Total Balance on 1 January 2018 110,760 1,190,463 91,402 1,392,625Foreign exchange differences 0 0 156 156Additions 1,792 9,336 83,236 94,364Disposals 0 -4,142 0 -4,142Revaluation of properties in the portfolio as of the balance sheet date 2,429 7,863 3,471 13,763Reclassifications 129 -2,473 19,824 17,480Reclassification to IFRS 5 0 -4,146 0 -4,146Balance on 31 December 2018 115,110 1,196,901 198,089 1,510,100Balance on 1 January 2019 115,110 1,196,901 198,089 1,510,100Deconsolidations 0 -9,480 0 -9,480Change in scope of consolidation 0 11,089 0 11,089Foreign exchange differences 0 0 548 548Additions 21,979 48,488 74,280 144,747Disposals 0 -3,534 0 -3,534Revaluation of properties in the portfolio as of the balance sheet date 10,990 26,352 5,258 42,600Revaluation of properties no longer in the portfolio as of the balance sheet date 0 473 0 473Reclassifications 394 23,337 8,026 31,757Reclassification to IFRS 5 0 -245 0 -245Balance on 31 December 2019 148,473 1,293,381 286,201 1,728,055

150 IMMOFINANZ AGAnnual Report 2019
Other All amounts in TEUR West CEE Other Countries Total Balance on 1 January 2018 6,970 103,471 1,250 111,691Deconsolidations 0 0 -659 -659Foreign exchange differences 0 0 -9,809 -9,809Additions 40 0 0 40Disposals 0 -33,554 0 -33,554Revaluation of properties in the portfolio as of the balance sheet date 402 -2,592 1,094 -1,096Revaluation of properties no longer in the portfolio as of the balance sheet date 0 -2,970 -642 -3,612Reclassifications -72 0 0 -72Reclassification from IFRS 5 0 0 38,860 38,860Reclassification to IFRS 5 0 -3,280 0 -3,280Balance on 31 December 2018 7,340 61,075 30,094 98,509Balance on 1 January 2019 7,340 61,075 30,094 98,509Deconsolidations 0 -3,980 0 -3,980Foreign exchange differences 0 0 -2,816 -2,816Additions 3,010 1,676 0 4,686Disposals 0 -2,487 0 -2,487Revaluation of properties in the portfolio as of the balance sheet date -681 -537 -8 -1,226Revaluation of properties no longer in the portfolio as of the balance sheet date 0 -17 0 -17Reclassifications 44,501 0 0 44,501Balance on 31 December 2019 54,170 55,730 27,270 137,170
The following table shows a reconciliation from the various classes of investment properties to the total in-vestment property reported on the consolidated balance sheet:
All amounts in TEUR 31 12 2019 31 12 2018 Office 1,179,758 894,430Retail 148,473 115,110Other 54,170 7,340Total West 1,382,401 1,016,880Office 1,908,264 1,358,120Retail 1,293,381 1,196,901Other 55,730 61,075Total CEE 3,257,375 2,616,096Office 32,010 32,409Retail 286,201 198,089Other 27,270 30,094Total Other Countries 345,481 260,592Total (as per consolidated balance sheet) 4,985,257 3,893,568
Sensitivity analysis of revaluation results The fair values determined by the property appraisals are heavily dependent on the input factors underlying the valuation. For example: a change in the assumed rental income from a property or in the capitalisation rate can have a direct effect on the fair value of the property and, in turn, on the revaluation results reported by IMMOFINANZ. Therefore, the derived fair values are directly related to the underlying assumptions and the calculation method. Even minor changes in the economic or property-specific assumptions used for valuation can have a significant influence on the Group’s earnings.
The following two tables show the per cent change in the fair value of investment property as of 31 December 2019 that would have resulted from changes in rental income and interest rates, respectively from changes in the vacancy rate:

CONSOLIDATED FINANCIAL STATEMENTSNotes to the Consolidated Balance Sheet
151
CO
NS
OL
IDA
TE
D F
INA
NC
IAL
STA
TE
ME
NT
S
Sensitivity of fair value as of 31 December 2019 Rental incomeInterest rate1) ∆ -5.0% ∆ -2.5% ∆ 0.0% ∆ +2.5% ∆ +5.0% ∆ -50 basis points 5.7% 8.8% 11.9% 15.0% 18.1%∆ -25 basis points -0.3% 2.7% 5.6% 8.5% 11.5%∆ 0 basis points -5.6% -2.8% 0.0% 2.8% 5.6%∆ +25 basis points -10.3% -7.7% -5.0% -2.4% 0.3%∆ +50 basis points -14.6% -12.1% -9.5% -7.0% -4.5% 1 Capitalisation rate
For example: if the interest rate fell by 25 basis points and rental income rose by 2.5%, the fair value of invest-ment property would increase by 8.5%.
Sensitivity of fair value as of 31 December 2019 Rental incomeVacancy rate ∆ -5.0% ∆ -2.5% ∆ 0.0% ∆ +2.5% ∆ +5.0% ∆ -5.0% points -3.4% -0.6% 2.3% 5.1% 8.0%∆ -2.5% points -4.4% -1.6% 1.2% 4.0% 6.8%∆ 0.0% points -5.6% -2.8% 0.0% 2.8% 5.6%∆ +2.5% points -8.2% -5.5% -2.8% -0.1% 2.6%∆ +5.0% points -10.9% -8.2% -5.6% -2.9% -0.3% For example: if the vacancy rate fell by 2.5% points and rental income rose by 2.5%, the fair value would in-crease by 4.0%.
The following two tables show the per cent change in the fair value of investment property as of 31 December 2018 that would result from changes in rental income and interest rates, respectively from changes in the vacancy rate:
Sensitivity of fair value as of 31 December 2018 Rental income
Interest rate1) ∆ -5.0% ∆ -2.5% ∆ 0.0% ∆ +2.5% ∆ +5.0% ∆ -50 basis points 3.9% 7.0% 10.1% 13.3% 16.4%∆ -25 basis points -1.1% 1.8% 4.8% 7.8% 10.8%∆ 0 basis points -5.7% -2.8% 0.0% 2.8% 5.7%∆ +25 basis points -9.8% -7.1% -4.4% -1.7% 1.1%∆ +50 basis points -13.6% -11.0% -8.4% -5.8% -3.2% 1 Capitalisation rate
Sensitivity of fair value as of 31 December 2018 Rental income
Vacancy rate ∆ -5.0% ∆ -2.5% ∆ 0.0% ∆ +2.5% ∆ +5.0% ∆ -5.0% points -3.7% -0.8% 2.0% 4.8% 7.7%∆ -2.5 % points -4.4% -1.5% 1.2% 4.1% 6.9%∆ 0.0 % points -5.7% -2.8% 0.0% 2.8% 5.7%∆ +2.5 % points -7.4% -4.8% -2.0% 0.9% 3.7%∆ +5.0 % points -9.3% -6.6% -4.0% -1.1% 1.7%
The above data are based on the top 30 properties in the standing investment portfolio, excluding the prop-erties classified as held for sale in accordance with IFRS 5. As of 31 December 2019, the investment property had a carrying amount of EUR 4,985.3 million (31 December 2018: EUR 3,893.6 million), and the carrying amount of the top 30 properties totalled EUR 3,048.9 million (31 December 2018: EUR 2,170.7 million) or 61.2% (31 December 2018: 55.8%) of the standing investment portfolio.
For the top 30 properties in the standing investment portfolio, the capitalisation rate used by the appraisers for valuation as of 31 December 2019 ranged from 3.1% to 8.5% (31 December 2018: 3.7% to 8.5%). The interest rates were highest in Romania during 2019 with a range of 7.5% to 8.5% and lowest in Austria with a range of 3.1% to 4.8%. The interest rates were highest during the previous financial year in Romania with a range of 7.5% to 8.5% and lowest in Germany with a range of 3.7% to 4.8%.

152 IMMOFINANZ AGAnnual Report 2019
In addition to the previously discussed valuation-relevant parameters, changes in exchange rates also have an effect on profit or loss through revaluation results. Interest rate fluctuations no longer have a material effect on the valuation of the investment properties following the sale of the retail portfolio in Moscow: the functional currency in all core countries is now the euro and only a few non-core countries have a different functional currency. The sensitivity analysis for this input parameter was therefore discontinued.
4.1.4 Concentration risk Concentration risk is understood to mean the accumulation of similar risks that contradict the principle of risk diversification. IMMOFINANZ consciously reduces these risks through the sector and regional diversification of its property portfolio. In addition to this sector and regional diversification, IMMOFINANZ also works to achieve a diversified tenant structure so the loss of a tenant will not have a significant influence on the com-pany. IMMOFINANZ has a well balanced and diversified tenant mix. No single tenant is responsible for more than 2.0% of total rental income (also see section 3.5).
4.2 Property under construction Property under construction covers properties under development as well as standing investments which were reclassified over time from standing investments to property under construction due to refurbishment and redevelopment. IMMOFINANZ views refurbishment and renovation as the structural-technical restoration or modernisation of one or more floors, the communal areas or an entire property to eliminate damages and/or improve the overall standard. Above all, it involves maintaining the value of the building substance and/or modernising the property to improve its potential. This involves the facade as well as the building core (floors, rental areas, communal areas, plant rooms etc.). Renovation extends beyond normal maintenance and repairs and beyond a maintenance backlog. An important criterion for classification as renovation is the invest-ment volume and a reduced occupancy level. A renovation case is considered to exist when the investment volume equals or exceeds 10% of the property’s current fair value and the occupancy rate has fallen below 50%.
Borrowing costs directly attributable to the acquisition, construction or production of assets whose purchase or development requires a substantial period of time are generally capitalised as part of the acquisition or production cost. In accordance with IAS 23, the application of this accounting procedure is not mandatory if the acquired or developed assets are measured at fair value. IMMOFINANZ has elected to use the fair value model for the subsequent measurement of investment property (see section 1.2), and borrowing costs are therefore not capitalised on property accounted for according to IAS 40.
The development of property under construction is shown in the following table:
All amounts in TEUR 2019 2018 Beginning balance 397,540 404,064Currency translation adjustments 16 32Additions 103,099 128,618Disposals -6,166 -916Revaluation 2,706 17,388Reclassifications -236,271 -134,146Reclassification to IFRS 5 -61,485 -17,500Ending balance 199,439 397,540

CONSOLIDATED FINANCIAL STATEMENTSNotes to the Consolidated Balance Sheet
153
CO
NS
OL
IDA
TE
D F
INA
NC
IAL
STA
TE
ME
NT
S
The additions are related primarily to the development projects currently in progress at the myhive Medienhafen in Düsseldorf, to investments at the Wienerberg in Vienna and to various STOP SHOP retail parks.
The reclassifications involve, above all, transfers of EUR 33.1 million (2018: EUR 47.8 million) from investment property to property under construction and transfers of EUR -269.3 million (2018: EUR -182.5 million) from property under construction to investment property.
All reclassifications to assets held for sale involved office properties: four in Warsaw and one in Brasov.
The residual value method is generally used to value property under construction. Standing investments that were transferred to property under construction due to upcoming refurbishment or upgrading are valued with hardcore and top-slice method until detailed redevelopment plans are available. As soon as these plans are available, valuation is based on the residual value method. Residual value is understood to represent the amount remaining after the deduction of all project development costs and the imputed project development profit (developer profit) from the property’s estimated selling price after completion. The unrealised imputed project development profit declines with the progress on the project. The most important input factors for this valuation method are the future rental income from the project, the discount rate (these two parameters generally determine the estimated fair value on completion) and the outstanding project development costs. The capitalisation rates for IMMOFINANZ’s development projects range from 3.3% to 7.8% (2018: 3.6% to 11.2%), while the project development profit ranges from 10.0% to 20.3% (2018: 5.6% to 13.5%). The esti-mated fair values of the projects on completion range from EUR 15.1 million to EUR 160.3 million (2018: EUR 0.8 million to EUR 197.4 million) and the estimated outstanding construction costs by property range from EUR 7.9 million to EUR 60.9 million (2018: EUR 0.3 million to EUR 53.0 million).
Information on other parameters relevant for valuation and on valuation uncertainty is provided in section 4.1.3.
The additions to property under construction include rights of use totalling EUR 12.2 million from the initial application of IFRS 16. Property under construction did not include any rights-of-use assets as of 31 Decem-ber 2019. The initial application of IFRS 16 did not involve the reclassification of any property under construc-tion to assets held for sale. As of 31 December 2019, the rights of use included under assets held for sale amounted to EUR 13.7 million (see section 4.9). Details on the effects of the initial application of IFRS 16 are provided in section 1.4.
4.3 Other tangible assets As of 31 December 2019, other tangible assets included IFRS 16 rights of use totalling EUR 1.9 million.
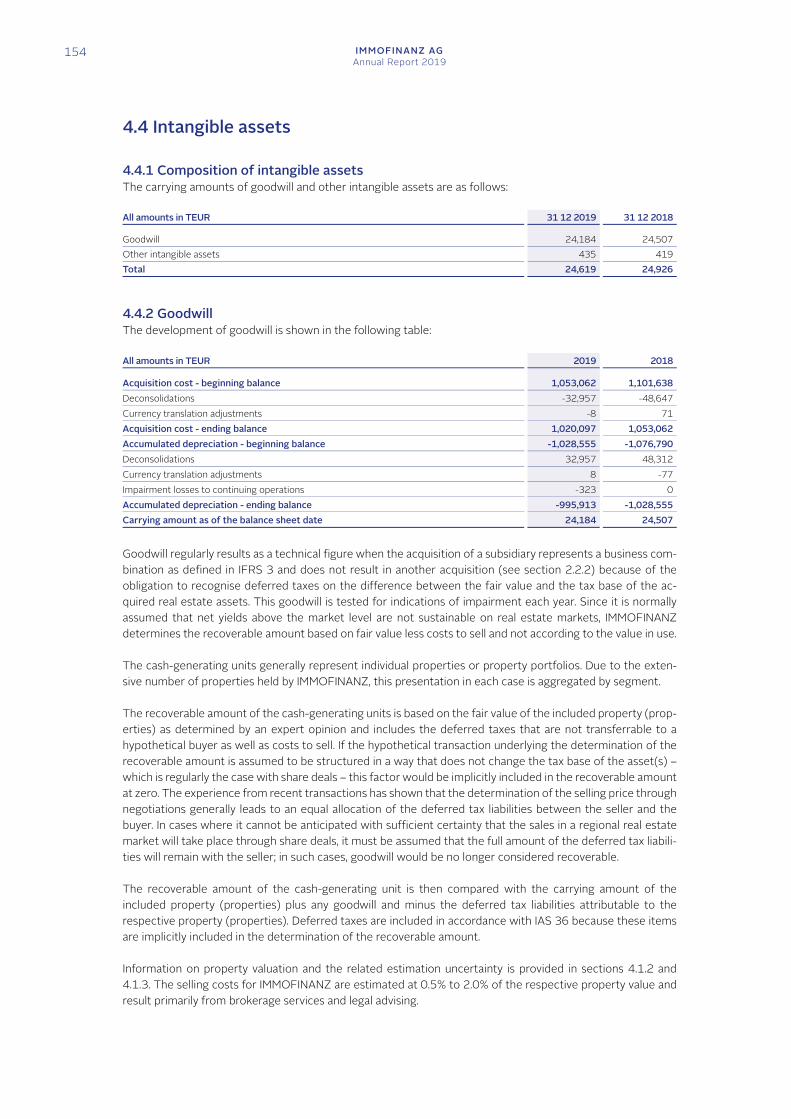
154 IMMOFINANZ AGAnnual Report 2019
4.4 Intangible assets
4.4.1 Composition of intangible assets The carrying amounts of goodwill and other intangible assets are as follows:
All amounts in TEUR 31 12 2019 31 12 2018 Goodwill 24,184 24,507Other intangible assets 435 419Total 24,619 24,926
4.4.2 Goodwill The development of goodwill is shown in the following table:
All amounts in TEUR 2019 2018 Acquisition cost - beginning balance 1,053,062 1,101,638Deconsolidations -32,957 -48,647Currency translation adjustments -8 71Acquisition cost - ending balance 1,020,097 1,053,062Accumulated depreciation - beginning balance -1,028,555 -1,076,790Deconsolidations 32,957 48,312Currency translation adjustments 8 -77Impairment losses to continuing operations -323 0Accumulated depreciation - ending balance -995,913 -1,028,555Carrying amount as of the balance sheet date 24,184 24,507 Goodwill regularly results as a technical figure when the acquisition of a subsidiary represents a business com-bination as defined in IFRS 3 and does not result in another acquisition (see section 2.2.2) because of the obligation to recognise deferred taxes on the difference between the fair value and the tax base of the ac-quired real estate assets. This goodwill is tested for indications of impairment each year. Since it is normally assumed that net yields above the market level are not sustainable on real estate markets, IMMOFINANZ determines the recoverable amount based on fair value less costs to sell and not according to the value in use.
The cash-generating units generally represent individual properties or property portfolios. Due to the exten-sive number of properties held by IMMOFINANZ, this presentation in each case is aggregated by segment.
The recoverable amount of the cash-generating units is based on the fair value of the included property (prop-erties) as determined by an expert opinion and includes the deferred taxes that are not transferrable to a hypothetical buyer as well as costs to sell. If the hypothetical transaction underlying the determination of the recoverable amount is assumed to be structured in a way that does not change the tax base of the asset(s) – which is regularly the case with share deals – this factor would be implicitly included in the recoverable amount at zero. The experience from recent transactions has shown that the determination of the selling price through negotiations generally leads to an equal allocation of the deferred tax liabilities between the seller and the buyer. In cases where it cannot be anticipated with sufficient certainty that the sales in a regional real estate market will take place through share deals, it must be assumed that the full amount of the deferred tax liabili-ties will remain with the seller; in such cases, goodwill would be no longer considered recoverable.
The recoverable amount of the cash-generating unit is then compared with the carrying amount of the included property (properties) plus any goodwill and minus the deferred tax liabilities attributable to the respective property (properties). Deferred taxes are included in accordance with IAS 36 because these items are implicitly included in the determination of the recoverable amount.
Information on property valuation and the related estimation uncertainty is provided in sections 4.1.2 and 4.1.3. The selling costs for IMMOFINANZ are estimated at 0.5% to 2.0% of the respective property value and result primarily from brokerage services and legal advising.

CONSOLIDATED FINANCIAL STATEMENTSNotes to the Consolidated Balance Sheet
155
CO
NS
OL
IDA
TE
D F
INA
NC
IAL
STA
TE
ME
NT
S
The key valuation-relevant input parameters for properties that carry goodwill are summarised in the following table, classified by segment:
Segment Lettable space
in sqm
Market rent per sqm and month
in EUR
Actual rent per sqm and month
in EURCapitalisation
rate in % Vacancy rate
in % Poland min 21,264 16.02 14.04 6.75 0.00 max 21,264 16.02 14.04 6.75 0.00 weighted
average 21,264 16.02 14.04 6.75 0.00 median 21,264 16.02 14.04 6.75 0.00Czech Republic min 4,250 7.84 8.11 5.75 0.00 max 31,154 14.85 11.75 7.25 6.25 weighted
average 9,722 10.27 10.13 6.97 1.49 median 5,863 9.46 10.06 7.25 0.00Slovakia min 4,433 8.56 9.93 7.50 0.00 max 6,809 9.68 11.55 9.25 15.58 weighted
average 5,869 9.12 10.61 8.08 5.19 median 6,366 9.11 10.34 7.50 0.00Hungary min 7,210 9.92 10.48 6.50 0.00 max 38,669 15.23 13.80 7.75 15.41 weighted
average 22,459 12.53 11.78 7.19 5.74 median 21,978 12.49 11.42 7.25 3.78Romania min 16,667 8.85 7.36 7.50 0.59 max 62,603 20.07 18.52 8.60 10.04 weighted
average 30,928 15.17 13.65 7.92 5.51 median 21,167 15.81 14.77 7.75 4.66Other countries min 4,980 7.27 8.33 7.50 0.00 max 15,995 11.93 9.35 7.75 9.38 weighted
average 11,102 9.36 8.93 7.65 3.46 median 12,332 8.89 9.12 7.70 0.99
Impairment testing of the cash-generating units in IMMOFINANZ’s continuing operations which carry goodwill resulted in the recognition of impairment losses totalling EUR 0.3 million in 2019.
Impairment losses are reported on the consolidated income statement under “goodwill impairment”. The impairment losses to goodwill result from a decline in the value of the related properties or property portfolios and/or through an evidence-based change in deferred taxes. Impairment losses to goodwill are not deductible for tax purposes.

156 IMMOFINANZ AGAnnual Report 2019
4.5 Equity-accounted investments
4.5.1 Investments in joint ventures IMMOFINANZ acquired the remaining 50% of the shares in the previous joint venture NP Investments a.s. for EUR 9.6 million as of 18 January 2019. As a result of this transaction, NP Investments a.s. is now accounted for as a fully consolidated subsidiary. The position “net profit or loss from equity-accounted investees“ there-fore includes transition consolidation results of TEUR -422, whereby TEUR 509 are attributable to the recy-cling of currency translation differences from other comprehensive income.
CPB DELTA Anlagen Leasing GmbH was reclassified from a joint venture to a fully consolidated subsidiary in 2019 following the exit of the silent partner. The resulting transition consolidation results of TEUR 55 are included under the position “net profit or loss from equity-accounted investees“. The sale of Adama Ukraine Ltd. was followed by the deconsolidation of the shares in Sadira Ltd. and Alpha Arcadia LLC. This led to deconsolidation results of TEUR 423 from the recycling of currency translation differences from other com-prehensive income.
With regard to the investments in joint ventures, joint arrangements normally include limitations on the sale of the investment in the form of pre-emptive or purchase rights and tag-along sale rights or obligations
The following table provides aggregated financial information on the joint ventures, including a reconciliation to the carrying amounts and shares of profit or loss reported in IMMOFINANZ’s consolidated financial state-ments.
The other adjustments included in the transition from the proportional share of equity to the carrying amount reported by IMMOFINANZ are related primarily to coverage for negative carrying amounts. This coverage was achieved through the reduction of receivables which are considered net investments in the joint ventures according to IAS 28 because of their economic content. The other adjustments included in the transition from the proportional share of profit or loss for the period to the share of profit or loss reported by IMMOFINANZ involve impairment losses or the reversal of such losses to the net investment in the joint ventures.

CONSOLIDATED FINANCIAL STATEMENTSNotes to the Consolidated Balance Sheet
157
CO
NS
OL
IDA
TE
D F
INA
NC
IAL
STA
TE
ME
NT
S
TotalAll amounts in TEUR 31 12 2019 Non-current assets 2,175
Thereof investment property 1,690Current assets 65
Thereof cash and cash equivalents 14Non-current liabilities 6,524Current liabilities 1,600Equity -5,884Equity interest of IMMOFINANZ in the investment -4,412Other adjustments 4,412Carrying amount as of 31 December 2019 0Losses not recognised during the financial year 8Cumulative losses not recognised as of 31 December 2019 0 2019 Net profit or loss for the period -322
Thereof interest expense -291Thereof income taxes -9Thereof attributable to shareholders of the investment -322
Share of net profit or loss attributable to IMMOFINANZ -102Other adjustments 18Share of net profit or loss from equity-accounted investments attributable to IMMOFINANZ -84Other comprehensive income -63
Thereof attributable to shareholders of the investment -63Share of changes in other comprehensive income recorded directly in equity attributable to IMMOFINANZ 2Other adjustments 100Total comprehensive income -385
Thereof attributable to shareholders of the investment -385Share of IMMOFINANZ in total comprehensive income for the period -244Other adjustments 244Dividends received 0

158 IMMOFINANZ AGAnnual Report 2019
NP Investments a.s. Other TotalAll amounts in TEUR 31 12 2018 31 12 2018 31 12 2018 Non-current assets 110,700 2,196 112,896
Thereof investment property 106,480 1,690 108,170Current assets 2,948 104 3,052
Thereof cash and cash equivalents 1,517 50 1,567Non-current liabilities 103,357 8,658 112,015
Thereof non-current financial liabilities 64,521 0 64,521Current liabilities 4,870 2,937 7,807
Thereof current financial liabilities 1,853 0 1,853Equity 5,421 -9,295 -3,874Equity interest of IMMOFINANZ in the investment 2,710 -6,435 -3,725Other adjustments 0 6,435 6,435Carrying amount as of 31 December 2018 2,710 0 2,710Losses not recognised during the financial year 0 16 16Cumulative losses not recognised as of 31 December 2018 0 -32 -32 2018 2018 2018 Rental income 3,967 0 3,967Expenses charged on and other revenue 536 0 536Revenues 4,502 0 4,502Net profit or loss for the period 10,427 -408 10,019
Thereof interest income 182 -33 149Thereof interest expense -3,848 -272 -4,120Thereof income taxes -3,062 162 -2,900Thereof attributable to shareholders of the investment 10,427 -408 10,019
Share of net profit or loss attributable to IMMOFINANZ 2,739 64 2,803Other adjustments 2,475 -348 2,127Share of net profit or loss from equity-accounted investments attributable to IMMOFINANZ 5,214 -284 4,930Other comprehensive income -57 -198 -255
Thereof attributable to shareholders of the investment -57 -198 -255Share of changes in other comprehensive income recorded directly in equity attributable to IMMOFINANZ -29 -128 -157Other adjustments 0 -128 -128Total comprehensive income 10,370 -606 9,764
Thereof attributable to shareholders of the investment 10,370 -606 9,764Share of IMMOFINANZ in total comprehensive income for the period 5,185 -411 4,774Other adjustments -2,475 348 -2,127Dividends received 0 0 0

CONSOLIDATED FINANCIAL STATEMENTSNotes to the Consolidated Balance Sheet
159
CO
NS
OL
IDA
TE
D F
INA
NC
IAL
STA
TE
ME
NT
S
4.5.2 Investments in associates S IMMO AG (in short: S IMMO) was IMMOFINANZ’s most important associate as of 31 December 2019. The shares of S IMMO are listed on the Vienna Stock Exchange, and the share price equalled EUR 22.30 at year-end 2019. IMMOFINANZ holds an investment of 29.14% in the capital of S IMMO, which represents 15% of the voting rights based on the issuer’s current articles of association. This share package gives IMMOFINANZ significant influence over S IMMO, and the investment is consequently accounted for at equity.
IAS 28.40 requires a company that applies the equity method, including the recognition of the associate’s losses, to determine whether there are any objective indications of significant or lasting impairment to its net investment in the associate. The impairment test involves comparing the recoverable value of the share pack-age based on the applicable fair value less selling costs.
The absence of Level 1 fair values for the share package (unit of account), which represents a comparable capital interest, required a discretionary decision concerning the valuation procedure. IFRS do not provide any explicit rules for determining the fair value of such valuation objects in accordance with IFRS 13. IMMOFINANZ’s management decided to carry out these valuations as “close to market” as possible. The price on the Vienna Stock Exchange as of the respective balance sheet date, plus a package premium, therefore forms the basis for valuation. IFRS 13 permits the inclusion of premiums under the following conditions: when the premium reflects the economic characteristics of the valuation object; when hypothetical buyers would include the premium in determining a purchase price; and when the inclusion of a premium does not contradict the unit of account (in this case, the equity-accounted investment in S IMMO). In view of these circumstances, the determination of fair value (including the existing voting restriction) included an appropriate premium of 11.1% (EUR 2.48 per share, or EUR 48.3 million) over the share price for the size of the capital investment. The premium was derived from comparable transactions (the purchase of capital investments in european companies from 2010 to 2019) based on capital market data. Since the fair value was ultimately derived from observable and non-observable data, it is classified under Level 3 in accordance with IFRS 13.
The recoverable amount determined by this method – which represents the fair value of EUR 483.1 million (EUR 24.80 per share) less selling costs of 1.75% – amounted to EUR 474.7 million as of 31 December 2019.
The increase in the share price as of 31 December 2019 provided objective evidence to support a reversal of the impairment loss of EUR 25.1 million which was recognised to the S IMMO investment in the previous year. The carrying amount of the investment was therefore increased by EUR 14.4 million to the recoverable amount of EUR 474.7 million.
On 11 December 2019, the remaining 70% of the shares in FMZ Lublin Sp. z o.o. were acquired for EUR 1.00 and the shares in FMZ Sosnowiec Sp. z o.o. were sold for EUR 1.00. This resulted in the transition consolidation of FMZ Lublin Sp. z o.o. to a fully consolidated subsidiary. The earnings effects of the two transactions totalled EUR -1.7 million.
The sale of the investment in Mill Holding Kft. resulted in deconsolidation results of TEUR 124, whereby TEUR 128 are attributable to the recycling of currency translation differences from other comprehensive in-come.
The following table provides aggregated financial information on the associates, including a reconciliation to the carrying amounts and shares of profit or loss reported in IMMOFINANZ’s consolidated financial state-ments. The other adjustments included in the reconciliation from the proportional share of equity to the car-rying amount reported by IMMOFINANZ are related primarily to coverage for negative carrying amounts through the reduction of receivables which are considered to be net investments in the investee according to IAS 28 because of their economic content. The other adjustments to the S IMMO investment are related to impairment losses and the carryforward of fair value adjustments identified in connection with the acquisition of the shares during the purchase price allocation. Other adjustments included in the reconciliation from the proportional share of equity to the carrying amount reported by IMMOFINANZ involve impairment losses or revaluations to the net investment in the associate. In addition, the other adjustments to the net profit of S IMMO include the carryforward of fair value adjustments totalling EUR 0.6 million (2018: EUR 0.1 million) that were identified during the acquisition of the investment. In the segment report, these fair value adjustments are included in the Austria segment.

160 IMMOFINANZ AGAnnual Report 2019
S IMMO Other TotalAll amounts in TEUR 31 12 2019 31 12 2019 31 12 2019 Non-current assets 2,937,229 1,052 2,938,281
Thereof investment property 2,334,540 0 2,334,540Current assets 200,459 7,953 208,412Non-current liabilities 1,603,971 18 1,603,989Current liabilities 188,632 3,357 191,989Equity 1,345,085 5,630 1,350,715
Thereof attributable to non-controlling interests 2,910 481 3,391Thereof attributable to shareholders of the investment 1,342,175 5,149 1,347,324
Equity interest of IMMOFINANZ in the investment 391,110 2,523 393,633Other adjustments 83,540 1,018 84,558Carrying amount as of 31 December 2019 474,650 3,541 478,191Losses not recognised during the financial year 0 2,350 2,350Cumulative losses not recognised as of 31 December 2019 0 0 0 2019 2019 2019 Rental income 119,373 -120 119,253Expenses charged on and other revenue 91,055 25,652 116,707Revenues 210,427 25,534 235,961Net profit or loss for the period 213,307 2,660 215,967
Thereof attributable to non-controlling interests 533 0 533Thereof attributable to shareholders of the investment 212,774 2,660 215,434
Share of net profit or loss attributable to IMMOFINANZ 62,002 1,894 63,896Other adjustments 14,905 1,158 16,063Share of net profit or loss from equity-accounted investments attributable to IMMOFINANZ 76,907 3,052 79,959Other comprehensive income 66,888 0 66,888
Thereof attributable to shareholders of the investment 66,888 0 66,888Share of changes in other comprehensive income recorded directly in equity attributable to IMMOFINANZ 19,491 0 19,491Total comprehensive income 280,195 2,661 282,856
Thereof attributable to non-controlling interests 533 0 533Thereof attributable to shareholders of the investment 279,662 2,661 282,323
Share of IMMOFINANZ in total comprehensive income for the period 96,398 3,052 99,450Dividends received 13,650 2,569 16,219

CONSOLIDATED FINANCIAL STATEMENTSNotes to the Consolidated Balance Sheet
161
CO
NS
OL
IDA
TE
D F
INA
NC
IAL
STA
TE
ME
NT
S
CA Immo Group1
S IMMO2 Other Total
All amounts in TEUR 31 12 2018 31 12 2018 31 12 2018 31 12 2018 Non-current assets 0 2,572,604 24,863 2,597,467
Thereof investment property 0 2,081,046 22,420 2,103,466Current assets 0 147,530 8,847 156,377Non-current liabilities 0 1,361,792 36,564 1,398,356Current liabilities 0 246,769 8,256 255,025Equity 0 1,111,573 -11,110 1,100,463
Thereof attributable to shareholders of the investment 0 1,108,853 -11,427 1,097,426Equity interest of IMMOFINANZ in the investment 0 323,120 -4,319 318,801Other adjustments 0 68,782 7,378 76,160Carrying amount as of 31 December 2018 0 391,902 3,059 394,961Losses not recognised during the financial year 0 0 60 60Cumulative losses not recognised as of 31 December 2018 0 0 -2,350 -2,350 2018 2018 2018 2018 Rental income 93,761 27,781 763 122,305Expenses charged on and other revenue 29,346 25,087 28,740 83,173Revenues 123,107 52,867 29,504 205,478Net profit or loss for the period 89,579 124,444 4,114 218,137
Thereof attributable to non-controlling interests 2 395 0 397Thereof attributable to shareholders of the investment 89,577 124,049 4,114 217,740
Share of net profit or loss attributable to IMMOFINANZ 23,437 36,148 1,952 61,537Other adjustments 596 -24,993 1 -24,396Share of net profit or loss from equity-accounted investments attributable to IMMOFINANZ 24,033 11,155 1,953 37,141Other comprehensive income -9,091 -34,046 0 -43,137
Thereof attributable to shareholders of the investment -9,091 -34,046 0 -43,137Share of changes in other comprehensive income recorded directly in equity attributable to IMMOFINANZ -2,510 -9,921 0 -12,431Total comprehensive income 80,488 90,399 4,113 175,000
Thereof attributable to non-controlling interests 2 395 0 397Thereof attributable to shareholders of the investment 80,486 90,004 4,113 174,603
Share of IMMOFINANZ in total comprehensive income for the period 21,523 11,155 1,953 34,631Dividends received 20,552 0 3,520 24,072 1 The financial data recorded for the CA Immo Group is based on the CA Immo Group’s consolidated financial statements as of 31 December 2018. The income
statement data cover the period from 1 January 2018 to 27 September 2018. 2 The financial data recorded for the S Immo Group is based on the S Immo Group’s consolidated financial statements as of 31 December 2018. The financial
information on the income statement covers the period from 1 October 2018 to 31 December 2018.

162 IMMOFINANZ AGAnnual Report 2019
4.6 Trade and other receivables IMMOFINANZ carried trade receivables and other financial receivables at amortised cost. Recognisable indi-vidual risks are reflected in appropriate valuation adjustments. Non-financial receivables, e.g. claims against administrative authorities for the reimbursement of input VAT, are also carried at amortised cost after the deduction of any necessary write-downs.
The following table shows the composition and remaining terms of trade and other receivables.
All amounts in TEUR 31 12 2019
Thereof remaining term
under 1 year
Thereof remaining
term between 1 and 5 years
Thereof remaining
term over 5 years 31 12 2018
Thereof remaining term
under 1 year
Thereof remaining
term between 1 and 5 years
Thereof remaining
term over 5 years
Rents receivable 24,284 24,284 0 0 22,823 22,823 0 0Miscellaneous 31,943 31,943 0 0 33,709 33,709 0 0Total trade accounts receivable 56,227 56,227 0 0 56,532 56,532 0 0Receivables due from associates 0 0 0 0 4,550 4,269 0 281Receivables due from joint ventures 1,757 747 1,001 9 29,604 717 28,837 50Receivables due from equity-accounted investments 1,757 747 1,001 9 34,154 4,986 28,837 331Restricted funds 42,863 2,583 37,784 2,496 129,054 100,041 28,979 34Financing 8,746 91 202 8,453 14,424 3,561 921 9,942Property management 2,863 2,557 277 29 2,033 1,944 53 36Outstanding purchase price receivables - sale of properties 2,951 2,951 0 0 3,130 3,130 0 0Outstanding purchase price receivables - sale of shares in other companies 14,597 2,914 11,683 0 14,605 1,167 13,438 0Miscellaneous 9,816 6,354 3,189 273 13,871 8,257 5,383 231Total other financial receivables 81,836 17,450 53,135 11,251 177,117 118,100 48,774 10,243Tax authorities 29,005 29,005 0 0 34,949 34,949 0 0Other contractual assets 1,001 1,001 0 0 2,876 2,876 0 0Total other non-financial receivables 30,006 30,006 0 0 37,825 37,825 0 0Total 169,826 104,430 54,136 11,260 305,628 217,443 77,611 10,574
Restricted funds consist primarily of prepayments on apartment sales which were pledged to banks and bank balances pledged as collateral for property financing. The year-on-year decline in the balance of restricted funds is attributable, above all, to a decrease in prepayments received on the sale of apartments. As of 31 De-cember 2018, this position also included EUR 29.0 million for the repayment of a loan following the sale of the “Bauteil H” property in Vienna.
The outstanding purchase price receivables from the sale of shares consists primarily of the purchase price receivable from the sale of the retail portfolio Moscow which was deferred to 2022 (see section 2.4) and was carried at a present value of EUR 11.7 million as of 31 December 2019. This position also includes a purchase price receivable of EUR 1.7 million from the sale of REVIVA Am Spitz Liegenschafts GmbH.
The other contractual assets of EUR 1.0 million resulted from the initial application of IFRS 15 as of 1 January 2018.
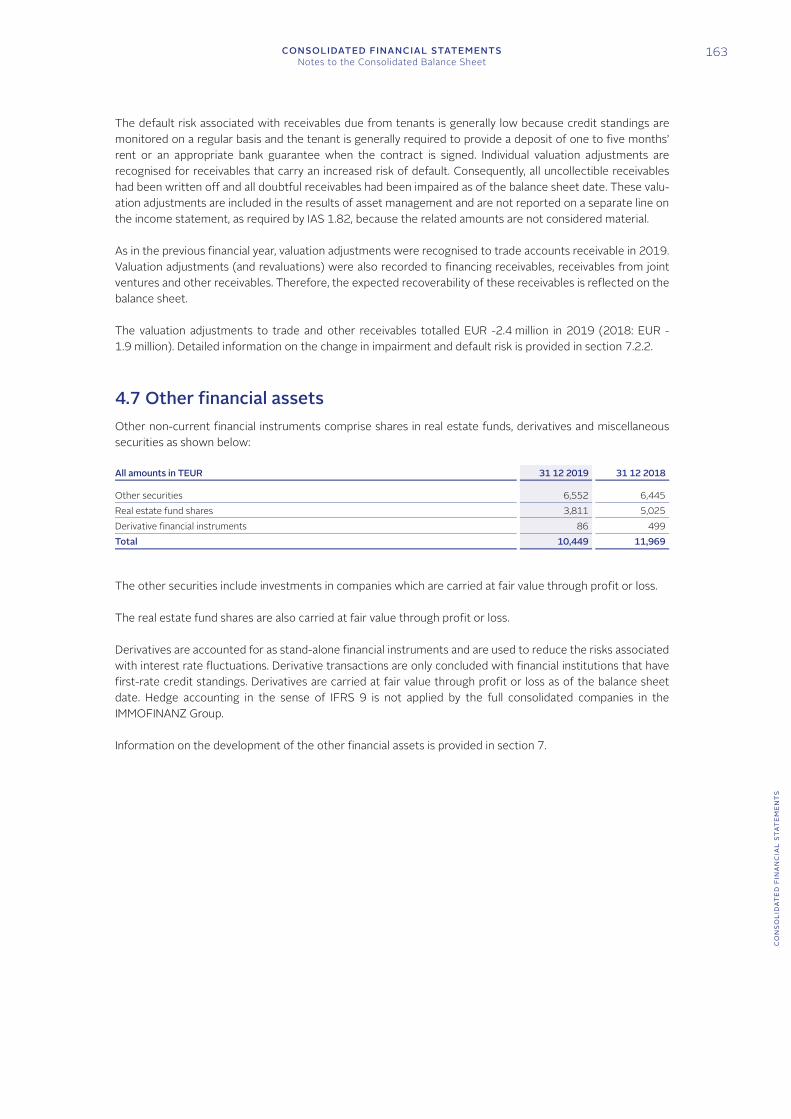
CONSOLIDATED FINANCIAL STATEMENTSNotes to the Consolidated Balance Sheet
163
CO
NS
OL
IDA
TE
D F
INA
NC
IAL
STA
TE
ME
NT
S
The default risk associated with receivables due from tenants is generally low because credit standings are monitored on a regular basis and the tenant is generally required to provide a deposit of one to five months’ rent or an appropriate bank guarantee when the contract is signed. Individual valuation adjustments are recognised for receivables that carry an increased risk of default. Consequently, all uncollectible receivables had been written off and all doubtful receivables had been impaired as of the balance sheet date. These valu-ation adjustments are included in the results of asset management and are not reported on a separate line on the income statement, as required by IAS 1.82, because the related amounts are not considered material.
As in the previous financial year, valuation adjustments were recognised to trade accounts receivable in 2019. Valuation adjustments (and revaluations) were also recorded to financing receivables, receivables from joint ventures and other receivables. Therefore, the expected recoverability of these receivables is reflected on the balance sheet.
The valuation adjustments to trade and other receivables totalled EUR -2.4 million in 2019 (2018: EUR -1.9 million). Detailed information on the change in impairment and default risk is provided in section 7.2.2.
4.7 Other financial assets Other non-current financial instruments comprise shares in real estate funds, derivatives and miscellaneous securities as shown below:
All amounts in TEUR 31 12 2019 31 12 2018 Other securities 6,552 6,445Real estate fund shares 3,811 5,025Derivative financial instruments 86 499Total 10,449 11,969
The other securities include investments in companies which are carried at fair value through profit or loss.
The real estate fund shares are also carried at fair value through profit or loss.
Derivatives are accounted for as stand-alone financial instruments and are used to reduce the risks associated with interest rate fluctuations. Derivative transactions are only concluded with financial institutions that have first-rate credit standings. Derivatives are carried at fair value through profit or loss as of the balance sheet date. Hedge accounting in the sense of IFRS 9 is not applied by the full consolidated companies in the IMMOFINANZ Group.
Information on the development of the other financial assets is provided in section 7.

164 IMMOFINANZ AGAnnual Report 2019
4.8 Deferred tax assets and deferred tax liabilities Deferred tax assets and deferred tax liabilities as of 31 December 2019 resulted from the following temporary accounting and valuation differences between the carrying amounts according to IFRS in IMMOFINANZ’s con-solidated financial statements and the respective tax bases:
31 12 2019 31 12 2018
All amounts in TEUR Assets Liabilities Assets Liabilities Investment property 711 327,986 542 284,044Other financial assets and miscellaneous assets 15,356 24,654 16,139 18,166Total 16,067 352,640 16,681 302,210Other liabilities and provisions 7,342 7,121 6,356 6,876Financial liabilities 1,137 8,678 1,403 6,727Total 8,479 15,799 7,759 13,603Tax loss carryforwards 244,091 0 636,356 0Real differences from the elimination of intra-group liabilities 0 172,492 0 625,016Deferred tax assets and deferred tax liabilities 268,637 540,931 660,796 940,829Offset of deferred tax assets and deferred tax liabilities due to the same taxation authority -265,645 -265,645 -602,099 -602,099Net deferred tax assets and deferred tax liabilities 2,992 275,286 58,697 338,730
Deferred taxes are calculated for temporary differences that lead to taxable or deductible amounts for the determination of taxable profit in future financial years. These temporary differences are calculated by com-paring the carrying amounts of the assets and liabilities in the consolidated financial statements with the re-spective tax bases at the subsidiary level. Deferred taxes are recognised when the existing differences are expected to reverse in the future. With regard to the differences arising from the fair value measurement of investment property (see section 4.1), it is generally assumed that the temporary differences will reverse when the property is sold.
Deferred taxes are not recognised for temporary differences arising from the initial recognition of goodwill or the initial recognition of an asset or a liability from a transaction which does not represent a business combi-nation as defined in IFRS 3 and which does not influence pre-tax earnings or taxable income on the transaction date. This applies, above all, to the acquisition of property companies that are not classified as business com-binations in the sense of IFRS 3 (see section 2.2.2).
Deferred tax liabilities are not recognised for temporary differences resulting from shares in subsidiaries, joint ventures or associates (outside-basis differences) in cases where their reversal can be controlled by IMMOFINANZ and is not probable in the foreseeable future. For this reason, deferred tax liabilities were not recognised for temporary differences of EUR 1,255.7 million (31 December 2018: EUR 1,418.9 million).
Deferred tax assets are recognised on tax loss carryforwards when it is probable that sufficient taxable income will be available to utilise these tax loss carryforwards in the future. Deferred tax assets are also recorded in cases where sufficient deferred tax liabilities relating to the same tax subject and taxation authority were rec-ognised and are assumed to reverse at the same time as the deferred tax assets on the unused loss carryfor-wards.
The recognition of deferred tax assets, in general, and deferred taxes on unused tax loss carryforwards and deductible temporary partial depreciation charges on investments (“Siebentelabschreibung”), in particular, is based on expectations by IMMOFINANZ’s management concerning the availability of sufficient taxable profits in the future. These expectations reflect the previous history of tax losses, limits on the utilisation of tax losses, membership in a tax group and the possible expiration of tax loss carryforwards in some countries. Accounting decisions over the recognition or recoverability of deferred taxes are based, on the one hand, on the latest data from tax planning over a five-year forecast period and, on the other hand, on assumptions for the timing of the reversal of deferred tax liabilities and the availability of tax planning opportunities to utilise previously unused tax losses in Austria and other countries. Based on a judgment issued by the Austrian High Adminis-trative Court in 2019 concerning the tax consequences of liquidations, deferred tax liabilities and the related

CONSOLIDATED FINANCIAL STATEMENTSNotes to the Consolidated Balance Sheet
165
CO
NS
OL
IDA
TE
D F
INA
NC
IAL
STA
TE
ME
NT
S
deferred tax assets arising from differences in the consolidation of liabilities between certain Austrian Group members may, in contrast to the previous year, no longer be recognised.
The recoverability of deferred tax assets by Group companies that recorded losses in 2019 and 2018 (2019: EUR 1.1 million; 2018: EUR 2.4 million) is dependent on the generation of future taxable profits that are higher than the earnings effect from the reversal of the existing taxable temporary differences.
Deferred tax assets were not recognised for loss carryforwards of EUR 3,351.3 million (31 December 2018: EUR 1,699.4 million). Of this total, EUR 1,124.1 million reflect a decision over the assessment of the potential utilisation of losses in the Austrian tax group‘s earnings for 2019 which will only be clarified when the tax return is prepared. The tax loss carryforwards are in part unlimited, while others will expire within the next five to ten years. Any limits on the use of loss carryforwards were taken into account. Deferred tax assets were not recognised for deductible temporary partial depreciation charges on investments (“Siebentelabschreibung”) of EUR 342.4 million (31 December 2018: EUR 485.6 million).
The calculation of deferred taxes is based on the tax rate that is expected to apply when the temporary dif-ferences are presumed to reverse. The applicable tax rate for IMMOFINANZ AG and all Austrian Group com-panies is 25%. The applicable local tax rate is used for foreign Group companies.
The tax rates used to value deferred taxes in the core countries of IMMOFINANZ remained unchanged from the previous year – with the exception of Poland – and are as follows:
Country Applicable tax rate
31 12 2019Applicable tax rate
31 12 2018 Germany1 15.83%-32.45% 15.83%-32.45%Austria 25.00% 25.00%Polen2 9.00%/19.00% 15.00%/19.00%Romania 16.00% 16.00%Russia3 20.00% 20.00%Slovakia 21.00% 21.00%Czech Republic 19.00% 19.00%Hungary 9.00% 9.00%Other countries 10.00%-24.94% 10.00%-35.00% 1 The tax rate can vary and is dependent on the company’s headquarters and trade tax liability. 2 The tax rate can vary and is dependent on the company's size. 3 Discontinued operation
4.9 Assets and specific liabilities held for sale IFRS 5 requires non-current assets and groups of assets (disposal groups) to be classified as held for sale if they can be sold in their present condition and if appropriate documentation shows a highly probable intention by management to sell the assets within 12 months. A documented intention by IMMOFINANZ’s management to sell an asset is reflected in a resolution by the Executive Board as well as the Supervisory Board, for trans-actions requiring an approval of this corporate body.
Non-current assets and groups of assets classified as held for sale are measured at the lower of the carrying amount and fair value less costs to sell. The following items, among others, are excluded from the IFRS 5 valuation requirements: investment properties that are measured at fair value, financial assets and deferred tax assets. These non-current assets must be presented separately according to IFRS 5. A separate provision is generally recorded when an impairment loss must be recognised to a disposal group or expected selling costs must be deducted from fair value and these adjustments cannot be allocated to assets covered by the valuation rules in IFRS 5.
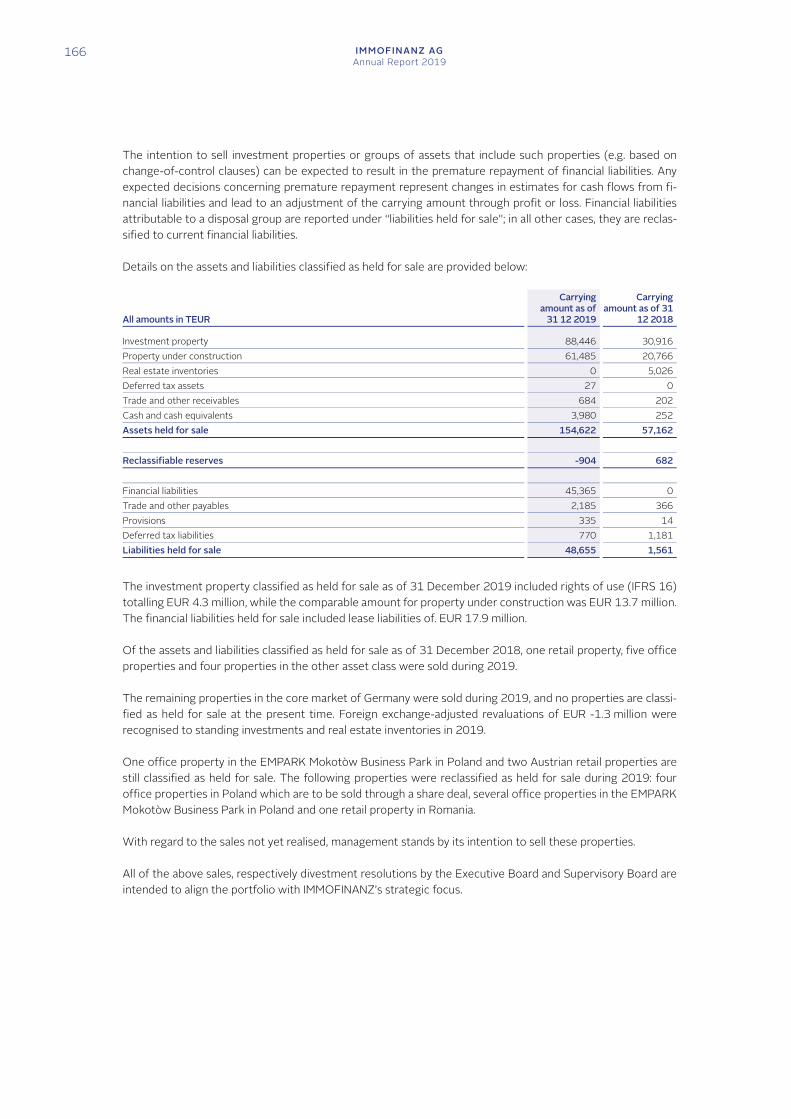
166 IMMOFINANZ AGAnnual Report 2019
The intention to sell investment properties or groups of assets that include such properties (e.g. based on change-of-control clauses) can be expected to result in the premature repayment of financial liabilities. Any expected decisions concerning premature repayment represent changes in estimates for cash flows from fi-nancial liabilities and lead to an adjustment of the carrying amount through profit or loss. Financial liabilities attributable to a disposal group are reported under “liabilities held for sale”; in all other cases, they are reclas-sified to current financial liabilities.
Details on the assets and liabilities classified as held for sale are provided below:
All amounts in TEUR
Carrying amount as of
31 12 2019
Carrying amount as of 31
12 2018 Investment property 88,446 30,916Property under construction 61,485 20,766Real estate inventories 0 5,026Deferred tax assets 27 0Trade and other receivables 684 202Cash and cash equivalents 3,980 252Assets held for sale 154,622 57,162 Reclassifiable reserves -904 682 Financial liabilities 45,365 0Trade and other payables 2,185 366Provisions 335 14Deferred tax liabilities 770 1,181Liabilities held for sale 48,655 1,561 The investment property classified as held for sale as of 31 December 2019 included rights of use (IFRS 16) totalling EUR 4.3 million, while the comparable amount for property under construction was EUR 13.7 million. The financial liabilities held for sale included lease liabilities of. EUR 17.9 million.
Of the assets and liabilities classified as held for sale as of 31 December 2018, one retail property, five office properties and four properties in the other asset class were sold during 2019.
The remaining properties in the core market of Germany were sold during 2019, and no properties are classi-fied as held for sale at the present time. Foreign exchange-adjusted revaluations of EUR -1.3 million were recognised to standing investments and real estate inventories in 2019.
One office property in the EMPARK Mokotòw Business Park in Poland and two Austrian retail properties are still classified as held for sale. The following properties were reclassified as held for sale during 2019: four office properties in Poland which are to be sold through a share deal, several office properties in the EMPARK Mokotòw Business Park in Poland and one retail property in Romania.
With regard to the sales not yet realised, management stands by its intention to sell these properties.
All of the above sales, respectively divestment resolutions by the Executive Board and Supervisory Board are intended to align the portfolio with IMMOFINANZ’s strategic focus.

CONSOLIDATED FINANCIAL STATEMENTSNotes to the Consolidated Balance Sheet
167
CO
NS
OL
IDA
TE
D F
INA
NC
IAL
STA
TE
ME
NT
S
4.10 Real estate inventories The properties held for sale by IMMOFINANZ during the course of ordinary business operations do not fall under the scope of application of IAS 40, but are treated as inventories in accordance with IAS 2. As a rule, these inventories represent residential properties.
Inventories of residential properties are valued according to the moving average price method. Disposals are calculated on the basis of square meters and, after the recognition of additions, measured at the average price applicable to the respective quarter. A provision is recognised for any outstanding construction work required after the transfer of a property, which increases the production costs of the sold inventories as well as the book value disposals. The net selling prices used for valuation as of the balance sheet date are normally based on current list prices less outstanding project development costs and flat-rate marketing costs; to a lesser extent, they are measured at the appraised fair value as of the balance sheet date for simplification purposes. Estimation uncertainty in the determination of the net selling price, e.g. concerning the outstanding project development costs, could lead to negative margins on the sale of the inventories (in spite of previous loss-free measurement) if construction cost overruns occur at a later date.
All amounts in TEUR 31 12 2019 31 12 2018 Inventories carried at net realisable value less costs to sell 520 46,753Inventories carried at acquisition or production cost 348 179Total 868 46,932
Write-downs totalling EUR -1.2 million were recognised to real estate inventories in 2019 (2018: EUR -11.9 million). They are attributable primarily to costs for construction, the correction of defects and project management following the decision to sell the Gerling Quartier.
Borrowing costs directly attributable to the acquisition, construction or production of assets whose purchase or development requires a longer period of time are capitalised as part of acquisition or production cost. The borrowing costs for real estate inventories under development are capitalised on the basis of actual interest expense. For financing provided by the Group, the average borrowing costs are capitalised. The average bor-rowing costs for IMMOFINANZ’s continuing and discontinued operations, as defined in IAS 23, equalled 1.91% in 2019 (2018: 2.14%). Borrowing costs of EUR 0.4 million were capitalised for real estate inventories under development during the reporting year (2018: EUR 1.6 million).
4.11 Cash and cash equivalents Cash and cash equivalents comprise cash on hand, funds in transit and deposits with financial institutions with a term up to three months. These items are carried at the value applicable on the balance sheet date.
The balance sheet shows cash and cash equivalents of EUR 341.1 million as of 31 December 2019 (31 De-cember 2018: EUR 631.8 million). In addition, other financial receivables include various bank deposits whose use is restricted (restricted funds, see section 4.6).
4.12 Equity Share capital totalled EUR 112.1 million as of 31 December 2019 (31 December 2018: EUR 112.1 million), It is divided into 112,085,269 (31 December 2018: 112,085,269) zero par value shares, each of which repre-sents a stake of EUR 1.00 in share capital. All shares are fully paid in.

168 IMMOFINANZ AGAnnual Report 2019
The number of shares developed as follows:
Number of shares 2019 2018 Balance at the beginning of the financial year 112,085,269 1,116,173,778Issue of shares (for conversion of the convertible bonds 2011-2018 and 2007-2017) 0 4,678,921Reverse stock split 0 -1,008,767,430Balance at the end of the financial year 112,085,269 112,085,269 On 2 July 2018, the Executive Board and Supervisory Board of IMMOFINANZ AG approved the use of an authorisation by 25th annual general meeting on 11 May 2018 – which was renewed by an authorisation of the 26th annual general meeting on 22 May 2019 – to carry out a share buyback programme (share buyback programme 2018/19) in accordance with § 65 (1) No. 8 of the Austrian Stock Corporation Act. The authori-sation covers up to 10% of the company’s share capital. The share buyback programme 2018/2019 started on 16 July 2018 and was terminated on 13 August 2019 when the maximum repurchase volume of 9,708,526 shares, representing 8.66% of current share capital, was reached. The shares were repurchased over the stock exchange at a weighted average price of EUR 22.54 per share. This programme resulted in the repurchase of 6.3 million IMMOFINANZ shares for a total of EUR 144.0 million in 2019.
IMMOFINANZ held 11,208,526 treasury shares as of 31 December 2019 (31 December 2018: 4,942,001 treasury shares). Of this total, 1,500,000 shares are attributable to a previous share buyback programme which ended on 15 June 2018.
The annual general meeting on 11 May 2018 authorised the Executive Board in accordance with § 169 of the Austrian Stock Corporation Act to increase the company’s share capital, with the consent of the Supervisory Board, by up to EUR 50,000,000.00 through the issue of up to 50,000,000 new shares in exchange for cash or contributions in kind. This authorisation is valid up to 19 June 2023. It has not been used to date and is therefore still available in full.
The Executive Board is not aware of any agreements between shareholders that restrict voting rights or the transfer of shares. All shares are bearer shares and entitle the holders to participate in the annual general meeting and to exercise their voting rights. Each bearer share is entitled to one vote.
The 26th annual general meeting on 22 May 2019 approved the payment of a EUR 0.85 dividend per share for the 2018 financial year. Based on this resolution, a total of EUR 88.1 million was distributed to non-Group shareholders on 28 May 2019.
Of the total other comprehensive income, EUR 16.7 million (2018: EUR -50.5 million) is attributable to IMMOFINANZ shareholders and EUR -0.8 million (2018: EUR -3.4 million) to non-controlling interests. The other comprehensive income attributable to IMMOFINANZ shareholders resulted primarily from the change of EUR 21.7 million (2018: EUR -10.4 million) in the valuation reserve recorded under equity, which originated from the equity-accounted investment in S IMMO. The other comprehensive income attributable to non-con-trolling interests resulted from currency translation differences.

CONSOLIDATED FINANCIAL STATEMENTSNotes to the Consolidated Balance Sheet
169
CO
NS
OL
IDA
TE
D F
INA
NC
IAL
STA
TE
ME
NT
S
4.13 Liabilities from convertible bonds IMMOFINANZ had convertible bonds with a total nominal value of EUR 297.2 million outstanding as of 31 De-cember 2019 (31 December 2018: EUR 297.2 million). The underlying bond liability and the related interest coupons are measured at amortised cost based on the effective interest method.
All amounts in TEUR 31 12 2019
Thereof remaining
term under 1 year
Thereof remaining
term between 1 and 5 years
Thereof remaining term over
5 years 31 12 2018
Thereof remaining
term under 1 year
Thereof remaining
term between 1 and 5 years
Thereof remaining term over
5 years Convertible bond 2017-2024 285,807 4,463 281,344 0 284,638 5,944 278,694 0Total 285,807 4,463 281,344 0 284,638 5,944 278,694 0
Convertible bond 2017–2024 IMMOFINANZ issued a convertible bond on 24 January 2017 through an accelerated bookbuilding process with institutional investors. The bond has a nominal value of EUR 297.2 million, an initial interest rate of 2.0% and a term ending on 24 January 2024. Following the receipt of an investment grade rating from S&P Global Rating in the first quarter of 2019, the coupon was reduced by 0.5% to 1.5% in accordance with the issue terms beginning with the interest rate period as of 24 January 2019. The convertible bond 2017–2024 in-cludes a (non-separable) put option at the nominal value plus accrued interest as of 24 January 2022, which also determines the instrument’s maturity at the present time.
The cash dividend of EUR 0.85 per share for the 2018 financial year (see section 4.12) which was approved by the annual general meeting on 22 May 2019 led to the adjustment of the conversion price for the convert-ible bond 2017–2024 to EUR 21.3772 per share. The conversion right can be exercised up to 10 January 2024.
4.14 Financial liabilities The following table shows the composition and classification of financial liabilities by remaining term as of 31 December 2019:
All amounts in TEUR 31 12 2019
Thereof remaining
term under 1 year
Thereof remaining
term between 1 and 5 years
Thereof remaining term over
5 years 31 12 2018
Thereof remaining
term under 1 year
Thereof remaining
term between 1 and 5 years
Thereof remaining term over
5 years Amounts due to financial institutions 2,008,731 255,970 1,170,116 582,645 2,140,731 338,168 1,686,550 116,013
Thereof secured by collateral 2,008,618 255,857 1,170,116 582,645 2,140,625 338,062 1,686,550 116,013Thereof not secured by collateral 113 113 0 0 106 106 0 0
Liabilities arising from the issue of bonds 506,161 13,086 493,075 0 0 0 0 0Other financial liabilities 65,489 3,641 11,022 50,826 153 153 0 0Total 2,580,381 272,697 1,674,213 633,471 2,140,884 338,321 1,686,550 116,013
On 21 January 2019, IMMOFINANZ AG issued an unsecured, non-subordinated bond with a nominal value of EUR 500 million. The bond has a four-year term and carries a fixed interest rate of 2.625% per year.
Other financial liabilities as of 31 December 2019 include lease liabilities of EUR 3.6 million (remaining term: under one year), EUR 11.0 million (remaining term: one to five years) and EUR 50.8 million (remaining term: over five years). As of 31 December 2019, lease liabilities of EUR 17.9 million were reclassified to held for sale liabilities (see section 4.9). The cash outflows for leases totalled EUR 4.6 million in 2019. Details on the effects of the initial application of IFRS 16 are provided in section1.4.

170 IMMOFINANZ AGAnnual Report 2019
The conditions of the major financial liabilities are as follows:
31 12 2019 Interest rate Nominal value of remaining liability
Carrying amount
Currency fixed/variable
Weighted average
interest rateIssue currency
in 1,000 TEUR TEUR Amounts due to financial institutions EUR fixed 2.13% 88,648 88,648 EUR variable 1.29% 1,932,614 1,932,614 Total amounts due to financial institutions 2,021,262 2,008,731Liabilities from the issue of bonds EUR fixed 2.63% 500,000 500,000 506,161Other financial liabilities 65,489Total 2,580,381
31 12 2018 Interest rate Nominal value of remaining liability
Carrying amount
Currency fixed/variable
Weighted average
interest rateIssue currency
in 1,000 TEUR TEUR Amounts due to financial institutions EUR fixed 1.30% 151,613 151,613 EUR variable 1.79% 1,996,097 1,996,097 Total amounts due to financial institutions 2,147,710 2,140,731Other financial liabilities 153Total 2,140,884
None of the covenants connected with the bank financing was breached in 2019.
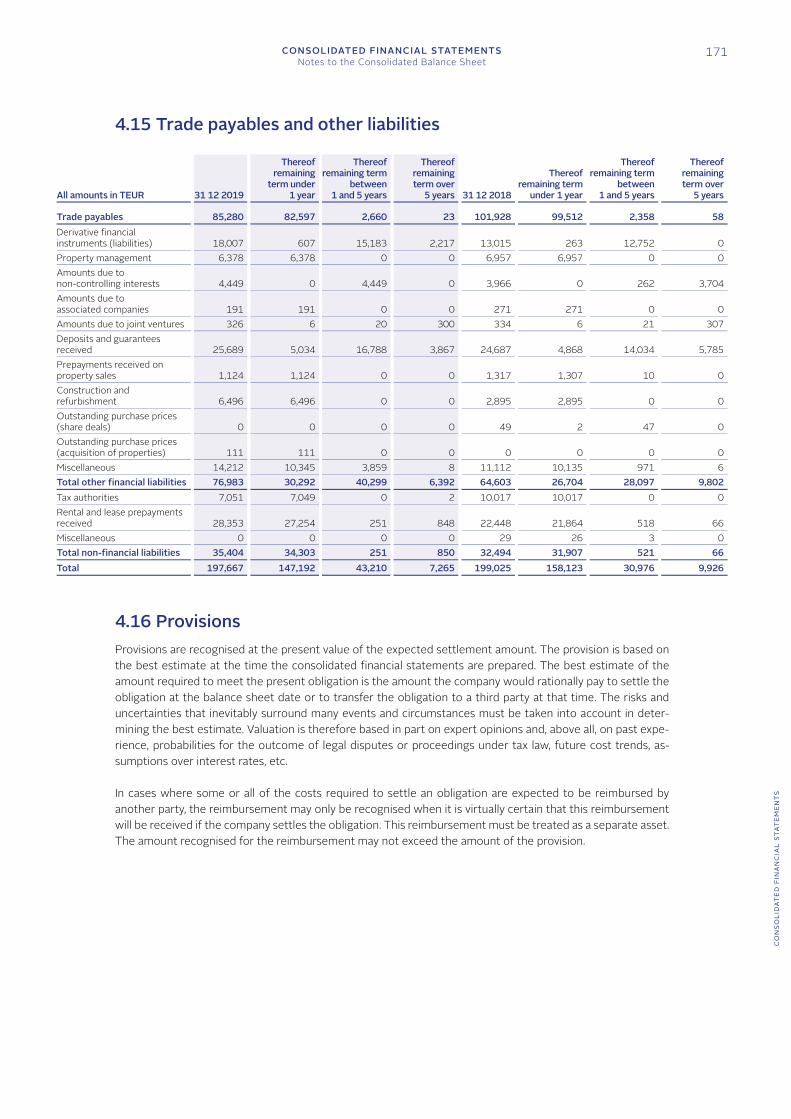
CONSOLIDATED FINANCIAL STATEMENTSNotes to the Consolidated Balance Sheet
171
CO
NS
OL
IDA
TE
D F
INA
NC
IAL
STA
TE
ME
NT
S
4.15 Trade payables and other liabilities
All amounts in TEUR 31 12 2019
Thereof remaining
term under 1 year
Thereof remaining term
between 1 and 5 years
Thereof remaining term over
5 years 31 12 2018
Thereof remaining term
under 1 year
Thereof remaining term
between 1 and 5 years
Thereof remaining term over
5 years Trade payables 85,280 82,597 2,660 23 101,928 99,512 2,358 58Derivative financial instruments (liabilities) 18,007 607 15,183 2,217 13,015 263 12,752 0Property management 6,378 6,378 0 0 6,957 6,957 0 0Amounts due to non-controlling interests 4,449 0 4,449 0 3,966 0 262 3,704Amounts due to associated companies 191 191 0 0 271 271 0 0Amounts due to joint ventures 326 6 20 300 334 6 21 307Deposits and guarantees received 25,689 5,034 16,788 3,867 24,687 4,868 14,034 5,785Prepayments received on property sales 1,124 1,124 0 0 1,317 1,307 10 0Construction and refurbishment 6,496 6,496 0 0 2,895 2,895 0 0Outstanding purchase prices (share deals) 0 0 0 0 49 2 47 0Outstanding purchase prices (acquisition of properties) 111 111 0 0 0 0 0 0Miscellaneous 14,212 10,345 3,859 8 11,112 10,135 971 6Total other financial liabilities 76,983 30,292 40,299 6,392 64,603 26,704 28,097 9,802Tax authorities 7,051 7,049 0 2 10,017 10,017 0 0Rental and lease prepayments received 28,353 27,254 251 848 22,448 21,864 518 66Miscellaneous 0 0 0 0 29 26 3 0Total non-financial liabilities 35,404 34,303 251 850 32,494 31,907 521 66Total 197,667 147,192 43,210 7,265 199,025 158,123 30,976 9,926
4.16 Provisions Provisions are recognised at the present value of the expected settlement amount. The provision is based on the best estimate at the time the consolidated financial statements are prepared. The best estimate of the amount required to meet the present obligation is the amount the company would rationally pay to settle the obligation at the balance sheet date or to transfer the obligation to a third party at that time. The risks and uncertainties that inevitably surround many events and circumstances must be taken into account in deter-mining the best estimate. Valuation is therefore based in part on expert opinions and, above all, on past expe-rience, probabilities for the outcome of legal disputes or proceedings under tax law, future cost trends, as-sumptions over interest rates, etc.
In cases where some or all of the costs required to settle an obligation are expected to be reimbursed by another party, the reimbursement may only be recognised when it is virtually certain that this reimbursement will be received if the company settles the obligation. This reimbursement must be treated as a separate asset. The amount recognised for the reimbursement may not exceed the amount of the provision.

172 IMMOFINANZ AGAnnual Report 2019
The provisions developed as follows in 2019:
All amounts in TEUR 2019 Balance at the beginning of the financial year 56,369Deconsolidations (see 2.3 and 2.4) -169Foreign exchange differences 40Additions 17,731Disposals -5,433Use -15,475Compounding 364Reclassifications 1,301Reclassification to/from assets held for sale (see 4.9) -331Balance at the end of the financial year 54,397
Thereof current 36,262Thereof non-current 18,135
This position comprises provisions of EUR 23.5 million (2018: EUR 21.9 million) for legal proceedings and EUR 15.0 million (2018: EUR 6.8 million) for work outstanding and warranties following the transfer of prop-erties in Germany as well as other provisions. The other provisions consist primarily of provisions for tax risks (above all, withholding, VAT and property tax), contractual obligations and obligations to employees (e.g. for bonuses and unused vacation). The use of provisions in 2019 was related, above all, to payments connected with pending tax proceedings for the sold logistics business (see section 2.4).
IMMOFINANZ also holds contingent liabilities for outstanding warranty risks which were not reported as pro-visions as of 31 December (see section 7.1.4).
Restitution proceedings are currently in progress over land on which a Romanian subsidiary constructed a shopping center and over another parcel of land in Romania. These proceedings (de facto) restrict the rights of disposal. Activities are currently in progress to settle these restitution proceedings.
Detailed information on the provisions for legal proceedings is not provided in accordance with IAS 37 because it could, under certain circumstances, seriously prejudice IMMOFINANZ’s position.

CONSOLIDATED FINANCIAL STATEMENTSNotes to the Consolidated Income Statement
173
CO
NS
OL
IDA
TE
D F
INA
NC
IAL
STA
TE
ME
NT
S
5. Notes to the Consolidated Income Statement
5.1 Results of asset management
5.1.1 Rental income The following table shows the classification of rental income by asset class:
All amounts in TEUR 2019 2018 Office 123,824 104,154Retail 130,211 111,574Other 25,844 21,177Total 279,879 236,905
All leases in which IMMOFINANZ serves as the lessor are classified as operating leases, and all leased property is therefore carried on IMMOFINANZ’s balance sheet. The resulting rental income is distributed on a straight-line basis over the term of the lease. The term of the lease includes the non-cancellable contract periods as well as option periods when the exercise of the extension option is sufficiently certain at the beginning of the lease. Incentives granted for the conclusion or extension of leases (e.g. rent-free periods, reduced rents for a certain period, graduated rents that increase at fixed rates over the lease term, fit-outs for individual tenants or the assumption of relocation costs) are included in the determination of the fair value of investment prop-erty and recognised as an adjustment to rental income on a straight-line basis over the term of the lease. Contractually agreed, inflation-based rental price adjustments are recognised when the adjustments take effect and not on a straight-line basis over the term of the lease. Contingent rental income (generally turnover-based rents) is only recognised when it is realised. The contingent rental income totalled EUR 13.9 million (2018: EUR 12.1 million) and is included in the rental income from the retail asset class. Compensation payments received from tenants for the premature cancellation of leases are recognised to rental income as incurred.
When renegotiation, additions or amendments lead to a material change in the cash flows realisable over the remaining term of a rental agreement, the previous accruals from incentive agreements – with the exception of fit-outs that will be reused – are derecognised as a reduction of rental income. If there is no material change in the rental agreement, the previously accrued incentives remain unchanged and are recognised on a straight-line basis. The general rules for the recognition of rental income on the initial conclusion of a rental agreement also apply when there is a substantial change in the rental agreement.
The rental income from the contracts in effect as of 31 December 2019 is as follows:
All amounts in TEUR 2019 2018 Within 1 year 294,685 218,862Between 1 and 5 years 796,566 508,875Over 5 years 417,251 359,325Total 1,508,502 1,087,062
The agreed rental income from existing leases includes future index-based adjustments. Future rental income was adjusted to exclude the contracts related to disposal groups or the discontinued operations as of the balance sheet date. Special cancellation rights or additional rental income from turnover-based rents were not included. An average term of 15 years was applied to open-end rental contracts.

174 IMMOFINANZ AGAnnual Report 2019
5.1.2 Operating costs charged to tenants and operating expenses The results of asset management include the net presentation of the income from operating costs charged to tenants and operating expenses. These items are shown separately under the results of asset management on the consolidated income statement to achieve a transparent presentation. The income from operating costs charged to tenants represents revenue in the sense of IFRS 15 (Revenue from Contracts with Customers), which is recognised over time. Operating costs are generally charged on a monthly basis and do not include any material financing components. The segment report provides information on the allocation of revenue from operating costs charged to tenants to the individual IMMOFINANZ regional core markets (see section3.6).
The income from operating costs charged to tenants totalled EUR 85.5 million in 2019 (2018: EUR 90.8 mil-lion). In individual countries (e.g. Hungary, Slovakia and Poland), the income also includes contractually agreed flat-rate administrative costs or mark-ups to operating costs that are also collected from tenants. The initial application of IFRS 16 as of 1 January 2019 led to the reclassification of income totalling EUR 12.1 million from third-party charge-outs for property taxes and building insurance to rental income. Additional details on the effects of the initial application of IFRS 16 are provided in section 1.4.
Operating expenses include EUR -93.7 million (2018: EUR -87.2 million) of operating costs which are charged to tenants as well as expenses of EUR -8.2 million (2018: EUR -8.5 million) from vacancies. The operating costs charged to tenants also contain personnel expenses (see section 5.6) of TEUR 11.3 (2018: EUR 0.5 mil-lion) for properties managed by IMMOFINANZ.
5.1.3 Other revenues The former major component of other revenues – the revenues from advertising space and telecommunica-tions equipment positioned on IMMOFINANZ properties – were reclassified to rental income as of 1 January 2019 in connection with the initial application of IFRS 16. This reclassification amounted to EUR 4.3 million as of 31 December 2019. Additional details on the effects of the initial application of IFRS 16 are provided in section 1.4.
5.1.4 Expenses from investment property All amounts in TEUR 2019 2018 Commission expenses -475 -1,374Maintenance -21,606 -23,990Operating costs charged to building owners -12,640 -12,596Property marketing -8,296 -6,295Personnel expenses from asset management (see 5.6) -3,965 -5,113Other expenses from asset management -2,585 -4,039Rental and lease payments 0 -2,048Fit-out costs -3,319 -2,544Write-off of receivables from asset management -2,160 -2,742Other expenses -2,395 -3,247Total -57,441 -63,988 Maintenance costs are attributable to the implementation of the “myhive” office concept, rebranding measures for the VIVO! and STOP SHOP brands and regular building maintenance.
Following the initial application of IFRS 16 in 2019, current leasing and rental expenses for investment prop-erties are no longer recorded. The resulting amount for 2019 therefore totalled EUR 0.0 million (2018: EUR -2.1 million). Details on the effects of the initial application of IFRS 16 are provided in section 1.4. Addi-tional information on IFRS 16 and its effects on investment property and the income statement can be found in sections 5.7 and 5.9.

CONSOLIDATED FINANCIAL STATEMENTSNotes to the Consolidated Income Statement
175
CO
NS
OL
IDA
TE
D F
INA
NC
IAL
STA
TE
ME
NT
S
5.2 Results of property sales All amounts in TEUR 2019 2018 Office 74,733 193,685Retail 7,541 8,894Other 5,258 37,303Proceeds from property sales 87,532 239,882Less carrying amount of sold properties -87,281 -239,373Net gain/loss from property sales 251 509Gains/losses from deconsolidation (see 2.3) 1,736 33,214Sales commissions -509 -1,029Personnel expenses from property sales (see 5.6) -1,258 -1,044Legal, auditing and consulting fees from property sales -580 -828Write-off of receivables from property sales -4 0VAT adjustments from the sale of properties 0 -427Other expenses -692 -4,762Expenses from property sales -3,043 -8,090Revaluation results from properties sold and held for sale (see 5.7) -4,023 1,568Total -5,079 27,201 Results from the sale of properties show the income from asset deals. This income represents the fair value of the property on the transaction date and is therefore generally contrasted by book value disposals of the same amount. The differences between the proceeds on sale and the carrying amounts on the last balance sheet date are recorded under the revaluation of properties sold and held for sale. The differences between the sale proceeds and book value disposals in 2019 resulted from the receipt of purchase price payments for sales made in earlier financial years. The proceeds from the sale of properties are not part of IMMOFINANZ’s ordinary business activities and, consequently, do not represent revenues in the sense of IFRS 15 (Revenue from Contracts with Customers).
Expenses from property sales include all personnel and operating expenses directly related to the sale process for a property or property company.
5.3 Results of property development All amounts in TEUR 2019 2018 Proceeds from the sale of real estate inventories 51,122 6,621Cost of real estate inventories sold -56,041 -6,663Brokerage fees for real estate inventories 0 -24Other costs to sell for real estate inventories -1,455 -1,110Write-down related reversals of real estate inventories 215 21Write-down of real estate inventories -1,421 -11,957Income and expenses related to written-off purchase price receivables from the sale of real estate inventories 0 -350Impending losses from the forward sale of real estate inventories 0 1,509Operating costs charged to building owners-inventories -390 -630Other expenses from real estate inventories -160 -4,633Expenses from real estate inventories -3,211 -17,174Expenses from property development -5,709 -4,397Revaluation results from properties under construction (see 5.7) 1,462 17,281Total -12,377 -4,332
The sale of real estate inventories is reported under income from property development. In accordance with IFRS 15, revenue is recognised over time when the performance provided leads to an asset with no alternative use for IMMOFINANZ and IMMOFINANZ has an enforceable right to payment for the performance transferred to date. This is regularly the case with residential properties which are sold during the planning or construction stage. In cases where these requirements are met, a proportional share of profit is recognised according to the percentage of completion (which represents the extent of performance provided) if the carrying amount of

176 IMMOFINANZ AGAnnual Report 2019
the involved property exceeds the agreed net realisable value less transaction costs. The residential properties under development were in an advanced stage of completion at year-end 2019 and material estimates were not required. Payment was made in instalments based on pre-defined development steps and closely reflects the percentage of completion.
Revenue from the sale of properties with an alternative use or without an enforceable right to payment is still recognised at a point in time (i.e. with the transfer of economic ownership). This point in time is generally the date on which the property is transferred because it marks the transfer of opportunities and risks as well as economic control.
The contracts do not include material financing components or variable payment elements.
The following table classifies the proceeds from the sale of real estate inventories in 2019 according to the timing of revenue recognition.
All amounts in TEUR 2019 2018 Revenue recognised at a point in time 698 5,393Revenue recognised over time 50,424 1,227Income from derecognised liabilities 51,122 6,620
The allocation of the EUR 51.1 million (2018: EUR 6.6 million) in proceeds from the sale of real estate inven-tories to IMMOFINANZ’s regional core markets is shown in the segment report (see section 3.6).
The results of property development also include charges of EUR 1.6 million (2018: EUR 2.4 million) for personnel expenses.
5.4 Other operating income Other operating income comprises the following items:
All amounts in TEUR 2019 2018 Expenses charged on 169 454Insurance compensation 466 256Income from derecognised liabilities 3,119 2,635Reimbursement for penalties 528 208Miscellaneous 1,874 2,587Total 6,156 6,140 Most of the miscellaneous other operating income in 2019 involved reimbursements to tenants for contract registration fees paid in connection with tax proceedings. The income from derecognised liabilities consists primarily of an expired, non-refundable, derecognised prepayment of EUR 2.5 million in Romania.

CONSOLIDATED FINANCIAL STATEMENTSNotes to the Consolidated Income Statement
177
CO
NS
OL
IDA
TE
D F
INA
NC
IAL
STA
TE
ME
NT
S
5.5 Other operating expenses Other operating expenses include the following items:
All amounts in TEUR 2019 2018 Administrative expenses -231 -310Legal, auditing and consulting fees -8,888 -9,256Penalties 215 -2,403Levies -852 432Advertising -2,954 -2,972Expenses charged on -77 -19Rental and lease expenses 0 -580EDP and communications -3,255 -4,249Expert opinions -195 -708Personnel expenses (see 5.6) -21,580 -25,102Addition to/reversal of provision for onerous contracts 0 732Other write-downs -1,244 -695Miscellaneous -7,083 -4,819Total -46,144 -49,949 A positive effect from penalties resulted from the release of provisions for the delayed transfer of rentable space in Germany which was no longer required in 2019. Positive effects from taxes and duties in the previous year resulted from the release of provisions for VAT risks in Romania.
Miscellaneous other operating expenses include costs of TEUR 50 for research on digitalisation in the real estate branch.
Other write-downs include write-downs of EUR -0.6 million to rights of use (IFRS 16) for tangible assets.
IMMOFINANZ applies the practical expedients provided by IFRS 16 to short-term leases (under 12 months) and low-value leases (under EUR 5,000) and records the costs for these contracts under other operating ex-penses. As of 31 December 2019, the costs for short-term leases amounted to EUR 0.4 million and the costs for low-value leases equalled EUR 0.1 million. Miscellaneous operating expenses also include expenses related to compensation for damages from former Executive Board members, which were passed on to third parties in accordance with contractual obligations. In addition, miscellaneous operating expenses consist primarily of costs connected with Supervisory Board remuneration, for property used by IMMOFINANZ, insurance premi-ums and the annual general meeting.
5.6 Personnel expenses Personnel expenses for IMMOFINANZ’s employees include the following:
All amounts in TEUR 2019 2018 Salaries -22,367 -26,795Employee benefits -6,078 -7,379Total -28,445 -34,174
Employee benefits include EUR 0.2 million (2018: EUR 0.1 million) for pensions, EUR 0.7 million (2018: EUR 1.0 million) for severance payments and contributions to employee benefit funds and EUR 4.5 million (2018: EUR 5.8 million) for statutory social security contributions as well as payroll-based duties and manda-tory contributions.

178 IMMOFINANZ AGAnnual Report 2019
Personnel expenses were allocated to the following sections of the consolidated income statement as follows:
All amounts in TEUR 2019 2018 Results of asset management 3,965 5,595Results of property sales 1,258 1,044Results of property development 1,642 2,433Other operating expenses 21,580 25,102Personnel expenses 28,445 34,174 The functional operating areas include only the directly allocated personnel expenses. In cases where direct allocation is not possible, the personnel expenses are included under other operating expenses.
The average number of employees in the companies included in the consolidated financial statements totalled 306 in 2019 (2018: 345 employees). In order to improve comparability with the amounts reported for per-sonnel expenses, the average number of employees excludes employees on official leave (maternity, military etc.).
5.7 Revaluation results from investment property and goodwill The results from the revaluation of investment properties and goodwill comprise valuation results of EUR 195.9 million (2018: EUR 6.0 million), subsequent purchase price adjustments of EUR 0.1 million (2018: EUR -0.1 million) and impairment losses to goodwill of EUR -0.3 million (2018: EUR 0.0 million).
The revaluation results from the standing investments include a revaluation loss of EUR -0.4 million to rights of use (IFRS 16).
The following table shows the revaluation gains and losses on investment property:
2019 2018
All amounts in TEUR Revaluation
gainsRevaluation
losses TotalRevaluation
gainsRevaluation
losses Total Investment property 257,864 -61,956 195,908 68,393 -62,338 6,055Property under construction 36,297 -34,835 1,462 28,263 -10,982 17,281Properties sold and held for sale 8,140 -12,163 -4,023 13,596 -12,028 1,568Total 302,301 -108,954 193,347 110,252 -85,348 24,904 Details on property under construction are provided in section 5.3, and details on property sold and held for sale can be found in section 5.2.

CONSOLIDATED FINANCIAL STATEMENTSNotes to the Consolidated Income Statement
179
CO
NS
OL
IDA
TE
D F
INA
NC
IAL
STA
TE
ME
NT
S
5.8 Share of profit or loss from equity-accounted investments All amounts in TEUR Joint ventures Associates Total 2019 Share of profit or loss for the period -102 63,896 63,794Other adjustments 18 16,063 16,081Reclassification of foreign exchange differences to profit or loss 932 128 1,060Gains/losses on the sale of equity-accounted investments -875 -1,680 -2,555Total -27 78,407 78,380
All amounts in TEUR Joint ventures Associates Total 2018 Share of profit or loss for the period 2,803 61,537 64,340Other adjustments 2,127 -24,396 -22,269Reclassification of foreign exchange differences to profit or loss 0 -776 -776Gains/losses on the sale of equity-accounted investments 23 66,843 66,866Total 4,953 103,208 108,161
The share of profit or loss from equity-accounted investments in 2019 consisted primarily of proportional results for the period from S IMMO (EUR 62.0 million) and the partial reversal of the impairment loss recognised as of 30 September 2018 (EUR 14.4 million). Gains and losses on the sale of equity-accounted investments included the results from the transition consolidation of FMZ Lublin Sp. z o.o. and the sale of FMZ Sosnowiec Sp. z o.o. (EUR -1.7 million), the transition consolidation results from NP Investments a.s. (TEUR -422) and the deconsolidation results from Sadira Ltd. and Alpha Arcadia LLC (TEUR 423).
In 2018, the share of profit or loss from equity-accounted investments included the proportional share of results for the period as well as the EUR 66.1 million gain on the sale of the CA Immo investment and an impairment loss of EUR 25.1 million to the S IMMO shares.
Aggregated financial information on the joint ventures and associates is presented in section 4.5.
5.9 Financial results All amounts in TEUR 2019 2018 For financial liabilities AC -56,494 -58,948For derivative financial instruments -8,064 -9,426Total financing costs -64,558 -68,374For financial receivables AC 1,003 6,765For derivative financial instruments 176 141Total financing income 1,179 6,906Foreign exchange differences -1,510 95Profit or loss on other financial instruments and proceeds on the disposal of financial instruments -324 51Valuation of financial instruments at fair value through profit or loss -8,932 -3,845Distributions 568 498Valuation adjustments and impairment of receivables -330 748Other financial results -9,018 -2,548Net profit or loss from equity-accounted investments (see 5.8) 78,380 108,161Total 4,473 44,240 AC: financial assets/liabilities measured at amortised cost

180 IMMOFINANZ AGAnnual Report 2019
The financing costs for financial liabilities measured at amortised cost include interest expenses of EUR -2.8 million for IFRS 16 lease liabilities. This position also includes income of EUR 8.9 million from the modifi-cation of financial instruments. This earnings effect must be reported at the time of modification in accordance with IFRS 9 and results from the reduction in the interest rate on the convertible bond from 2% to 1.5% (see section 4.13) and from the lower interest rate on the refinancing for the Vienna Twin Towers at the myhive am Wienerberg.
The foreign exchange differences include immaterial foreign exchange gains of TEUR 10.6 and foreign exchange losses of TEUR -19.3 from IFRS 16 lease liabilities.
The results from the valuation of financial instruments at fair value through profit or loss consist of the following:
All amounts in TEUR 2019 2018 Revaluation results from real estate fund shares -1,040 2,105Valuation results from derivative financial instruments -7,999 -6,226Valuation results from shares in companies 107 276Total -8,932 -3,845 Information on the net gains and losses from financial instruments is provided in section 7.1.2.
5.10 Income taxes This position includes income taxes paid or owed by the parent company and subsidiaries as well as deferred taxes. Interest and penalties from tax proceedings are also included here. An overview of deferred tax assets and deferred tax liabilities is presented in section 4.8.
All amounts in TEUR 2019 2018 Current income tax -8,552 -23,635
Thereof from current period -13,885 -22,185Thereof from prior periods 5,333 -1,450
Deferred tax 6,018 37,630Thereof from current period 17,991 -32,398Thereof from changes in tax rates -332 -548Thereof from deductible temporary differences previously not recognised and loss carryforwards from previous financial years 41,127 85,954Thereof from the revaluation of investment property -52,768 -12,434Thereof impairment losses (resp. reversals of previous impairment losses) to deferred tax assets 0 -2,944
Total -2,534 13,995

CONSOLIDATED FINANCIAL STATEMENTSNotes to the Consolidated Income Statement
181
CO
NS
OL
IDA
TE
D F
INA
NC
IAL
STA
TE
ME
NT
S
The difference between calculated income tax expenses and the actual income tax expenses shown on the income statement is attributable to the following factors:
All amounts in TEUR 2019 2018 Earnings before tax 350,051 203,302 Income tax expense at 25% tax rate -87,513 25.0% -50,826 25.0%Effect of different tax rates 10,412 -3.0% 21,477 -10.6%Effect of changes in tax rates -331 0.1% -549 0.3%Impairment losses to goodwill/negative differences recognised in profit or loss -29 0.0% 0 0.0%Loss carryforwards and deferred tax assets not recognised 60,882 -17.4% -3,355 1.7%Non-deductible income and expenses -17,822 5.1% 5,184 -2.5%Write-downs and write-ups to deferred taxes -59,182 16.9% 82,997 -40.8%Effects related to other periods 5,347 -1.5% 6,658 -3.3%Effects of deferred taxes on investments in subsidiaries, joint ventures and associates 83,298 -23.8% -46,793 23.0%Other non-temporary differences 2,404 -0.7% -798 0.4%Effective tax rate -2,534 0.7% 13,995 -6.9% The impact of the different tax rates on the effective tax rate for the Group results from the difference be-tween the Austrian corporate tax rate of 25% and the respective local tax rates (see section 4.8).
The non-deductible income and expenses consist mainly of non-deductible interest expense, tax-free income from investments and non-deductible foreign exchange losses.
In the 2004/05 financial year, the major Austrian companies joined together into a corporate group in the sense of § 9 of the Austrian Corporate Tax Act. IMMOFINANZ AG serves as the lead company of this group. The lead company and the members of the tax group concluded an agreement for the settlement of taxes, which was amended in 2011/12. In accordance with the amended agreement, each member with positive results must pay a tax charge to the lead company. The charge equals 25% of the assessment base and is based on the tax rate defined in § 22 (1) of the Austrian Corporate Tax Act. Any losses by the group members are registered and can be offset in full against taxable profit recorded by the respective member in subsequent years. Group members with registered tax losses are not required to make payments to the lead company; no payments for (negative) charges are made by the lead company to the group members. A routine tax audit of the Austrian tax group covering the period for the 2012 to 2014 assessment years is currently in progress, and additional tax audits were subsequently opened for the periods up to 2018. The audits cover, through sampling, individual members as well as the head of the group. A total of 39 tax audits were opened, whereby 30 have been closed and nine are still open. One audit resulted in a cash-effective assessment of EUR 1,400 (VAT). The other concluded proceedings did not lead to any cash-effective assessments.
Another corporate group was established in 2009/10 pursuant to § 9 of the Austrian Corporate Tax Act. CPB Enterprise GmbH serves as the lead company of this group. Based on the group and tax assessment agreement concluded on 22 December 2009, the taxable income generated by the members of this group is allocated to CPB Enterprise GmbH, as the lead company of the group, after an offset against any pre-group losses. The group contract also calls for a tax charge as settlement for the transfer of taxable income. The tax charge procedure for this tax group is the same as the new tax charge agreement implemented for the IMMOFINANZ AG corporate group; it took effect starting in the 2011/12 financial year.

182 IMMOFINANZ AGAnnual Report 2019
5.11 Earnings per share In accordance with IAS 33, earnings per share are calculated by the dividing net profit for the period attribut-able to the shareholders of IMMOFINANZ AG by the weighted average number of shares outstanding.
2019 2018 Weighted average number of shares (basic) 106,567,143 110,243,185Diluting effect IMMOFINANZ convertible bond 2011-2018 0 1,704,001Diluting effect IMMOFINANZ convertible bond 2017-2024 13,387,387 12,957,230Weighted average number of shares (diluted) 119,954,530 124,904,416Net profit or loss (excl. non-controlling interests) in EUR 358,888,000.00 217,261,000.00Diluting effect IMMOFINANZ convertible bond 2011-2018 0.00 253,000.00Diluting effect IMMOFINANZ convertible bond 2017-2024 4,783,000.00 7,887,000.00Net profit or loss excl. non-controlling interests in EUR (diluted) 363,671,000.00 225,401,000.00Basic earnings per share in EUR 3.37 1.97Diluted earnings per share in EUR 3.03 1.80 Diluting effects in 2019 were created by the potential common shares from the issue of the convertible bond 2017-2024. These diluting effects are only included in the calculation when they reduce earnings per share or increase the loss per share. The calculation of the number of shares as of 31 December 2019 included the 11,208,526 treasury shares held by IMMOFINANZ (31 December 2018: 4,942,001 treasury shares).
6. Notes to the Consolidated Cash Flow Statement
The cash flow statement of IMMOFINANZ shows the changes in cash and cash equivalents resulting from the inflow and outflow of funds during the financial year. The cash flow statement distinguishes between gross cash flows from operating activities, investing activities and financing activities. Interest paid is reported under cash flow from financing activities, while interest and dividends received are reported under cash flow from investing activities. Cash flow from operating activities is calculated using the indirect method. Cash and cash equivalents comprise the following as of the balance sheet dates shown below:
All amounts in TEUR 31 12 2019 31 12 2018 Cash and cash equivalents (see 4.11) 341,161 631,754Cash and cash equivalents held by disposal groups (see 4.9) 3,980 252Cash and cash equivalents 345,141 632,006

CONSOLIDATED FINANCIAL STATEMENTSNotes to the Consolidated Cash Flow Statement
183
CO
NS
OL
IDA
TE
D F
INA
NC
IAL
STA
TE
ME
NT
S
Foreign currency cash flows are translated at the weighted average exchange rate for the respective local currency and quarter. Translation differences arising from the use of this exchange rate and the mean ex-change rate on the balance sheet date are charged or credited to net foreign exchange differences.
The consolidated cash flow statement for 2019 and 2018 also includes the cash flows attributable to discon-tinued operations (see section 2.4).
The consideration received from the sale of discontinued operations and subsidiaries, less cash and cash equiv-alents, as reported on the cash flow statement, includes the following components:
All amounts in TEUR 2019 2018 Net cash flow from the sale of the retail portfolio Moscow (see 2.4) 0 -15Net cash flow from the sale of the retail portfolio Moscow in previous years 4,864 2,601Net cash flow from the sale of the logistics portfolio in previous years -10,015 5,150Consideration received/paid from the sale of discontinued operations -5,151 7,736Net cash flow from sales in the financial year (see 2.3) 13,908 53,865Net cash flow from the sale in the previous financial year 743 23,486Consideration received from the sale of subsidiaries in continuing operations, less cash and cash equivalents 14,651 77,351Total 9,500 85,087
In contrast to the presentation in the consolidated interim financial statements for Q1-Q3 2019, the estimates for the liabilities assumed in connection with the acquisition of Polish and Czech companies were changed as of 31 December 2019. These liabilities are now allocated to cash flow from investing activities instead of cash flow from operating activities.
The position “business combinations and other acquisitions, net of cash and cash equivalents” totalling EUR 267.4 million comprises EUR 94.5 million of cash paid and EUR 172.9 million of redeemed liabilities from the seller. The acquired assets and assumed liabilities consist of the following:
All amounts in TEUR 2019 Investment property 597,200Receivables and other assets 4,301Financial liabilities -288,049Trade and other payables -44,376Provisions -1,688Net assets acquired 267,388

184 IMMOFINANZ AGAnnual Report 2019
The following table reconciles financial liabilities, derivatives and equity, including cash flow from financing activities, as of 1 January 2019 and 31 December 2019:
Financial liabilities
All amounts in TEUR
Liabilities from convertible
bonds
Amounts due to financial institutions
Liabilities arising from the issue of
bondsOther financial
liabilities Balance sheet as of 31 12 2018 284,637 2,140,732 153Effects of the initial application of IFRS 16 72,181Balance sheet as of 1 1 2019 284,637 2,140,732 72,334 Changes in cash flow from financing activities Increase in financial liabilities 533,636 492,238 Proceeds from the issue of convertible bonds less transaction costs Repayment of financial liabilities -832,592 -4,714Redemption of convertible bonds Transaction costs from the issue of shares (settlement of the legal proceedings over the review of the exchange ratio) Incentivised conversion of convertible bonds plus transaction costs Derivatives Interest paid -5,201 -33,999 Distributions Transactions with non-controlling interest owners Share buyback Total change in cash flow from financing activities -5,201 -332,955 492,238 -4,714 Changes from the loss of control over subsidiaries -64 -58,650 Changes from the attainment of control over subsidiaries 279,665 Effects of changes in exchange rates -20 401 Changes in fair value Other changes in financial liabilities 6,371 -78,627 13,923 56,118 Other changes in equity Balance sheet as of 31 12 2019 285,807 2,008,731 506,161 65,489

CONSOLIDATED FINANCIAL STATEMENTSNotes to the Consolidated Cash Flow Statement
185
CO
NS
OL
IDA
TE
D F
INA
NC
IAL
STA
TE
ME
NT
S
Derivatives Equity
Derivative assets Derivative
liabilities Share capital/
capital reserves Treasury sharesAccumulated other equity
Retained earnings
Non-controlling interests Total
-499 13,015 4,577,344 -106,414 -183,324 -1,470,672 -16,593 5,238,379 72,181 -499 13,015 4,577,344 -106,414 -183,324 -1,470,672 -16,593 5,310,560 0 0 1,025,874 0 -837,306 0
0 0 -86 -15,052 -15,138 -39,200 -88,113 -88,113 -299 451 152 -65 -143,964 -144,029
-86 -15,052 -65 -143,964 0 -88,412 451 -97,760 -770 -59,484 4,192 283,857 -1,050 -800 -1,469 7,999 7,999 499 7,853 6,137 0 0 18,533 358,888 -6,007 371,414 -86 18,007 4,577,279 -250,378 -166,611 -1,200,196 -22,949 5,821,254

186 IMMOFINANZ AGAnnual Report 2019
7. Other Disclosures
7.1 Information on financial instruments
The primary financial instruments reported under assets consist primarily of trade accounts receivable, fi-nancing receivables, loans and other receivables, real estate fund shares, miscellaneous other financial instru-ments and cash and cash equivalents. The primary financial instruments recorded under liabilities consist primarily of financial liabilities, liabilities arising from convertible bonds and trade accounts payable. The non-derivative financial instruments recorded under assets are carried at fair value through profit or loss (real estate fund shares and shares in other companies) or at amortised cost. The fully consolidated companies in the IMMOFINANZ Group do not carry any financial instruments at fair value through other comprehensive income at the present time. Non-derivative financial liabilities are carried at amortised cost. Fair value is based on market prices or calculated in accordance with recognised valuation methods.
Derivative financial instruments are used to hedge the interest rate risk from business operations (see section 7.2.5).
Financial instruments can consist of a non-derivative underlying agreement and a derivative financial instru-ment. If the underlying agreement in which the derivative is embedded involves a financial asset, the deriva-tive is not separated, but recognised together with the underlying agreement as a single unit. If the underlying agreement involves a financial liability, the embedded derivative is accounted for separately unless it can be considered closely connected with the underlying agreement. Hybrid financial instruments which include both equity and debt elements are separated into their respective components.
7.1.1 Classes and categories of financial instruments IFRS 7 requires the breakdown of financial instruments by classes as well as the reconciliation of these classes with the line items shown on the balance sheet. Since the reporting company is entitled to define these classes, they generally differ from the categories defined by IFRS 9 for the measurement of financial instruments.
The definition of the reportable classes reflects the different characteristics of the major financial instruments held by IMMOFINANZ. Accordingly, similar financial instruments are grouped together to form a separate class. The classes are also defined to facilitate reconciliation with the line items shown on the balance sheet. These factors led to the definition of the following classes: trade accounts receivable, financing receivables, loans and other receivables (including restricted funds), real estate fund shares, derivatives, miscellaneous other financial instruments and cash and cash equivalents (asset classes) as well as liabilities arising from convertible bonds, bonds, liabilities with financial institutions, other financial liabilities, trade accounts payable, derivatives and miscellaneous other liabilities (liability classes).
In addition to the assignment of financial instruments to classes, IFRS 7 calls for the disclosure of the carrying amount of financial assets and financial liabilities in accordance with the categories defined in IFRS 9. The following table presents the carrying amount and fair value of each class of financial assets and financial liabil-ities as well as each IFRS 9 category and reconciles these amounts to the appropriate balance sheet line item. Since the balance sheet positions trade and other receivables and trade and other liabilities can contain finan-cial instruments as well as non-financial assets/liabilities (e.g. tax receivables), the column “Non-FI” allows for a full reconciliation with the balance sheet line items.

CONSOLIDATED FINANCIAL STATEMENTSOther Disclosures
187
CO
NS
OL
IDA
TE
D F
INA
NC
IAL
STA
TE
ME
NT
S
Assets FVPL Carrying amount Fair value
All amounts in TEUR mandatory ACCash and cash
equivalents Non-FI 31 12 2019 31 12 2019 Trade accounts receivable 0 56,227 0 0 56,227 56,227Financing receivables 0 10,503 0 0 10,503 10,503Loans and other receivables 0 73,090 0 30,006 103,096 103,096Trade and other receivables 0 139,820 0 30,006 169,826 169,826Real estate fund shares 3,811 0 0 0 3,811 3,811Derivatives 86 0 0 0 86 86Miscellaneous other financial in-struments 6,552 0 0 0 6,552 6,552Other financial assets 10,449 0 0 0 10,449 10,449Cash and cash equivalents 0 0 341,161 0 341,161 341,161Total assets 10,449 139,820 341,161 30,006 521,436 521,436
Equity and liabilities FVPL Carrying amount Fair value
All amounts in TEUR mandatory AC Non-FI 31 12 2019 31 12 2019 Liabilities from convertible bonds 0 285,807 0 285,807 294,241Bonds 0 506,161 0 506,161 528,445Amounts due to financial institutions 0 2,008,731 0 2,008,731 2,016,686Other financial liabilities 0 65,489 0 65,489 65,489 Financial liabilities 0 2,580,381 0 2,580,381 2,610,620 Trade payables 0 85,280 0 85,280 85,280Derivatives 18,007 0 0 18,007 18,007Miscellaneous other liabilities 0 58,976 35,404 94,380 94,380Trade and other payables 18,007 144,256 35,404 197,667 197,667Total equity and liabilities 18,007 3,010,444 35,404 3,063,855 3,102,528 FVPL: financial assets/liabilities at fair value through profit or loss AC: financial assets/liabilities measured at amortised cost Non-FI: non-financial assets/liabilities

188 IMMOFINANZ AGAnnual Report 2019
Assets FVPL Carrying amount
Fair value
All amounts in TEUR mandatory ACCash and cash
equivalents Non-FI 31 12 2018 31 12 2018 Trade accounts receivable 0 56,532 0 0 56,532 56,532Financing receivables 0 48,578 0 0 48,578 48,578Loans and other receivables 0 162,693 0 37,825 200,518 200,518Trade and other receivables 0 267,803 0 37,825 305,628 305,628Real estate fund shares 5,025 0 0 0 5,025 5,025Derivatives 499 0 0 0 499 499Miscellaneous other financial instruments 6,445 0 0 0 6,445 6,445Other financial assets 11,969 0 0 0 11,969 11,969Cash and cash equivalents 0 0 631,754 0 631,754 631,754Total assets 11,969 267,803 631,754 37,825 949,351 949,351
Equity and liabilities FVPL Carrying amount
Fair value
All amounts in TEUR mandatory AC Non-FI 31 12 2018 31 12 2018 Liabilities from convertible bonds 0 284,638 0 284,638 297,751Amounts due to financial institutions 0 2,140,731 0 2,140,731 2,143,117Other financial liabilities 0 153 0 153 153Financial liabilities 0 2,140,884 0 2,140,884 2,143,270Trade payables 0 101,928 0 101,928 101,928Derivatives 13,015 0 0 13,015 13,015Miscellaneous other liabilities 0 51,588 32,494 84,082 84,082Trade and other payables 13,015 153,516 32,494 199,025 199,025Total equity and liabilities 13,015 2,579,038 32,494 2,624,547 2,640,046 FVPL: financial assets/liabilities at fair value through profit or loss AC: financial assets/liabilities measured at amortised cost Non-FI: non-financial assets/liabilities
The fair values shown in the above table were derived from stock exchange prices or determined by applying recognised valuation methods, depending on the class (see section 7.1.3).
Trade account receivables are generally considered to be current or are carried net of any necessary valuation adjustments and, for this reason, fair value generally reflects the carrying amount. The same applies to cash and cash equivalents.
The fair value of financial receivables, loans and other receivables as well as the fair value of the miscellaneous other financial instruments also generally approximates the carrying amount because impairment losses have already been deducted.
The fair value shown in the above table for liabilities from convertible bonds and amounts due to financial institutions was calculated as the present value of future interest and principal payments. The discount rate includes a margin for IMMOFINANZ’s own credit risk (debt value adjustment), and the valuation method used to determine fair value therefore represents Level 3 in the fair value hierarchy under IFRS 13. Information on the method used to determine the debt value adjustment is provided in section7.1.3. The discount rates used to calculate the present value of the amounts due to financial institutions were based on the listing shown below, which reflects the market interest rates as of 31 December 2019 and the weighted average credit spreads for the loans in the continuing operations as of the balance sheet date.

CONSOLIDATED FINANCIAL STATEMENTSOther Disclosures
189
CO
NS
OL
IDA
TE
D F
INA
NC
IAL
STA
TE
ME
NT
S
2019Discount rates as of EUR 1 1 2020 -0.366%1 1 2021 -0.278%1 1 2022 -0.313%1 1 2023 -0.251%1 1 2024 -0.187%1 1 2025 -0.120%1 1 2026 -0.054%1 1 2027 0.014%1 1 2028 0.083%1 1 2029 0.128%1 1 2030 0.210%1 1 2031 0.270%1 1 2032 0.422%1 1 2035 0.562% The fair value of the bond is based on the market price, while the fair value of the miscellaneous other liabilities approximates the carrying amount.
The following table shows the carrying amounts of the held-for-sale financial instruments classified by the IFRS 9 valuation categories. These financial instruments represent receivables and liabilities carried at amor-tised cost, derivative financial liabilities carried at fair value and cash and cash equivalents.
31 12 2019 31 12 2018
All amounts in TEUR Carrying amount
Carrying amount
Financial assets
At amortised cost 624 202Financial liabilities
At amortised cost 47,034 366At fair value through profit or loss 390 0
Cash and cash equivalents 3,980 252
7.1.2 Net gains and losses The net gains and losses which must be presented in accordance with IFRS 7 for each category of financial instrument defined in IFRS 9 comprise the following:
31 12 2019
All amounts in TEUR Measurement
at fair valueOther gains/
losses Net gain/loss FA-FVPL -1,059 568 -491
thereof mandatory -1,059 568 -491FL-FVPL -7,873 -1 -7,874
thereof mandatory -7,873 -1 -7,874FL-AC 0 -323 -323

190 IMMOFINANZ AGAnnual Report 2019
31 12 2018
All amounts in TEUR Measurement
at fair value
Income from disposals/
repurchaseOther
gains/losses Net gain/loss FA-FVPL 753 0 497 1,250
thereof mandatory 753 0 497 1,250FA-AC 0 0 8 8FL-FVPL -4,598 0 -44 -4,642
thereof mandatory -4,598 0 -44 -4,642FL-AC 0 -19 107 88 FA-FVPL/FL-FVPL: financial assets/liabilities at fair value through profit or loss FA-AC/FL-AC: financial assets/liabilities measured at amortised cost
Information on financing costs and financing income is provided in section 5.9.
7.1.3 Hierarchy of financial instruments carried at fair value The following section includes an analysis of the financial instruments carried at fair value. A three-level clas-sification was developed for this analysis in accordance with the measurement hierarchy defined in IFRS 13:
– Level 1: quoted prices for identical assets or liabilities on an active market (without any adjustments) – Level 2: inputs that can be derived directly (e.g. as prices) or indirectly (e.g. based on prices) for the individual
assets or liabilities and cannot be classified under Level 1 – Level 3: inputs for assets or liabilities that are not based on observable market data
31 12 2019All amounts in TEUR Level 1 Level 2 Level 3 Total Financial assets at fair value through profit or loss
Real estate fund shares - - 3,811 3,811Derivatives - - 86 86Miscellaneous other financial instruments 6,552 - - 6,552
Financial liabilities at fair value through profit or loss Derivatives - - 18,007 18,007
31 12 2018All amounts in TEUR Level 1 Level 2 Level 3 Total Financial assets at fair value through profit or loss
Real estate fund shares - - 5,025 5,025Derivatives - - 499 499Miscellaneous other financial instruments 6,445 - - 6,445
Financial liabilities at fair value through profit or loss Derivatives - - 13,015 13,015

CONSOLIDATED FINANCIAL STATEMENTSOther Disclosures
191
CO
NS
OL
IDA
TE
D F
INA
NC
IAL
STA
TE
ME
NT
S
The following table reconciles the beginning and ending balances of the financial instruments classified under Level 3:
Real estate fund shares Derivatives Total
All amounts in TEUR 2019 2018 2019 2018 2019 2018 Beginning balance 5,025 4,934 -12,516 -8,723 -7,491 -3,789Recognised in the consolidated income statement -1,040 2,105 -7,999 -6,226 -9,039 -4,121Additions 0 0 -4,192 0 -4,192 0Disposals -174 -2,014 6,396 2,433 6,222 419Reclassification from/to assets held for sale 0 0 390 0 390 0Ending balance 3,811 5,025 -17,921 -12,516 -14,110 -7,491
Of the EUR -9.0 million (2018: EUR -4.1 million) results recognised in profit or loss and reported in the above table, EUR -5.0 million (31 December 2018: EUR -5.4 million) are attributable to financial instruments that were held at the end of the 2019 financial year. The respective amounts are included under other financial results.
The valuation procedures and valuation-relevant input factors used to determine the fair value of financial instruments (for both continuing and discontinued operations) are as follows:
Level Financial instruments Valuation method Major input factors Major non-observable input factors
3 Real estate fund shares Net present value methods Discount rate, expected principal repayments and dividends Discount rate: 8.50%
3 Derivatives (interest rate swaps) Net present value methods
Interest rate curves observable on the market, probability of default, loss given default, exposure at default Credit margin: 1.00% to 2.50%
IMMOFINANZ calculates the fair value of derivatives by discounting the future cash flows based on a net pre-sent value method. The interest rates used to discount the future cash flows are based on an interest curve that is observable on the market. The following three parameters are required to calculate the credit value adjustment (CVA) and the debt value adjustment (DVA): the probability of default (PD), the loss given default (LGD) and the exposure at default (EAD). The probability of default is derived from the credit default swap (CDS) spreads of the respective counterparty. Derivatives with a positive fair value represent receivables for IMMOFINANZ; in these cases, a CVA calculation is used to calculate the amount of the receivable. One param-eter for this calculation is the probability of default for the counterparties. IMMOFINANZ concludes contracts with over ten financial institutions, and observable CDS spreads are available on the market for many of them. In exceptional cases, average branch benchmarks are used as a substitute for unavailable spreads. These benchmarks represent Level 1 and 2 input factors on the fair value measurement hierarchy. Derivatives with a negative fair value represent liabilities for IMMOFINANZ; in these cases, a DVA calculation is used to calculate the amount of the liability and IMMOFINANZ’s own probability of default must be determined. IMMOFINANZ generally concludes derivatives at the level of the property company that manages a particular property. Nei-ther observable market CDS spreads, nor benchmarks are available for these property companies. Credit mar-gins are therefore used to estimate CDS spreads which, in turn, form the basis for deriving the probability of default. The credit margin for IMMOFINANZ is determined in a two-step procedure. The first step involves the calculation of an average margin based on signed credit agreements and term sheets, whereby the time hori-zon for the applied margins equals twelve months. The second step involves obtaining indicative credit margin offers from banks and averaging these values with the margins from the credit agreements and term sheets. These offers are grouped by country and asset class. The individual property companies that have concluded financial instruments are assigned to a group based on country and asset class. The plausibility of the calcu-lated credit margins is also verified by comparison with external market reports. This procedure results in mar-ket-conform credit margins that can be used as estimates for valuing the company’s own credit risk. These input factors represent Level 3 on the IFRS 13 measurement hierarchy. The loss given default (LGD) is the relative value that would be lost on default. IMMOFINANZ uses an ordinary market default rate to calculate

192 IMMOFINANZ AGAnnual Report 2019
the CVA and DVA. The exposure at default represents the expected amount of the asset or liability at the time of default. The calculation of the exposure at the time of default is based on a Monte Carlo simulation.
The liabilities carried at fair value through profit or loss include EUR 1.0 million (31 December 2018: EUR 0.3 million) attributable to default risk; the change in 2019 equalled EUR 0.7 million (2018: EUR 0.1 mil-lion).
For net present value methods, an increase in the discount rate, exit yield or counterparty CDS values leads to a reduction in fair value. In contrast, fair value is increased by a reduction in these input factors.
The valuation of default risk includes assumptions for the probability of default, loss rate and the outstanding amount at the time of expected default. An increase in the probability of default and the loss rate will reduce the fair value of a derivative with a positive outstanding amount (receivable) and reduce the liability for a de-rivative with a negative outstanding amount (liability). A decrease in the probability of default and the loss rate leads to the opposite effect.
7.1.4 Collateral IMMOFINANZ companies normally provide collateral for loans related to project financing. Financing is gener-ally concluded at the individual project level, and each company or property is responsible for the related debt service. There are no rights of regress involving IMMOFINANZ AG. As security for the loan, the lending bank receives a package of collateral that can be used to satisfy the receivable in the event a loan is called. This package can include the following types of collateral:
– Mortgage on the land or the land and the building – Pledge of shares in the project company – Pledge of receivables (from rental agreements, insurance contracts, property management contracts etc.) – Pledge of bank accounts (accounts for rental payments or other project-related accounts) – Promissory notes – Shares in subsidiaries
The conditions, type and scope of collateral are defined on an individual basis (for each company and property) and are dependent on the project volume and the amount and term of the loan.
Investment property with a carrying amount of EUR 3,604.3 million (31 December 2018: EUR 3,924.5 mil-lion) was pledged as collateral for long-term financing of EUR 1,964.6 million (31 December 2018: EUR 1,779.6 million).
Property under construction with a carrying amount of EUR 151.9 million (31 December 2018: EUR 418.3 million) also serves as collateral. The corresponding financial liabilities total EUR 56.7 million (31 December 2018: EUR 161.2 million).
For property financing concluded by IMMOFINANZ, shares in the respective subsidiary serve as additional col-lateral to the mortgages in 34 cases (31 December 2018: 47 cases). The limitations on disposal end when the financial liability is repaid or when other collateral is provided.

CONSOLIDATED FINANCIAL STATEMENTSOther Disclosures
193
CO
NS
OL
IDA
TE
D F
INA
NC
IAL
STA
TE
ME
NT
S
A property with a carrying amount of EUR 18.8 million serves as collateral for tax proceedings currently in progress.
In 2019 and in previous financial years, IMMOFINANZ accepted liabilities or guarantees on behalf of third par-ties with a maximum risk of EUR 232.0 million (31 December 2018: EUR 261.0 million). The probability of occurrence for these contingent liabilities is linked to the fulfilment or non-fulfilment of future conditions and was considered low as of the balance sheet date.
7.2 Financial risk management
7.2.1 General information IMMOFINANZ has integrated an active risk management system into its operating processes and reporting paths. This system supports the rapid implementation of measures to counter risk and also has a direct influ-ence on strategic decisions and operating processes. Internal guidelines, reporting systems and control measures have been installed throughout IMMOFINANZ to support the monitoring, evaluation and control of risks related to the operating business. Risk management is a staff function which reports directly to the Chief Financial Officer. It autonomously monitors the corporate risks, aggregates risk data and reports, and actively supports the department and country organisations in the identification of risks and economically suitable countermeasures. At the department and country organisation levels, the heads of the respective department or country organisation are responsible for risk management. The department heads and country managers report their risk positions to the Executive Board at least once each quarter. Acute risks are reported immedi-ately to the Executive Board. IMMOFINANZ also works to continuously improve the internal control system (ICS) to support the early identification and monitoring of risks. A description of the ICS is provided in the management report.
As an international corporation, IMMOFINANZ is exposed to various financial risks. The most important finan-cial risks for the Group arise from possible changes in foreign exchange rates and interest rates and from the deterioration of the credit standing and solvency of its customers and business partners.
7.2.2 Default/credit risk Default or credit risks arise from the possibility that the counterparty to a transaction could fail to meet the related obligations and the Group incurs financial damages as a result. The maximum credit risk represents the amounts reported under assets on the balance sheet. Default risk is reflected in appropriate valuation adjust-ments.
The most important instrument for managing default risk is the continuous evaluation of the credit standing of contract partners. In various development projects, IMMOFINANZ works together with local project devel-opers. This cooperation can represent a risk for IMMOFINANZ if the business partners are unable to meet their contractual obligations in full or on time. Appropriate contractual provisions – e.g. penalties or damage pay-ments in cases where performance does not meet the contract terms – are used to address this risk. In addi-tion, activities and goal attainment are monitored regularly by the Group’s development department.
The risk of default on receivables due from tenants is low because tenants are regularly required to provide security deposits – cash deposits for residential properties, bank guarantees or cash deposits for commercial properties – and their credit standing is monitored on a regular basis. Individual valuation adjustments are generally recorded to receivables that are exposed to an increased risk of default.
The default risk associated with receivables due from banks is also considered to be low because all financing transactions are concluded with financial institutions that have excellent credit ratings. Counterparty and con-centration risks are limited by continuous monitoring, fixed investment limits and the diversification of financial institutions. Banks are aggregated into a banking group and evaluated according to a common default proba-bility. Receivables are combined and reviewed against appropriate limits.

194 IMMOFINANZ AGAnnual Report 2019
A default event is assumed to occur when the debtor is not expected to meet his or her credit obligations in full or when a financial asset is overdue more than 90 days and the possible utilisation of collateral (if available) does not appear sufficient to fully settle the liability.
A receivable is written off when it is overdue more than 365 days and collection measures have ceased or when the receivable is considered uncollectible in full even if it is not overdue more than one year.
IMMOFINANZ assigns financial receivables to the following classes of financial instruments:
– Trade accounts receivable – Financing receivables – Loans and other receivables
The next two tables present the following information in summarised form: the gross amount for each cate-gory of receivables as of the balance sheet date, the recognised impairment losses and resulting net receiva-bles, a reconciliation of the beginning balance to the ending balance of the valuation allowances and explana-tory comments on the creation of the valuation allowances for each of the three receivables classes.
2019 2018
All amounts in TEUR Gross receivable Impairment Net receivable Gross receivable Impairment Net receivable Trade accounts receivable 60,138 -3,911 56,227 68,687 -12,155 56,532Financing receivables 19,841 -9,338 10,503 72,660 -24,082 48,578Loans and other receivables 78,175 -5,085 73,090 168,183 -5,490 162,693Total 158,154 -18,334 139,820 309,530 -41,727 267,803
Valuation allowances for trade accounts receivable All amounts in TEUR 2019 2018 Beginning balance before the application of IFRS 9 - -13,073Effects of the initial application of IFRS 9 - 0Beginning balance -12,155 -13,073Deconsolidations (see 2.3) 27 50Currency translation adjustments 150 64Write-offs 9,438 1,971Revaluation -2,173 -1,089Reclassifications and other developments 802 -78Ending balance -3,911 -12,155 The trade accounts receivable held by IMMOFINANZ comprise rents receivable, operating costs receivable and receivables from the sale of real estate inventories. The calculation of impairment for all these receivables is based on the simplified approach defined by IFRS 9.5.5.15, which requires the recognition of a loss allowance equal to the lifetime expected credit losses as of the initial recognition date as well as in subsequent periods. The application of the simplified approach to rents receivable, which represent lease receivables, is based on the option provided by this standard. The remaining trade receivables fall within the scope of application of IFRS 15 and do not include any material financing components. The application of the simplified approach is therefore mandatory.

CONSOLIDATED FINANCIAL STATEMENTSOther Disclosures
195
CO
NS
OL
IDA
TE
D F
INA
NC
IAL
STA
TE
ME
NT
S
The rents receivable and operating costs receivable held by IMMOFINANZ are principally covered by collateral in the form of three-months’ rent (for the most part, deposits) and bank guarantees. In view of this collateral and for materiality reasons, IMMOFINANZ generally does not recognise impairment losses on receivables in the overdue classes up to 90 days. An impairment loss is only recognised when a tenant’s rent is overdue more than 90 days or, at an earlier point in time, when a default event is assumed to occur. Impairment losses are based on historical experience in accordance with the number of days overdue. The calculation of impairment losses also includes more specific information on expected return flows or forward-looking assumptions, if this information is available and if it is assumed that these factors will influence the amount of the impairment loss. Based on the available collateral, no impairment losses were recognised for the outstanding receivables from the sale of real estate inventories, which are included under trade receivables at an amount of EUR 9.8 million (31 December 2018: EUR 12.5 million).
The following table shows the gross receivables and impairment losses recognised for rents and operating costs receivable based on the time overdue as of 31 December2019:
All amounts in TEUR Gross receivable Impairment Impairment in % Not due 37,735 -31 0.08%1-30 days overdue 6,709 -365 5.44%31-60 days overdue 915 -95 10.36%61-90 days overdue 829 -194 23.42%91-180 days overdue 981 -285 29.01%181-365 days overdue 1,015 -816 80.40%More than 365 days overdue 2,174 -2,126 97.79%Ending balance 50,358 -3,911
Valuation allowances for financing receivables All amounts in TEUR 2019 2018 Beginning balance before the application of IFRS 9 - -68,246Effects of the initial application of IFRS 9 - 0Beginning balance -24,082 -68,246Deconsolidations (see 2.3) 1,579 0Write-offs 5,871 40,389Revaluation -519 1,283Reclassifications and other developments 7,813 2,492Ending balance -9,338 -24,082 Financing receivables consist of receivables due from associates, receivables due from joint ventures and other financing receivables. The receivables due from equity-accounted associates and joint ventures represent an increase in the net investment in the respective associate or joint venture for IMMOFINANZ because of their economic content. The determination of an impairment loss to these types of receivables is based primarily on the rules defined by IFRS 9 before the loss allocation and impairment rules in IAS 28 are applied. The receivables due from associates and joint ventures declined substantially year-on-year due to the sale or acquisition (and the resulting conversion from equity consolidation to full consolidation) of shares in these companies and now only represent an immaterial component of the financing receivables (see section 4.5). The change in the impairment accounts resulting from the changes in the related investments represent the major component of the reconciliation line “reclassifications and other developments”. This position also in-cludes any allocated losses from the at-equity valuation. The other financing receivables consist primarily of financing for property companies which is collateralised by the property and the related return flows. Conse-quently, impairment losses were generally not required for these items. The valuation allowances shown in the following table were measured on the basis of the expected lifetime credit losses because a default event was assumed.

196 IMMOFINANZ AGAnnual Report 2019
Valuation allowances for loans and other receivables
2019 2018
All amounts in TEUR
Expected 12-month credit loss
Lifetime expected credit
loss - impaired credit standing Total
Expected 12-month credit loss
Lifetime expected credit
loss - impaired credit standing Total
Beginning balance before the application of IFRS 9 - - - 0 - -5,213Effects of the initial application of IFRS 9 - - - -60 - -60Beginning balance -69 -5,421 -5,490 -60 -5,213 -5,273Deconsolidations (see 2.3) 0 0 0 0 62 62Currency translation adjustments 0 12 12 0 22 22Write-offs 0 485 485 0 2,035 2,035Revaluation 28 -164 -136 -9 -2,092 -2,101Reclassifications and other developments 0 44 44 0 -235 -235Ending balance -41 -5,044 -5,085 -69 -5,421 -5,490
Restricted funds represent the largest component of the assets reported under other receivables. These de-posits with financial institutions have only a minimal risk of default, and it can therefore be assumed that the default risk has not increased significantly since initial recognition. The credit loss expected within the next twelve months was therefore determined in accordance with IFRS 9. For the remaining other receivables, an impairment loss was not required due to available collateral or an impairment loss was recognised because of an assumed default event at the amount of the expected loss over the lifetime of the financial instrument.
7.2.3 Liquidity risk Liquidity risks are minimised by the preparation of a medium-term forecast covering five years, an annual budget with monthly segmentation and monthly revolving liquidity reports that include variance analyses. Daily liquidity management ensures that all operating obligations can be met and funds can be optimally invested, and also gives the Group the necessary flexibility to realise short-term acquisition opportunities.
IMMOFINANZ also uses long-term financing in which the financial capability of the individual properties (inter-est coverage ratio, debt service coverage ratio) as well as their present value (loan-to-value ratio) is reflected in appropriate contract clauses.
In order to prevent cost overruns and the resulting excess outflow of liquidity, IMMOFINANZ routinely monitors budgets and the progress of construction on all development projects and maintenance work.
The following table shows the term structure of derivative and non-derivative financial liabilities based on the contractually defined outflow of funds from continuing operations. In particular, the reported amounts include current and bullet repayments for financial liabilities, interest payments and net payments from derivatives.

CONSOLIDATED FINANCIAL STATEMENTSOther Disclosures
197
CO
NS
OL
IDA
TE
D F
INA
NC
IAL
STA
TE
ME
NT
S
All amounts in TEUR Cash outflows
under 1 year
Cash outflows between
1 and 5 yearsCash outflows
over 5 years Total
Carrying amount as of
31 12 2019 Liabilities from convertible bonds 4,458 303,887 0 308,345 285,807Liabilities arising from the issue of bonds 13,089 539,411 0 552,500 506,161Amounts due to financial institutions 289,764 1,234,603 610,514 2,134,881 2,008,731Miscellaneous 116,874 42,106 240,708 399,688 209,745Total non-derivative financial liabilities 424,185 2,120,007 851,222 3,395,414 3,010,444Derivative financial instruments (liabilities) 8,855 16,503 1,688 27,046 18,007Total derivative financial liabilities 8,855 16,503 1,688 27,046 18,007Total 433,040 2,136,510 852,910 3,422,460 3,028,451
All amounts in TEUR Cash outflows
under 1 year
Cash outflows between
1 and 5 yearsCash outflows
over 5 years Total
Carrying amount as of
31 12 2018 Liabilities from convertible bonds 5,944 312,060 0 318,004 284,638Amounts due to financial institutions 373,913 1,774,449 123,783 2,272,145 2,140,731Miscellaneous 124,799 17,693 9,860 152,352 153,669Total non-derivative financial liabilities 504,656 2,104,202 133,643 2,742,501 2,579,038Derivative financial instruments (liabilities) 6,718 10,819 20 17,557 13,015Total derivative financial liabilities 6,718 10,819 20 17,557 13,015Total 511,374 2,115,021 133,663 2,760,058 2,592,053 Miscellaneous non-derivative financial liabilities include, among others, liabilities from leases, trade accounts payable and liabilities from deposits received.
The amounts due to financial institutions are broadly diversified by region and counterparty, and the exposure to a change in the risk policy of an individual financial institution is therefore considered low.
7.2.4 Foreign exchange risk IMMOFINANZ is exposed to various forms of foreign exchange risk in connection with its accounting data and cash flows. Fluctuations in foreign exchange rates can influence the Group’s earnings position and also have an impact on the Group’s asset position.
Effect on the asset and earnings position The individual Group companies record transactions in a currency that differs from their functional currency at the mean exchange rate on the date of the respective transaction. Foreign currency monetary assets and liabilities are translated at the mean exchange rate in effect on the balance sheet date. The resulting foreign exchange gains and losses are recognised in profit or loss for the financial year.
As of 31 December 2019, all liabilities to financial institutions were denominated in euros.
The risk of devaluation associated with foreign currency bank deposits and cash balances is offset by the ear-liest possible conversion of these funds into the euro.
Derivative financial instruments are used in some cases to manage the low structural foreign exchange risk. The derivative financial instruments used by IMMOFINANZ to hedge this risk are recorded as stand-alone de-rivatives and not as hedging instruments. Hedge accounting as defined in IFRS 9 is not applied by IMMOFINANZ’s fully consolidated companies. Therefore, the stand-alone derivatives are measured through profit or loss.

198 IMMOFINANZ AGAnnual Report 2019
As of 31 December 2019, IMMOFINANZ held no derivatives to hedge foreign exchange risk.
Cash and cash equivalents are held in the following currencies:
All amounts in TEUR 31 12 2019 31 12 2018 EUR 230,791 531,899USD 6,392 6,708HUF 25,390 30,833PLN 32,267 19,156CZK 8,179 2,275RON 26,779 33,432RUB 4,369 1,861Other 6,994 5,590Total 341,161 631,754
7.2.5 Interest rate risk As an international company, IMMOFINANZ is exposed to the risk of interest rate fluctuations on real estate submarkets. Increases in interest rates can have a negative impact on Group earnings by increasing the cost of floating rate financing.
A change in interest rates will have a direct influence on financial results through its impact on floating rate financing. IMMOFINANZ limits the risk associated with rising interest rates – which would lead to higher inter-est expense and a decline in financial results – through the use of fixed interest rate financing contracts and derivative financial instruments (above all swaps). These derivative financial instruments are accounted for as stand-alone derivatives and not as hedging instruments in the sense of IFRS 9.
The classification of financial liabilities (carrying amounts, including convertible bonds) by type of interest rate is shown in the following table:
All amounts in TEUR 31 12 2019 31 12 2018 Fixed interest financial liabilities 946,105 436,404Floating rate financial liabilities 1,920,083 1,989,118Total interest-bearing financial liabilities 2,866,188 2,425,522
Of the floating rate financial liabilities, a nominal value of EUR 1,666.6 million (31 December 2018: EUR 1,354.3 million) is hedged through interest rate swaps. This results in a fixed interest rate based on the combined interest effect of the financial liability and the derivative.

CONSOLIDATED FINANCIAL STATEMENTSOther Disclosures
199
CO
NS
OL
IDA
TE
D F
INA
NC
IAL
STA
TE
ME
NT
S
The following table shows the fair values and conditions of all derivative financial instruments that were pur-chased and held by IMMOFINANZ as of 31 December 2019 to hedge interest rate risk:
TypeReference value as of
31 12 2019 in TEURFair value incl.
interest in TEUR 1 Maturity Interest rate up to 0.00% Interest rate swap 152,255 -549 2020 Interest rate swap 93,588 -421 2021 Interest rate swap 172,606 50 2026Number of derivatives: 10 418,449 -920 Interest rate over 0.00% to 0.25% Interest rate swap 14,890 -59 2020 Interest rate swap 334,358 -4,613 2022 Interest rate swap 191,413 -2,431 2023 Interest rate swap 226,550 -2,185 2025Number of derivatives: 33 767,211 -9,288 Interest rate over 0.25% to 0.50% Interest rate swap 131,033 -3,215 2022 Interest rate swap 229,857 -4,793 2023 Interest rate swap 120,000 -31 2034Number of derivatives: 29 480,890 -8,039 Total number of derivatives: 72 2 1,666,550 -18,247 1 Fair value includes a credit risk adjustment
2 As of the balance sheet date, 69 derivatives with a total negative value of EUR -18.3 million and 3 derivatives with a positive market value of EUR 0.1 million
The reference value forms the basis value for derivatives outstanding as of the balance sheet date. The fair value represents the amount that the respective company would receive or be required to pay if the transac-tion were terminated as of the balance sheet date.
A change in the market interest rate will influence the valuation of interest rate derivatives. Net present value calculations based on the DCF method – which is also used to value derivatives – discount future cash flows with current interest rate curves to determine market value. Rising interest rates lead to a higher discount factor and to a reduction in the present value of the derivative. Sensitivity analyses are used to illustrate the risk associated with interest rate fluctuations. They show the effects of changes in market interest rates on market values and interest payments as well as interest income and expense.
The following sensitivity analysis shows the effect of a change in the interest rate level on the fair value of interest rate derivatives (interest rate swaps). An increase of 10 and 25 basis points is assumed; the effects of falling interest rates were not analysed due to the current very low interest rate level. The following fair values include accrued interest but exclude credit risk adjustments.
Sensitivity of derivatives Interest rateAll amounts in TEUR 31 12 2019 ∆ +10 basis points ∆ +25 basis points Fair value based on increase in interest rate -19,180 -12,782 -3,277
Sensitivity of derivatives Interest rateAll amounts in TEUR 31 12 2018 ∆ +10 basis points ∆ +25 basis points Fair value based on increase in interest rate -13,915 -10,429 -3,538 A further sensitivity analysis shows the influence of floating interest rates on the interest expense associated with financial liabilities. It presents the effect of an assumed average increase of 50 and 100 basis points in interest rates on earnings before tax in 2019. The analysis assumes that all other variables remain constant. Due to the very low level of interest rates as of 31 December 2019 (e.g. 3-month EURIBOR: -0.383%), a sensitivity analysis was not prepared for falling interest rates during the 2019 financial year or the previous financial year.

200 IMMOFINANZ AGAnnual Report 2019
Sensitivity of interest expense Interest rateAll amounts in TEUR 2019 ∆ +50 basis points ∆ +100 basis points Interest expense 64,558 65,664 66,994
Sensitivity of interest expense Interest rate
All amounts in TEUR 2018 ∆ +50 basis points ∆ +100 basis points Interest expense 68,374 71,481 74,690 Since most of IMMOFINANZ’s floating rate financial liabilities are hedged through interest rate swaps, the risk of an increase in interest expense as the result of changes in interest rates is considered low.
Details on the conditions of financial liabilities are provided in section 4.14.
In addition to financial liabilities, securities and other receivables – above all financing receivables (loans granted to third parties) – can be sensitive to interest rate changes. The current financing receivables generally carry fixed interest rates, and the Group is therefore exposed to no risk or only limited risk of a changing interest rate from these items.
7.2.6 Capital management The goals of IMMOFINANZ’s management are to protect the Group’s short-, medium- and long-term liquidity at all times and to create and maintain a strong capital base in order to earn the trust of investors, creditors and the markets and safeguard the Group’s sustainable positive development. The Executive Board regularly monitors the development of the share price, the discount of the share price to the net asset value (NAV) and the amount of dividends paid to the shareholders of IMMOFINANZ AG. The IMMOFINANZ share is positioned as a dividend stock, and the Executive and Supervisory Boards are committed to achieving and maintaining a sustainable dividend policy.
IMMOFINANZ AG repurchased 8.66% of its share capital in 2019, whereby these buybacks were dependent on the market price and on available liquidity (see section 4.12)
The Group’s capital structure is determined by financial liabilities, including convertible bonds, and by equity, excluding treasury shares. IMMOFINANZ intends to further optimise its capital structure by arranging for new financing, by terminating, extending or restructuring old financing and, where appropriate, issuing new debt securities (see section 7.6). The average financing costs for the Group, including derivatives, used for interest rate hedging, equalled 1.9% in 2019 (2018: 2.1%).
The Executive Board monitors the Group’s capital structure by means of the LTV ratio. This indicator shows the relation between financial liabilities less liquid funds and the value of the real estate portfolio plus proper-ties held for sale and the investment in S IMMO AG at the EPRA NAV on the balance sheet date. The LTV ratio equalled 43.0% as of 31 December 2019 (31 December 2018: 37.6%), whereby the target ranges up to 45%.

CONSOLIDATED FINANCIAL STATEMENTSOther Disclosures
201
CO
NS
OL
IDA
TE
D F
INA
NC
IAL
STA
TE
ME
NT
S
7.3 Financial obligations
7.3.1 Contingent liabilities and guarantees Contingent liabilities represent possible or existing obligations arising from past events, in cases where it is not probable that an outflow of resources will be required to settle the obligation (also see section 7.1).
The contingent liabilities arising from sureties, guarantees and other liabilities that are not recognised on IMMOFINANZ‘s balance sheet are evaluated regularly with respect to the probability of their occurrence. If an outflow of resources embodying economic benefits is neither sufficiently probable to require the recognition of a provision nor improbable, the obligations are recognised as contingent liabilities. The estimates are made by IMMOFINANZ specialists based on market-related inputs (where possible) and expert opinions (in individual cases).
Settlements were reached in all lawsuits against former board members during the 2018 financial year.
A preliminary injunction over the shares in a Romanian subsidiary (carrying amount of net assets: EUR 84.7 mil-lion), which limits the power to dispose over these shares, was in effect as of 31 December 2019. In addition, legal uncertainty could arise in connection with land ownership in specific East European countries (e.g. Romania).
7.3.2 Other financial obligations The following table shows the financial obligations arising from previously contracted construction services, maintenance and other contractual obligations for the construction or acquisition of properties:
All amounts in TEUR 2019 2018 Outstanding construction costs 79,548 85,178Contracted maintenance 1,587 3,536Contractual obligations for the construction or acquisition of properties 0 12,468Total 81,135 101,182
7.4 Transactions with related parties Related parties in the sense of IAS 24 include all subsidiaries, joint ventures and associates of IMMOFINANZ AG (see section 8). In addition to persons who have a significant influence over IMMOFINANZ, related parties include the members of the Executive Board and Supervisory Board of IMMOFINANZ AG as well as their close family members.
Any transactions carried out with related parties during the financial year 2019 reflected arm’s length condi-tions.
As part of the remuneration for the members of the Executive Board, IMMOFINANZ AG makes payments to APK Pensionskasse AG. These payments are related to company pensions for the Executive Board members and reflect standard market conditions. Christian Böhm, a member of the Supervisory Board, is the chairman of the executive board of this company. The contributions made in 2019 are reported in section 7.4.2.
Transactions between fully consolidated subsidiaries are eliminated during the consolidation and are therefore not explained in detail.

202 IMMOFINANZ AGAnnual Report 2019
7.4.1 Joint ventures and associates All amounts in TEUR 31 12 2019 31 12 2018 Relations with joint ventures Receivables 1,758 29,604
Thereof bad debt allowance -5,503 -7,175Liabilities 325 333Relations with associated companies Receivables 0 4,550
Thereof bad debt allowance 0 -7,343Liabilities 191 261 All amounts in TEUR 2019 2018 Relations with joint ventures Other income 1 30Interest income 260 4,596Write-downs to receivables 1,672 3,663
Thereof results that increase or reduce the net investment -244 2,127Income taxes 0 -53Relations with associated companies Other income 746 731Other expenses -2,815 -3,233Interest income 358 724Write-downs to receivables 7,343 -722
Thereof results that increase or reduce the net investment 0 -723Income taxes 0 1 Transactions with joint ventures and associates are carried out at standard market prices and conditions. The financing for joint ventures is frequently arranged by IMMOFINANZ and its co-investors at a ratio that differs from the respective interest in capital.
There were no further reportable transactions with closely related parties of IMMOFINANZ during the 2019 financial year.
7.4.2 Members of management in key positions The members of management in key positions as defined in IAS 24 are active solely in the corporate bodies of IMMOFINANZ AG and include the following persons:
Executive Board Oliver Schumy – Chief Executive Officer (up to 18 March 2020) Dietmar Reindl – Member of the Executive Board, Property Management Stefan Schönauer – Member of the Executive Board, Finances Oliver Schumy resigned from the Executive Board of IMMOFINANZ AG as of 18 March 2020, i.e. after the end of the 2019 financial year, by mutual agreement. The preliminary termination of his contract was based on mutual agreement for personal reasons and took effect immediately. His responsibilities were taken over as of 19 March 2020 by Stefan Schönauer (legal, investor relations, compliance & corporate legal) and Dietmar Reindl (human resources, public relations and transactions).
Supervisory Board Michael Knap – Chairman Bettina Breiteneder – Vice-Chairwoman (Member since 22 May 2019, Vice-Chairwoman since 4 March 2020) Rudolf Fries – Vice-Chairman (up to 4 March 2020) Christian Böhm – Member Nick J. M. van Ommen, FRICS – Member Sven Bienert – Member (since 22 May 2019) Horst Populorum – Member (up to 22 May 2019) Wolfgang Schischek – Member (up to 22 May 2019)

CONSOLIDATED FINANCIAL STATEMENTSOther Disclosures
203
CO
NS
OL
IDA
TE
D F
INA
NC
IAL
STA
TE
ME
NT
S
Members delegated to the Supervisory Board by the Works Council The following persons were delegated by the Works Council of IMMOFINANZ AG to the Supervisory Board: Philipp Amadeus Obermair Werner Ertelthalner (up to 26 March 2019) Maria Onitcanscaia (since 26 March 2019) Larissa Kravitz (formerly Lielacher – up to 15 July 2019) Ankica Reichenbach (from 8 August 2019 to 31 December 2019)
The members of management in key positions received the following remuneration:
2019 2018
All amounts in TEUR Supervisory
Board Executive
Board TotalSupervisory
BoardExecutive
Board Total Short-term employee benefits 252 3,419 3,671 261 3,057 3,318Special bonus - - - - 4,000 4,000Post-employment benefits - 222 222 - 267 267Total 252 3,641 3,893 261 7,324 7,585
The short-term employee benefits for the members of the Executive Board comprise a fixed component (gross salary and compensation in kind) as well as a variable component (bonuses). In addition to the fixed and variable remuneration, the Supervisory Board awarded a special bonus for exceptional achievements to the Executive Board members in 2018. It covered the successful restructuring of the corporation during the pe-riod from 2015 to 2017, which culminated, among others, in the sale of the retail portfolio in Russia.
The amounts reported under post-employment benefits represent the contributions by IMMOFINANZ to a pension fund. These contributions result from defined benefit pension commitments to the members of the Executive Board, which were outsourced to a pension fund.
The Supervisory Board remuneration reported under short-term benefits reflects the expenses for the re-spective financial year. However, this remuneration is only paid out after the approval of the annual general meeting which decides on the release from liability of the Supervisory Board members.
The members of the Executive Board and Supervisory Board held a total of 6,449,348 shares as of 31 De-cember 2019 (31 December 2018: 7,066,330 shares). The number of shares includes the holdings of the FRIES Foundation (via IFF Beteiligungs GmbH) and Rudolf Fries, for which directors‘ dealings reports were filed. In contrast to previous reports, this number does not include additional shares held by companies at-tributable to and members of the Fries family which are not subject to legal reporting requirements. On 28 February 2020, IFF Beteiligungs GmbH and Rudolf Fries announced that they had sold 6,097,680, respectively 254,500 IMMOFINANZ shares.
No advances or loans were granted to the members of the Executive Board or Supervisory Board. Moreover there is no share-based payment for the Executive board.
7.5 Auditor’s fees The fees charged by Deloitte Österreich for services provided in 2019 comprise TEUR 468.4 (2018: TEUR 417.0) for the audit of the individual and consolidated financial statements, TEUR 230.5 (2018: TEUR 376.0) for other assurance services, TEUR 43.1 (2018: TEUR 23.7) for tax advising and TEUR 41.4 (2018: TEUR 14.5) for other services.

204 IMMOFINANZ AGAnnual Report 2019
7.6 Subsequent events On 28 February 2020, CARPINUS Holding GmbH (now RPPK Immo GmbH) purchased 12,000,000 shares of IMMOFINANZ AG, which represent an investment of 10.71%. The indirect shareholders of CARPINUS Holding GmbH are Peter Korbacka and the RPR private foundation. IFF Beteiligungs GmbH (a wholly owned subsidiary of the FRIES family private foundation) announced the sale of 6,097,680 shares of IMMOFINANZ AG, which represented an investment of 5.44%. Rudolf Fries reported the sale of 254,500 shares. The sale price reported in the directors‘ dealings notifications equalled EUR 29.50 per share in each case.
IMMOFINANZ sold all shares in Equator Real Sp. z o.o. to Czech Property Investments on 5 March 2020. The agreed purchase price for these shares totalled EUR 15.2 million.
Land in Brasov was sold to Kaufland Romania SRL through an asset deal on 30 March 2020. The agreed purchase price totalled EUR 5.8 million.
Rudolf Fries, Vice-Chairman of the Supervisory Board of IMMOFINANZ AG, resigned from this corporate body on 4 March 2020. He was succeeded in this function by Bettina Breiteneder.
Oliver Schumy, CEO of IMMOFINANZ, resigned from the Executive Board on 18 March 2020. His resignation was made by mutual agreement for personal reasons. The Executive Board has had two members since 19 March 2020, Dietmar Reindl and Stefan Schönauer, who are responsible for all areas of the company.
IMMOFINANZ AG concluded a revolving credit line of EUR 100 million on 31 March 2020. It has a two-year term and was arranged with a consortium of Austrian banks. The credit line can be used in full or in segments.
The negative effects of the Covid-19 pandemic on IMMOFINANZ are related primarily to deferred and reduced rental income. For IMMOFINANZ, the government-ordered closing of businesses (with the exception of basic supplies) and special legal regulations have led to rent cutbacks, temporary declines in rental income and a reduction in turnover-based rents in the retail sector. Potential tenant bankruptcies in the retail business could result from the general economic slowdown and increase the risk involved in renting this vacant space. In the office sector, IMMOFINANZ also expects deferrals, lost rents and delays in both new and follow-up rentals. This applies, in particular, to the retail areas in office buildings (especially gastronomy). IMMOFINANZ’s project development activities have been affected by the limitations placed on construction which, in turn, are con-nected with a risk of project delays.
IMMOFINANZ is actively working to anticipate all these developments due to the Covid-19 pandemic and thereby minimise the impact on the company. Specific measures include extensive, solution-oriented cooper-ation with tenants to prevent bankruptcies and ensure the rapid resumption of economic activity.
A well-founded quantitative assessment of the effects of the Covid-19 pandemic on IMMOFINANZ was not possible when the consolidated financial statements for 2019 were prepared.
IMMOFINANZ and its subsidiaries are in discussions with all financing banks to protect the Group’s strong liquidity position and to react to the special situation caused by Covid-19. In order to be prepared for a poten-tial decline in rental income, agreements have been proactively reached with the financing banks to temporar-ily suspend interest and/or principal payments and/or to waive the review of covenants.

CONSOLIDATED FINANCIAL STATEMENTSGroup Companies
205
CO
NS
OL
IDA
TE
D F
INA
NC
IAL
STA
TE
ME
NT
S
8. Group Companies The following list covers the subsidiaries, joint ventures and associates of IMMOFINANZ AG. It was prepared in accordance with § 245a (1) of the Austrian Commercial Code in connection with § 265 (2) of the Austrian Commercial Code. This list also includes individual subsidiaries that were not fully consolidated for materiality reasons and joint ventures that were not included at equity as well as associates and other investments held by IMMOFINANZ with a share of ≥ 20.00%.
The companies deconsolidated during the 2019 financial year are reported in the column ‘type of consolida-tion’ as sold, liquidated, merged.
2019 2018
Company Country HeadquartersInterest
in capitalType of
consolidation Interest
in capital Type of
consolidation "Wienerberg City" Errichtungsges.m.b.H. AT Vienna 100.00% F 100.00% FAAX Immobilienholding GmbH AT Vienna 100.00% F 100.00% FABSTEM Holdings Ltd. CY Nicosia 100.00% F 100.00% FAdama Adviso SRL RO Bucharest 100.00% F 100.00% FAdama Holding Public Ltd CY Nicosia 100.00% F 100.00% FAdama Management SRL RO Bucharest 100.00% F 100.00% FAdama Romania Ltd. CY Nicosia 100.00% F 100.00% FAdama Ukraine Ltd CY Nicosia 0.00% Sold 98.71% FAEDIFICIO Liegenschaftsvermietungs- und Beteiligungsgesellschaft m.b.H. AT Vienna 100.00% F 100.00% FAirport Business Center, s.r.o. CZ Prague 100.00% F 100.00% FAl Sp. z o.o. PL Warsaw 100.00% F 100.00% FAloli Management Services Limited in Liqu. CY Nicosia 100.00% F 100.00% FAlpha Arcadia LLC UA Odessa 0.00% Sold 49.45% E-JVAlpha real d.o.o. SI Ljubljana 100.00% F 100.00% FAnadolu Gayrimenkul Yatirimciligi ve Ticaret A.S. TR Istanbul 64.89% F 64.89% FARMONIA CENTER ARAD S.R.L. RO Bucharest 100.00% F 100.00% FARO Immobilien GmbH AT Vienna 100.00% F 100.00% FAtom Centrum, s.r.o. CZ Prague 100.00% F 100.00% FAtrium Park Kft. HU Budapest 100.00% F 100.00% FAviso Zeta AG i.A. AT Vienna 0.00% Liquidated 100.00% FBanniz Ltd CY Nicosia 0.00% Sold 100.00% FBaron Development SRL RO Bucharest 100.00% F 100.00% FBauteil M Errichtungsges.m.b.H. AT Vienna 100.00% F 100.00% FBauteile A + B Errichtungsges.m.b.H. AT Vienna 100.00% F 100.00% FBauteile C + D Errichtungsges.m.b.H. AT Vienna 100.00% F 100.00% FBerceni Estate Srl RO Bucharest 100.00% F 100.00% FBerga Investment Limited in Liqu. CY Nicosia 100.00% F 100.00% FBermendoca Holdings Ltd CY Nicosia 0.00% Sold 100.00% FBertie Investments Sp. z o.o. PL Warsaw 100.00% F 100.00% FBivake Consultants Ltd. CY Nicosia 0.00% Sold 100.00% FBloczek Ltd CY Nicosia 100.00% F 100.00% FBoondock Holdings Ltd CY Nicosia 100.00% F 100.00% FBorca Retail Park d.o.o. Beograd RS Belgrade 100.00% F 100.00% FBucharest Corporate Center s.r.l. RO Bucharest 100.00% F 100.00% FBusiness Park Beteiligungs GmbH AT Vienna 100.00% F 100.00% FBusiness Park West-Sofia EAD BG Sofia 100.00% F 100.00% FC.E. Immobilienprojekte und Beteiligungs GmbH AT Vienna 100.00% F 100.00% FCampus Budapest Bt. HU Budapest 99.92% F 99.92% FCapri Trade s.r.l. RO Bucharest 100.00% F 100.00% FCarlyle Asia Real Estate Partners, L.P. US Washington 0.00% Liquidated 6.09% FondsCB Richard Ellis Strategic Partners IV, L.P. US Los Angeles 0.00% Liquidated 2.56% FondsCENTER INVEST Kft. HU Budapest 100.00% F 100.00% FCentral Business Center Kft. HU Budapest 100.00% F 100.00% FCHB Immobilienholding GmbH AT Vienna 100.00% F 100.00% FCity Tower Vienna Errichtungs- und Vermietungs-GmbH AT Vienna 100.00% F 100.00% F F = Full consolidation, E-JV = Joint venture, E-AS = Associates, NC = Not consolidated companies

206 IMMOFINANZ AGAnnual Report 2019
2019 2018
Company Country HeadquartersInterest
in capitalType of
consolidation Interest
in capitalType of
consolidation Constantia Treuhand und Vermögens- verwaltungs GmbH AT Vienna 100.00% F 100.00% FContips Limited CY Nicosia 100.00% F 100.00% FCora GS s.r.l. RO Bucharest 100.00% F 100.00% FCOREAL ESTATE RESIDENCE INVEST SRL RO Bucharest 100.00% F 100.00% FCPB Advisory GmbH in Liqu. AT Vienna 0.00% Liquidated 100.00% FCPB DELTA Anlagen Leasing GmbH in Liqu. AT Vienna 0.00% Liquidated 100.00% E-JVCPB Enterprise GmbH AT Vienna 100.00% F 100.00% FCPB JOTA Anlagen Leasing GmbH AT Vienna 100.00% F 100.00% FCPB Pegai Anlagen Leasing GmbH in Liqu. AT Vienna 0.00% Liquidated 100.00% FCredo Immobilien Development GmbH AT Vienna 100.00% F 100.00% FCREDO Real Estate GmbH AT Vienna 100.00% F 100.00% FDalerise Limited CY Nicosia 0.00% Sold 100.00% FDapply Trading Ltd. CY Nicosia 100.00% F 100.00% FDikare Holding Ltd. RO Bucharest 22.00% Fonds 22.00% FondsDionysos Immobilien GmbH in Liqu. AT Vienna 0.00% Liquidated 100.00% FDUS Plaza GmbH DE Cologne 100.00% F 100.00% FEbulliente Holdings Ltd CY Nicosia 100.00% F 100.00% FEHL Gewerbeimmobilien GmbH AT Vienna 49.00% E-AS 49.00% E-ASEHL Immobilien Bewertung GmbH AT Vienna 49.00% E-AS 49.00% E-ASEHL Immobilien GmbH AT Vienna 49.00% E-AS 49.00% E-ASEHL Immobilien Management GmbH AT Vienna 49.00% E-AS 49.00% E-ASEHL Investment Consulting GmbH AT Vienna 49.00% E-AS 49.00% E-ASEHL Wohnen GmbH AT Vienna 49.00% E-AS 49.00% E-ASElmore Investments Sp. z o.o. PL Warsaw 100.00% F 100.00% FEmolu Trading Ltd. CY Nicosia 100.00% F 99.00% FENIT Lublin Sp. z o.o. w likwidacji PL Warsaw 0.00% Liquidated 100.00% FEquator Real Sp. z o.o. PL Warsaw 100.00% F 100.00% FErlend Investments Sp. z o.o. PL Warsaw 100.00% F 100.00% FESCENDO Liegenschaftshandelsgesellschaft m.b.H. & Co KG AT Vienna 100.00% F 100.00% FEUREDES Immobilien GmbH AT Vienna 100.00% F 100.00% FEye Shop Targu Jiu s.r.l. RO Bucharest 100.00% F 100.00% FFawna Limited CY Nicosia 100.00% F 99.36% FFlureca Trading ltd CY Nicosia 100.00% F 100.00% FFMZ Baia Mare Imobiliara s.r.l. RO Bucharest 100.00% F 100.00% FFMZ Lublin Sp. z o.o. PL Warsaw 100.00% F 30.00% E-ASFMZ MB, investicijska družba d.o.o. SI Ljubljana 0.00% Merged 100.00% FFMZ Sosnowiec Sp. z o.o. PL Warsaw 0.00% Sold 45.00% E-ASGAL Development SRL RO Bucharest 100.00% F 100.00% FGaleria Zamek Sp. z o.o. PL Lublin 100.00% F 100.00% FGangaw Investments Limited in Liqu. CY Nicosia 100.00% F 100.00% FGeiselbergstraße 30-32 Immobilien- bewirtschaftungsgesellschaft m.b.H. AT Vienna 100.00% F 100.00% FGENA ELF Immobilienholding GmbH AT Vienna 100.00% F 100.00% FGENA NEUN Beteiligungsverwaltung GmbH AT Vienna 100.00% F 100.00% FGena Vier Immobilienholding GmbH AT Vienna 100.00% F 100.00% FGENA ZEHN Immobilienholding GmbH AT Vienna 100.00% F 100.00% FGendana Ventures Ltd. CY Nicosia 100.00% F 100.00% FGF Amco Development srl RO Ilfov 22.00% NC 22.00% NCGila Investment SRL RO Bucharest 100.00% F 100.00% FGlobal Emerging Property Fund L.P. GB Jersey 25.00% Fonds 25.00% FondsGlobal Trust s.r.l. RO Bucharest 100.00% F 100.00% FGlobe 3 Ingatlanfejlesztö Kft. HU Budapest 0.00% Merged 100.00% FGORDON INVEST Kft. HU Budapest 100.00% F 100.00% FGordon Invest Netherlands B.V. NL Amsterdam 0.00% Liquidated 100.00% FGrand Centar d.o.o. HR Zagreb 100.00% F 100.00% FHadas Management SRL RO Bucharest 75.00% E-JV 75.00% E-JVHamlingate Investments Limited CY Nicosia 100.00% NC 100.00% NCHarborside Imobiliara s.r.l. RO Bucharest 90.00% F 90.00% FHDC Investitii SRL RO Bucharest 100.00% F 100.00% FIE Equuleus NL B.V. NL Amsterdam 100.00% F 100.00% FI-E Immoeast Real Estate GmbH in Liqu. AT Vienna 0.00% Liquidated 100.00% FIE Narbal NL B.V. NL Amsterdam 100.00% F 100.00% F F = Full consolidation, E-JV = Joint venture, E-AS = Associates, NC = Not consolidated companies

CONSOLIDATED FINANCIAL STATEMENTSGroup Companies
207
CO
NS
OL
IDA
TE
D F
INA
NC
IAL
STA
TE
ME
NT
S
2019 2018
Company Country HeadquartersInterest
in capitalType of
consolidation Interest
in capital Type of
consolidation I-E-H Immoeast Holding GmbH AT Vienna 100.00% F 100.00% FIMAK CEE N.V. NL Amsterdam 100.00% F 100.00% FIMAK Finance B.V. NL Amsterdam 100.00% F 100.00% FIMBEA Immoeast Beteiligungsverwaltung GmbH AT Vienna 100.00% F 100.00% FIMF Campus GmbH DE Cologne 100.00% F 100.00% FIMF Float GmbH DE Cologne 100.00% F 100.00% FIMF Königskinder GmbH DE Cologne 0.00% Merged 100.00% FIMF PRIMA Liegenschafts- und Mobilienvermietungsgesellschaft m.b.H. AT Vienna 0.00% Merged 100.00% FIMMOBILIA Immobilienhandels GmbH & Co KG AT Vienna 100.00% F 100.00% FImmobilia L Liegenschafts Vermietungs GmbH AT Vienna 100.00% F 100.00% FImmobilia L Liegenschafts Vermietungs GmbH & Co Bischoffgasse 14/Rosasgasse 30 KG AT Vienna 100.00% NC 100.00% NCImmobilia L Liegenschafts Vermietungs GmbH & Co Viriotgasse 4 KG AT Vienna 100.00% NC 100.00% NCIMMOEAST Acquisition & Management GmbH AT Vienna 100.00% F 100.00% FIMMOEAST ALLEGRO Beteiligungs GmbH AT Vienna 100.00% F 100.00% FImmoeast Baneasa Airport Tower srl RO Bucharest 100.00% F 100.00% FIMMOEAST Beteiligungs GmbH AT Vienna 100.00% F 100.00% FIMMOEAST Bulgaria 1 EOOD BG Sofia 0.00% Liquidated 100.00% FIMMOEAST Despina I B.V. NL Amsterdam 100.00% F 100.00% FIMMOEAST Despina II B.V. NL Amsterdam 100.00% F 100.00% FIMMOEAST Immobilien GmbH AT Vienna 100.00% F 100.00% FIMMOEAST Iride IV Project s.r.l. RO Bucharest 100.00% F 100.00% FIMMOEAST Polonia Sp. z o.o. w likwidacji PL Warsaw 100.00% F 100.00% FImmoeast Polonia spólka z ograniczona odpowiedzialnoscia w likwidacji 1 sp.k. PL Warsaw 0.00% Liquidated 100.00% FIMMOEAST PRESTO Beteiligungs GmbH AT Vienna 100.00% F 100.00% FIMMOEAST Projekt Almansor Holding GmbH AT Vienna 100.00% F 100.00% FIMMOEAST Projekt Amfortas Holding GmbH in Liqu. AT Vienna 0.00% Liquidated 100.00% FIMMOEAST Projekt ANDROMACHE Holding GmbH in Liqu. AT Vienna 0.00% Liquidated 100.00% FIMMOEAST Projekt Aries Holding GmbH AT Vienna 100.00% F 100.00% FIMMOEAST Projekt Caelum Holding GmbH in Liqu. AT Vienna 0.00% Liquidated 100.00% FIMMOEAST Projekt Cinna Holding GmbH AT Vienna 100.00% F 100.00% FIMMOEAST Projekt Circinus Holding GmbH in Liqu. AT Vienna 0.00% Liquidated 100.00% FIMMOEAST Projekt Cygnus Holding GmbH in Liqu. AT Vienna 0.00% Liquidated 100.00% FIMMOEAST Projekt Decimus Holding GmbH in Liqu. AT Vienna 0.00% Liquidated 100.00% FIMMOEAST Projekt DESPINA Holding GmbH AT Vienna 100.00% F 100.00% FIMMOEAST Projekt Epsilon Holding GmbH AT Vienna 0.00% Merged 100.00% FIMMOEAST Projekt Equuleus Holding GmbH AT Vienna 100.00% F 100.00% FIMMOEAST Projekt Gamma Holding GmbH in Liqu. AT Vienna 100.00% F 100.00% FIMMOEAST Projekt Hekuba Holding GmbH in Liqu. AT Vienna 100.00% F 100.00% FIMMOEAST Projekt Hüon Holding GmbH in Liqu. AT Vienna 0.00% Liquidated 100.00% FIMMOEAST Projekt Hydrus Holding GmbH in Liqu. AT Vienna 0.00% Liquidated 100.00% FIMMOEAST Projekt Hylas Holding GmbH in Liqu. AT Vienna 0.00% Liquidated 100.00% FIMMOEAST Projekt Idamantes Holding GmbH in Liqu. AT Vienna 0.00% Liquidated 100.00% FIMMOEAST Projekt Kappa Holding GmbH AT Vienna 100.00% F 100.00% FIMMOEAST Projekt Lambda Holding GmbH AT Vienna 100.00% F 100.00% FIMMOEAST Projekt Montano Holding GmbH in Liqu. AT Vienna 0.00% Liquidated 100.00% FIMMOEAST Projekt Narbal Holding GmbH AT Vienna 100.00% F 100.00% FIMMOEAST Projekt Omega Holding GmbH AT Vienna 100.00% F 100.00% FIMMOEAST Projekt Pantheus Holding GmbH AT Vienna 100.00% F 100.00% FIMMOEAST Projekt Quindecimus Holding GmbH in Liqu. AT Vienna 0.00% Liquidated 100.00% FIMMOEAST Projekt Radames Holding GmbH in Liqu. AT Vienna 0.00% Liquidated 100.00% FIMMOEAST Projekt Septendecimus Holding GmbH AT Vienna 100.00% F 100.00% FIMMOEAST Projekt Septimus Holding GmbH in Liqu. AT Vienna 0.00% Liquidated 100.00% FIMMOEAST Projekt Sita Holding GmbH in Liqu. AT Vienna 0.00% Liquidated 100.00% FIMMOEAST Projekt Titurel Holding GmbH in Liqu. AT Vienna 0.00% Liquidated 100.00% FIMMOEAST Projekt Zerlina Holding GmbH in Liqu. AT Vienna 100.00% F 100.00% F F = Full consolidation, E-JV = Joint venture, E-AS = Associates, NC = Not consolidated companies

208 IMMOFINANZ AGAnnual Report 2019
2019 2018
Company Country HeadquartersInterest
in capitalType of
consolidation Interest
in capitalType of
consolidation IMMOEAST Silesia Holding Ltd. CY Nicosia 100.00% F 100.00% FIMMOFINANZ AG AT Vienna 100.00% F 100.00% FIMMOFINANZ ALPHA Immobilien Vermietungs- Gesellschaft m.b.H. AT Vienna 0.00% Merged 100.00% FIMMOFINANZ Artemis Immobilien Vermietung GmbH AT Vienna 100.00% F 100.00% FImmofinanz Center Management Romania SRL RO Cluj-Napoca 100.00% F 100.00% FImmofinanz Corporate Finance Consulting GmbH AT Vienna 100.00% F 100.00% FImmofinanz Deutschland GmbH DE Cologne 100.00% F 100.00% FIMMOFINANZ Enodia Realitäten Vermietungs GmbH AT Vienna 100.00% F 100.00% FIMMOFINANZ Float GmbH & Co. KG DE Cologne 100.00% F 100.00% FIMMOFINANZ Float Verwaltungs GmbH DE Cologne 100.00% F 100.00% FIMMOFINANZ Friesenquartier GmbH DE Cologne 92.70% F 92.70% FIMMOFINANZ Friesenquartier II GmbH DE Cologne 100.00% F 100.00% FImmofinanz Gamma Liegenschafts- und Mobilienvermietungsgesellschaft m.b.H. AT Vienna 100.00% F 100.00% FIMMOFINANZ Hungária Harmadik Kft. HU Budapest 0.00% Merged 100.00% FIMMOFINANZ Immobilien Vermietungs-Gesellschaft m.b.H. AT Vienna 100.00% F 100.00% FIMMOFINANZ Ismene Immobilien Vermietungs- Gesellschaft m.b.H. AT Vienna 100.00% F 100.00% FIMMOFINANZ LAMBDA Liegenschafts- und Mobilienvermietungsgesellschaft m.b.H. AT Vienna 100.00% F 100.00% FImmofinanz Medienhafen GmbH DE Cologne 100.00% F 100.00% FIMMOFINANZ MONTAIGNE Liegenschaftsvermietungs GmbH AT Vienna 100.00% F 100.00% FImmofinanz Polska Sp. z o.o. PL Warsaw 100.00% F 100.00% FIMMOFINANZ Residential Slovakia s.r.o. SK Bratislava 100.00% F 100.00% FIMMOFINANZ Services Czech Republic, s.r.o. CZ Prague 100.00% F 100.00% FImmofinanz Services d.o.o. Beograd-Novi Beograd RS Belgrade 100.00% F 100.00% FIMMOFINANZ Services Hungary Kft. HU Budapest 100.00% F 100.00% FImmofinanz Services Poland Sp. z o.o. PL Warsaw 100.00% F 100.00% FIMMOFINANZ Services Romania s.r.l. RO Bucharest 100.00% F 100.00% FIMMOFINANZ Services Slovak Republic, s.r.o. SK Bratislava 100.00% F 100.00% FImmofinanz zwei Liegenschafts- und Mobilienvermietungsgesellschaft m.b.H. in Liqu. AT Vienna 100.00% F 100.00% FImmoPoland Sp. z o.o. PL Warsaw 100.00% F 100.00% FIMMOWEST Beteiligungs GmbH AT Vienna 100.00% F 100.00% FIMMOWEST IMMOBILIEN ANLAGEN GMBH AT Vienna 100.00% F 100.00% FIMMOWEST Lux III S.à.r.l. in Liqu. LU Luxembourg 0.00% Liquidated 100.00% FImmowest Lux V S.à.r.l. in Liqu. LU Luxembourg 0.00% Liquidated 100.00% FImmowest Lux VI S.à.r.l. in Liqu. LU Luxembourg 0.00% Liquidated 100.00% FImmowest Lux VII S.à.r.l. in Liqu. LU Luxembourg 0.00% Liquidated 100.00% FIMMOWEST PROMTUS Holding GmbH in Liqu. AT Vienna 0.00% Liquidated 100.00% FInfinitas ProjektentwicklungsgesmbH AT Vienna 100.00% F 100.00% FIrascib Holdings Ltd. CY Nicosia 100.00% F 100.00% FIRIDE S.A. RO Bucharest 100.00% F 100.00% FItteslak Trading Ltd CY Nicosia 100.00% F 100.00% FKastor Real Sp. z o.o. w likwidacji PL Warsaw 0.00% Liquidated 100.00% FKlyos Media s.r.l. RO Bucharest 0.00% Sold 100.00% FKoral Residence EOOD BG Sofia 0.00% Liquidated 100.00% FKorinthos s.r.o. CZ Prague 0.00% Liquidated 10.00% FondsLagerman Properties Limited CY Nicosia 100.00% F 100.00% FLarius International SRL RO Bucharest 100.00% F 0.00% n.a.Lasianthus Ltd CY Nicosia 100.00% F 100.00% FLasuvu Consultants Ltd. CY Nicosia 0.00% Sold 100.00% FLENTIA Real (1) Hungária Kft. HU Budapest 0.00% Merged 100.00% FLonaretia Consultants ltd CY Nicosia 100.00% F 100.00% FLoudaumcy Investments Ltd CY Nicosia 100.00% F 100.00% FM.O.F. Immobilien AG AT Vienna 20.00% Fonds 20.00% FondsMaalkaf BV NL Amsterdam 100.00% F 100.00% FMalemso Trading Ltd CY Nicosia 0.00% Sold 100.00% FMBP I Sp. z o.o. PL Warsaw 100.00% F 100.00% F F = Full consolidation, E-JV = Joint venture, E-AS = Associates, NC = Not consolidated companies

CONSOLIDATED FINANCIAL STATEMENTSGroup Companies
209
CO
NS
OL
IDA
TE
D F
INA
NC
IAL
STA
TE
ME
NT
S
2019 2018
Company Country HeadquartersInterest
in capitalType of
consolidation Interest
in capital Type of
consolidation MBP II Sp. z o.o. PL Warsaw 100.00% F 100.00% FMerav Development SRL RO Bucharest 100.00% F 100.00% FMerav Finance BV NL Amsterdam 100.00% F 100.00% FMetropol Consult SRL RO Bucharest 100.00% F 100.00% FMill Holding Kft. HU Budapest 0.00% Sold 38.90% E-ASMonorom Construct SRL RO Bucharest 100.00% F 100.00% Fmyhive offices GmbH AT Vienna 100.00% F 100.00% FNimbus Real Sp. z o.o. PL Warsaw 100.00% F 100.00% FNorden Maritime Services Limited CY Nicosia 100.00% F 100.00% FNorden Maritime SRL RO Bucharest 100.00% F 100.00% FNP Investments a.s. CZ Prague 100.00% F 50.00% E-JVNuptil Trading Ltd CY Nicosia 100.00% F 100.00% FNutu Limited CY Nicosia 100.00% F 100.00% FObjurg Consultants Ltd CY Nicosia 100.00% F 100.00% FOCEAN ATLANTIC DORCOL DOO RS Belgrade 80.00% NC 80.00% NCOFFICE CAMPUS BUDAPEST Kft. HU Budapest 75.00% F 75.00% FOscepar Consultants Ltd CY Nicosia 100.00% F 100.00% FOSG Immobilienhandels G.m.b.H. in Liqu. AT Vienna 0.00% Liquidated 100.00% FPalmovka 0, s.r.o. CZ Prague 100.00% F 0.00% n.a.Palmovka 3, s.r.o. CZ Prague 100.00% F 0.00% n.a.Palmovka 4, s.r.o. CZ Prague 100.00% F 0.00% n.a.PBC Liegenschaftshandelsgesellschaft m.b.H. AT Vienna 100.00% F 100.00% FPBC Liegenschaftshandelsgesellschaft m.b.H. & Co KG AT Vienna 100.00% F 100.00% FPBC Liegenschaftshandelsgesellschaft m.b.H. & Co Projekt "alpha" KG AT Vienna 100.00% F 100.00% FPerlagonia 1 Holding GmbH AT Vienna 100.00% F 100.00% FPivuak Trading Ltd. CY Nicosia 100.00% F 100.00% FPolonia sp. z o.o. w likwidacji III sp.k. w likwidacji PL Warsaw 0.00% Merged 100.00% FPolus a.s. SK Bratislava 100.00% F 100.00% FPolus Transilvania Companie de Investitii S.A. RO Floresti 100.00% F 100.00% FPrelude 2000 SRL RO Bucharest 100.00% F 100.00% FPrinz-Eugen-Straße Liegenschaftsvermietungs GmbH AT Vienna 100.00% F 100.00% FProEast Holding GmbH AT Vienna 100.00% F 100.00% FProgeo Development SRL RO Bucharest 0.00% Sold 100.00% FPromodo Development SRL RO Bucharest 0.00% Sold 100.00% FQuixotic Trading Ltd CY Nicosia 100.00% F 100.00% FReal Habitation s.r.l. RO Bucharest 100.00% F 100.00% FRekan Estate d.o.o. in Liqu. HR Zagreb 0.00% Liquidated 100.00% FRemsing Investments Sp. z o.o. PL Warsaw 100.00% F 100.00% FRentCon Handels- und Leasing GmbH in Liqu. AT Vienna 100.00% F 100.00% FRetail Park d.o.o. Beograd RS Belgrade 100.00% F 100.00% FRetail Park Four d.o.o. Beograd RS Belgrade 100.00% F 100.00% FRezidentim s.r.l. RO Bucharest 100.00% F 100.00% FRonit Development SRL RO Bucharest 100.00% F 100.00% FRoua Vest SRL RO Bucharest 100.00% F 100.00% FS IMMO AG AT Vienna 29.14% E-AS 29.14% E-ASS.C. Baneasa 6981 s.r.l. RO Bucharest 100.00% F 100.00% FS.C. Brasov Imobiliara S.R.L. RO Bucharest 100.00% F 100.00% FS.C. Flash Consult Invest s.r.l. RO Bucharest 100.00% F 100.00% FS.C. IE Baneasa Project s.r.l. RO Bucharest 100.00% F 100.00% FS.C. IMMOEAST Narbal Project s.r.l. RO Bucharest 100.00% F 100.00% FS.C. Meteo Business Park s.r.l. RO Bucharest 100.00% F 100.00% FS.C. Retail Development Invest 1 s.r.l. RO Baia Mare 100.00% F 100.00% FS.C. Stupul de Albine s.r.l. RO Bucharest 100.00% F 100.00% FS.C. Union Investitii S.r.l. RO Bucharest 100.00% F 100.00% FSadira Ltd. CY Nicosia 0.00% Sold 49.45% E-JVSapir Investitii SRL RO Bucharest 100.00% F 100.00% FSARIUS Holding GmbH AT Vienna 0.00% Merged 100.00% FSBF Development Praha spol.s r.o. CZ Prague 100.00% F 100.00% FSCPO s.r.o. in Liqu. SK Bratislava 0.00% Liquidated 100.00% FSCT s.r.o. SK Bratislava 100.00% F 100.00% FShaked Development SRL RO Bucharest 100.00% F 100.00% F F = Full consolidation, E-JV = Joint venture, E-AS = Associates, NC = Not consolidated companies

210 IMMOFINANZ AGAnnual Report 2019
2019 2018
Company Country HeadquartersInterest
in capitalType of
consolidation Interest
in capitalType of
consolidation Shir Investment SRL in Liqu. RO Voluntari 100.00% NC 100.00% NCShopping Center Tri d.o.o. Beograd-Novi Beograd RS Belgrade 100.00% F 100.00% FSilesia Residential Holding Limited CY Nicosia 100.00% F 100.00% FSITUS Holding GmbH AT Vienna 100.00% F 100.00% FSITUS L Liegenschafts Vermietungs GmbH & Co Seidengasse 39 KG AT Vienna 100.00% NC 100.00% NCSITUS L Liegenschafts Vermietungs GmbH & Co. Kaiserstraße 44-46 KG AT Vienna 100.00% NC 100.00% NCSITUS L Liegenschafts Vermietungs GmbH & Co. Neubaugasse 26 KG AT Vienna 100.00% NC 100.00% NCSnagov Lake Rezidential SRL RO Bucharest 100.00% F 100.00% FS-Park Offices s.r.l. RO Bucharest 100.00% F 100.00% FStarmaster Limited CY Nicosia 100.00% F 100.00% FStephanshof Liegenschaftsverwaltungs- gesellschaft m.b.H. AT Vienna 0.00% Sold 100.00% FStop Shop d.o.o. HR Zagreb 100.00% F 100.00% FStop Shop Holding GmbH AT Vienna 100.00% F 100.00% FStop Shop Poland Sp.z.o.o. PL Warsaw 100.00% F 100.00% FSTOP SHOP RO RETAIL ONE SRL RO Bucharest 100.00% F 100.00% FSTOP SHOP SERBIA d.o.o. RS Belgrade 100.00% F 100.00% FSTOP.SHOP GNS Kft. HU Budapest 100.00% F 100.00% FSTOP.SHOP Kisvárda Kft. HU Budapest 0.00% Merged 100.00% FSTOP.SHOP STARJÁN Kft. HU Budapest 100.00% F 100.00% FSTOP.SHOP TB Kft. HU Budapest 100.00% F 100.00% FSTOP.SHOP. CZ s.r.o. CZ Prague 100.00% F 100.00% FSTOP.SHOP. Slovakia s.r.o. SK Bratislava 100.00% F 100.00% FSTOP.SHOP.Holding B.V. NL Amsterdam 100.00% F 100.00% FSunkta Ltd CY Nicosia 100.00% F 100.00% FSZÉPVÖLGYI BUSINESS PARK Kft. HU Budapest 0.00% Merged 100.00% FTaifun Real Sp. z o.o. PL Warsaw 100.00% F 100.00% FTamar Imob Investitii SRL RO Bucharest 100.00% F 100.00% FTermaton Enterprises Limited CY Nicosia 75.00% E-JV 75.00% E-JVTopaz Development SRL RO Bucharest 100.00% F 100.00% FTripont Invest s.r.l. RO Bucharest 100.00% F 100.00% FVáci út 184.Business Center Kft. HU Budapest 0.00% Sold 38.90% E-ASVastator Limited CY Nicosia 100.00% F 99.36% FVCG Immobilienbesitz GmbH AT Vienna 100.00% F 100.00% FVentane Ltd. CY Nicosia 0.00% Sold 98.71% FVentilatorul Real Estate SRL RO Bucharest 100.00% F 100.00% FVitrust Ltd. CY Nicosia 100.00% F 100.00% FVIVO! Poland Sp. z o.o. PL Warsaw 100.00% F 100.00% FW zehn Betriebs- & Service GmbH in Liqu. AT Vienna 0.00% Liquidated 100.00% FWalkabout Beteiligungs GmbH in Liqu. DE Rodgau 0.00% Liquidated 66.67% E-ASWINNIPEGIA SHELF s.r.o. CZ Prague 0.00% Sold 100.00% FWS Tower Sp. z o.o. PL Warsaw 100.00% F 0.00% n.a.WS Tower Sp. z o.o. Pl. Europejski 1 S.K.A. PL Warsaw 100.00% F 0.00% n.a.Xantium Sp. z o.o. PL Warsaw 100.00% F 100.00% F F = Full consolidation, E-JV = Joint venture, E-AS = Associates, NC = Not consolidated companies

CONSOLIDATED FINANCIAL STATEMENTSRelease of the Consolidated Financial Statements
211
CO
NS
OL
IDA
TE
D F
INA
NC
IAL
STA
TE
ME
NT
S
9. Release of the Consolidated Financial Statements
These consolidated financial statements were completed and signed by the Executive Board of IMMOFINANZ AG on 8 April 2020 and subsequently distributed to the Supervisory Board. The Supervisory Board is responsible for examining the consolidated financial statements and stating whether or not it approves these documents.
Vienna, 8 April 2020
The Executive Board of IMMOFINANZ AG
Stefan Schönauer CFO
Dietmar Reindl COO

212 IMMOFINANZ AGAnnual Report 2019
Auditor’s Report
Report on the Audit of the Consolidated Financial Statements Opinion We have audited the consolidated financial statements of IMMOFINANZ AG, Vienna (the Company), and its subsidiaries (the Group), which comprise the consolidated statement of financial position as at 31 December 2019, and the consolidated statement of comprehensive income, the consolidated statement of changes in equity and the consolidated statement of cash flows for the financial year then ended, and notes to the con-solidated financial statements.
In our opinion, the accompanying consolidated financial statements comply with legal requirements and give a true and fair view of the consolidated financial position of the Group as at 31 December 2019, its consoli-dated financial performance and its consolidated cash flows for the year then ended in accordance with Inter-national Financial Reporting Standards (IFRS) as adopted by the EU and the additional requirements under section 245a UGB.
Basis for Opinion We conducted our audit in accordance with Regulation (EU) No. 537/2014 and with the Austrian Generally Accepted Auditing Standards. Those standards require the application of the International Standards on Au-diting (ISAs). Our responsibilities under those standards are further described in the Auditor’s Responsibilities for the Audit of the Consolidated Financial Statements section of our report. We are independent of the Group in accordance with laws and regulations applicable in Austria, and we have fulfilled our other professional re-sponsibilities in accordance with these requirements. We believe that the audit evidence we have obtained is sufficient and appropriate to provide a basis for our opinion.
Key Audit Matters Key audit matters are those matters that, in our professional judgement, were of most significance in our audit of the consolidated financial statements of the current period. These matters were addressed in the context of our audit of the consolidated financial statements as a whole, and in forming our opinion thereon, and we do not provide a separate opinion on these matters.
Revaluation of investment property Audit matters and related information (See sections 4.1 and 5.7 of the notes to the consolidated financial statements and the section “Property valuation“ in the group management report)
The revaluation of standing investments amounted to EUR 196 million in the 2019 financial year based on a total carrying amount of EUR 4,985 million for investment property, which represents the most important asset position on the balance sheet.
In order to determine the fair value of each property as of the balance sheet date, management uses inde-pendent appraisers for nearly all properties. The input parameters for these valuations include data supplied by the Company as of the balance sheet as well as numerous assumptions by the Executive Board and the appraisers for various “input factors”, above all concerning market rents, expected vacancies, future new rent-als and the resulting realisable rents and the discount rates based on the yields for comparable properties, all of which are intended to best depict the future earnings potential of the respective property. These estimates have a material influence on property valuation.

CONSOLIDATED FINANCIAL STATEMENTSRelease of the Consolidated Financial Statements
213
CO
NS
OL
IDA
TE
D F
INA
NC
IAL
STA
TE
ME
NT
S
Given the high importance of investment property for the consolidated financial statements and the increased valuation uncertainty connected with the estimates of future developments, we have defined the revaluation of investment property as a key audit matter.
Audit procedures Our audit procedures to evaluate the appropriateness of the revaluation of investment property included the following activities:
– An analysis of the process used to value investment property with regard to the general procedures, design and functioning of controls in processing the results in the consolidated financial statements
– An evaluation of the professional suitability and objectivity of the appraisers appointed by the Executive Board – The conscious selection of a sample and the subsequent analysis of property appraisals based on the amount
of and change in the fair value of the properties above a defined scope and properties with changes in ma-terial input factors without the expected change in fair value
– A critical assessment of the methods and key assumptions in the expert opinions for the sampling through comparison with current publicly available data and market developments
– Communication with the external appraisers as well as the asset managers and controllers to clarify any implausibility arising from the above-mentioned audit procedures
– An analysis of the disclosures in the notes on investment property with regard to the appropriateness of the information on estimation uncertainty and sensitivities
Deferred tax assets Audit matters and related information (See sections 4.8 and 5.10 of the notes to the consolidated financial statements)
Deferred tax assets (before offset: EUR 269 million) and deferred tax liabilities (before offset: EUR 541 mil-lion) are recognised, on the one hand, for temporary differences which could lead to taxable or deductible amounts and, on the other hand, for future tax receivables resulting from the utilisation of loss carryforwards. The recognition of deferred tax liabilities includes all taxable temporary differences, while deferred tax assets are only recorded to the extent it is probable that sufficient deferred tax liabilities or taxable profit will be available in the future against which the deductible temporary differences can be used.
The IMMOFINANZ Group is active in various tax jurisdictions and has a complex corporate and financing struc-ture. This corporate structure is subject to continuous change, in particular through the project to simplify the corporate structure which was implemented in previous years. This has appropriate effects on the future de-velopment of earnings and the tax burden in the individual Group companies.
The valuation of deferred tax assets is based on significant estimates by management concerning the future development of business, including the necessary inclusion of previously implemented or planned changes in the corporate or financing structure, and must be continuously monitored both prospectively and retrospec-tively. These calculations are complex because of the applicable tax rules and the necessary subjective esti-mates and accompanying uncertainty.
Therefore, we have defined the carrying amount of deferred tax assets as a key audit matter.
Audit procedures In connection with our audit of the recoverable value of deferred tax assets, our audit procedures focused on the following matters:
– Reconciliation of the forecast calculations which form the basis for tax planning in each company with the overall budget approved by the Supervisory Board
– An analysis of the forecast data and its development, in particular with respect to internal changes in the capital and financing structure of group companies and the adjustments resulting from tax laws
– An analysis of the non-recurring effects (in particular, sales) in the forecast data and their effects on future forecast years
– An analysis of the calculation methodology and the consistency of the individual calculation steps

214 IMMOFINANZ AGAnnual Report 2019
– A comparison of the key assumptions used for tax planning with the legal framework (in particular tax rates, special regulations for the deductibility of refinancing costs and the possible utilisation of loss carryforwards)
– A summarised assessment of the recognised deferred tax assets
Other Informationen Management is responsible for the other information. The other information comprises all information in the annual report and in the annual financial report (but does not include the consolidated financial statements, the group management report and our auditor’s report thereon), which is expected to be made available to us after that date.
Our opinion on the consolidated financial statements does not cover the other information and we do not and will not express any form of assurance conclusion thereon. With respect to the information in the group management report we refer to the section “Report on the Audit of the Group Management Report”.
In connection with our audit of the consolidated financial statements, our responsibility is to read the other information and, in doing so, consider whether the other information is materially inconsistent with the con-solidated financial statements or our knowledge obtained in the audit, or otherwise appears to be materially misstated.
Responsibilities of Management and Audit Committee for the Consolidated Financial Statements Management is responsible for the preparation of the consolidated financial statements that give a true and fair view in accordance with International Financial Reporting Standards (IFRS) as adopted by the EU, the additional requirements under section 245a UGB and for such internal control as management determines is necessary to enable the preparation of consolidated financial statements that are free from material misstate-ment, whether due to fraud or error.
In preparing the consolidated financial statements, management is responsible for assessing the Group’s ability to continue as a going concern, disclosing, as applicable, matters related to going concern and using the going concern basis of accounting unless management either intends to liquidate the Group or to cease operations, or has no realistic alternative but to do so.
The audit committee is responsible for overseeing the Group’s financial reporting process.
Auditor’s Responsibilities for the Audit of the Consolidated Financial Statements Our objectives are to obtain reasonable assurance about whether the consolidated financial statements as a whole are free from material misstatement, whether due to fraud or error, and to issue an auditor’s report that includes our opinion. Reasonable assurance is a high level of assurance, but is not a guarantee that an audit conducted in accordance with the Regulation (EU) No 537/2014 and with Austrian Generally Accepted Au-diting Standards, which require the application of the ISAs, will always detect a material misstatement when it exists. Misstatements can arise from fraud or error and are considered material if, individually or in the aggre-gate, they could reasonably be expected to influence the economic decisions of users taken on the basis of these consolidated financial statements.
As part of an audit in accordance with Regulation (EU) No 537/2014 and with Austrian Generally Accepted Auditing Standards, which require the application of the ISAs, we exercise professional judgement and main-tain professional skepticism throughout the audit.

CONSOLIDATED FINANCIAL STATEMENTSRelease of the Consolidated Financial Statements
215
CO
NS
OL
IDA
TE
D F
INA
NC
IAL
STA
TE
ME
NT
S
We also:
– Identify and assess the risks of material misstatement of the consolidated financial statements, whether due to fraud or error, design and perform audit procedures responsive to those risks, and obtain audit evidence that is sufficient and appropriate to provide a basis for our opinion. The risk of not detecting a material mis-statement resulting from fraud is higher than for one resulting from error, as fraud may involve collusion, forgery, intentional omissions, misrepresentations, or the override of internal control.
– Obtain an understanding of internal control relevant to the audit in order to design audit procedures that are appropriate in the circumstances, but not for the purpose of expressing an opinion on the effectiveness of the Group’s internal control.
– Evaluate the appropriateness of accounting policies used and the reasonableness of accounting estimates and related disclosures made by management.
– Conclude on the appropriateness of the directors’ use of the going concern basis of accounting and based on the audit evidence obtained, whether a material uncertainty exists related to events or conditions that may cast significant doubt on the Group’s ability to continue as a going concern. If we conclude that a material uncertainty exists, we are required to draw attention in our auditor’s report to the related disclosures in the consolidated financial statements or, if such disclosures are inadequate, to modify our opinion. Our conclu-sions are based on the audit evidence obtained up to the date of our auditor’s report. However, future events or conditions may cause the Group to cease to continue as a going concern.
– Evaluate the overall presentation, structure and content of the consolidated financial statements, including the disclosures, and whether the consolidated financial statements represent the underlying transactions and events in a manner that gives a true and fair view.
– We obtain sufficient appropriate audit evidence regarding the financial information of the entities or busi-ness activities within the Group to express an opinion on the consolidated financial statements. We are re-sponsible for the direction, supervision and performance of the group audit. We remain solely responsible for our audit opinion.
We communicate with the audit committee regarding, among other matters, the planned scope and timing of the audit and significant audit findings, including any significant deficiencies in internal control that we identify during our audit.
We also provide the audit committee with a statement that we have complied with relevant ethical require-ments regarding independence, and to communicate with them all relationships and other matters that may reasonably be thought to bear on our independence, and where applicable, related safeguards.
From the matters communicated with the audit committee, we determine those matters that were of most significance in the audit of the consolidated financial statements of the current period and are therefore the key audit matters. We describe these matters in our auditor’s report unless law or regulation precludes public disclosure about the matter or when, in extremely rare circumstances, we determine that a matter should not be communicated in our report because the adverse consequences of doing so would reasonably be expected to outweigh the public interest benefits of such communication.
Report on the Audit of the Group Management Report Pursuant to statutory provisions, the group management report is to be audited as to whether it is consistent with the consolidated financial statements and whether it has been prepared in accordance with the applicable legal requirements. With respect to the consolidated non-financial statement included in the group manage-ment report, our responsibility is to determine whether it had been prepared, to read it and, in doing so, consider whether it is materially inconsistent with the consolidated financial statements or our knowledge obtained in the audit, or otherwise appears to be materially misstated.
Management is responsible for the preparation of the group management report in accordance with the Aus-trian Commercial Code.
We conducted our audit in accordance with laws and regulations applicable with respect to the group man-agement report.

216 IMMOFINANZ AGAnnual Report 2019
Opinion In our opinion, the group management report is prepared in accordance with the applicable legal requirements, includes appropriate disclosures according to section 243a UGB and is consistent with the consolidated finan-cial statements.
Statement In the light of the knowledge and understanding of the Group and its environment obtained in the course of our audit of the consolidated financial statements, we have not identified material misstatements in the group management report.
Other Matters which we are required to address according to Article 10 of Regulation (EU) No 537/2014 We were appointed by the annual general meeting on 22 May 2019 and commissioned by the Supervisory Board on 18 June 2019 to audit the consolidated financial statements for the financial year ending 31 December 2019. We have been auditing the Group uninterrupted since the financial year ending 30 April 2011.
We confirm that our opinion expressed in the section “Report on the Audit of the Consolidated Financial Statements” is consistent with the additional report to the audit committee referred to in Article 11 of Regu-lation (EU) No 537/2014.
We declare that we did not provide any prohibited non-audit services referred to in Article 5 (1) of Regulation (EU) No 537/2014 and that we remained independent of the Group in conducting the audit.
Engagement Partner The engagement partner responsible for the audit is Mr. Friedrich Wiesmüllner.
Vienna, 8. April 2020
Deloitte Audit Wirtschaftsprüfungs GmbH
Mr. Friedrich WiesmüllnerCertified Public Accountant
This report is a translation of the long-form audit report according to section 273 of the Austrian Commercial Code (UGB). The translation is presented for the convenience of the reader only. The German wording of the long-form audit report is solely valid and is the only legally binding version. Section 281(2) UGB applies.

CONSOLIDATED FINANCIAL STATEMENTSRelease of the Consolidated Financial Statements
217
CO
NS
OL
IDA
TE
D F
INA
NC
IAL
STA
TE
ME
NT
S
Statement by the Executive Board We confirm to the best of our knowledge that the consolidated financial statements of IMMOFINANZ provide a true and fair view of the assets, liabilities, financial position and profit or loss of the group as required by the applicable accounting standards and that the group management report of IMMOFINANZ provides a true and fair view of the development and performance of the business and position of the group, together with a description of the principal risks and uncertainties faced by the group.
We confirm to the best of our knowledge that the individual financial statements provide a true and fair view of the assets, liabilities, financial position and profit or loss of IMMOFINANZ AG as required by the applicable accounting standards and that the management report provides a true and fair view of the development and performance of the business and position of the company, together with a description of the principal risks and uncertainties faced by the company.
Vienna, 8 April 2020
The Executive Board of IMMOFINANZ AG
Stefan Schönauer CFO
Dietmar Reindl COO

IMMOFINANZ AGAnnual Report 2019
Imprint Photos: IMMOFINANZ AG, katsey (portrait Executive Board), andresr/BraunS/Maskot via Getty Images, IRStone – stock.adobe.com, Christian Stemper, Downtown films Zemun, Klaus Vyhnalek, www.dobrovodsky.cz [email protected], zoomvp.at, Zoran MirceticConcept and realisation: be.public Corporate & Financial Communications and Rosebud, Inc., produced inhouse using firesys GmbH (pages 32–91 and pages 114–217) Print: Print Alliance, Druckhausstraße 1, 2540 Bad Vöslau
Disclaimer We have prepared this report and verified the data herein with the greatest possible caution. However, errors arising from rounding, transmission, typesetting or printing cannot be excluded. This report contains assumptions and forecasts that were based on information available at the time this report was prepared. If the assumptions underlying these forecasts are not realised, actual results may differ from the results expected at the present time. Automatic data processing can lead to apparent mathematical errors in the rounding of numbers or percentage rates. This report is published in German and English, and can be downloaded from the investor relations section of the IMMOFINANZ website. In case of doubt, the German text represents the definitive version. This report does not represent a recommendation to buy or sell shares in IMMOFINANZ AG.
Rounding differences may result from the use of automatic data processing equipment for the addition of rounded amounts and percentage rates.
Financial calendar 2019
IMMOFINANZ AG Wienerbergstrasse 11 1100 Vienna, Austria T +43 (0)1 880 90
[email protected] www.immofinanz.com
27 May 20201 Announcement of results for the first quarter of 202028 May 2020 Interim financial statements on the first quarter of 2020
26 August 20201 Announcement of results for the first half of 202027 August 2020 Financial report on the first half of 202021 September 2020 Record date for participation in the 27th annual general meeting1 October 2020 27th annual general meeting5 October 2020 Expected ex-dividend date6 October 2020 Expected date for the determination of dividend rights (record date)7 October 2020 Expected dividend payment date25 November 20201 Announcement of results for the first three quarters of 202026 November 2020 Interim financial statements on the first three quarters of 2020
1 Publication after close of trading at the Vienna Stock Exchange
218


www.immofinanz.com