three-dimensional asymmetric reconstruction of tailed...
TRANSCRIPT

C H A P T E R S E V E N
Three-Dimensional Asymmetric
Reconstruction of Tailed
Bacteriophage
Jinghua Tang,* Robert S. Sinkovits,* and Timothy S. Baker*,†
Contents
1. Introduction: 3D Asymmetric Reconstruction of
Tailed Bacteriophage 186
1.1. Symmetry mismatch in phage structure 187
1.2. History of asymmetric virus reconstructions by single-particle
cryo-TEM 188
1.3. Alternative strategies to determine the structures of
asymmetric viruses 188
1.4. Cryo-TEM of f29 189
1.5. Strategy for determining the f29 structure 190
1.6. Image reconstruction software 190
2. Particle Boxing 192
2.1. Initial tight boxing of the phage head 193
2.2. Reboxing to center the particle 193
2.3. Expanding the box to include the tail 193
2.4. Additional considerations about boxing 194
3. Generating a Starting Model of the Complete f29 Phage 194
3.1. Fivefold, symmetrized model of f29 head 195
3.2. Hybrid head–tail model of f29 195
4. Asymmetric Reconstruction of the Entire f29 Phage 197
4.1. Origin and orientation determination and refinement
with FREALIGN 197
4.2. Origin and orientation refinement in AUTO3DEM 198
5. Analysis and Interpretation of f29 Reconstruction 200
5.1. Model docking 200
5.2. Map segmentation 202
6. Summary and Future Prospects 204
6.1. Streamlined processing 204
Methods in Enzymology, Volume 482 # 2010 Elsevier Inc.
ISSN 0076-6879, DOI: 10.1016/S0076-6879(10)82008-7 All rights reserved.
* Department of Chemistry & Biochemistry, University of California, San Diego, La Jolla, California, USA{ Division of Biological Sciences, University of California, San Diego, La Jolla, California, USA
185

6.2. Development of smart masking 205
6.3. Future prospects 205
Acknowledgments 206
References 206
Abstract
A universal goal in studying the structures of macromolecules and macromo-
lecular complexes by means of electron cryo-microscopy (cryo-TEM) and three-
dimensional (3D) image reconstruction is the derivation of a reliable atomic or
pseudoatomic model. Such a model provides the foundation for exploring in
detail the mechanisms by which biomolecules function. Though a variety of
highly ordered, symmetric specimens such as 2D crystals, helices, and icosahe-
dral virus capsids have been studied by these methods at near-atomic resolu-
tion, until recently, numerous challenges have made it difficult to achieve sub-
nanometer resolution with large (��500 A), asymmetric molecules such as the
tailed bacteriophages.
After briefly reviewing some of the history behind the development of asym-
metric virus reconstructions, we use recent structural studies of the prolate
phage f29 as an example to illustrate the step-by-step procedures used to
compute an asymmetric reconstruction at sub-nanometer resolution. In contrast
to methods that have been employed to study other asymmetric complexes, we
demonstrate how symmetries in the head and tail components of the phage can
be exploited to obtain the structure of the entire phage in an expedited,
stepwise process. Prospects for future enhancements to the procedures cur-
rently employed are noted in the concluding section.
1. Introduction: 3D Asymmetric Reconstruction
of Tailed Bacteriophage
Electron microscopy and three-dimensional (3D) image reconstruc-tion have been the preferred tools for more than 40 years for studying largemacromolecular structures that resist crystallization. Even for those virusesthat can be crystallized, an advantage of electron microscopy is that it can beused to capture more transient, intermediate stages in the viral life cycle(e.g., Steven et al., 2005) or to visualize the virus complexed with anti-bodies, receptors, or other molecules and ligands (e.g., Smith, 2003; Stewartet al., 2003). These techniques were first applied to images of negativelystained samples of the helical, contractile tail of bacteriophage T4 (DeRosierand Klug, 1968; see DeRosier’s Personal Account in this volume) and to theicosahedral tomato bushy stunt and human papilloma viruses (Crowtheret al., 1970), and they have since been used to solve the structures of arapidly expanding universe of macromolecules and macromolecular
186 Jinghua Tang et al.

complexes imaged by means of electron cryo-microscopy (cryo-TEM)(Cheng and Walz, 2009; Jonic et al., 2008; also, see other chapters in thisvolume).
Whenever possible, advantage is taken of the inherent symmetry of theparticles since this generally allows one to reach higher resolutions andmaximize the signal-to-noise ratio in the final reconstructed map. One ofthe best examples of exploiting symmetry is found in the study of icosahe-dral viruses, where each image contains information from 60 equivalentviews (Baker et al., 1999; Crowther et al., 1970). Recent advances in boththe microscopy and image processing methods have enabled cryo-recon-structions of icosahedral viruses to approach atomic resolution (Chen et al.,2009; Wolf et al., 2010; Zhang et al., 2008, 2010; Zhou, 2008).
1.1. Symmetry mismatch in phage structure
Many bacteriophage contain a multi-subunit, multicomponent tailconnected to a unique vertex of the capsid, and it is through this vertexthat the genome is packaged during assembly and released during infection.The heads of tailed phages have either a prolate (e.g., T4 and f29) or anisometric (e.g., P22, T7, l, and e15) morphology, but all heads possess afivefold rotational symmetry about an axis that passes through the tail andopposing vertex. The tail complex generally has 6- or 12-fold redundancyin the constituent viral proteins, which results in a symmetry mismatch atthe junction between the head and tail ( Jiang et al., 2006; Lander et al.,2006; Xiang et al., 2006). The DNA genome is a molecule with a uniquesequence and hence cannot adopt a structure that matches any of the localsymmetries in the capsid or tail components. Given that there is just onecopy of the genome and at least one prominent, symmetry mismatchbetween the capsid and tail, the phage as a whole must be asymmetric.
Symmetry averaging is often used as part of the reconstruction process,and whether applied to viruses with full icosahedral symmetry or to tailedphages with fivefold symmetric heads, comes at a cost. Only those compo-nents that possess the imposed symmetry will be accurately represented inthe averaged final map. Other features of the virus structure, such as thepackaged genome or unique tail, will be smeared out since they do not sharethe imposed symmetry. Reconstructions of these viruses could, in principle,be carried out from start to finish without applying any symmetry usingtechniques similar to those used to study ribosomes (Frank, 2009), in whichno symmetry is imposed. But the tailed phages provide a unique set ofchallenges since intrinsic local symmetries in parts of the phage can compli-cate the reconstruction process. For example, an attempt to process imagesof P22 phage, in which onlyC1 symmetry was assumed from the start, failedto lead directly to a valid reconstruction (Chang et al., 2006). Thus, it can bebeneficial to exploit the inherent local symmetry in components of the
Three-Dimensional Asymmetric Reconstruction of Tailed Bacteriophage 187

phage when designing a reconstruction strategy that will yield a reliabledensity map from images of particles whose global structure is asymmetric.
1.2. History of asymmetric virus reconstructions bysingle-particle cryo-TEM
The widespread success with icosahedral virus reconstructions has alsostimulated the development of techniques to study nonicosahedral viruses( Johnson and Chiu, 2007). After generalizing our polar Fourier transformmethod (Baker and Cheng, 1996) to handle cyclic symmetries, we obtainedthe first reconstruction of a tailed bacteriophage with a prolate head (Taoet al., 1998). In that study of f29, fivefold symmetry was imposed toenhance features in the head structure. However, since the f29 tail is notfivefold symmetric, its structure was smeared out in the reconstruction.Later, a two-step processing scheme was developed to preserve symmetrymismatched components in the entire phage (Morais et al., 2001). In stepone, a fivefold-averaged reconstruction was computed in which the headbut not tail was symmetrized. Then, the fivefold symmetry constraint of thehead was removed and each particle image was compared to five separate,related projections of the model. The projection with the highest correla-tion to each particle image was used to assign the view orientation for thatparticle. This new set of particle orientations provided the necessary infor-mation needed to combine the images and compute a new reconstruction inwhich no symmetry was enforced. The second step of the procedure wasrepeated and led to the first asymmetric reconstruction of the complete f29phage at 33-A resolution (Morais et al., 2001).
Since this initial f29 asymmetric reconstruction, several other 3D den-sity maps of entire tailed phages have been determined at progressivelyhigher resolutions (Table 7.1). In all these studies, even those at lowerresolutions (�20 A), the head and tail structures were clearly resolved.Our studies of f29 have led to two, sub-nanometer resolution, asymmetricreconstructions that have made it possible to resolve features correspondingto helices in the head–tail connector as well as a highly condensed, toroid-like DNA structure embedded within a cavity at the connector–tailjunction (Tang et al., 2008b).
1.3. Alternative strategies to determine the structures ofasymmetric viruses
Not all phages or asymmetric complexes can be readily solved using thestrategy we have outlined above. For example, T4 phage with its long,contractile tail, remains a significant challenge for single particle, asymmet-ric reconstruction methods. For T4, a concerted, “divide and conquer”approach was used to solve the head (Fokine et al., 2004) and tail
188 Jinghua Tang et al.

(Kostyuchenko et al., 2005) structures separately. Asymmetric reconstruc-tion techniques have also been used to examine virus–host interactions atlimited resolution. Studies of polio and Semliki Forest virus attachment toliposomes were aided by manually adding high intensity dots in the imagesat points in the membrane where virus particles attached (Bubeck et al.,2008). These dots served as fiducial markers to help in determining therelative orientations of individual virus particles and to compute from thoseimages a reconstruction that indicated a unique vertex is involved in thedelivery of the genome in both types of virus.
1.4. Cryo-TEM of f29
The sample preparation and microscopy steps required to produce a set ofimages from which the reconstructed structure of an asymmetric virus canbe obtained are identical to those used to study icosahedral particles (e.g.,Baker et al., 1999). We recently computed asymmetric reconstructions oftwo different f29 particles (Tang et al., 2008b). These included fiberless(gp8.5-) virions and fiberless “ghosts,” which are particles formed by induc-ing virions in vitro to lose their dsDNA genome and the two molecules ofviral gene product 3 (gp3) that are covalently linked to the ends of the lineargenome. The same procedures were used to determine the 3D structures ofboth types of particles (to 7.8 and 9.3 A, respectively), and we limit ourdiscussion here to the procedures used to study the virion. Briefly, themicroscopy involved first taking purified samples of fiberless f29 virions
Table 7.1 Chronological history of asymmetric cryo-reconstructions of entire tailedbacteriophage
Phage Head shape Softwarea Resolution (A) Reference
f29 Prolate PFT 33 Morais et al., 2001
T7 Isometric XMIPP 24 Agirrezabala, 2005
e15 Isometric EMAN 20 Jiang et al., 2006
P22 Isometric EMAN 20 Chang et al., 2006
P22 Isometric SPIDER 17 Lander et al., 2006
f29 Prolate EMAN 16 Xiang et al., 2006
f29 Prolate EMAN,
FREALIGN,
AUTO3DEM
7.8 Tang et al., 2008b
N4 Isometric EMAN 29 Choi et al., 2008
a Software indicates main program(s) used to perform reconstruction. It is assumed that, in all or mostcases, additional scripts were required for image preprocessing, data manipulation, file format conver-sions, and other tasks.
Three-Dimensional Asymmetric Reconstruction of Tailed Bacteriophage 189
and vitrifing them over holey, carbon-coated grids (Chapter 3, Vol. 481).Images of these samples were then recorded on Kodak SO163 electronimage film at a nominal magnification of 38,000� and an electron dose of�20e-/A2 in an FEI CM200 FEG microscope operated at 200 keV. Micro-graphs that exhibited minimal astigmatism and specimen drift, and with theobjective lens under-focused by 1–5 mm, were digitized at 7 mm intervals ona Zeiss PHODIS scanner and bin-averaged to yield an effective pixel size of3.68 A. A total of 12,682 particle images were selected from 74 micrographsfor further processing.
1.5. Strategy for determining the f29 structure
The general image reconstruction scheme we used followed a model-basedrefinement procedure. This entailed aligning raw particle images relative toa series of projections of an existing 3D model to estimate the origin andorientation of each particle. The particle origin is defined by the (x,y) pixelcoordinates of the position of the center of the particle in the image, and theparticle orientation is defined by three angles (y, f, o) that specify thedirection from which the particle is viewed in the image (See Baker et al.,1999 for definition of these angles.). With this set of five particle parameters,a new 3D reconstruction can be computed and used as the model for thenext iteration of the process.
The specific reconstruction strategy that we adopted in our f29 studyinvolved two major branches as shown schematically in Fig. 7.1. Thisstrategy took into account that fact that f29 has a prolate head(�480 � 600 A) and a tail of comparable length (�400 A). The first branchof the processing scheme constructs a reliable starting model and achievesoptimal particle boxing. This includes calculating separate head and tailmodels and then combining them into a single, hybrid model. The secondbranch takes this hybrid model, computes projections, and compares theseto each raw image to assign to it an origin and orientation. The images areused to compute a new reconstruction and several cycles of alignment andimage screening (to weed out “bad” particles) are carried out until nofurther improvement in resolution is achieved.
1.6. Image reconstruction software
Owing to the complexity of performing asymmetric reconstructions, wefound it necessary to use different image reconstruction packages at variousstages of the process. In the f29 project and as described below, we usedEMAN (Ludtke et al., 1999), FREALIGN (Grigorieff, 2007), AUTO3-DEM (Yan et al., 2007b), and BSOFT (Heymann, 2001) to ultimately reachsub-nanometer resolution. It is important to stress that our choice ofprograms more reflects our familiarity with the capabilities of the software
190 Jinghua Tang et al.

than it does with providing an optimized strategy. These packages andothers such as SPIDER (Frank et al., 1996) and XMIPP (Sorzano et al.,2004) contain many useful features that require significant expertise in orderto use to their full potential (see also Chapter 15 in this volume).
Startingmap
Boxedparticles
SegmentationCCP4, Chimera
Dock X-ray structuresChimera, COOT, O
Density thresholdingBsoft
Refineorientationsand origins
AUTO3DEM
Convertorientations
FREALIGN
EMANC1
symmetry
C12symmetry
C5symmetry
Convertimage format
IMAGIC → MRC
Convertimage formatMRC → PIF
20�
5�
2�Hybridmap
Extracttail
12-foldmap
Five foldmap
Reboximages
Recentermodel
Extracthead
2�
5�
Increasebox size
EMAN
EMAN2�
Figure 7.1 f29 image reconstruction flowchart. Left hand side of flowchart showssteps taken to generate hybrid-starting model built from fivefold symmetric phage headand 12-fold symmetric tail. Right hand side illustrates steps in fully asymmetric recon-struction. Numbers next to loops indicate the number of iterations used in stages of thef29 reconstruction and will likely vary for other phage species.
Three-Dimensional Asymmetric Reconstruction of Tailed Bacteriophage 191

2. Particle Boxing
The purpose of boxing is to window out individual particles fromtheir surroundings and to minimize the contribution of extraneous noise inthe images to the final 3D reconstruction. Ideally, the boxing procedurecenters each particle in its own box and excludes all neighboring particles.The defocus used in generating phase contrast during microscopy causesparticle details to spread outside the particle boundary (Rosenthal andHenderson, 2003), and hence the pixel dimensions of the box need toextend well enough beyond this boundary to preserve structural informa-tion. The choice of the box size depends on resolution and amount ofdefocus. For the f29 image data, we chose a box size approximately 50%larger than the width of the prolate head (Fig. 7.2, red circles).
The type of boxing employed depends on the shape of the phage head andthe length of the tail. If the head is isometric and the tail is short relative to thesize of the capsid, which is true for some phage like P22 (Lander et al., 2006),the particle can simply be boxed so that the head center coincides with thecenter of the box. Alternatively, if the tail dimension is comparable to that ofthe head, then the center of the box should coincide with the center of thewhole particle to avoid having to make the box size excessively large.
Figure 7.2 Progressive boxing of phage particles. The small blue circles indicate theinitial boxing of the particles, with box size chosen to capture head and proximalportion of tail. As the reconstruction progresses, the box size is gradually expandedto include more of the tail (large red circles). Note that the red and blue circles are notconcentric and that the top of the phage head remains a constant distance from the edgeof the circle.

2.1. Initial tight boxing of the phage head
Given that we did not have a starting model of the entire f29 virion, wedecided to adopt a systematic, stepwise approach to solving its structure. Thisinvolved first constructing a model just for the head from a subset of�1000images masked tightly to include primarily the phage heads. Subsequently,we incrementally increased the size of the box to include more and more ofthe tail with the eventual goal of including the entire image of each phageparticle in the final reconstruction as described below (Section 3). Hence, westarted by boxing out just the particle heads and thereby excludedmost of thetail and most of the neighboring particles (Fig. 7.2, blue circles). This tightboxing strategy helped to enhance the reliability with which initial particleorigin and orientation parameters could be determined. Such a procedure isunnecessary with icosahedral particles since the origin of spherically sym-metric objects is generally fairly easy to define quite accurately. The proce-dure does limit the resolution of the initial 3D reconstruction, but theoverriding concern at this point is to obtain a reliable starting model. Allboxing was carried out with the programRobEM (http://cryoem.ucsd.edu/programs.shtml) and images were converted from PIF to IMAGIC formatusing BSOFT (Heymann, 2001) before the next step of processing wasperformed using EMAN (Ludtke et al., 1999).
2.2. Reboxing to center the particle
Whether particle boxing is performed manually or automatically, it isdifficult to assure that each particle will be centered to 1 pixel accuracy inits box. Experience shows that reconstruction quality can be improved byperiodically reboxing the particles using the latest set of origin positionsobtained during the iterative refinement process (Gurda et al., 2010). Moresignificantly, with asymmetric particles it is important to make sure that theorigin of each boxed particle correlates with the defined origin of the mostcurrent reconstructed model. Hence, after each cycle of EMAN asdescribed later (Section 3.1), the identified origin of the particle withinthe box is used to reextract without interpolation the particle image fromthe micrograph such that this origin lies within 1 pixel of the center of thenew box.
2.3. Expanding the box to include the tail
After a reliable head map was obtained (i.e., one in which pentameric andhexameric gp8 capsomers were clearly resolved), all particles were boxedanew from the raw micrographs using a circular mask, typically larger by10–15 pixels in radius, to include more of the tail structure in each image.This necessitated that the density map of the head just calculated be padded
Three-Dimensional Asymmetric Reconstruction of Tailed Bacteriophage 193

with voxels set to the background density to match the size of the newlyboxed particles and used as the model to align the images. Padding entailedadding voxels to expand all three dimensions of the cubic density map byequal amounts. The long axis of the phage was kept centered in the map butvoxels in the axial direction were primarily added toward the tail side. Thisprocedure assured that the particle (head þ currently included portion oftail) was centered within the box containing the reconstructed 3D map.
The padded density map was used to generate a new set of projectedimages from which the origin and orientation parameters for each imagecould be redetermined. These were then used to compute a new recon-struction and to recenter and rebox the particles. At this point the mask wasexpanded, the map repadded with the background density, and the originsand orientations redetermined. This cycle of steps was repeated four addi-tional times, at the end of which the entire phage particle was included inthe density map.
2.4. Additional considerations about boxing
Typically, the early stages of the reconstruction process are acceleratedsignificantly by making use of images that are two- or fourfold, bin-aver-aged. This is feasible because the primary goal at this stage is to obtain a low-resolution starting model whose size and shape are approximately correct.Hence, it is not necessary to use data at full pixel resolution. It is worthnoting that, though automatic boxing routines can be used to speed up theboxing process, it was helpful with f29 to take the extra time to manuallyscreen the entire data set of images and select the best ones to include in theprocessing. Ultimately, even the most sophisticated alignment algorithmscannot compensate for poor particle selection. Finally, though our reboxingstrategy added additional steps to the entire image processing procedure, itproved to be quite effective in assuring that the particles were optimallycentered in the boxes.
3. Generating a Starting Model of the Complete
f29 Phage
Considerable effort is often required at the onset of a new project togenerate a reliable, nonbiased model for initiating refinement of particleorigin and orientation parameters. If the head essentially has icosahedralsymmetry (i.e., neglecting the presence of the tail), the random modelmethod (Yan et al., 2007a) provides a relatively straightforward means toobtain a suitable starting model. To this then, one can either graft to onevertex of the icosahedral reconstruction an available reconstructed density
194 Jinghua Tang et al.
map of the tail (Lander et al., 2006) or a very simple, cylindrically averaged3D model constructed from the image of a single, clearly visible tail ( Jianget al., 2006). Even though the tail in the latter instance would not have thecorrect rotational symmetry, it is good enough to jump start refinement.
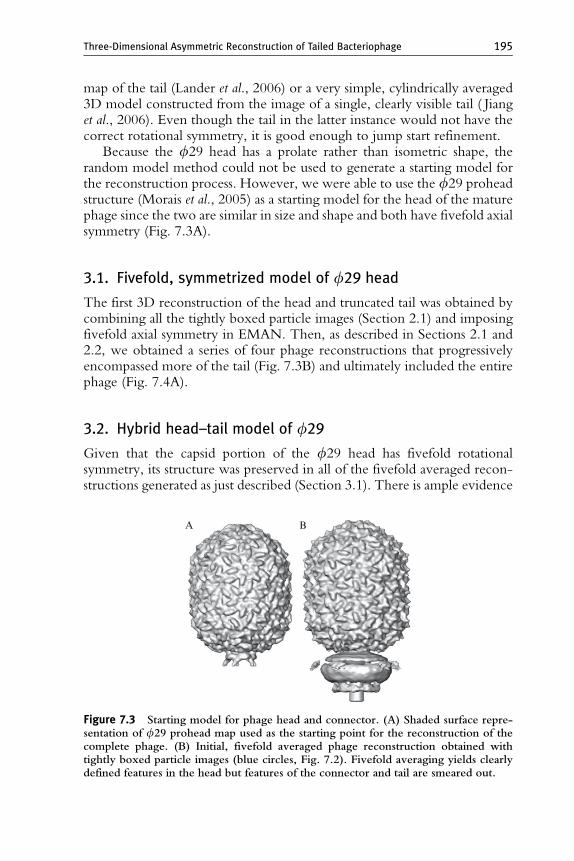
Because the f29 head has a prolate rather than isometric shape, therandom model method could not be used to generate a starting model forthe reconstruction process. However, we were able to use the f29 proheadstructure (Morais et al., 2005) as a starting model for the head of the maturephage since the two are similar in size and shape and both have fivefold axialsymmetry (Fig. 7.3A).
3.1. Fivefold, symmetrized model of f29 head
The first 3D reconstruction of the head and truncated tail was obtained bycombining all the tightly boxed particle images (Section 2.1) and imposingfivefold axial symmetry in EMAN. Then, as described in Sections 2.1 and2.2, we obtained a series of four phage reconstructions that progressivelyencompassed more of the tail (Fig. 7.3B) and ultimately included the entirephage (Fig. 7.4A).
3.2. Hybrid head–tail model of f29
Given that the capsid portion of the f29 head has fivefold rotationalsymmetry, its structure was preserved in all of the fivefold averaged recon-structions generated as just described (Section 3.1). There is ample evidence
A B
Figure 7.3 Starting model for phage head and connector. (A) Shaded surface repre-sentation of f29 prohead map used as the starting point for the reconstruction of thecomplete phage. (B) Initial, fivefold averaged phage reconstruction obtained withtightly boxed particle images (blue circles, Fig. 7.2). Fivefold averaging yields clearlydefined features in the head but features of the connector and tail are smeared out.
Three-Dimensional Asymmetric Reconstruction of Tailed Bacteriophage 195

that the connectors and tail portions of all tailed bacteriophage, includingf29, do not possess fivefold symmetry like the capsids ( Jiang et al., 2006;Lander et al., 2006; Xiang et al., 2006). The presence of a head–tailsymmetry mismatch was also evident in the fivefold averaged f29 recon-struction since features in the head were more distinct and not smeared as inthe tail (Fig. 7.4A). The entire neck and tail of f29 was shown to havequasi-six-fold symmetry (Peterson et al., 2001) and the existence of 12distinct appendages was revealed in some of the very earliest electronmicrographs of negatively stained phage (Anderson et al., 1966). Hence,to establish the rotational symmetry, if any, in the structure of the f29 tail,we used EMAN to recompute the phage reconstruction with imposedthree-, six-, and 12-fold symmetries instead of fivefold. Inspection ofthese three reconstructions showed, as expected, a smeared capsid structurebut tails with features more distinct than in the fivefold averaged map. Thisstrategy works since the head portions of the images have an equally pooragreement with all projections of the model and the assignment of particleorientations becomes influenced most by the tail structure. In addition, thering of appendages near the head–tail junction appeared most distinct in the12-fold symmetrized map (Fig. 7.4B).
At this point we constructed a hybrid model in the following way. Weused the subregion selection tool in Chimera (Pettersen et al., 2004) to segment
A B C
Figure 7.4 Construction of asymmetric, hybrid model. (A) Shaded surface represen-tation of complete phage reconstruction with fivefold symmetry enforced duringprocessing. (B) Same as (A) for phage with 12-fold symmetry. Since the head and taildo not share the same symmetry, these reconstructions smear out the tail and headdensities in panels (A) and (B), respectively. (C) Hybrid model obtained by combininghead from fivefold reconstruction and tail from 12-fold reconstruction. Colors inthe hybrid map highlight contributions from the two symmetrized maps. At this pointthe symmetry mismatch between the head and tail was unknown and no effortwas made to impose a particular rotational alignment between the two segments.
196 Jinghua Tang et al.

out the fivefold symmetrized head portion of the first reconstruction(Fig. 7.4A) and the 12-fold symmetrized tail portion of the second recon-struction (Fig. 7.4B). These separately segmented volumes were then com-bined into a single, hybrid density map (Fig. 7.4C). No attempt was made toimpose any particular rotational alignment of the tail and head segmentedmaps in constructing the hybrid model. Regardless, the exact same hybridmodel was used to produce the final virion and ghost f29 reconstructions,which have tail structures that differ in several ways including the asymmet-ric arrangements of appendage conformations that break the 12-fold axialsymmetry present in the hybrid model (Tang et al., 2008b).
4. Asymmetric Reconstruction of the Entire
f29 Phage
A hybrid density map generated from full resolution image data wasused as input to the second branch of the reconstruction scheme (Fig. 7.1),which began with two cycles of refinement carried out in EMAN. Thisproduced an asymmetric reconstruction of the virion at �30-A resolution.At this point, the use of unbinned data and the abandonment of symmetryaveraging led to no further improvement in resolution and resulted insignificant computational overhead. This failure to reach higher resolutionsdoes not imply there are limitations in the capabilities of EMAN, but morelikely reflects our own lack of expertise with the software.
Our group has developed a set of programs as part of AUTO3DEM thatcan be run efficiently on computer clusters and other parallel computers(Yan et al., 2007b). Most of the underlying programs were designed tohandle cyclic, dihedral, and cubic point group symmetries, but the globalsearch procedure implemented in PPFT is strictly only applicable to spheri-cal particles since it requires particle images and projections of the maps tobe reinterpolated into a series of concentric, circular annuli. We then turnedto FREALIGN (Grigorieff, 2007) to initiate a refinement process that couldbe transitioned relatively easily to AUTO3DEM.
4.1. Origin and orientation determination and refinementwith FREALIGN
The version of FREALIGN available at the time this work on f29 wasbeing performed required that the particle images be combined in a singlestack file. Hence, particle images were first converted from IMAGIC toMRC format using the EMAN proc2d command. Also, to accommodateFREALIGN requirements, the MRC image file header was converted withthe MRC program image_convert.exe.
Three-Dimensional Asymmetric Reconstruction of Tailed Bacteriophage 197

The final map generated from EMANwas used as input to FREALIGN,which provides several modes of operation. We used its global searchprocedure (Mode 3) to assign initial origin and orientation parameters foreach particle image. Also, the matching projection function was enabled toproduce side-by-side comparisons of particle images and correspondingprojections of the current reconstruction. This was carried out for the entiredata set of images and, though somewhat tedious, gave a useful way tovalidate the assigned orientation parameters and to detect and screen outpotentially “bad” particles that failed to align properly to the model.
The accuracy of the particle origins and orientations was further verifiedbecause the resultant cryo-reconstruction computed from the particleimages with these assigned parameters had distinct, easily interpretablefeatures. This was followed by standard refinement and map calculation inFREALIGN (Mode 1) for several more cycles (Fig. 7.1). The asymmetricreconstruction of the entire phage that emerged from this procedurereached a resolution of �25 A. Here, we had ample confidence in thecurrent set of assigned origin and orientation parameters to carry out furtherprocessing steps with AUTO3DEM.
4.2. Origin and orientation refinement in AUTO3DEM
After obtaining estimates of the origins and orientations of all particles and areliable 3D model of the entire phage with FREALIGN, we switched toAUTO3DEM for subsequent processing. AUTO3DEM runs in eitherserial or distributed-memory parallel mode and hence, access to a computercluster can lead to a dramatic improvement in algorithm performance andsignificantly reduced computation time. The program PO2R ( Ji et al., 2006)in AUTO3DEM carries out the Fourier-based origin and orientationrefinement process, and program P3DR (Marinescu and Ji, 2003) computesthe 3D density map from a selected (“best”) set of particle images. Bothprograms can be run with or without symmetry constraints and hence aresuitable for analysis of asymmetric particles like f29.
FREALIGN uses an Euler angle convention (ye, fe, ce) to specifyparticle orientation, whereas AUTO3DEM uses the (ya, fa,oa) conventionfirst described by Finch and Klug (Finch and Klug, 1965) and implementedin the original icosahedral processing programs developed by Crowther(Crowther et al., 1970). We employed the following relationships to con-vert orientation parameters from the FREALIGN convention to that usedin AUTO3DEM:
ya ¼ 180� yefa ¼ ’e � 180
oa ¼ ce � 90
198 Jinghua Tang et al.
Once the above conversions were made, we employed the full capabil-ities of AUTO3DEM refinement to help improve the asymmetric recon-struction of f29 as much as possible with the set of images that wereavailable. AUTO3DEM works to progressively improve the resolution ofany reconstruction by automatically optimizing numerous refinement para-meters. For example, the images are typically band-pass filtered in Fourierspace to limit the data used in comparing images to model projections. Theupper Fourier limit (i.e., highest spatial frequency) included in the next cycleof refinement calculations is slowly increased as long as the resulting recon-struction shows improvement over the previous one. Improvement can bemonitored in a variety of ways, but typically includes conventional Fouriershell correlation procedures (van Heel and Schatz, 2005). Other importantparameters adjusted automatically by AUTO3DEM or manually by the userinclude the step sizes used to define the range of origin and orientationparameters to be tested. Typically, the origin and orientation intervals startout at about 1.0 pixel and 1–2�, respectively, and these are generally reducedwhen refinement stalls (i.e., no longer yields improvement in reconstructionresolution). At the end of refinement the origin and orientation step sizesmight drop to 0.1 pixel and 0.1�, respectively. At even smaller step sizes, theprocess can lead to over-refinement and unreliable resolution estimates, asthe noise in the data can drive refinement (Stewart and Grigorieff, 2004).
Another empirical parameter that we employedwith some success is use ofthe inverse temperature factor (Fernandez et al., 2008; Havelka et al., 1995) toenhance high spatial frequency details in the reconstruction and during particlerefinement (Tang et al., 2008a).We generally did not make use of this strategyuntil the reconstructed density map reached about 10–12 A resolution, atwhich point an initial inverse temperature factor of 1/100 A�2 would beemployed during refinement. As refinement progressed and the resolutionimproved, the sharpening factor would be increased progressively to about 1/400 A�2. It proved important, if not essential, to carefully inspect the 3Ddensity map calculated at the end of each refinement cycle to ensure that thesignal-to-noise of reliably represented features (e.g., tubes of density ascribed toa-helices) did not decrease as this would signify the refinement was beingdriven by the dominant, high frequency noise in the data. A carefully moni-tored, trial and error approach and inverse temperature factors even as low as 1/1200 A�2 were used during the f29 asymmetric refinement.
An additional strategy we used in the f29 asymmetric reconstructionstudy was to mask out the genome density in the reconstructed density map,which is a method that typically improves the refinement of icosahedralviruses (Chen et al., 2009; Yan et al., 2007b; Zhang et al., 2008). Thisprocedure leads to enhancement of reliably represented features in theprojected images of the model and improves the accuracy in determiningparticle parameters. In a similar manner, we used with some success adensity threshold procedure to remove some of the more obvious, random
Three-Dimensional Asymmetric Reconstruction of Tailed Bacteriophage 199

noise in the reconstructed f29 density map. In density maps of icosahedralviruses computed from thousands or more particle images, the noise leveloutside the particle is generally quite low owing to the benefits of the 60-fold symmetry averaging that is an inherent part of the 3D reconstructionprocess. Hence, in an asymmetric reconstruction computed from a compa-rable number of particle images, the average noise level is significantlyhigher throughout the map. We tried a number of different masking andthreshold procedures to zero noise outside the outer envelope of the phageparticle. These are akin to solvent flattening used during the phase extensionstep in X-ray crystallographic studies (Wang, 1985). The technique thatworked best in this instance involved the following steps. A second map wasfirst recalculated at a lower resolution, typically about 20 A. The two mapswere then read into Chimera, which could take the low-resolution map anddefine a surface that enclosed the final, sub-nanometer resolution map.The Chimera mask tool was used to set values of all voxels that lie outsidethe defined surface to zero. This provided an additional enhancement ofthe signal-to-noise in the projections of the model used to correlate with theraw particle images for refinement of their parameters.
5. Analysis and Interpretation of f29Reconstruction
Careful analysis and interpretation of a reconstruction are critical forunderstanding the biology of the viral system, and these also help guide therefinement process by distinguishing genuine structural features from thenoise. The availability of X-ray crystallographic data for individual compo-nents is particularly valuable as it helps in validating the reliability ofthe cryo-reconstruction, determining the significance of various structuralfeatures, and defining the boundaries between individual viral components.
5.1. Model docking
Fitting X-ray crystal structures into cryo-TEM reconstructions to producepseudoatomic models of macromolecular complexes has become a powerfultool in the arsenal of analysis procedures ever since it was first introduced instudies of viruses (Stewart et al., 1993), virus–antibody (Smith et al., 1993;Wang et al., 1992) and virus–receptor (Olson et al., 1993) complexes, andacto-myosin filaments (Rayment et al., 1993). While useful for a widevariety of macromolecular systems, the combination of cryo-TEM andX-ray crystallographic structures can have a particularly profound impacton the study of tailed phages for two main reasons. First, owing to theirshape and size, intact tailed phages resist crystallization and this will likely
200 Jinghua Tang et al.

continue to thwart attempts at obtaining diffraction quality single crystals ofa complete asymmetric phage. Second, the head–tail symmetry mismatchprecludes the imposition of any symmetry and hence limits the resolutionsthat can be achieved. The docking of X-ray models of individual phagecomponents into cryo-reconstructions currently offers the best means forobtaining a pseudoatomic model of the complete phage.
If an X-ray structure of a viral component is available, it is generally arelatively straightforward procedure to dock the atomicmodelmanually intothe reconstructed density map using a variety of interactive programs such asO ( Jones et al., 1991), COOT (Emsley and Cowtan, 2004), and Chimera(Pettersen et al., 2004). After obtaining a reasonable fit of model to density viamanual procedures, one can then quantitatively refine the fit by translatingand rotating the atomicmodel as a rigid body until the correlation coefficientbetween themodel and density map is maximized. This can be accomplishedin numerous programs such as RSREF (Chapman, 1995), SITUS (Wriggersand Birmanns, 2001), EMfit (Rossmann et al., 2001), CoAn (Volkmann andHanein, 2003), and Chimera (Pettersen et al., 2004).
Rigid body docking of thef29 connector (gp10) crystal structure (Guaschet al., 2002) into reconstructions of the prohead, ghost, and mature virionshows that the top of the connector fits well into the cryo-TEM density in allthree cases, but the lower portion of the connector only fits well into theprohead (Fig. 7.5). Ghosts and virions both contain additional proteins thatwere added sequentially during assembly onto the bottom of the connector tocreate a functional tail, and it is clear from the rigid body fits that the attachmentof the tail and packaging of the genome induce conformational changes in theconnector. At the time of this study (Tang et al., 2008b), the existing softwarewas not capable of modifying the crystal structure to better fit the density.
Flexible fitting methods have been developed to permit models to bemodified in various ways to achieve better fits to the cryo-TEM density.
A B C
Figure 7.5 Rigid body fit of gp10 connector crystal structure (magenta ribbon model)and gp8 capsid subunit homology model (red), into f29 density maps (gray). The topportion of the connector fits well into the prohead (A), ghost (B), and virion (C)reconstructions, whereas the lower portion only fits well into the prohead.
Three-Dimensional Asymmetric Reconstruction of Tailed Bacteriophage 201

Tao, Y., Olson, N. H., Xu, W., Anderson, D. L., Rossmann, M. G., and Baker, T. S.(1998). Assembly of a tailed bacterial virus and its genome release studied in threedimensions. Cell 95, 431–437.
Topf, M., Lasker, K., Webb, B., Wolfson, H., Chiu, W., and Sali, A. (2008). Proteinstructure fitting and refinement guided by cryo-EM density. Structure 16, 295–307.
Trabuco, L. G., Villa, E., Mitra, K., Frank, J., and Schulten, K. (2008). Flexible fitting ofatomic structures into electron microscopy maps using molecular dynamics. Structure 16,673–683.
van Heel, M., and Schatz, M. (2005). Fourier shell correlation threshold criteria. J. Struct.Biol. 151, 250–262.
Volkmann, N., and Hanein, D. (2003). Docking of atomic models into reconstructions fromelectron microscopy. Methods Enzymol. 374, 204–225.
Wang, B. C. (1985). Resolution of phase ambiguity in macromolecular crystallography.Methods Enzymol. 115, 90–112.
Wang, G. J., Porta, C., Chen, Z. G., Baker, T. S., and Johnson, J. E. (1992). Identification ofa Fab interaction footprint site on an icosahedral virus by cryoelectron microscopy andX-ray crystallography. Nature 355, 275–278.
Wikoff, W. R., Liljas, L., Duda, R. L., Tsuruta, H., Hendrix, R. W., and Johnson, J. E.(2000). Topologically linked protein rings in the bacteriophage HK97 capsid. Science 289,2129–2133.
Wolf, M., Garcea, R. L., Grigorieff, N., and Harrison, S. C. (2010). Subunit interactions inbovine papillomavirus. Proc. Natl. Acad. Sci. USA 107, 6298–6303.
Wriggers, W., and Birmanns, S. (2001). Using situs for flexible and rigid-body fitting ofmultiresolution single-molecule data. J. Struct. Biol. 133, 193–202.
Xiang, Y., Morais, M. C., Battisti, A. J., Grimes, S., Jardine, P. J., Anderson, D. L., andRossmann, M. G. (2006). Structural changes of bacteriophage f29 upon DNA packag-ing and release. EMBO J. 25, 5229–5239.
Yan, X., Dryden, K. A., Tang, J., and Baker, T. S. (2007a). Ab initio random model methodfacilitates 3D reconstruction of icosahedral particles. J. Struct. Biol. 157, 211–225.
Yan, X., Sinkovits, R. S., and Baker, T. S. (2007b). AUTO3DEM–an automated and highthroughput program for image reconstruction of icosahedral particles. J. Struct. Biol. 157,73–82.
Zhang, X., Jin, L., Fang, Q., Hui, W. H., and Zhou, Z. H. (2010). 3.3 A cryo-EM structureof a nonenveloped virus reveals a priming mechanism for cell entry. Cell 141, 472–482.
Zhang, X., Settembre, E., Xu, C., Dormitzer, P. R., Bellamy, R., Harrison, S. C., andGrigorieff, N. (2008). Near-atomic resolution using electron cryomicroscopy and single-particle reconstruction. Proc. Natl. Acad. Sci. USA 105, 1867–1872.
Zhou, Z. H. (2008). Towards atomic resolution structural determination by single-particlecryo-electron microscopy. Curr. Opin. Struct. Biol. 18, 218–228.
210 Jinghua Tang et al.