three-dimensional conditional random field for the dermal
TRANSCRIPT
HAL Id: hal-02155490https://hal.archives-ouvertes.fr/hal-02155490
Submitted on 13 Jun 2019
HAL is a multi-disciplinary open accessarchive for the deposit and dissemination of sci-entific research documents, whether they are pub-lished or not. The documents may come fromteaching and research institutions in France orabroad, or from public or private research centers.
L’archive ouverte pluridisciplinaire HAL, estdestinée au dépôt et à la diffusion de documentsscientifiques de niveau recherche, publiés ou non,émanant des établissements d’enseignement et derecherche français ou étrangers, des laboratoirespublics ou privés.
Three-dimensional conditional random field for thedermal–epidermal junction segmentation
Julie Robic, Benjamin Perret, Alex Nkengne, Michel Couprie, Hugues Talbot
To cite this version:Julie Robic, Benjamin Perret, Alex Nkengne, Michel Couprie, Hugues Talbot. Three-dimensionalconditional random field for the dermal–epidermal junction segmentation. Journal of Medical Imaging,SPIE Digital Library, 2019, 6 (02), pp.1. �10.1117/1.JMI.6.2.024003�. �hal-02155490�

Three-dimensional conditionalrandom field for the dermal–epidermal junction segmentation
Julie RobicBenjamin PerretAlex NkengneMichel CouprieHugues Talbot
Julie Robic, Benjamin Perret, Alex Nkengne, Michel Couprie, Hugues Talbot, “Three-dimensionalconditional random field for the dermal–epidermal junction segmentation,” J. Med. Imag. 6(2),024003 (2019), doi: 10.1117/1.JMI.6.2.024003.

Three-dimensional conditional random field forthe dermal–epidermal junction segmentation
Julie Robic,a,b,* Benjamin Perret,b Alex Nkengne,a Michel Couprie,b and Hugues TalbotcaClarins Laboratories, Pontoise, FrancebUniversité Paris-Est, LIGM UMR 8049, ESIEE Paris, FrancecCentraleSupelec, Centre de Vision Numérique, INRIA, France
Abstract. The segmentation of the dermal–epidermal junction (DEJ) in in vivo confocal images representsa challenging task due to uncertainty in visual labeling and complex dependencies between skin layers.We propose a method to segment the DEJ surface, which combines random forest classification with spatialregularization based on a three-dimensional conditional random field (CRF) to improve the classification robust-ness. The CRF regularization introduces spatial constraints consistent with skin anatomy and its biologicalbehavior. We propose to specify the interaction potentials between pixels according to their depth and theirrelative position to each other to model skin biological properties. The proposed approach adds regularity tothe classification by prohibiting inconsistent transitions between skin layers. As a result, it improves thesensitivity and specificity of the classification results. © 2019 Society of Photo-Optical Instrumentation Engineers (SPIE) [DOI:10.1117/1.JMI.6.2.024003]
Keywords: in vivo microscopy; reflectance confocal microscopy; machine learning; biomedical imaging.
Paper 18250RR received Nov. 12, 2018; accepted for publication Apr. 4, 2019; published online Apr. 29, 2019.
1 IntroductionIn this paper, we address the problem of segmenting the dermal–epidermal junction (DEJ) in in vivo reflectance confocal micros-copy (RCM) using a three-dimensional (3-D) conditionalrandom field (CRF) model.
The DEJ is a complex, surface-like, 3-D boundary separatingthe epidermis from the dermis. Its peaks and valleys, calleddermal papillae, are due to projections of the dermis into theepidermis. The DEJ undergoes multiple changes under patho-logical or aging conditions. Alterations of the epidermal anddermal layers induce a flattening of the DEJ,1,2 reducing thesurface for exchange of water and nutrient from the dermis tothe epidermis.
RCM is a powerful tool for noninvasively assessing skinarchitecture and associated cytology. RCM images provide arepresentation of the skin at the cellular level, with melanin andkeratin working as natural autofluorescent agents.3 Pellacaniet al.4 have shown that the use of RCM can improve the diag-nosis of pathological lesions, while reducing the number ofunnecessary excisions. However, the review of confocal imagesby trained dermatologists requires a lot of time and expertise.Several approaches to automate confocal skin image analysishave been proposed. In this context, they focus on quantifyingthe epidermal state,5 performing computer-aided diagnostic ofskin lesions,6 or on identifying the layers of human skin.7–9
One particularly difficult point is the visualization of theDEJ, which is hard to identify purely by visual means. Infair skin, the DEJ can have multiple patterns. It can appearas an amorphous and low-contrasted structure or as circularrings, which correspond to the two-dimensional vertical viewof a dermal papillae (see Fig. 1). Automating the DEJ segmen-tation makes it easier for clinicians to locate it and opens the way
to quantitatively characterize its appearance. It could furtherimprove the diagnosis of pathological lesions and could alsoresult in a better understanding of the skin physiologicalresponse toward aging or other environmental conditions.
1.1 Related Work
As the DEJ appearance varies significantly and its contrast canbe low, the precise localization of the DEJ is difficult. Therefore,in practice ground truth annotations often consist of three thicklayers: the epidermis (E), an uncertain area containing the DEJ(U), and the dermis (D). There exist different approaches todelineate skin strata in RCM, which can be divided two maingroups: on one hand, finding a continuous 3-D boundarybetween the layers of the skin, which implies a pixel-level clas-sification, and on the other hand, performing an image-levelclassification to estimate the location of the transitions betweenlayers.
Kurugol et al.7 proposed a machine learning-based methodusing textural features to automatically locate the DEJ location.They reproduce the key aspects of human visual expertise,which relies on texture and contrast differences between layersof the epidermis and dermis, in order to locate the DEJ. Theyused an LS-SVM method, a variant of support vector machine(SVM), which takes into account the expected similaritybetween neighboring tiles within images to include spatial rela-tionship between neighbors and to increase robustness. Theyalso propose a second approach, which incorporates a math-ematical shape model for the DEJ using a Bayesian model.10
The DEJ shape is modeled using a marked Poisson process.Their model can account for uncertainty in number, location,shape, and appearance of the dermal papillae. Their main focusis to find the location of the DEJ rather than to study its shape.
*Address all correspondence to Julie Robic, E-mail: [email protected] 2329-4302/2019/$25.00 © 2019 SPIE
Journal of Medical Imaging 024003-1 Apr–Jun 2019 • Vol. 6(2)
Journal of Medical Imaging 6(2), 024003 (Apr–Jun 2019)

Hames et al.9 addressed the problem of identifying all of theanatomical strata of human skin using a one-dimensional (1-D)linear chain conditional random field and structured SVMs tomodel the skin structure. They show an improvement in theclassification scores with the use of such a model. However,their 1-D linear chain does not take advantage of the 3-Dorganization of the skin structure to regularize their outputsegmentation.
The following methods perform an image-level classificationinstead of a pixel-level classification.
Somoza et al.11 used an unsupervised clustering method toclassify a whole en-face image as a single distinct layer, result-ing in a good correlation between human classification and auto-mated assessment. However, the classification assumes that eachimage contains a single class, and therefore does not allow tocapture the complex shape of the DEJ.
Kaur et al.12 used a hybrid of classical methods in texturerecognition and recent deep learning methods, which givesgood results on a moderate size database of 15 stacks. They clas-sify each confocal image as one of the skin layers. They intro-duce a hybrid deep learning approach which uses traditionalfeature vectors as input to train a deep neural network.
Bozkurt et al.13 proposed the use of deep-recurrent conven-tional neural networks (RNN)14,15 to delineate the skin strata.The dataset used in this study is composed of 504 RCM stacks.Each confocal image is labeled in one of three classes: epider-mis, DEJ, or dermis. They make the assumption that the skinlayers are ordered with depth: the epidermis is the top layerof the skin, followed by the DEJ and the dermis. The use ofdeep RNN on a large dataset allows them to take the sequentialdependencies between different images into account. They havetrained numerous models with varying networks architectures toovercome the computational memory issues. This approach ispotentially more flexible, as it provides the model with the com-plete RCM stack and allows it to learn what information is use-ful for slice-wise classification. With partial sequence training,the authors showed no improvement when enlarging the neigh-borhood of images around the RCM image to be classified.Bozkurt et al.16 added a soft attention mechanism in order theget information about which images the network pays attentionto which making a decision.
Due to the uncertainty in visual labeling and intersubjectvariability, state-of-the-art methods tend to combine texturalinformation and prior information on the DEJ shape, eitherby modeling the DEJ shape or by using a regularization ofthe segmentation through depth. The use of an RNN enablesthe representation of the dependencies between images.
Most methods focus on the localization of the DEJ in depth,with no consideration toward the characterization of its shape.Our goal is to segment the DEJ shape in order to quantifythe modifications it undergoes during aging. In order to do so,we aim to combine textural information and 3-D dependenciesbetween pixels within an RCM stack to perform a pixel-levelsegmentation.
Graphical models appear to be well-adapted and useful toolstoward this purpose.
1.2 Modeling with Conditional Random Fields
Segmenting boundaries of interest in 3-D microscopy imagesare often challenging due to high intra- and intersubject (orspecimen) variability and the complexity of the boundary struc-tures. This task involves predicting a large number of variables(each image pixel is a variable) that depend on each other as wellas on other observed variables. In this paper, we address theproblem of segmenting the DEJ, a complex 3-D structure,imaged using in vivo RCM.
The way output variables depend on each other can be rep-resented by graphical models, which include various classes ofBayesian networks, factor graphs, Markov random fields, andconditional random fields.
Most works in graphical models have focused on modelsthat explicitly attempt to model a joint probability distributionpðyjxÞ, where y and x are random variables, respectively, rang-ing over observations and their corresponding label sequences.These models are fully generative, and they identify dependentvariables and define the strength of their interactions. Thedependencies between features can be quite complex, and theconstruction of the probability distribution over them can bechallenging.
A solution to this problem is the modeling of a conditionaldistribution. This is the approach taken by CRF.17 A detailedreview can be found in Sutton et al.18 Conditional random fields
(a) (b)
Fig. 1 Examples of different DEJ patterns. The circular rings pattern in (a) provides an easy identificationof the DEJ compared to the uncertain one in (b). However, the latter one is the most frequent, especiallyon the cheeks.
Journal of Medical Imaging 024003-2 Apr–Jun 2019 • Vol. 6(2)
Robic et al.: Three-dimensional conditional random field for the dermal–epidermal. . .

are popular techniques for image labeling because of theirflexibility in modeling dependencies between neighbors andimage features. Linear chain CRFs are the simplest and themost widely used. They have become very popular in naturallanguage processing19,20 and bioinformatics.21 Applications ofCRFs have also extended the use of graphical structures in com-puter vision.22,23 Medical imaging has been a field of interest inapplying CRFs to many segmentation problems such as brainand liver tumor segmentation.24,25
1.3 Contribution
Our approach consists of designing a 3-D conditional randomfield, which allows us to provide a spatial regularization onlabel distribution and to model skin biological properties.Our emphasis lies on exploiting the additional depth and 3-Dinformation of the skin architecture. To our knowledge, thisis the first method to include 3-D spatial relationships and toincorporate prior information about the global skin architecture.
We aim to segment the confocal images in three classes: epi-dermis (E), uncertain (U), and dermis (D). Our approach startswith a random forest (RF) classifier, providing the probabilitiesof a pixel to belong to one of these three classes, with noassumptions on the dependencies between pixels. The RF outputencodes the textural information and gets in the CRF potentials.
The CRF model parameterization is inspired by prior infor-mation on the skin structure. The skin architecture is modeledby the conditional relationship between pixels. The relationsbetween pixel neighbors mimic the skin layers behavior in3-D by imposing a specified potential function according totheir depth and their relative position to each other. The CRFpotentials are learned from annotated skin RCM data. TheCRF model allows us not only to incorporate resemblancebetween neighbors, but also to specify biological information.
We present several experiments, proving the benefit of theadapted CRF potentials to model the skin properties comparedto more standard CRF parameterization strategies and to state-of-the-art methods.
2 Conditional Random FieldsAn image I consists of M pixels i ∈ S ¼ ½1;M� with observeddata yi, i.e., y ¼ ðy1; y2; : : : ; yMÞ. Pixels are organized in layers(en-face images) forming a 3-D structure. We want to assigna discrete label xi to each pixel i from a given set of classesC ¼ fE;U;Dg. The classification problem can be formulatedas finding the configuration x̂ that maximizes pðxjyÞ, the pos-terior probability of the labels given the observations.
A CRF is a model of pðxjyÞ that can be represented withan associated graph G ¼ ðV;EÞ, where V is the set of verticesrepresenting the image pixels and E the set of edges modelingthe interaction between neighbors.26 Here E is the usual 3-Dsix-connectivity.
We use a model with pairwise interactions defined by
EQ-TARGET;temp:intralink-;e001;63;171pðxjyÞ ∝Y
i∈Sφiðxi; yÞ ×
Y
ði;jÞ∈Eψ ijðxi; xj; yÞ; (1)
where φiðxi; yÞ is the node potential linking the observations tothe class label at pixel i, and ψ ijðxi; xj; yÞ is the interactionpotentials modeling the dependencies between the labels oftwo neighboring pixels i and j.
The CRF model is represented in Fig. 2.
In this paper, we propose to specify the CRF potentials inorder to incorporate biological information. The skin layersare strictly ordered according to their depth. The epidermis isthe top skin layer, followed by the uncertain area (containingthe DEJ) and then by the dermis. Therefore, a pixel locatednear the surface will have a higher probability to belong tothe epidermis than to the uncertain area or to the dermis. TheCRF potentials are defined in order to forbid the incoherenttransitions between layers.
The CRF parameters are depth-dependent. We define D theset of all depths of the image I. For each d ∈ D, we define:
• Sd is the set of pixels at depth d,
• Ed is the set of edges at depth d,
• Ed→d�1 is the set of edges between depth d and dþ 1,resp. d − 1.
The notation 1x¼c represents the indicator function, whichtakes the values 1 when x ¼ c and 0 otherwise. We denoteby xT the transposed vector of x. The operators ∘ and · denote,respectively, the Hamadar product (element-wise multiplication)and the dot (or scalar) vector product.
2.1 Node Potential
The node potential is defined as the probability of a label xi totake a value c given the observed data y, that is:
EQ-TARGET;temp:intralink-;e002;326;260φiðxi ¼ c; yÞ ¼ p½xi ¼ cjf iðyÞ�; (2)
with f iðyÞ a feature vector computed at pixel i from theobserved data.
In our case, each node potential φiðxi; yÞ is associatedwith the predicted class probability vector f iðyÞ produced byan RF classifier.27 The node potentials φiðxi; yÞ are linked bythe relation
EQ-TARGET;temp:intralink-;e003;326;163
Y
i∈Sφiðxi ¼ c; yÞ ¼
Y
d∈D
Y
i∈Sd
1xi¼c ∘ θd · f iðyÞT: (3)
The parameter θd ¼ ðθepidermis; θuncertain; θdermisÞ balances thebias introduced by labels appearing more often in the trainingdata, i.e., the epidermal and the dermal one.
Fig. 2 Three-dimensional CRFmodelization. The set of nodes in grayand in white belong to two different en-face sections. The edge poten-tials of each en-face sections ψ jk [Eq. (3)] are learned at each depth.Edge potentials between en-face sections ψ i j [Eq. (3)] impose biologi-cal transition constraints.
Journal of Medical Imaging 024003-3 Apr–Jun 2019 • Vol. 6(2)
Robic et al.: Three-dimensional conditional random field for the dermal–epidermal. . .

The feature vector f iðyÞ is a 1 × 3 vector of probability for apixel to belong to each label. It is produced by an RF classifier27
along with bootstrap aggregating and feature bagging.Features are computed within a 50 × 50 pixel window,
which is large enough to include two epidermal cells formingthe epidermal honeycomb pattern as their diameter varies from15 to 35 μm. We use the following well-known textural featuresinspired by Ref. 7:
1. First- and second-order statistics. We calculate statis-tical metrics mean, variance, skewness, and kurtosis.
2. Power spectrum28 of the window.
3. Gray level co-occurrence matrix contrast, energy, andhomogeneity.29 The features are calculated for fourorientations (0 deg, 45 deg, 90 deg, and 135 deg).
4. Gabor response filter output.30,31 We compute a bankof Gabor filters with four levels of frequency and fourorientations. As features, the local energy and themean amplitude of the response are used.
We propose new features to estimate the distance of thecurrent pixel to the DEJ.
The Laplacian is related to the curvature of intensity changes.In classical edge detection theory,32 the zero-crossings ofthe Laplacian indicate contour locations. High values in theLaplacian are also associated with rapid intensity changes. TheDEJ is an amorphous area compared to the epidermis, whichappears as a honeycomb pattern, and to the dermis, which con-tains collagen fibers. Thus we expect low values in the Laplacianvariance32 in confocal sections around the DEJ location. For apixel i at a given confocal section p, we calculate the Laplacianvariance for every confocal section at its location.
A feature vector is computed containing the Laplacian vari-ance at pixel i coordinates at all depths. The pixel i is charac-terized by its distance along the z axis to its closest minimum inthe feature vector. We add to the set of features: the Laplacianvariance of pixel i, its distance to its closest minimum as
described above and the features (Laplacian variance and depth)of its closest minimum within the Laplacian feature vector.An example is presented in Fig. 3. The distance to the closestminimum is expressed as the product of the number of confocalimages to the closest minimum and the step that has been set forthe 3-D acquisition. It is thus expressed in micrometer. For agiven acquisition protocol, the distance to the closest minimumshould be adjusted by the step parameter.
These features were chosen for their ability to discriminatetexture from blurry patterns, which mostly corresponds to theDEJ pattern. The ringed DEJ pattern can be identified via itsstrong contrast and specific spatial arrangement. A summary ofthe proposed features is presented in Table 1.
2.2 Interaction Potential
The interaction potential describes how likely xi is to take thevalue c given the label c 0 of one of its neighboring pixel j:
EQ-TARGET;temp:intralink-;e004;326;358ψ ijðxi ¼ c; xj ¼ c 0; yÞ ¼ pðxi ¼ cjxj ¼ c 0Þ: (4)
Prior information on skin structure is essential to determineefficiently the interaction potentials in our CRF model. Theinteraction potentials are modeled by a 3 × 3matrix representingthe transition probabilities between classes.
We define two types of transitions: the transitions withina layer referred to as Hd, which are symmetrical and depth-dependent and the transitions interlayers Vþd and V−d, whichare directional and also depth-dependent.
The product of the pairwise interaction potentialsψ ijðxi; xj; yÞ is expressed asEQ-TARGET;temp:intralink-;e005;326;217 Y
ði;jÞ∈Eψ ijðxi ¼ c; xj ¼ c 0; yÞ ¼
Y
d∈D
Y
ði;jÞ∈Ed
1xi¼c · Hd · 1Txj¼c 0
∘Y
ði;jÞ∈Ed→dþ1
1xi¼c · Vþd · 1Txj¼c 0
∘Y
ði;jÞ∈Ed→d−1
1xi¼c · V−d · 1Txj¼c 0 : (5)
2.2.1 Within-layer interaction potential
The within-layer interaction potentialHd models the behavior ofthe skin at a given depth. We know that several skin layers can
Fig. 3 Laplacian variance and distance to the closest minimum for apixel between 20 and 120 μm. The blue line represents the Laplacianvariance at coordinates ði ; jÞ at all depths. The dashed vertical linesmark the position of the minimum of the Laplacian variance. The redline corresponds to the distance to the closest minimum.
Table 1 Set of the 52 features used to produce the node potentials.
Feature typeNumber offeatures Presumed use
Statistics 4 Low intensity of the blurry DEJ pattern
Power spectrum 1 Low intensity of the blurry DEJ pattern
Gray-level co-occurrence matrix
12 Epidermal pattern and ringedDEJ pattern
Gabor output filter 32 Blurry pattern of the DEJ, epidermal,and dermal contrasted pattern
Laplacian 3 Blurry pattern of the DEJ andits location in depth
Journal of Medical Imaging 024003-4 Apr–Jun 2019 • Vol. 6(2)
Robic et al.: Three-dimensional conditional random field for the dermal–epidermal. . .
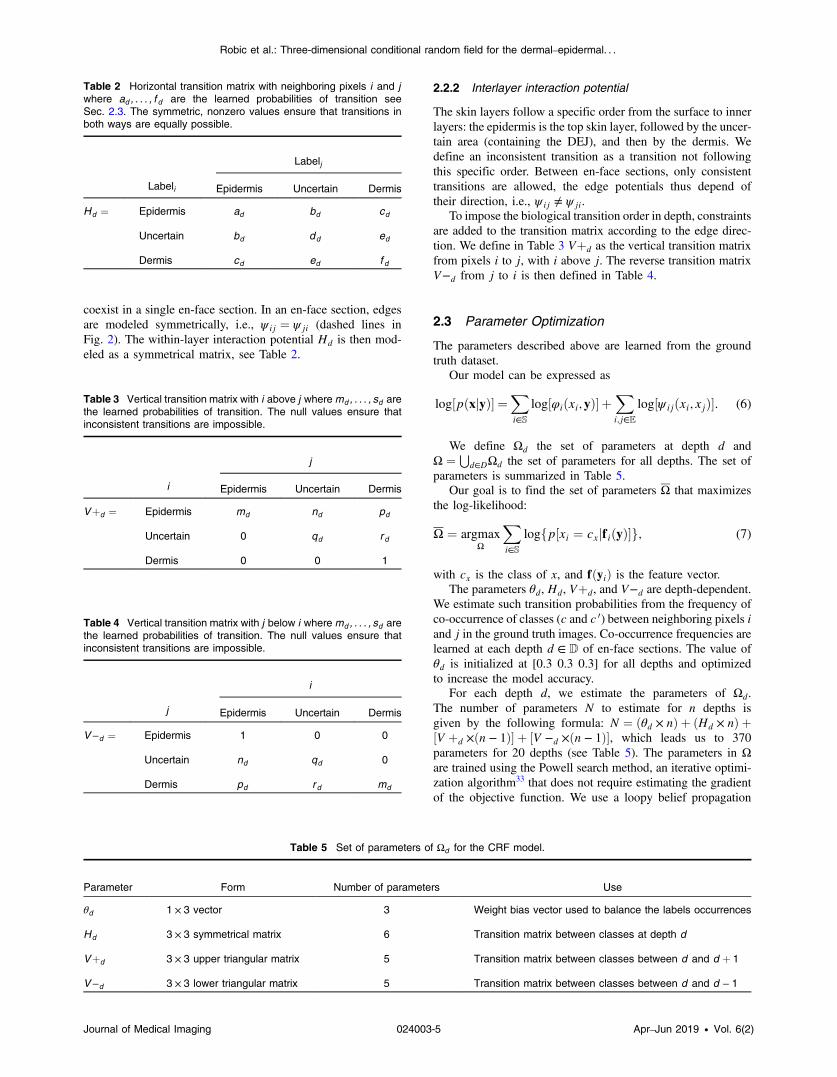
coexist in a single en-face section. In an en-face section, edgesare modeled symmetrically, i.e., ψ ij ¼ ψ ji (dashed lines inFig. 2). The within-layer interaction potential Hd is then mod-eled as a symmetrical matrix, see Table 2.
2.2.2 Interlayer interaction potential
The skin layers follow a specific order from the surface to innerlayers: the epidermis is the top skin layer, followed by the uncer-tain area (containing the DEJ), and then by the dermis. Wedefine an inconsistent transition as a transition not followingthis specific order. Between en-face sections, only consistenttransitions are allowed, the edge potentials thus depend oftheir direction, i.e., ψ ij ≠ ψ ji.
To impose the biological transition order in depth, constraintsare added to the transition matrix according to the edge direc-tion. We define in Table 3 Vþd as the vertical transition matrixfrom pixels i to j, with i above j. The reverse transition matrixV−d from j to i is then defined in Table 4.
2.3 Parameter Optimization
The parameters described above are learned from the groundtruth dataset.
Our model can be expressed as
EQ-TARGET;temp:intralink-;e006;326;539 log½pðxjyÞ� ¼X
i∈Slog½φiðxi;yÞ� þ
X
i;j∈Elog½ψ ijðxi; xjÞ�: (6)
We define Ωd the set of parameters at depth d andΩ ¼ S
d∈DΩd the set of parameters for all depths. The set ofparameters is summarized in Table 5.
Our goal is to find the set of parameters Ω that maximizesthe log-likelihood:
EQ-TARGET;temp:intralink-;e007;326;443Ω ¼ argmaxΩ
X
i∈Slogfp½xi ¼ cxjf iðyÞ�g; (7)
with cx is the class of x, and fðyiÞ is the feature vector.The parameters θd, Hd, Vþd, and V−d are depth-dependent.
We estimate such transition probabilities from the frequency ofco-occurrence of classes (c and c 0) between neighboring pixels iand j in the ground truth images. Co-occurrence frequencies arelearned at each depth d ∈ D of en-face sections. The value ofθd is initialized at [0.3 0.3 0.3] for all depths and optimizedto increase the model accuracy.
For each depth d, we estimate the parameters of Ωd.The number of parameters N to estimate for n depths isgiven by the following formula: N ¼ ðθd × nÞ þ ðHd × nÞ þ½V þd ×ðn − 1Þ� þ ½V −d ×ðn − 1Þ�, which leads us to 370parameters for 20 depths (see Table 5). The parameters in Ωare trained using the Powell search method, an iterative optimi-zation algorithm33 that does not require estimating the gradientof the objective function. We use a loopy belief propagation
Table 2 Horizontal transition matrix with neighboring pixels i and jwhere ad ; : : : ; f d are the learned probabilities of transition seeSec. 2.3. The symmetric, nonzero values ensure that transitions inboth ways are equally possible.
Labeli
Labelj
Epidermis Uncertain Dermis
Hd ¼ Epidermis ad bd cd
Uncertain bd dd ed
Dermis cd ed f d
Table 3 Vertical transition matrix with i above j wheremd ; : : : ; sd arethe learned probabilities of transition. The null values ensure thatinconsistent transitions are impossible.
i
j
Epidermis Uncertain Dermis
Vþd ¼ Epidermis md nd pd
Uncertain 0 qd r d
Dermis 0 0 1
Table 4 Vertical transition matrix with j below i wheremd ; : : : ; sd arethe learned probabilities of transition. The null values ensure thatinconsistent transitions are impossible.
j
i
Epidermis Uncertain Dermis
V−d ¼ Epidermis 1 0 0
Uncertain nd qd 0
Dermis pd r d md
Table 5 Set of parameters of Ωd for the CRF model.
Parameter Form Number of parameters Use
θd 1 × 3 vector 3 Weight bias vector used to balance the labels occurrences
Hd 3 × 3 symmetrical matrix 6 Transition matrix between classes at depth d
Vþd 3 × 3 upper triangular matrix 5 Transition matrix between classes between d and d þ 1
V−d 3 × 3 lower triangular matrix 5 Transition matrix between classes between d and d − 1
Journal of Medical Imaging 024003-5 Apr–Jun 2019 • Vol. 6(2)
Robic et al.: Three-dimensional conditional random field for the dermal–epidermal. . .

method to estimate pðxjyÞ. The computation is done using thelibrary developed in DGM Lib.34
3 Experimentation
3.1 Database
Image acquisition was carried out on the cheek to furtherassess chronological aging. RCM images were acquired using anear-infrared reflectance confocal laser scanning microscope(Vivascope 1500; Lucid Inc., Rochester, New York).35 On eachimaged site, stacks were acquired from the skin surface tothe reticular dermis with a step of 5 μm. Our dataset consistsof 23 annotated stacks of confocal images acquired from15 healthy volunteers, with 1.5� 0.5 stacks/subject, withphototypes from I to III,36 i.e., from volunteers whose skinstrongly reacts to sun-exposure. As melanin is a strong contrastagent in confocal images, confocal images of fair skin representthe most challenging analysis compared to higher melanincontent. The more melanin, the more contrasted skin confocalpatterns.
Neither cosmetic products nor skin treatment was allowed onthe day of the acquisitions. Appropriate consent was obtainedfrom all subjects before imaging. Visual labeling of the DEJis not easy to perform even for experts. An expert, whose grad-ing had been previously validated, delineated the stacks in threezones: epidermis (E), uncertain (U), and dermis (D) (see Fig. 1).We segmented confocal images between depths 20 and 120 μm,the images above 20 μm belonging to the epidermis with highconfidence. We used a subject-wise 10-fold cross validation testto evaluate the segmentation results. In order to compare theresults, the same subdataset is used for both the training andtesting parts for all the experiments. As several stacks acquiredfrom one subject can contribute to the annotation dataset,stacks acquired from the same subject are not considered asindependant data. Therefore, a subject-wise cross-validation isconducted, i.e., one subject cannot belong to both the trainingand testing sets at each fold.
3.2 Feature Evaluation
To evaluate our proposed set of features used for the RF clas-sification, we compare the mean accuracy of our classificationresults to the state-of-the-art methods. The mean accuracies ofthe RF classifications are presented in Table 6. Kurugol et al.7
achieved 64%, 41%, and 75% of correct classification of tiles forepidermis, transition region, and dermis, respectively. Hameset al.9 achieved 82%, 78%, and 88% of correct classificationfor the epidermis, DEJ, and dermis, respectively. With the
proposed set of features, we were able to achieve 90%, 54%,and 75% accuracy, respectively, for the epidermal, uncertainarea, and dermal classification. These results suggest that ourset of features is relevant to identify the three skin labels accord-ing to the visual inspection by experts. However, the result ofour initial classification still contains 11% of inconsistenttransitions (not following the expected biological order), seeTable 10, motivating the introduction of spatial constraintswith the CRF regularization.
3.3 CRF Parameters Evaluation
To evaluate the chosen parameters, we compare three cases:
1. CRF2-D is the CRF with only horizontal regularization.Each confocal section is regularized independentlyusing the horizontal transition matrix Hd.
2. CRF3-DSym is the CRF with horizontal regularizationHd and symmetrical vertical regularization, i.e.,Vþd ¼ V−d.
3. CRF3DAsym is the CRF with horizontal regularizationHd and asymmetrical vertical regularization, i.e.,Vþd ≠ V−d. This is our proposed model where theskin layers order is imposed.
The global accuracies, presented in Table 7, for the threeexperiments are comparable. We also achieve a high specificityfor the three classes (above 0.90%), see Table 8. TheCRF3-DAsym parameterization allows us to increase the sensitiv-ity of the uncertain area classification, compared to CRF2-D andCRF3-DSym, while maintaining the epidermal and dermal sensi-tivity above 0.90%, see Table 9.
Table 6 Results for the unregularized experiments. Mean accuracyof the RF classifications of the three labels. The RF classification pro-vides the node potentials for the CRF model.
Epidermis Uncertain DermisNumber ofRCM stacks
Proposed features 0.90 0.54 0.75 23
Kurugol et al.7 0.64 0.41 0.75 15
Hames et al.9 0.82 0.78 0.88 308
Table 7 Global accuracy percentage for the three regularizationschemes.
Accuracy
RF 78
RFþ CRF2-D 85
RFþ CRF3-DSym 85
RFþ CRF3-DAsym 86
Table 8 Specificity of the three labeling in the regularized cases.
Specificity
Epidermis Uncertain Dermis
CRF2-D 0.90 0.89 0.93
CRF3-DSym 0.94 0.92 0.95
CRF3-DAsym 0.96 0.92 0.95
Journal of Medical Imaging 024003-6 Apr–Jun 2019 • Vol. 6(2)
Robic et al.: Three-dimensional conditional random field for the dermal–epidermal. . .

We have defined an inconsistent transition as a transitionbetween skin layers, which does not follow the biologicalorder. The resulting segmentation with CRF2-D contains18% of inconsistent transitions. CRF3-DSym still contains 4%
of inconsistent transition, whereas CRF3-DASym containsnone. The inconsistent transitions’ percentages are presentedin Table 10.
Examples of resulting segmentations at two following depthsare presented in Figs. 4 and 5. A direct classification after fea-tures calculation leads to a misclassification and inconsistenttransitions between classes. The positive impact of our CRFmodel is noticeable. Moreover, the computation of the DEJsegmentation only takes a few minutes per stack on a commoncomputer, which enables the use of its use in large-scale analysisand clinical studies.
One can notice that the optimization of the parameter set Ωimproves the sensitivity of the uncertain area classificationfrom 66% to 68% and the epidermal and dermal specificityup to 95%.
3.4 Comparison to State-of-the-Art Methods
We compare our results to the state-of-the-art methods. Theresults presented below should be considered with caution,because of the differences in labeling and dataset size.
Global accuracy of our model is similar to state-of-the-art methods. The sensitivity and specificity results of theregularized CRF model are presented in Tables 11 and 12.The specificity results obtained by Kurugol et al.7 are notavailable.
Deep learning methods by Bozkurt et al.16 and Kauret al.12 seem to also take into account the dependencies betweenimages to perform the classification, the author did not observeany incoherent transitions, but the regression might lackinterpretability.
Fig. 4 Segmentations at depth d : epidermis (red), uncertain (yellow), dermis (blue). (a) Annotated imageat depth d , (b) RF at depth d , (c) CRF2-D at depth d , (d) CRF3-DSym at depth d , and (e) CRF3-DAsym atdepth d . The addition of constraints into the CRF model improves the accuracy of the segmentation.
Table 10 Percentage of inconsistent transitions between the skinlayers. Epidermis, E; uncertain, U; and dermis, D.
U → E D → U D → E Total (%)
RF 0.6 2 3 11
RFþ CRF2-D 7 3 8 18
RFþ CRF3-DSym 0 4 0 4
RFþ CRF3-DAsym 0 0 0 0
Table 9 Sensitivity of the three labeling in the regularized cases.
Sensitivity
Epidermis Uncertain Dermis
CRF2-D 0.90 0.63 0.83
CRF3-DSym 0.91 0.55 0.90
CRF3-DAsym 0.90 0.68 0.93
Journal of Medical Imaging 024003-7 Apr–Jun 2019 • Vol. 6(2)
Robic et al.: Three-dimensional conditional random field for the dermal–epidermal. . .
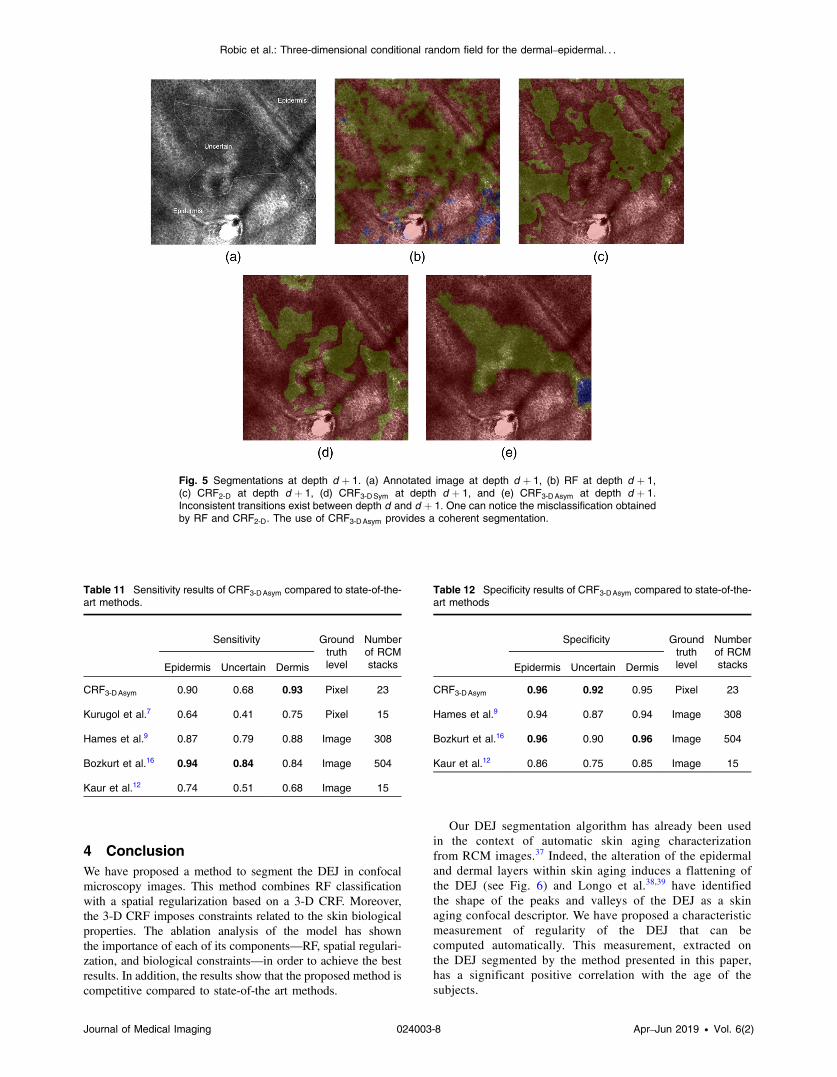
4 ConclusionWe have proposed a method to segment the DEJ in confocalmicroscopy images. This method combines RF classificationwith a spatial regularization based on a 3-D CRF. Moreover,the 3-D CRF imposes constraints related to the skin biologicalproperties. The ablation analysis of the model has shownthe importance of each of its components—RF, spatial regulari-zation, and biological constraints—in order to achieve the bestresults. In addition, the results show that the proposed method iscompetitive compared to state-of-the art methods.
Our DEJ segmentation algorithm has already been usedin the context of automatic skin aging characterizationfrom RCM images.37 Indeed, the alteration of the epidermaland dermal layers within skin aging induces a flattening ofthe DEJ (see Fig. 6) and Longo et al.38,39 have identifiedthe shape of the peaks and valleys of the DEJ as a skinaging confocal descriptor. We have proposed a characteristicmeasurement of regularity of the DEJ that can becomputed automatically. This measurement, extracted onthe DEJ segmented by the method presented in this paper,has a significant positive correlation with the age of thesubjects.
Table 11 Sensitivity results of CRF3-DAsym compared to state-of-the-art methods.
Sensitivity Groundtruthlevel
Numberof RCMstacksEpidermis Uncertain Dermis
CRF3-DAsym 0.90 0.68 0.93 Pixel 23
Kurugol et al.7 0.64 0.41 0.75 Pixel 15
Hames et al.9 0.87 0.79 0.88 Image 308
Bozkurt et al.16 0.94 0.84 0.84 Image 504
Kaur et al.12 0.74 0.51 0.68 Image 15
Table 12 Specificity results of CRF3-DAsym compared to state-of-the-art methods
Specificity Groundtruthlevel
Numberof RCMstacksEpidermis Uncertain Dermis
CRF3-DAsym 0.96 0.92 0.95 Pixel 23
Hames et al.9 0.94 0.87 0.94 Image 308
Bozkurt et al.16 0.96 0.90 0.96 Image 504
Kaur et al.12 0.86 0.75 0.85 Image 15
Fig. 5 Segmentations at depth d þ 1. (a) Annotated image at depth d þ 1, (b) RF at depth d þ 1,(c) CRF2-D at depth d þ 1, (d) CRF3-DSym at depth d þ 1, and (e) CRF3-DAsym at depth d þ 1.Inconsistent transitions exist between depth d and d þ 1. One can notice the misclassification obtainedby RF and CRF2-D. The use of CRF3-DAsym provides a coherent segmentation.
Journal of Medical Imaging 024003-8 Apr–Jun 2019 • Vol. 6(2)
Robic et al.: Three-dimensional conditional random field for the dermal–epidermal. . .

DisclosuresNo conflicts of interest, financial or otherwise, are declared bythe authors.
References1. R. M. Lavker, P. Zheng, and G. Dong, “Aged skin: a study by light,
transmission electron, and scanning electron microscopy,” J. invest.Dermatol. 88, 44s–51s (1987).
2. L. Rittié and G. J. Fisher, “Natural and sun-induced aging of humanskin,” Cold Spring Harbor Perspect. Med. 5(1), a015370 (2015).
3. P. Calzavara-Pinton et al., “Reflectance confocal microscopy for in vivoskin imaging,” Photochem. Photobiol. 84(6), 1421–1430 (2008).
4. G. Pellacani et al., “Reflectance confocal microscopy as a second-level examination in skin oncology improves diagnostic accuracy andsaves unnecessary excisions: a longitudinal prospective study,” Br. J.Dermatol. 171(5), 1044–1051 (2014).
5. J. Robic et al., “Automated quantification of the epidermal aging proc-ess using in-vivo confocal microscopy,” in IEEE 13th Int. Symp.Biomed. Imaging (ISBI), IEEE, pp. 1221–1224 (2016).
6. K. Kose et al., “A machine learning method for identifying morphologi-cal patterns in reflectance confocal microscopy mosaics of melanocyticskin lesions in-vivo,” Proc. SPIE 9689, 968908 (2016).
7. S. Kurugol et al., “Automated delineation of dermal–epidermal junctionin reflectance confocal microscopy image stacks of human skin,”J. Invest. Dermatol. 135(3), 710–717 (2015).
8. J. Robic et al., “Classification of the dermal–epidermal junction usingin-vivo confocal microscopy,” in IEEE 14th Int. Symp. Biomed. Imaging(ISBI 2017), IEEE, pp. 252–255 (2017).
9. S. C. Hames et al., “Automated segmentation of skin strata in reflectanceconfocal microscopy depth stacks,” PloS One 11(4), e0153208(2016).
10. S. Ghanta et al., “A marked Poisson process driven latent shape modelfor 3d segmentation of reflectance confocal microscopy image stacks ofhuman skin,” IEEE Trans. Image Process. 26(1), 172–184 (2017).
11. E. Somoza et al., “Automatic localization of skin layers in reflectanceconfocal microscopy,” Lect. Notes Comput. Sci. 8815, 141–150 (2014).
12. P. Kaur et al., “Hybrid deep learning for reflectance confocal micros-copy skin images,” in 23rd Int. Conf. Pattern Recognit. (ICPR), IEEE,1466–1471 (2016).
13. A. Bozkurt et al., “Delineation of skin strata in reflectance confocalmicroscopy images with recurrent convolutional networks,” in IEEEConf. Comput. Vision and Pattern Recognit. Workshops (CVPRW),IEEE, pp. 777–785 (2017).
14. A. Krizhevsky, I. Sutskever, and G. E. Hinton, “Imagenet classificationwith deep convolutional neural networks,” in Adv. Neural Inf. Process.Syst., pp. 1097–1105 (2012).
15. K. He et al., “Deep residual learning for image recognition,” in Proc.IEEE Conf. Comput. Vision and Pattern Recognit., pp. 770–778 (2016).
16. A. Bozkurt et al., “Delineation of skin strata in reflectance confocalmicroscopy images using recurrent convolutional networks withToeplitz attention,” arXiv:1712.00192 (2017).
17. J. D. Lafferty et al., “Conditional random fields: probabilistic models forsegmenting and labeling sequence data,” in Proc. Eighteenth Int. Conf.Mach. Learn. (ICML), pp. 282–289 (2001).
18. C. Sutton et al., “An introduction to conditional random fields,” Found.Trends® Mach. Learn. 4(4), 267–373 (2012).
19. F. Peng and A. McCallum, “Information extraction from research papersusing conditional random fields,” Inf. Process. Manage. 42(4), 963–979(2006).
20. F. Sha and F. Pereira, “Shallow parsing with conditional random fields,”in Proc. 2003 Conf. North Am. Chapter of the Assoc. for Comput. Ling.on Hum. Lang. Technol., Association for Computational Linguistics,Vol. 1, pp. 134–141 (2003).
21. Y. Liu et al., “Protein fold recognition using segmentation conditionalrandom fields (SCRFs),” J. Comput. Biol. 13(2), 394–406 (2006).
22. X. He, R. S. Zemel, and M. Á. Carreira-Perpiñán, “Multiscale condi-tional random fields for image labeling,” in IEEE Comput. Soc. Conf.Proc. Comput. Vision and Pattern Recognit. CVPR 2004, IEEE, Vol. 2,pp. II–II (2004).
23. A. C. Müller and S. Behnke, “Learning depth-sensitive conditional ran-dom fields for semantic segmentation of RGB-D images,” in IEEE Int.Conf. Rob. and Autom. (ICRA), IEEE, pp. 6232–6237 (2014).
24. S. Bauer, L.-P. Nolte, and M. Reyes, “Fully automatic segmentation ofbrain tumor images using support vector machine classification in com-bination with hierarchical conditional random field regularization,”Lect. Notes Comput. Sci. 6893, 354–361 (2011).
25. P. F. Christ et al., “Automatic liver and lesion segmentation in ct usingcascaded fully convolutional neural networks and 3D conditionalrandom fields,” Lect. Notes Coput. Sci. 9901, 415–423 (2016).
26. S. Kumar and M. Hebert, “Discriminative random fields,” Int. J.Comput. Vision 68(2), 179–201 (2006).
27. L. Breiman, “Random forests,” Mach. Learn. 45, 5–32 (2001).28. V. A. Van der Schaaf and J. V. van Hateren, “Modelling the power
spectra of natural images: statistics and information,” Vision Res.36(17), 2759–2770 (1996).
29. R. M. Haralick, “Statistical and structural approaches to texture,” Proc.IEEE 67(5), 786–804 (1979).
30. T. P. Weldon, W. E. Higgins, and D. F. Dunn, “Efficient Gabor filterdesign for texture segmentation,” Pattern Recognit. 29(12), 2005–2015(1996).
31. A. K. Jain, N. K. Ratha, and S. Lakshmanan, “Object detection usinggabor filters,” Pattern Recognit. 30(2), 295–309 (1997).
32. D. Marr and E. Hildreth, “Theory of edge detection,” Proc. R. Soc.Lond. B 207(1167), 187–217 (1980).
33. O. Kramer, “Iterated local search with Powell’s method: a memeticalgorithm for continuous global optimization,” Memetic Comput. 2(1),69–83 (2010).
34. S. Kosov, “Direct graphical models C++ library,” 2013, http://research.project-10.de/dgm/.
35. M. Rajadhyaksha et al., “In vivo confocal scanning laser microscopy ofhuman skin: melanin provides strong contrast,” J. Invest. Dermatol.104(6), 946–952 (1995).
36. T. B. Fitzpatrick, “The validity and practicality of sun-reactive skintypes i through vi,” Arch. Dermatol. 124(6), 869–871 (1988).
Fig. 6 Visual appearance of the transition from the epidermis to the uncertain area, which corresponds tothe epidermal lower boundary. Notice that the aged DEJ (b) appears flatter than the young DEJ (a), asexpected. Colors encode the depth.
Journal of Medical Imaging 024003-9 Apr–Jun 2019 • Vol. 6(2)
Robic et al.: Three-dimensional conditional random field for the dermal–epidermal. . .
37. J. Robic, “Automated characterization of skin aging using in vivo con-focal microscopy,” Doctoral Dissertation, Paris Est (2018).
38. C. Longo et al., “Skin aging: in vivo microscopic assessment of epider-mal and dermal changes by means of confocal microscopy,” J. Am.Acad. Dermatol. 68(3), e73–e82 (2013).
39. C. Longo et al., “Proposal for an in vivo histopathologic scoring systemfor skin aging by means of confocal microscopy,” Skin Res. Technol.19(1), e167–e173 (2013).
Julie Robic received her PhD in computer vision from the Universityof Marne-la-Vallée, France, in 2018. She is a project manager incharge of skin image processing for Clarins Laboratories.
Benjamin Perret received his MSc degree in computer science in2007, and his PhD in image processing in 2010 from the Universitéde Strasbourg, France. He currently holds a teacher–researcherposition at ESIEE Paris, affiliated with the Laboratoire d’InformatiqueGaspard Monge of the Université Paris-Est. His current researchinterests include image processing and image analysis.
Alex Nkengne holds a PhD in medical computer science and hasspent the last 14 years as a researcher in the field of skin biophysicsand imaging for different companies. He currently leads the SkinModels and Methods Team for Clarins Laboratories.
Michel Couprie received his PhD from the Université Pierre et MarieCurie, Paris, France, in 1988, and the Habilitation à Diriger desRecherches in 2004 from the Université de Marne-la-Vallée, France.Since 1988, he has been working in the Computer Science Depart-ment of ESIEE. He is also a member of the Laboratoire d’InformatiqueGaspard-Monge of the Université Paris-Est. He has authored/co-authored more than 100 papers in archival journals and conferenceproceedings as well as book contributions. He supervised or co-supervised nine PhD students who successfully defended their thesis.His current research interests include image analysis and discretemathematics.
Hugues Talbot received his habilitation degree from the UniversitéParis-Est in 2013, his PhD fromÉcole desMines de Paris in 1993, andhis engineering degree from École Centrale de Paris in 1989. He wasa principal research scientist at CSIRO, Sydney, from 1994 to 2004,a professor at ESIEE Paris from 2004 to 2018, and is now a fullprofessor at CentraleSupelec of the University Paris-Saclay. Duringthe period 2015 to 2018, he was the research dean at ESIEE Paris.He is the co-author of 6 books and more than 200 articles in variousareas of computer vision, including low-level vision, mathematicalmorphology, discrete geometry, and combinatorial and continuousoptimization.
Journal of Medical Imaging 024003-10 Apr–Jun 2019 • Vol. 6(2)
Robic et al.: Three-dimensional conditional random field for the dermal–epidermal. . .