three-dimensional motility cycle in leukocytes
TRANSCRIPT

Cell Motility and the Cytoskeleton 22:211-223 (1992)
Three-Dimensional Motility Cycle in Leukocytes
John Murray, Holly Vawter-Hugart, Edward Voss, and David R. SOH
Department of Biology, University of Iowa, Iowa City, Iowa
A 3-dimensional dynamic image analyzing system (3D-DIAS) has been devel- oped in which a translocating cell is optically sectioned in the z-axis within a 2 sec period; the perimeter of the cell in each section is digitized into the 3D-DIAS data file, and the digitized perimeters are wrapped in order to reconstruct the cell image in three dimensions. Using 3D-DIAS, we have obtained the first dynamic 3- dimensional description of human polymorphonuclear leukocytes (PMN) translo- cating on a glass surface. A general behavior cycle has emerged which includes two phases. In the first, an ellipsoidal PMN with significant z-axis extends an- teriorly and descends to the substratum. When the ventral surface of the anterior end contacts the substratum, there is rapid anterior expansion, which correlates with velocity peaks. In the second phase, the elongate PMN stops translocating along the substratum, the anterior end lifts off of the substratum, sometimes to heights greater than the length of the PMN at the substratum, and finally the PMN retracts into an ellipsoidal morphology still capable of random protrusions. During this second phase, which correlates with velocity troughs, turning usually occurs. The degree of turning is restricted by the continuous integrity of the posterior uropod. The period of the behavior cycle varies from roughly 0.5 to 2 min between PMNs, but is relatively constant within each individual PMN. 0 1992 Wiley-Liss, Inc.
INTRODUCTION
Computer-assisted systems have been developed for quantitating the motility and dynamic morphology of cells in two dimensions [Soll, 1988; Soll et al., 1987, 1988; Wessels et al., 1989; Fischer et al., 1989; Haddock et al., 19911, and they have been applied to an array of motile cells [Brady-Kalnay et al., 1991a and b; Vale et al., 1989; Kim and Wu, 1991; Varnum-Finney et al., 1987; Wessels et al., 1988, 1991; Wessels and Soll, 19901. Recently, we used the Dynamic Morphology Sys- tem [Soll, 19881 to analyze the 2-dimensional behavior of ten human polymorphonuclear leukocytes (PMNs) translocating in buffer on a glass surface, and found that the area of each PMN, measured close to the plane of the substratum, fluctuated, sometimes by as much as 60%. This degree of fluctuation was not observed in compa- rable analyses of Dictyostelium discoideum amoebae
veloped 3-dimensional dynamic image analyzing sys- tem, 3D-DIAS. In this system, a translocating cell is optically sectioned through seven planes in the z-axis within a 2 sec period, and the perimeter of the cell in each plane is digitized into a 3D-DIAS data file. The digitized perimeters are then used to reconstruct the cell image in three-dimensions every 5 sec, and to generate 3-dimensional animations of cell behavior which can be viewed on a stereo monitor. This dynamic 3-dimensional information is then used to compute more than 100 pa- rameters of motility and dynamic morphology, based upon the 3-dimensional path of the cell centroid and the changing 3-dimensional contour of the cell envelope. Each of seven PMNs translocating on a glass surface in the absence of chemoattractant were analyzed with 3D- DIAS and found to exhibit complex behavior in three dimensions, periodically rising from the substratum to
volume or in height. To distinguish behWen these alter- natives, we examined PMN behavior with a newly de-
0 1992 Wiley-Liss, Inc.
Address reprint requests to Dr. David R. Soll, Department of Biology, University of Iowa, Iowa City, IA 52242.

212 Murray et al.
heights in some cases more than two times the length of the PMN at the substratum. Although in most cases, behavior was complex, a pattern has emerged of an underlying 3-dimensional velocity cycle based upon changes in the morphology of a PMN in the x, y and z axes, and a relationship is suggested between contact of the ventral surface of the anterior end of a cell with the substratum and rapid cyclic translocation of a PMN along the substratum.
MATERIALS AND METHODS Two-Dimensional Analysis of PMNs
A droplet of fresh human blood from a finger punc- ture was mixed with 0.5 ml of prewarmed (37°C) Hank’s balanced salts solution (Gibeo BRL, Gaitherburg, MD) containing 0.01 M Hepes buffer, pH7.4 (H-HBSS), on a Sykes Moore chamber wall rimmed with an O-ring sealed in 1% agarose. Cells were allowed to settle on the glass chamber wall for 5 min at 37”C, then the O-ring and agarose seal were removed. The chamber wall was rinsed with H-HBSS three times to remove red blood cells, and inserted in a Sykes Moore chamber, which was then filled with H-HBSS (37°C). The resulting culture of cells adhering to the chamber wall consisted predomi- nately of PMNs. The chamber was placed on the stage of a phase contrast microscope fitted with a long-range con- denser, and perfused with H-HBSS at a flow rate of 4 ml per min. Cells were perfused for an initial 5 min accli- mation period, then continuously video recorded on 314 inch tape with a Sony U-matic 3/4 inch VCR in real time for 10 min at 200 X magnification. Cell outlines were hand-digitized from still frames at 15 sec intervals into a Sun computer data file [Wessels et al., 1989, 1991; Wes- sels and Soll, 19901, and analyzed with the Dynamic Morphology System (DMS) software package [Soll, 1988; Sol1 et al., 1987, 19881. The x,y-coordinates of each pixel at the cell periphery were recorded, and the mean of the x,y-coordinates calculated as the “centroid” of the cell area in each frame. Parameters were calcu- lated as previously described [Soll, 1988; Soll et al., 1987, 19881. “Instantaneous velocity” of a cell in frame n was calculated by drawing a vector from the centroid in frame n- 1 to the centroid in frame n + 1, and the length of the vector divided by twice the time interval between analyzed frames. “Directional change” was calculated as the absolute value of the difference in the direction of centroid translocation between consecutive frames. Cell “length” was calculated as the distance between the two points on the cell outline farthest apart, and “width” as the area divided by length. “Area” was calculated using a contour line integral [Soll et al., 19881, and “perime- ter” the sum of the lengths of the line segments con-
necting boundary pixels. The “roundness” parameter was calculated as
4 T area perimete?
x 100.
Difference pictures were generated by overlaying the digitized image at time n over the image at time n-15 sec. The regions of the composite cell image at time n which did not overlap the image at time n- 15 sec were considered ‘‘expansion zones” (filled areas). The summed area of expansion zones, expressed as a percent of total area, was a measure of “positive flow”.
Three-Dimensional Analysis of PMNs A mixture of polystyrene beads (Polysciences Inc.,
Warrington, PA) with diameters of 5, 10 and 20 pm was dispersed on the glass surface of a Dvorak-Stotler cham- ber wall and dried. The chamber wall was then edged with an O-ring sealed with 1 % agarose to produce a well. A 0.5 ml aliquot of prewarmed (37°C) H-HBSS was added to the well, then a droplet of fresh human blood from a finger puncture. Blood cells were allowed to set- tle for 5 min at 37”C, the O-ring plus agarose removed, the glass wall rinsed three times with H-HBSS to remove red blood cells, and the glass wall inserted into a Dvorak- Stotler chamber. The chamber was then filled with H- HBSS. The resulting culture of cells adhering to the chamber wall consisted primarily of PMNs. The cham- ber was positioned on the stage of a Zeiss ICM 405 inverted microscope equipped with a 63 X DIC objec- tive. The chamber and microscope stage were warmed with an air curtain (Sage Instruments, model 279) mon- itored with a thermostat probe attached to the chamber rim. The chamber was perfused with H-HBSS pre- warmed to 37°C so that chamber fluid was replaced ev- ery 8 sec. The behavior of PMNs was recorded contin- uously in real time through a C2400 Hamumatsu video camera onto 3/4 inch tape. To obtain optical sections, the plane of focus was raised in 1.7 pm increments at 0.3 sec intervals. The first plane of focus was made at the cham- ber wall surface, and the last 10 pm from the surface, resulting in seven sections. This sectioning regime was achieved by manual rotation of the precalibrated focus control of the microscope. Calibration was performed in each experiment with the premeasured polystyrene beads as standards. Sectioning was repeated every 5 sec. The edge of the cell in focus in each optical section in a still frame was manually digitized into the SUN data file. DIC images were sufficiently sharp for easy identifica- tion of the cell edge. Noise removal and dilation-erosion techniques were applied to the raw data file through the 3D-DIAS software system. This ensured that each slice

3D Leukocyte Motility 213
TABLE I. Two-Dimensional Parameters Averaged Over Ten Minute Periods for Ten PMNs*
Instan- Direc- taneous tional velocity change Perim- Round- ( p d (deg/ Length Width Area eter ness
Cell min) min) (wm) (urn) (urn2) (urn) (uercent)
was a collection of non-intersecting closed contours. The data was then displayed in three dimensions on the po- larizing screen of a Tektronix 4337 stereo monitor (Tek- tronix, Bifurcate, OR) using pixels as edge points for graphic polygons, and the images viewed through com- patible polarizing glasses. To obtain a complete image, the stacked polygons were wrapped with a faceted surface and edges smoothed. Wrapped images were pre- sented visually as either nontransparent 3-dimensional images, or as transparent caged images. Since wrapping represents a complicated set of calculations followed by smoothing with a Tukey window [Tukey, 19771, it will be described in a technical communication on the devel- opment of 3D-DIAS [Soll, Voss, Vawter-Hugart and Murray, in preparation]. Calculations of 3-dimensional motility and dynamic morphology parameters were based on the pixel data points of the wrapped figure. The centroid position in x,y, and z coordinates was computed by first summing the centroids of blocks filling the 3- dimensional image multiplied by the block volume, then dividing this sum by total volume yielding a volume- weighted average. “Instantaneous velocity” and “direc- tional change” in three dimensions were calculated in the same manner as the 2-dimensional parameters [Soll, 1988; Soll et al., 1987, 19881, but were based on the position of centroids in three dimensions. “Differenc- ing”, the identification of expansion zones, and calcu- lations of positive flow were performed by overlapping mid-sagittal sections of 3D images separated by 5 sec intervals, using the same method employed for 2-dimen- sional images [Soll, 1988; Soll et al., 1987, 19881.
RESULTS Motility and Dynamic Morphology Parameters Averaged in Two Dimensions
When PMNs on the wall of a Sykes-Moore cham- ber were perfused with H-HBSS, the majority (-60%) began translocating within a 5 min acclimation period. The mean of the average instantaneous velocities of ten motile PMNs, each videorecorded and analyzed in two dimensions for a 10 minute period, was 9.6 ? 2.5 pm per min, and the mean of the average directional change 37.0 5 8.1 degrees per minute (Table I). The standard deviations of instantaneous velocity and directional change were 27% and 22% of the mean, respectively, demonstrating that instantaneous velocity and directional change averaged over 10 min were relatively uniform between the ten analyzed PMNs.
Translocating PMNs exhibited a number of 2-di- mensional shapes similar to those previously described [Kelleret al., 1983; Cassimeris andzigmond, 1990; Mac- Farlane et al., 19871. The majority of cells were elongate with a wider anterior cell body and tapered posterior
1 2 3 4 5 6 7 8 9
10 Mean s .d .5”
8.0 41.7 17.7 6.1 106.0 50.3 54.3 11.9 28.0 18.6 6.6 120.9 52.0 57.6 7.4 50.3 19.0 6.1 114.5 54.3 50.9 9.9 33.3 23.9 7.3 173.3 77.5 37.9 7.0 35.5 25.7 7.8 198.9 73.9 46.2
11.5 31.6 19.6 6.2 120.1 57.6 46.1 9.6 32.8 17.8 5.9 103.4 48.9 55.3
14.3 27.2 17.7 6.5 114.8 53.5 52.1 9.9 40.9 16.8 6.3 104.3 48.6 56.9 6.0 48.8 20.4 6.5 130.9 59.4 47.6 9.6 37.0 19.7 6.5 128.7 57.6 50.5 2.5 8.1 2.9 0.6 32.0 10.2 6.1
*Parameters were measured at 15 second intervals, then averaged over a 10 minute period for each PMN. “s.d., standard deviation of mean.
uropod (Fig. 1A-D). When viewed through DIC optics, most elongate cells exhibited an anterior lamellapod or pseudopod containing nonparticulate cytoplasm, distinct from the particulate regions of the cytoplasm in the main cell body (Fig. 1A-D). In many cases, cells exhibited a round shape with no observable lamellapod, but an iden- tifiable uropod (Fig. 1E and F). When viewed close to the substratum, most of these PMN images were blurred (e.g., Fig. lE), suggesting significant height in the z-axis. Two-dimensional shape parameters averaged over 10 min for ten translocating PMNs were relatively uniform; the standard deviations of area, length, width, perimeter and roundness were 25%, 15%, 9%, 18%, and 12% of the means, respectively (Table I).
Time-Plots of Motility and Dynamic Morphology Parameters in Two Dimensions
Although 2-dimensional motility and morphology parameters when averaged over 10 min were relatively uniform between PMNs (Table I), they were not constant over the 10 min period of analysis for any individual PMN. In Figure 2, the instantaneous velocity of two representative PMNs is coplotted as a function of time with positive flow (Fig. 2A), roundness (Fig. 2B), and area (Fig. 2C). All four parameters fluctuated dramati- cally over the 10 rnin of analysis. This was true for eight additional PMNs analyzed in the same fashion (data not shown). Positive flow, which represents the expansion zones of difference pictures generated at 15 sec intervals, correlated closely with instantaneous velocity (Fig. 2A), while roundness correlated in an inverse fashion (Fig. 2B). The most surprising fluctuations were observed in

214 Murray et al.
Fig. 1. Various 2-dimensional morphologies of PMNs moving ran- domly on a glass surface in buffered salts solution (A-F). Cells were perfused in a Dvorak-Stotler chamber at a rate which turned-over the chamber solution eight times per minute. Cells were viewed with
differential interference contrast optics. All micrographs were taken at roughly the same plane of focus in respect to the glass substratum. The white bar in F represents 10 pm. L, lamellapodium; U, uropod.

3D Leukocyte Motility 215
oped 3D-dynamic image analyzing system (3D-DIAS). Seven optical sections of a translocating PMN were vid- eorecorded in a 2 sec period (Fig. 3A) and this was repeated every 5 sec. Cell perimeters in optical sections were digitized into the data file of 3D-DIAS, and stacked to generate a 3-dimensional plate image (Fig. 3B). Each plate image was then wrapped with a faceted surface to generate a reconstruction of the original cell (Fig. 3C). Seven PMNs, translocating in the absence of chemoat- tractant, were optically sectioned and reconstructed with 3D-DIAS software. Three-dimensional plate images at 40 sec intervals are presented in Figure 4 for the PMN exhibiting the greatest z-axis extensions. The height of this PMN was greater than the length of its base plate on the substratum at 40,160,240, and 320 sec. In addition, at 40 sec the length of the highest plate was greater than the length of the base plate, and at 40, 160,240, and 320 sec, plates toward the top of the cell jutted-out forming ledges over the glass surface below.
In Figure 5 , wrapped images are presented of the plate images in Figure 4. At 0 sec, the PMN was elon- gated along the substratum, with a bulbous rear half, a narrower anterior half, and mid-portion not in contact with the glass substratum. When the image was rotated with the 3D-DIAS program in order to view the posterior end of the PMN on the stereo monitor, a tapered uropod was distinguished. Between 0 and 80 sec, the anterior portion of the cell lifted off of the substratum, then re- tracted posteriorly into the main cell body, resulting in a rounder cell morphology. Between 80 and 120 sec, the PMN elongated anteriorly along the substratum, with the long axis in the direction of translocation. During this elongation step, the tail-end of the uropod remained geo- graphically fixed. Between 120 and 160 sec, the anterior portion of this PMN again lifted off of the substratum, and between 160 and 200 sec again retracted posteriorly into the main cell body, resulting in a rounder cell mor- phology. Between 200 and 280 sec, the cell extended anteriorly, the anterior end descended to the substratum, and the cell then extended along the substratum. Be- tween 280 and 320 sec, the cell again rose in the z-axis; between 320 and 360 sec the main cell body retracted, and between 360 and 440 sec, the cell extended anteri- orly along the substratum. During the 440 sec of analy- sis, this PMN moved from the upper left-hand corner to the middle right-hand side of the grid, turning several times. It contracted into a spherical or ellipsoidal mor- phology three times, elongated along the substratum three times, and changed direction three times. Through all phases of its behavior, it maintained its original po- larity defined by the position of the trailing uropod.
A general behavior cycle could be deciphered not only in the 3-dimensional reconstructions of the repre- sentative PMN in Figures 3 and 4, but also in the ma-
h
h
a "1 40
3 5 30
0,
2 20 t
b I 2 3 4 5 6 7 8 9 10
0 1 2 3 4 5 6 7 8 9 10
1401 A rro
I , , , l , , l , , , , , , , , , , , . l 0 1 2 3 4 5 6 7 8 9 I0
TIME lminl
Fig. 2. Instantaneous velocity coplotted with positive flow (A), roundness (B), and area (C) for two representative PMNs (upper and lower plots in each panel) translocating on a glass surface in H-HBSS buffer. Videorecordings were made of each PMN, and the perimeters digitized into the DMS data file for computation of the four 2-dimen- sional parameters. In each case, the unfilled circles represent instan- taneous velocity and the filled circles the various parameters computed in two dimensions.
cell area. The changes in area correlated with changes in instantaneous velocity (Fig. 2C), and fluctuations were sometimes as great as 60%.
The General Behavior of P M N s in Three Dimensions
The dramatic fluctuations in the area of translocat- ing PMNs (Fig. 2C) suggested that either PMN volume increased or PMN height decreased (in the z-axis) when the rate of cellular translocation increased. To distinguish between these alternatives, we applied the newly devel-
216 Murray et al.
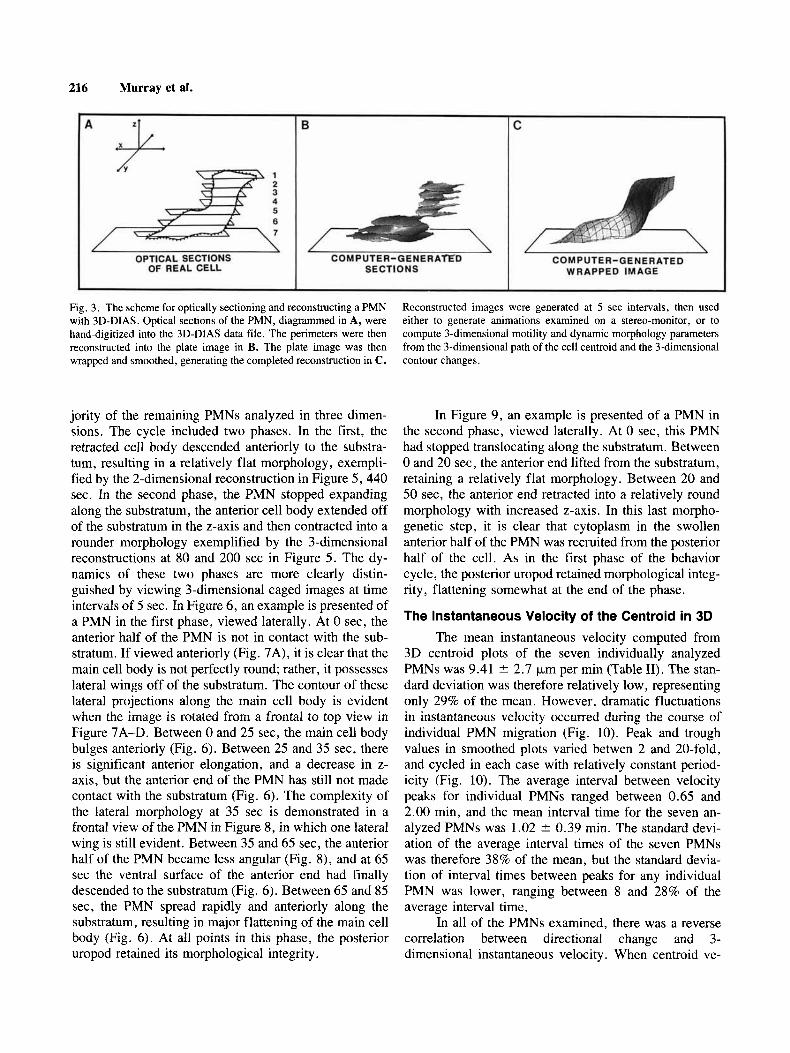
Fig. 3. The scheme for optically sectioning and reconstructing a PMN with 3D-DIAS. Optical sections of the PMN, diagrammed in A, were hand-digitized into the 3D-DIAS data file. The perimeters were then reconstructed into the plate image in B. The plate image was then wrapped and smoothed, generating the completed reconstruction in C.
Reconstructed images were generated at 5 sec intervals, then used either to generate animations examined on a stereo-monitor, or to compute 3-dimensional motility and dynamic morphology parameters from the 3-dimensional path of the cell centroid and the 3-dimensional contour changes.
jority of the remaining PMNs analyzed in three dimen- sions. The cycle included two phases. In the first, the retracted cell body descended anteriorly to the substra- tum, resulting in a relatively flat morphology, exempli- fied by the 2-dimensional reconstruction in Figure 5,440 sec. In the second phase, the PMN stopped expanding along the substratum, the anterior cell body extended off of the substratum in the z-axis and then contracted into a rounder morphology exemplified by the 3-dimensional reconstructions at 80 and 200 sec in Figure 5. The dy- namics of these two phases are more clearly distin- guished by viewing 3-dimensional caged images at time intervals of 5 sec. In Figure 6, an example is presented of a PMN in the first phase, viewed laterally. At 0 sec, the anterior half of the PMN is not in contact with the sub- stratum. If viewed anteriorly (Fig. 7A), it is clear that the main cell body is not perfectly round; rather, it possesses lateral wings off of the substratum. The contour of these lateral projections along the main cell body is evident when the image is rotated from a frontal to top view in Figure 7A-D. Between 0 and 25 sec, the main cell body bulges anteriorly (Fig. 6). Between 25 and 35 sec, there is significant anterior elongation, and a decrease in z- axis, but the anterior end of the PMN has still not made contact with the substratum (Fig. 6). The complexity of the lateral morphology at 35 sec is demonstrated in a frontal view of the PMN in Figure 8, in which one lateral wing is still evident. Between 35 and 65 sec, the anterior half of the PMN became less angular (Fig. 8), and at 65 sec the ventral surface of the anterior end had finally descended to the substratum (Fig. 6). Between 65 and 85 sec, the PMN spread rapidly and anteriorly along the substratum, resulting in major flattening of the main cell body (Fig. 6). At all points in this phase, the posterior uropod retained its morphological integrity.
In Figure 9, an example is presented of a PMN in the second phase, viewed laterally. At 0 sec, this PMN had stopped translocating along the substratum. Between 0 and 20 sec, the anterior end lifted from the substratum, retaining a relatively flat morphology. Between 20 and 50 sec, the anterior end retracted into a relatively round morphology with increased z-axis. In this last morpho- genetic step, it is clear that cytoplasm in the swollen anterior half of the PMN was recruited from the posterior half of the cell. As in the first phase of the behavior cycle, the posterior uropod retained morphological integ- rity, flattening somewhat at the end of the phase.
The Instantaneous Velocity of the Centroid in 3D The mean instantaneous velocity computed from
3D centroid plots of the seven individually analyzed PMNs was 9.41 2 2.7 pm per min (Table 11). The stan- dard deviation was therefore relatively low, representing only 29% of the mean. However, dramatic fluctuations in instantaneous velocity occurred during the course of individual PMN migration (Fig. 10). Peak and trough values in smoothed plots varied betwen 2 and 20-fold, and cycled in each case with relatively constant period- icity (Fig. 10). The average interval between velocity peaks for individual PMNs ranged between 0.65 and 2.00 min, and the mean interval time for the seven an- alyzed PMNs was 1.02 ? 0.39 min. The standard devi- ation of the average interval times of the seven PMNs was therefore 38% of the mean, but the standard devia- tion of interval times between peaks for any individual PMN was lower, ranging between 8 and 28% of the average interval time.
In all of the PMNs examined, there was a reverse correlation between directional change and 3- dimensional instantaneous velocity. When centroid ve-

3D Leukocyte Motility 217
Fig. 4. Plate images of a representative PMN translocating on a glass surface in buffered salts solution. Images are separated by 40 sec intervals. The method for generating plate images with 3D-DIAS is diagramed in Figure 3 and described in detail in Materials and Methods.
locity peaked, the direction of centroid translocation was persistent and directional change was low, but when cen- troid velocity slowed, there was a marked increase in directional change. For the representative PMN in Figure 1 1, a dramatic increase in directional change occured at each velocity trough.
Velocity peaks were found to correlate in most cases with that portion of the behavior cycle in which the anterior end of the cell descended to the substratum, made contact and expanded along the substratum (Fig. 6, 65 to 85 sec). To demonstrate this point, 3-dimensional difference pictures were generated through the mid-sag- ittal section of a representative PMN during two succes- sive velocity peaks (Fig. 12). The filled zone of each
difference picture represents the expansion zone in the 2-dimensional sagittal section over a 10 sec interval. The vector in each difference picture represents the direction of centroid movement in the mid-sagittal plane, 1/2Pk represents half-maximal instantaneous velocity, and Pk represents maximal velocity. Expansion zones formed anteriorly off of the substratum at half peak instanta- neous velocity, then formed anteriorly along the substra- tum at peak instantaneous velocity.
DISCUSSION
The majority of PMNs obtained from the peripheral human blood stream will develop polarity and translocate

218 Murray et al.
Fig. 5 . Wrapped images of the representative PMN in Figure 4. The method for generating each wrapped image from a plate image with 3D-DIAS is diagrammed in Figure 3 and described in Materials and Methods. Images are separated by 40 sec intervals.
at relatively rapid rates on glass in the absence of chemoattractant [Schmid-Schonbein et a]., 19821. We have analyzed the basic behavior of PMNs at high rates of perfusion and low cell density in order to exclude conditioning of the microenvironment, cell-cell signal- ling and cell-cell contact [Varnum-Finney et al., 1987; Wessels et al., 19891. Employing the computer-assisted 2-dimensional Dynamic Morphology System [Soll, 1988; Sol1 et al., 1987, 19881, we first found that such translocating PMNs exhibited fluctuations in most mo- tility and dynamic morphology parameters, not unlike the fluctuations observed in the 2-dimensional behavior of Dictyostelium amoebae under approximately the same conditions [Soll, 1988; Soll et a]., 19881. However, in
contrast to Dictyostelium amoebae, PMNs also exhibited extreme fluctuations in area computed at a focal plane just above the supporting substratum. This could have been accounted for by changes in either volume or height. The latter seemed a more plausible explanation, since we also observed that when motile PMNs were videorecorded at a focal plane close to the supporting substratum, the image became blurred transiently, sug- gesting that the main cell body transiently extended off of the substratum, in the z-axis.
We therefore analyzed the 3-dimensional behavior of PMNs on a glass surface with the newly developed 3D-DIAS software program, and found that PMNs in- deed underwent cyclic 3-dimensional behavior. Several

3D Leukocyte Motility 219
55
75
85
a
B
C
Fig. 7. Rotational views of the caged image of the PMN in Figure 6 at 0 sec, beginning frontally (A) and ending from on-top (D). Note the angular lateral projections in the frontal views in A and B , and the distinct posterior uropod in the on-top view in D. Fig. 6. Caged images viewed from the lateral side of a PMN descend-
ing to the substratum (0-65 sec) and then spreading rapidly and an- teriorly (65-85 sec).
previous 2-dimensional studies of PMN behavior also suggested rhythmicity in translocation. Descending waves of contraction were observed perpendicular to the axis of PMN translocation [Hastons and Shields, 19841, and appeared to correspond to the “constriction ring” described by earlier researchers [Lewis, 1931; de Bruyn, 1946; Senda et al., 19751. Cassimeris and Zigmond 119901 described the translocation process of PMNs in two dimensions as a sequence which included protrusion of a lamellapodium, adhesion of the ventral surface of the lamellapodium to the substratum, and retraction of the posterior portion of the cell body, a sequence similar to one proposed by Oster 119881 as a general mechanism for cells with expanding lamellapodia. DiMilla et al. [ 199 I] have proposed a mathematical model in which lamellipod extention is accompanied by disproportionate receptor-ligand binding on the ventral surface of the ex- tention, and is followed by general actin-based cortical contraction. We have extended these 1- and 2- dimen-
sional models by obtaining a dynamic view of the PMN morphology in three dimensions. Although there is some variation in PMN behavior, we have extracted a basic 3-dimensional behavior cycle which we have arbitrarily separated into two phases. The first phase begins with the bulk of the cell body packaged in a relatively ellip- soidal morphology, in many cases with the long axis at an angle to the substratum. The ventral surface of the anterior end of this morphology is not in contact with the substratum. When PMNs in this relatively retracted state are viewed in three dimensions from different angles, localized expansion and contraction can be observed to occur in an apparently random fashion around the 3- dimensional periphery of the anterior two-thirds of the cell. During the first phase, the main cell body juts out- wardly and descends towards the substratum, forming and retracting minor protrusions, but continually extend- ing anteriorly and downwardly. Once the ventral surface of the anterior end of the PMN contacts the substratum, there is rapid anterior pseudopodial or lamellapodial ex- tension along the substratum, suggesting that this contact

220 Murray et al.
35
65
Fig. 8. Frontal views of the caged images of the PMN in Figure 6 at 35, 55 , and 65 sec. Note that at 35 sec, a conical lateral pseudopod extends from the right side of the PMN and represents the most an- terior projection in the lateral view in Figure 6 , 35 sec. At 55 sec, this projection has been partially retracted and the anterior end of the cell seems rounder, but the ventral surface of the anterior end of the cell is still not in contact with the substratum. At 65 sec, the ventral surface of the anterior end has contacted the substratum, and has flattened.
is a signal for rapid anterior cortical expansion. During the first phase, some translocation in the x, y-axes occurs prior to anterior end contact with the substratum, but the major portion of expansion occurs immediately after contact. At the beginning of the second phase, the elon- gate cell stops translocating along the substratum, and lifts and/or extends its anterior end off of the substratum. Our results are not refined enough to distinguish whether the cessation of cellular translocation along the substra- tum precedes or follows the termination of contact be- tween the ventral surface of the anterior end of the PMN and the substratum. Subsequent anterior extension in the z-axis sometimes exceeds the longest of the x,y-axes at the plane of the supporting substratum. The main cell body of the PMN then retracts into a relatively ellipsoidal morphology, attached to the substratum along the ventral surface of the posterior two-thirds of the PMN, including the uropod. This morphology marks the start of the next cycle.
Cortical expansion of anterior zones [Condeelis et al., 19901 therefore plays a major role in the most rapid period of persistent translocation along the substratum in the first phase as well as z-axis extensions at the begin- ning of the second phase of the behavior cycle. On the other hand, cortical contraction [Taylor and Condeelis, 1979; Bray and White, 1988; Spudich, 1989; Fukui and Yumura, 19861 appears to play a major role in general cell retraction at the end of the second phase which re- sults in the ellipsoidal morphology. It has been proposed that cellular translocation involves anterior expansion and then anterior adhesion to the substratum which acts
0
10
20
30
40
50
Fig. 9. Caged images viewed from the lateral side of a PMN lifting its front end off of the substratum. Note how the anterior end extends off of the substratum anteriorly between 0 and 20 sec, and the narrowness of the anterior end. Note the surge of cytoplasm into the anterior hemisphere and the flattening of the uropod between 30 and 60 sec.
as an anchor for retraction of the posterior portion of the cell anteriorly [Oster, 1988; Cassimeris and Zigmond, 19901. However, the 3-dimensional description pre- sented here suggests that this model may be insufficient. Our results suggest that anterior adhesion signals rapid anterior expansion along the substratum, but neither an- terior cortical expansion nor general cortical contraction is limited to the two dimensions paralleling the substra- tum or the rapid translocation step in this plane. Pseudopodia form off of the substratum in the z-axis, and general cortical contraction occurs when the ventral sur- face of the original anterior end of the PMN is not in contact with the substratum and, therefore, cannot act as an adhesive anchor for contraction of the posterior por- tion of the PMN anteriorly.
Although a PMN becomes more ellipsoid after gen-

TABLE 11. Velocity Parameters Calculated From Three-Dimensional Centroid Tracks of Seven PMNs
3-Dimensional Velocity Cell Average instantaneous no. velocity (pdmin) 2s.d.
1 5.90 3.66 2 8.40 4.22 3 11.25 4.98 4 13.83 4.18 5 6.98 4.77 6 10.06 3.84 7 9.48 4.60
mean 2 s , d. 9 .41pdmin~2.7
Cell Intervals between Average no. peaks (min.) interval (min) 2s.d.
1 1.52, 2.03 1.78 0.36 2 1.32, 1.12, 1.17 1.20 0.10 3 0.81, 0.90, 1.14, 0.97 0.96 0.14 4 0.70, 0.60 0.65 0.07 5 1.17, 0.75, 0.73 0.88 0.25 6 0.54, 0.71 0.63 0.12 7 0.84, 1.29, 0.85, 1.12 1.03 0.22
mean of average intervals +s.d, 1.02 min 2 0.39
Q D z 151 h
0 1 2 3 4 5 TIME (rninl TIME (rni;r)
Fig. 10. Instantaneous velocity computed from the 3-dimensional centroid plots of four translocating PMNs (A-D). The original data has been smoothed five times with a Tukey window of size 5 with weights of 5, 20, 50, 20, and 5 [Tukey, 19771.
era1 retraction in the second phase, it does not lose the capacity to extend pseudopodia in different directions, and this latter behavior may be the basis for the increased degree of directional change observed in the centroid
3D Leukocyte Motility
1
r I I I I ) 1 2 3 4 5
TIME (min)
Fig. 1 1. Three-dimensional instantaneous velocity and directional change coplotted for a representative translocating PMN.
path during this phase. Although changes in anterior def- inition occur during this phase, the degree of turning is still limited by the fixed uropod, which appears to be immune from the morphogenetic dynamics of the ante- rior two-thirds of the PMN.
Peaks of instantaneous velocity computed from the 3-dimensional path of the cell centroid correlate with expansion in the anterior zone of each PMN in the trans- location step. The average period of this cycle in the group of PMNs analyzed in this study vaned between roughly 0.5 and 2.0 min, but the period of a single cell was relatively constant. It is tempting to conclude from these observations that the velocity of cytoplasmic flow cycles in each PMN. However, a cell extending a lamel- lapodium or pseudopodium in a polar and persistent fash- ion will exhibit increased cell centroid velocity, while a cell undergoing general contraction or a cell forming pseudopodia randomly around its 3-dimensional periph- ery will exhibit reduced centroid velocity due to the null- ing effect of symmetrical or random morphological changes [Soll et al., 19881. Therefore, the velocity cycle may not reflect changes so much in the rate of cytoplas- mic flow as in the direction of flow. An analysis of the dynamics of intracellular particle velocity [Wessels et al., 1989; Wessels and Soll, 1990; Soll et al., 19901 during the PMN behavior cycle will resolve this issue.
The results and interpretations of this first 3-dimen- sional analysis of PMN translocation are far from com- plete. Increased temporal and spatial resolving power will increase the details of the description of the behavior cycle basic to PMN migration, and a 3-dimensional anal- ysis of PMNs responding to chemostatic signals should elucidate which aspects of the behavior cycle are regu- lated by receptor occupancy. Refinements of the 3D- DIAS system, including much shorter time intervals be- tween optical sections, more optical sections, and greater magnification as well as image-enhancement of cell pe- ripheries are now being developed, and a 3-dimensional

222 Murray et al.
3.67 ~ 3.8; ~ 4-17 4.33
L3-D 3Pk $Pk Pk SPk,
analysis of PMNs responding to chemoattractant is now in progress. In addition, the behavior of PMNs on glass may differ from that on more natural substrata where increased adhesion may play a role. This possibility is now being tested.
ACKNOWLEDGMENTS
The authors are indebted to Mr. Stephen Wood- ward for technical assistance in preparing figures. This reasearch was supported by grant HD 18577 from the National Institutes of Health and a grant from the Iowa Economic Development Commission for software devel- opment.
REFERENCES
Brady-Kalnay, S . , Soll, D.R., and Brackenbury, R. (1991a): Invasion of Rous sarcoma virus-transformed retinal cells: Role of cell motility. Internat. J. Cancer, 47560-568.
Brady-Kalnay, S.M., Boghaert, E.R., Zimmer, S. , Soll, D.R., and Brackenbury, R. (1991b): Invasion by WC5 rat cerebellar cells is independent of RSV-induced changes in growth adhesion. Internat. J . Cancer, 49:239-245.
Bray, D., and White, J.G. (1988): Cortical flow in animal cells. Science 239:883-888.
Cassimeris, L., and Zigmond, S.H. (1990): Chemoattractant stimula- tion of polymorphonuclear leucocyte locomotion. Cell. Biol.
Condeelis, J . , Bresnick, A., Demma, M., Dharnawardhorne, S . , Eddy, R. , Hall, A.C., and Warren, V. (1990): Mechanism of amoeboid chemotaxis: An evaluation of the cortical expansion model. Dev. Genet. 11:333-340.
de Bruyn, P.P.H. (1946): The amoeboid movement of the mammalian leucocyte in tissue culture. Anat. Rec. 95:117-191.
1 125-134.
DiMilla, P.A., Barbee, K., and Lauffenberger, D.A. (1991): Mathe- matical model for the effects of adhesion and mechanics on cell migration speed. Biophys. J . 60:15-37.
Fischer, P.R., Merkl, R., and Gerisch, G. (1989): Quantitative anal- ysis of cell motility and chemotaxis in Dictyosteliurn discoi- deurn by using an image processing system and a novel chemo- taxis chamber providing stationary chemical gradients. J . Cell Biol. 108:973-984.
Fukui, Y., and Yumura, S . (1986): Actomyosin dynamics in chemo- tactic amoeboid movement of Dictyosteliurn. Cell Motil. Cy- toskel. 6:662-673.
Haddox, J.L., Pfister, R.R., and Sommers, C.I. (1991): A visual assay for quantitating neutrophil chemotaxis in a collagen gel matrix. J. Immun. Meth. 151:41-52.
Hastons, H.S. , and Shields, J.M. (1984): Contraction waves in lym- phocyte locomotion. J. Cell Sci. 68:227-241,
Keller, H.U., Zimmerman, A., and Cottier, H. (1983): Crawling-like movements, adhesion to solid substrata and chemokinesis of neutrophil granulocytes. J . Cell Sci. 64:89-106.
Kim, Y.T., and Wu, C.-F. (1991): Reduced growth cone motility in cultured neurons from Drosophih memory mutants with a de- fective cyclic AMP cascade. J. Neurobiol., 22:263-275.
Lewis, W.H. (1931): Locomotion of lymphocytes. Bull. Johns Hop- kins Hosp. 49:29-30.
MacFarlane, G.D., Herzberg, M.C., and Nelson, R.D. (1987): Anal- ysis of polarization and orientation of human polymorphonu- clear leukocytes by computer-interfaced video microscopy. J. Leukocyte Biol. 41:307-317.
Oster, G. (1988): Biophysics of the leading lamella. Cell Motil. Cy- toskeleton 10:164-171.
Schmid-Schonbein, G.W., Skalak, R., Sung, K.-L.P., and Chien, S. (1982): Human leukocytes in the active state. In Bagge, U., Born, G.V.R., and Gaehtgens, P. (eds.): “White Blood Cells, Morphology and Rheology as Related to Function.” The Hague: Nartinum Nijhoff, pp. 21-31.
Senda, N., Tamura, H., Shibata, N., Yoshitake, J., Kondo, K., and Tanaka, K. (1975): Mechanism of the movement of leucocytes. Exper. Cell Res. 91:393-407.

3D Leukocyte Motility 223
Vale, R.D., Soll, D.R., and Gibbons, I.R. (1989): One-dimensional diffusion of microtubules bound to flagellar dynein. Cell 59:
Varnum-Finney, B. Voss, E., and Sol], D.R. (1987): Frequency and orientation of pseudopod formation of Dictyostelium discoi- deum amoebae chemotaxing in a spatial gradient: Further evi- dence for temporal mechanism. Cell Motil Cytoskeleton 8: 18- 26.
Wessels, D., Murray, J., Jung, G., Hammer 111, J.A., and Soll, D.R. (1991): Myosin IB null mutants of Dictyostelium exhibit ab- normalities in motility. Cell Motil. Cytoskeleton 20:301-315.
Wessels, D., and Soll, D.R. (1990): Myosin I1 heavy chain null mu- tant of Dictyosteliurn exhibits defective intracellular particle movement. J. Cell Biol. 111:1137-1148.
Wessels, D., Schroeder, N.A., Voss, E., Hall, A.L., Condeelis, I., and Soll, D.R. (1989): CAMP-mediated inhibition of intracel- Mar particle movement and actin-reorganization in Dictyoste- lium. I. Cell Biol. 109:2841-2851.
Wessels, D., Soll, D.R., Knecht, D., Loomis, W.F., De Lozanne, A . , and Spudich, J. (1988): Cell motility and chemotaxis in Dictyosteliurn amebae lacking myosin heavy chain. Develop. Biol. 128:164-177.
915 -925.
Soll, D.R. (1988): “DMS” a computer-assisted system for quantitat- ing motility, the dynamics of cytoplasmic flow and pseudopod formation: Its application to Dictyostelium chemotaxis. Cell Motil. Cytoskeleton (Suppl.) 10:91-106.
Soll, D.R., Voss, E., and Wessels, D. (1987): Development and application of the “Dynamic Morphology System” for the analysis of amoebae. Proc. SPIE (SOC. Photo-opt. Instr. Eng.).
SOH, D.R., Voss, E., Varnum-Finney, B., and Wessels, D. (1988): The “Dynamic Morphology System”: A method for quantitat- ing changes in shape, pseudopod formation and motion in nor- mal and mutant amoebae of Dictyostelium discoideurn. J. Cell Biochem. 37:177-192.
Soll, D.R., Wessels, D., Murray, J., Vawter, H . , Voss, E., and Bublitz, A. (1990): Intracellular vesicle movement, CAMP and myosin I1 in Dictyostelium. Dev. Genet. 11:341-353.
Spudich, J.A. (1989): In pursuit of myosin function. Cell Regulation 1:l-11.
Taylor, D.L., and Condeelis, J.S. (1979): Cytoplasmic structure and contractility in amoeboid cells. Intl. Rev. Cytology 56:57-144.
Tukey, J.W. (1977): “Exploratory Data Analysis”. Reading, MA: Addison-Wesley Publishing Co.
832:821-830.