three dimensional nonlinear analysis of buried box culvert
TRANSCRIPT

Three Dimensional Nonlinear Analysis of Buried Box Culvert
by
Shameem Ahmed
A thesis
Submitted to the
Department of Civil Engineering
in partial fulfillment of the requirement for the degree
of
MASTER OF SCIENCE IN CIVIL ENGINEERING (STRUCTURAL)
BANGLADESH UNIVERSITY OF ENGINEERING AND TECHNOLOGY
DHAKA
September, 2010

2
A thesis titled “Three Dimensional Nonlinear Analysis of Buried Box Culvert” submitted by Shameem Ahmed, Roll no. 040504341 P, Session April 2005 has been
accepted satisfactory in partial fulfillment of the requirement for the degree of Master
of Science in Civil Engineering (Structural) on 4th September, 2010.
BOARD OF EXAMINERS
1.Dr. Khan Mahmud AmanatProfessorDepartment of Civil Engineering,Bangladesh University of Engineering and Technology,Dhaka-1000.
Chairman
(Supervisor)
2.Dr. Md. Zoynul AbedinProfessor and Head Department of Civil Engineering,Bangladesh University of Engineering and Technology,Dhaka-1000.
Member
(Ex-Officio)
3.Dr. Md. Saiful Alam SiddiqueeProfessorDepartment of Civil Engineering,Bangladesh University of Engineering and Technology,Dhaka-1000.
Member
4.Dr. A.F.M. Saiful AminAssociate Professor Department of Civil Engineering,Bangladesh University of Engineering and Technology,Dhaka-1000.
Member
5.Mr. Sabbir SiddiqueDirectorDesign Planning & Management Consultants Ltd.House No. 4/1, Road No. 4, Dhanmondi R/A, Dhaka-1205
Member

3
DEDICATION
To
My Parents
DECLARATION

4
It is hereby declared that except for the contents where specific references have been made to the works, manuals and papers of other authors, the studies contained in this thesis are the result of investigation carried out by the author under the supervision of Dr. Khan Mahmud Amanat, Professor, Department of Civil Engineering, Bangladesh University of Engineering and Technology.
No part of this thesis has been submitted to any other university or other educational establishments for a degree, diploma or other qualifications.
------------------------ (Shameem Ahmed)
ACKNOWLEDGEMENT

5
Thanks to Almighty Allah for His graciousness, unlimited kindness and with the
blessings of Whom the good deeds are fulfilled.
Author wishes to express his deepest gratitude to his esteemed supervisor Dr. Khan
Mahmud Amanat, Professor, Department of Civil Engineering, BUET for his
encouraging supervision all through the study. His active interest and continuous
guidance were the source of inspiration for author.
Author expresses his profound gratitude to Dr. Md. Saiful Alam Siddiquee, Professor,
Department of Civil Engineering, BUET and Dr. Md. Shariful Islam, Associate
Professor, Department of Civil Engineering, BUET for their help and valuable
suggestions regarding this work.
Special thanks to Md. Shohiduzzaman Sarkar, a friend of author, who helped a lot.

6
ABSTRACT
Reinforced concrete box culverts (RCBC) are widely used throughout the world to provide safe and economical structures for conveyance of water, vehicles, utilities or pedestrian. So far, its design approach is based on 2-D plain strain consideration. Previous studies show that bending moment along longitudinal axis (direction of stream) is significant due to the differential settlement along that direction, which developed a considerable amount of stresses on the culvert and may lead to a structural failure. There is no clear suggestion available in the codes and specifications to consider this effect and 2-D plain strain consideration is also incapable to deal with this. In this study 3-D finite element model of reinforced concrete box culvert buried under fill soil is created and its behaviors are observed.
A 3-D finite element model of box culvert buried under fill soil is developed with ABAQUS. Soil is modeled with solid elements considering its nonlinear material behaviors, box culvert is modeled with sell elements and interaction between soil and culvert is simulated by isotropic coulomb’s frictional model. FE models of two types of box culvert, one box culvert with embankment installation and other with trench installation, are developed to study their behaviors. It is shown that the differential settlement creates significant amount of stress along the longitudinal direction (direction of stream) of the buried box culvert in embankment installation. However differential settlement is not observed in case of trench installation and stress is also found insignificant. Hence, 2-D plain strain consideration is adequate for trench installation and 3-D analysis should be carried out for embankment installation. In the design of buried box culvert with embankment installation bending moment of the box culvert along the longitudinal direction should be considered. But the axial tension involves due to the frictional drag is significantly low and can be ignored in case of box culvert without wing walls.
Based on the behavioral study a detailed parametric study on buried box culvert with embankment installation is performed using the developed 3-D FE model. It is found that fill height, embankment width, culvert size, side slope, modulus of elasticity of original site soil and thickness of culvert slabs and walls have significant influence on the maximum bending moment along the longitudinal direction of the culvert. In contrast pparameters, such as coefficient of friction between soil and concrete, internal frictional angle of soil, dilation angle of soil and modulus of elasticity of fill soil have found little effect on the maximum bending moment along the longitudinal direction of the culvert. On the basis of the findings of the parametric study an empirical equation is proposed to calculate the design moment for designing a buried box culvert avoiding complex numerical analysis.

Chapter 1
INTRODUCTION
1.1 GENERAL
Reinforced concrete box culverts, either precast or cast-in-place, are widely used
throughout the world to provide safe and economical structures for conveyance of water,
vehicles, utilities or pedestrian. In box culvert two slabs and two vertical walls are
constructed monolithically which appears as a very effective structure due to their rigidity
and monolithic action. It does not even need a foundation as the bottom slab directly
resting on soil, serves as a raft foundation. Although box culverts are rather simple
structures, the loading applied to these structures is complex. A culvert as a buried
structure causes a redistribution of stresses in surrounding soil layers and the nature of
this redistribution influences the load that reaches the structures. The load that reaches the
structure is governed by the characteristics of soil, geometry and stiffness of the structure
itself and a complicated soil-structure interaction behavior. Since box culverts are
increasingly being used as replacements for short-span bridges, there is a great demand
for establishing a rational design procedure. The available design procedures are based on
experience or mathematical modeling. Hence, in developing a rational design procedure
for this type of structure, various factors should be considered, including the properties of
the structure and soil and a detailed analysis is necessary to consider the soil-structure
interaction phenomena.
1.2BACKGROUND OF RESEARCH
When reinforced concrete box culverts are located under heavy over-burden soil pressure,
the overlying soil loading may produce 'beam bending like' effect along the longitudinal
direction (direction of steam). This bending effect can induce considerable stress on the
culverts causing excessive deformations and cracks. So far there is no clear suggestion or
provision available in the current codes and specifications to consider such influence of
soil-structure interaction on the stresses developed in the direction of stream, except the
provisions for the minimum reinforcement or distribution reinforcement. Analysis and

2
design based on the 2-D plane strain condition is incapable of recognizing such stresses.
Several aspects of box culvert design have been investigated in recent years by a number
of researchers. Duncan et al. (1986) performed a finite element analysis to develop
design equations for crown and haunch moment capacities of box culverts. Tsuji and
Miyake (1988) had conducted experiments on the use of expansive cement concrete to
improve the mechanical behavior and lighten the weight of precast concrete box culverts.
The results of their study indicate that introducing chemical prestress to a box culvert
would allow a reduction in member thickness of reinforced concrete culvert while
maintaining acceptable cracking behavior. The study carried out by Tadors et al. (1989)
deals specifically with two topics: soil pressures and design methods. In their study, the
soil pressure analysis was performed by 2-D finite element modeling taking into account
soil-structure interaction. Result of their analysis had confirmed previous field
observations that the American Association of State Highway and Transportation
Officials (AASHTO (1978)) provisions had considerably underestimated soil loading.
They proposed formula for prediction of more realistic soil pressures on all four sides of
box culvert. Influence of the proposed soil pressures on culvert size and reinforcement
was demonstrated by numerical examples. Sargand et al. (1992) conducted experimental
and analytical investigation on the structural evaluation of corrugated metal box culverts.
According to the study of Jao et al. (2003), when box culverts are located under
engineering structures such as roadways and buildings, the overlying foundation loading
may induce considerable soil pressure on the culverts causing excessive culvert
deformation. Based on the 2-D finite element analysis, they suggested that the soil
pressure distribution around box culverts induced by the overlying footings is strongly
dependent on soil-culvert interactions and an optimal structural design of box culverts
may require iteration procedures. Preliminary investigations done by Smeltzer and Bentz
(2004) into shear behavior of concrete box culverts gave an indication of the design's
susceptibility to shear failure in the box slab. They suggest that the use of elastic methods
in design of reinforced concrete box culvert is somewhat conservative, and hence the
code predictions should be slightly conservative.

3
Computational research in this area is confined to two-dimensional plane-strain
idealization of the problem. The stress developed in the direction of stream is not given
much attention. To investigate the failure of two box culverts Ahmed et at. (2001)
suggested that proper attention must be given to design appropriate reinforcement for the
stresses developed along the direction of stream (perpendicular to the main traffic). Their
study was initiated upon two box culverts W10 and W17 located approximately 3.5 km
away from the west end of Jamuna Multipurpose Bridge where large cracks had
developed shortly after construction of these culverts. They carried out an analytical
investigation of the problem using finite element method to find out the reasons for
formation of these cracks and checked the consultants design report. Settlement of the
soil was found to be the most prominent contributing factor in producing the cracks.
Their study presented a finite clement analysis of these structures using three dimensional
model that explained causes of cracking and showed the inadequacy of the two
dimensional modeling done by the consultants, focus was drawn on the design
assumptions that were required for these structures. Results of FE analysis conducted by
them showed that the structures were highly stressed in the direction of stream
(perpendicular to traffic) at the bottom due to settlement without considering the presence
of live loading which revealed that the reinforcement in the direction of stream was
inadequate. Chowdhury (2003) conducted finite clement analysis of box culvert-soil
interaction and compared the results with the results of FE analysis performed by Ahmed
et al. (2001).
Ahmed (2005) investigated the behavior of buried box culverts in fill soil. A 3-D FE
model of the box culverts is developed in his study with surrounding soil considering
soil-structure interaction to investigate the behaviors of box culvert. He performed
parametric study to investigated the effect of i) co-efficient of friction, ii) fill height, iii)
side slope, iv) length of culvert in the direction of stream, v) culvert size and vi) soil
modulus on box culvert. He examined the effect of above-mentioned parameters on axial
force and bending moment along the direction of stream (perpendicular to the traffic) and
developed empirical formulae for prediction of maximum bending moment developed at
the midsection of the culvert.

4
The effect of various parameters on shear force of the box culvert was not investigated in
his study. However, he showed graphical relation of axial force with various parameters
but did not suggest any equation for design purpose. Without axial force and shear force
complete design of box culvert is not possible. Furthermore, his model was based on the
consideration of soil as a linear elastic material. But soil is better represented as
elastoplastic material. It shows nonlinear strain dependent plasticity. Consolidation and
creep like time dependent phenomena are also its characteristics. Its plastic properties are
controlled by yield criteria, strain hardening rule and plastic flow rule. So to predict the
true behavior of the box culvert buried under fill soil nonlinear soil properties should be
considered. Thus, it is apparent that there is a scope of further study in this area.
1.3OBJECTIVE OF THE PRESENT STUDY
Behavior of single cell box culvert of different size located under overburden soil
pressure is examined in this study. Non-linear soil properties are considered here. Finite
element analysis technique is carried out considering soil-structure interaction with the
following specific objectives:
i. To understand how stresses along the direction of stream (perpendicular to the
traffic) vary and to identify the parameters which influence the development
of such stresses.
ii. To examine the sensitivity of different parameters like fill height, side slope,
roadway width, coefficient of friction, culvert size etc. considering non-linear
soil behavior.
iii. To compare the result of non-linear model developed in this study to the
elastic model developed by earlier researchers.
iv. To propose a guideline for calculation of bending moment along the direction
of stream for design purpose.
5
1.4SCOPE AND METHODOLOGY OF THE STUDY
The proposed methodology consists of following steps:
i. In the present study, the 3-D Finite Element technique is used to develop a
model which will investigate the stresses along the direction of stream under
soil pressure considering soil-culvert interaction. The finite element model
includes the box culvert itself, sorrounding soil and the interaction between
these two. The box culvert is modeled using shell elements and the
sorrounding soil is modeled using solid elements. The soil-structure
interaction phenomena is simulated by contact algorithom.
ii. Accuracy of results on finite element mesh density is tested to determine the
optimum mesh density that provides acceptable results in reasonable time.
iii. A reference model is established based on sensitivity analysis The magnitude
of parameters of the reference model is prefered from the median values of the
range studied.
iv. Effect of various parameters is studied on reference model by varying value of
one parameter and keeping the values of other parameters at their median
reference value.
v. Based on graphical presentation of the parametric study, the relative
importance of different parameters are established.
vi. Finally, attempt is made to determine the critical stresses in a simplified
manner.
1.5 ORGANIZATION OF THE THESIS
The thesis is organized to represent and discuss the problem and finding the out
come from the studies performed. Chapter 1 introduces a general statement of
the problem and the objectives of this research. Chapter 2 reviews the available
literature discussing various analytical or computational studies conducted on
observing the behavior of reinforced concrete box culvert (RCBC) either precast
or cast-in-place. This chapter also includes a literature survey on the different

6
code provisions and design specifications available for RCBC under different
conditions as well as highlights limited available experimental investigations and
field tests conducted on RCBC. Chapter 3 describes the development of the 3-D
finite element model of the buried concrete box culvert. The performances of the
developed model are verified with the available analytical and field results in this
chapter. Chapter 4 discuses the behavior of box culvert and also covers the effect
of different parameters on the behavior of the box culvert. Chapter 5 describes
the proposed formulas derived from the analyses results of the FE models
developed in the present study. Finally, Chapter 6 draws conclusion of the
current work and discusses recommendations for future work in the area of
buried RC box culvert on fill soil.

Chapter 2
LITERATURE REVIEW
2.1 INTRODUCTION
Roadways at times have to span a small ditch, irrigation canal or other small body of
water. Often, a bridge is too large and costly a solution to protect the roads right of
way. In such a situation, a box culvert is an ideal solution. Culverts are commonly
made from a variety of materials including reinforced concrete, corrugated metal, and
stone. There are numerous types of culvert in terms of materials and geometric shape.
Of the different culvert types, reinforced concrete box culverts are popularly used.
Reinforced concrete box culverts may be either cast-in-place or precast. There is a
current trend to use more precast box culvert systems for their ease of installation and
better ability to monitor quality control. However, cast-in-place concrete culverts can
be a better solution for relatively large spans. Culverts are frequently used to control
water flow and drainage for irrigation and municipal services, control storm water,
and perform many other services. They may vary in size from a cross section of 1m
by 1m to 4m by 4m and larger. They are not all square dimensions; but if not a square,
usually have the span length exceeding the opening height. Box culverts may have
multiple or single cell openings.
Box culverts are in effect large buried pipes. When culverts are near the foundations
of structures e.g. roadways, the overlying loading may induce considerable soil
pressure on the culverts. As a result, the culverts may undergo excessive deformation
or failure rendering the culverts unserviceable. Thus, the design of culverts with deep
soil cover requires full understanding of the soil pressure induced by the overlying
soil loading. Earth pressure distribution around concrete box culverts i.e. soil structure
interaction of the buried box culvert has been the subject of a number of studies that
are discussed in brief in this chapter. The literature survey in this study highlights
various analytical studies and field tests conducted to date in the area of reinforced
concrete box culvert. This chapter also describes the current specifications and
provisions available for designing concrete box culverts.

8
2.2 DIFFERENT TYPES OF BOX CULVERT
As discussed earlier, there are numerous types of culvert in terms of materials and
geometric shape. They may be classified as follows and are shown in Fig. 2.1:
Depending on shape:
1. Square or Rectangular box culvert,
2. Arch box culvert,
3. Trapezoidal box culvert
Depending on materials:
1. Reinforced Concrete culvert (Cast-in-place & Pre-cast),
2. Steel/ Aluminium/ Corrugated metal plate culvert.
Depending on chambers:
1. Single chamber,
2. Multiple chambers.
The purpose of this present investigation is to study the behaviour of the reinforced
concrete box culverts (RCBC) as buried structure. So, this literature review highlights
the specifications available for RCBC (cast-in-place or pre-cast) to calculate loads and
stresses on different components of the culvert under fill soil. Reinforcement bars
used for concrete culverts (cast-in-place or pre-cast) are usually deformed steel bars.
When culverts are subjected to aggressive environments (e.g., exposure to high
moisture and treatment with deicing salts), combinations of moisture, temperature,
and chlorides accelerate the corrosion of the internal steel reinforcement leading
eventually to loss of serviceability. Reinforcement bars made of glass fiber reinforced
polymers (GFRP) are corrosion resistant and therefore may be suitable for internal
reinforcement of RCBC in these circumstances. Although this study is not related to
the type of reinforcement used in the culvert, this chapter describes the performance
of the concrete box culvert bridge reinforced entirely with GFRP bars in brief.

9
Fig. 2.1: Different types of Culverts
a) Single Cell Arch Culvert
b) Double Cell Arch Culvert
d) Multiple-Cell Rectangular Box Culvert c) Single-Cell Rectangular
Box Culvert
e) Single-Cell Metal Plate Culvert

10
2.3 DIFFERENT COMPONENTS OF BOX CULVERT
Reinforced concrete box culvert is a simple structure with two horizontal slabs, one is
top slab and other one is bottom slab, and two vertical side walls. Slabs and walls are
monolithically constructed. Bottom slab also acts as its foundation. A box culvert
buried under an embankment with its different components is shown in Fig. 2.2. Box
culverts may have wing walls. Fig. 2.3 shows a buried box culvert with wing walls.
Cut-off walls should be used at both end of the culvert to avoid the erosion of the
streambed. Cut-off wall is also shown in Fig. 2.3.
Fig. 2.2: Different components of a Box Culvert
Fig. 2.3: Different components of a Box Culvert with Wing Walls

11
2.4 WORKS ON REINFORCED CONCRETE BOX CULVERTS
The behaviour of buried box culverts under different conditions has been studied by a
number of researchers in recent years. Numbers of analytical explorations have been
conducted over the last two decades for investigating the behaviour of reinforced
concrete box culverts (RCBC). The study done by Tadros e.t al. (1989) had critically
examined the provisions of AASHTO (1978) standard specifications for highway
bridges relative to design of reinforced concrete box culvert. Their study dealt
specifically with two topics: soil pressures and design methods. In their investigation,
2-D finite element model CANDE developed by Katona et al. (1981) was used to
carry out the soil pressure analysis. The influence of soil-structure interaction is
considered in the CANDE model. According to Tadros et al. (1989) review, computer
analysis by CANDE had shown that soil pressures could be far in excess of the
AASHTO (1978) speci�fied values. These results were also consistent with the
previous field tests data conducted by Russ (1975) and Allen et al. (1978) on a
concrete box installation. Based on these observations, extensive computer analysis
was performed by Tadros et al. (1989) on two vastly different soils, clay and silty
sand. This resulted in proposing formulas for prediction of more realistic soil
pressures on all four sides of box culvert.
Influence of the proposed soil pressures recommended by Tadros et al. (1989) on
culvert size and reinforcement was demonstrated by numerical examples in their
study. They had employed both the working stress design (WSD) and the strength
design (SD) methods, because AASHTO (1978) had provided the designer with the
option of using either WSD or SD. However, it is important to add that according to
specifications of AASHTO (1996), design of RCBC should be based on ultimate
strength principles. By completing nu�merical examples of culvert designs, an
economic com�parison was made by them based on the resulting member thicknesses
and required reinforcement. It was shown in their investigation that, even with the
increase in soil pressures as suggested, use of the more rational strength design
method could result in material savings.
Tsuji and Miyake (1988)’s research was undertaken to investigate the application of
the mechanical characteristics of expansive cement concrete to precast concrete box

12
culverts, and to manufacture chemically prestressed concrete (CPC) box culverts with
bending characteristics identical to those of reinforced concrete (RC) units of greater
thickness. According to their observations, prevention of flexure cracking had been a
major concern in the design of precast concrete box culverts and member thickness of
such culvert had been often determined by cracking conditions. They also suggested
that increase in member thickness would be accompanied by increase in weight,
which should not be desirable for any precast concrete member. Therefore, they
recommended that expansive cement concrete could be utilized in precast box
culverts, just as in reinforced concrete members by Okamura and Tsuji (1974) to
introduce chemical prestress to the concrete and initial strain to the reinforcement.
They further mentioned that resistance to cracking was thereby increased and member
thickness could be reduced. The shapes and dimensions of the precast box culverts
used in the experiments of Tsuji and Miyake (1988) and methods of loading are
shown in Fig. 2.4 (a). In one of their experiments, the bottom slab was curved as
shown by the example of the commercially available RC box culvert in Fig. 2.4 (b).
The experimental results of Tsuji and Miyake (1988) had described the relationship
between strains of tension reinforcement at the centre portion of the top slab and load
shown in Fig. 2.5. The cracking pattern of a CPC box culvert is shown Fig. 2.6. They
suggested that more or less the same cracking occurred in case of RC. In their study,
effect of loads on the flexural crack width at the centre portion of the top slab was
revealed as shown in Fig. 2.7(a). According to their observations, flexural crack
widths were smaller with CPC than with RC under typical loads due to the effect of
chemical prestress. From their experimental results, the relationship between
deflection at the centre of top slab and load was obtained as shown in Fig. 2.7(b). It
was also observed that the deflections of CPC were larger than those of RC at all
times because of the smaller slab thickness.

13
(a)
Fig 2.4: (a) Dimensions and Load Positions and (b) Reinforcement Layout for Precast RC Box Culvert used in Tsuji’s Experimental Study (1988)
(b)
Strain increment in reinforcement, 10-6
Load
, tf

14
Fig. 2.5: Load versus Strain relationship for tension reinforcement obtained from Tsuji and Miyake (1988)’s Study
Fig. 2.6: Crack Pattern in chemically prestressed concrete culvert obtained from Tsuji and Miyake (1988)’s Study
Fig. 2.7: (a) Relationship between Load and Flexural Crack Width and (b) Load-Deflection Relationship obtained from Tsuji and Miyake (1988)’s Study
Load
, tf
Flexural Crack Width, mm
(a)
Load
, tf
Deflection, mm
(b)

15
The experimental investigation conducted by Tsuji and Miyake (1988) was based on
the concentrated load (one point or two point loading) only. The effects of earth fill or
other soil pressures were not taken into consideration. The length of the precast
culverts in the direction of stream was very small which varied from 400 mm to 1080
mm. The stress developed in the direction of stream and subsequent flexural cracks
were also not considered. Therefore, the results of experiments conducted on RC box
culverts in their study will not be very effective to verify the performance of the
present developed model.
Duncan et al. (1986) performed a finite element analysis to develop design equations
for crown and haunch moment capacities of corrugated metal box culverts. Sargand et
al. (1992) conducted experimental and analytical investigation on the structural
evaluation of corrugated metal box culverts. Preliminary investigations done by
Smeltzer and Bentz (2004) into shear behavior of concrete box culverts gave an
indication of the design’s susceptibility to shear failure in the box slab. They suggest
that the use of elastic methods in design of reinforced concrete box culvert is
somewhat conservative, and hence the code predictions should be slightly
conservative.
The study carried out by Jao et al. (2003) observed that when box culverts were
located under engineering structures such as roadways and buildings, the overlying
foundation loading might induce considerable soil pressure on the culverts causing
excessive culvert deformation. According to their investigation, the soil pressures
induced by the foundation loading needed to be properly considered to minimize
possible adverse effect of foundation loading on the culvert performance. They
pointed out that most of the studies related to earth pressure distribution around
concrete box culverts dealt only with embankment loading that had crossed over
culverts. Embankment loading in general spanned over the entire culvert width, while
footing loading might cover only part of the width. The difference in loading size
compared with culvert width might result in considerable difference in the loading-
induced soil pressure around box culverts. According to their observation, because

16
plastic yielding within the surrounding soil might occur due to considerable culvert
deformation under the foundation loading, a reasonable approach to analyse soil
pressures on the culvert required a full consideration of both elastic and plastic
behaviours of the soil. In their study, the finite element method of analysis developed
by Jao (1995) based on the elasto-plasticity theory was used to analyse soil pressures
on square reinforced concrete box culverts induced by overlying strip footings. A
typical finite element mesh together with the various symbols used in their analysis is
shown in Fig. 2.8, which shows only one-half of the footing-culvert-soil system
analysed. In the analysis performed by them, both the concrete culvert and the
surrounding soil were idealized as nonlinear elastic-perfectly plastic materials. The
conditions analysed included reinforced concrete strip footings centred above parallel
reinforced concrete square box culverts for different culvert size, location, and wall
thickness.

17
Fig. 2.8: Typical Finite Element Mesh Developed by Jao et al (2003)
Based on the results of the analysis performed by them, the distributions of vertical
soil pressure on the vertical planes through culvert center as well as culvert edge, and
on the horizontal plane through top of culvert were obtained. Results of their 2D FE
analysis had shown that the vertical soil pressure distribution had varied considerably
with culvert size, wall thickness, and depth to culvert. They suggested based on their
analytical results that on the vertical plane through culvert center, the vertical pressure
distribution between footing base and culvert top had shown some resemblance to the
Boussinesq vertical stress distribution for smaller culverts and on the other hand, for
larger culverts, the vertical soil pressure had decreased with depth, and the magnitude

18
of pressure had decreased with increasing culvert size. Also, the normal soil pressure
distribution along culvert periphery was determined from their analysis results. On the
culvert sides, the normal pressure distribution had shown stress transfer from mid
section to both corners. They suggested that the soil pressure distribution around box
culverts induced by the overlying footings was strongly dependent on soil-culvert
interactions and an optimal structural design of box culverts might require iteration
procedures. The results of their study had provided an insight into soil-culvert
interaction mechanism. Their study was made using a 2-D finite-element computer
program developed based on the theory of elasto-plasticity. They did not consider the
effect of culvert span in the direction of stream. So, there is a scope of study in this
field. However, more data were needed not only for better understanding of the
interaction mechanism but also for the development of a rational method for structural
design of square box culverts overlain by strip footings.
Alkhrdaji et al. (2000)’s investigation had presented an overview of the design,
construction, and laboratory and field testing of a box culvert bridge reinforced with
glass fiber reinforced polymers (GFRP) bars. The bridge was constructed to replace
a bridge that was built in the early 1980s and consisted of three concrete-incased
corrugated steel pipes. Due to excessive corrosion of the steel pipes, the original
bridge became unsafe to operate. They had selected the dimensions of the box culvert
units to be 1.5 by 1.5 m with a wall thickness of 150 mm based on hydraulic
requirements and site characteristics. In their study, BOXCAR developed by Federal
Highway Administration (1989) had been used to perform structural analysis and
design of buried single cell reinforced concrete box culverts. The new box culvert
units were designed for maximum forces determined in accordance with AASHTO
design guidelines. Box units were designed for failure controlled by GFRP rupture
using equilibrium and compatibility equations. The results of the final design of the
box culvert unit used in their study are shown in Fig. 2.9.

19
Fig. 2.9: Details and reinforcement of GFRP reinforced box culvert used in Alkhrdaji et al. (2000)’s Study
In the investigation of Alkhrdaji et al. (2000), two specimens were tested in the lab to
verify their design and performance. The test setup and instrumentation are shown in
Fig. 2.10. The two specimens were identical to the units installed in the field. The
boxes were subjected to quasi-static loading cycles up to failure. Deformations and
reinforcement strains were measured throughout the test.

20
Fig. 2.10: Test setup and instrumentation used in Alkhrdaji et al (2000)’s Study
Fig. 2.11: Comparison of Experimental and Theoretical load-deflection behavior observed in Alkhrdaji et al (2000)’s Study
21
According to their experimental results, for the first box, the first crack had occurred
at mid-span of the top panel at approximately 124.5 kN which was comparable with
the theoretical cracking load of 112.5 kN, computed by them based on elastic
behavior. They also found that two cracks had occurred simultaneously on both walls
at approximately 142.3 kN and final cracks had occurred at the negative moment
region of the top slab panel at approximately 155.7 kN, the maximum load attained
during the test. The behavior of the second box was similar to the first one. Fig. 2.11
has illustrated a comparison of theoretical and experimental results of the two boxes
presented in their study where a good correlation could be observed. Also, as seen in
this figure, the initial cracking load was well above the ultimate design load.
Therefore, Laboratory testing carried out by them had indicated that the design
approach was accurate and conservative and the experimental displacement behavior
was compared well with theoretical values. However, as their study was carried out
on concrete precast box culvert reinforced with GFRP bars, the results and
observations of their study will not be used to verify the performance of the present
model developed for concrete box culverts reinforced with deformed steel bars.
The present study is initiated upon two box culverts W10 (drainage) and W17 (traffic
underpass) located approximately 3.5 km away from the west end of Jamuna
Multipurpose Bridge (JMB). Large cracks were developed shortly after constructions
of these culverts. On April 17, 1998, Ahmed, et al. (2001) visited the culvert sites and
investigated the cracks. Figs. 2.12 (a) and 2.12 (b) shows the cracks of W17 (before
repair) and W10 (after repair) respectively. W17 is 5.02 m high and 73 m wide in the
direction of stream while W 10 is 4.4 m high and 57.5 m wide in the direction of
stream. W10 is a twin box culvert with a span parallel to traffic 10.59 m and W17 is a
single box culvert with 5.7m spans parallel to traffic. It appeared that the cracks were
due to the soil settlement caused by the dredge filled soil of the approach road
embankment. To investigate the causes of the cracks without destruction of the
culverts, necessity of numerical simulation of the structures was felt.

22
Vertical cracks along the walls of W17
Physical separation of bars at the base slab of W17
a. Cracks and separatedreinforcements of underpassW17
b. Repaired cracks of culvert W10
Fig 2.12: Cracked and Repaired Structures obtained from Ahmed et al. (2001) Studies
Ahmed et al. (2001) pointed out that simulating a culvert failure using finite element
method appeared to be a highly complex soil-structure interaction problem. They
carried out an analytical investigation of the problem using finite element method to
find out the reasons for formation of these cracks and checked the consultants design
report. Settlement of the soil was found to be the most prominent contributing factor
in producing the cracks. Their study presented a finite element analyses of these
structures using three dimensional model that explained causes of cracking and
showed the inadequacy of the two dimensional modelling done by the consultants.
Focus was drawn on the design assumptions that were required for these structures.
Results of FE analysis conducted by them showed that the structures were highly
stressed in the direction perpendicular to traffic at the bottom due to settlement
without considering the presence of live loading which revealed that the
reinforcement in the direction perpendicular to traffic was totally inadequate. The
analytical results performed by them will be used to verify the performance of the
model developed in the present study. Therefore, the study carried out by them will be
discussed in detail in the next chapter.

23
Experience of Ahmed et al. (2001) with failure of two box culverts suggested that
proper attention must be given to design appropriate reinforcement for the stresses
developed in the direction of stream. Chowdhury (2003) also conducted 3-D finite
element analysis on W10 and W17 box culvert considering soil structure interaction
using ANSYS and compared the results with the results of FE analysis performed by
Ahmed et al (2001). His comparison showed very small variation between the two
separate methods of analysis. A parametric study was carried out in his study to show
the effect of different parameter on principal stress and differential settlement. He
observed that parameters like fill height, culvert size and length, slab and wall
thickness and modulus of elasticity of soil had significant influences in principal
stress and differential settlement.
Ahmed (2005) investigated the behaviour of buried box culverts in fill soil. In his
study a 3-D FE model of the box culvert was developed with surrounding soil
considering soil-structure interaction with ANSY. Fig. 2.13 shows the isometric view
of the 3-D finite element model of box culvert developed by him. Therefore, three
distinct soil layers or profiles were incorporated in this model. These layers are
designated as Layer1, Layer2 and Layer3 as shown in Fig. 2.14. Layer1 was
considered as the fill soil of the embankment where as Layer2 and Layer3 were site
soil. Solid element had been used to generate the three dimensional soil profiles with
different set of material properties for different layers. Soil layers modelled as a linear
elastic material ignoring their plastic behaviour. The reinforced concrete box culvert
consists of two slabs (top and bottom) and two walls. All the components of the
culvert are modelled using four-nodded shell element. The interface or contact
between the culvert and soil has been modelled using Contact element. Fig. 2.14
shows the 3-D Finite Element Model of Concrete Box-Culvert with close up view of
the interface element. For the developed model, the following boundary conditions
are imposed as shown in fig. 2.15:
Vertical planes parallel to traffic on the roadway i.e. x-y plane: z movement is
restrained (Uz = 0).
Vertical planes parallel to the direction of stream or traffic of the culvert i.e. z-
y plane: x movement is restrained (Ux = 0).
Bottom surface of the soil surface modelled i.e. x-z plane: y movement is
restrained (Uy = 0).

24
Fig. 2.13: Isometric View of the 3-D Finite Element Model of Box-Culvert
(Ahmed (2005))

25
Fig. 2.14: 3-D Finite Element Model of Concrete Box-Culvert with close up view of the interface element (Ahmed (2005))
Ahmed (2005) shows that when the dimension perpendicular to traffic is large
compared to the dimension parallel to traffic and when there is soil over-burden
pressure in addition to traffic load, the effect of settlement of soil, which produces
beam bending like effect on the whole structure in the lateral direction (direction
perpendicular to traffic), is to be considered in the design. Because of the high density

26
of soil fill material, significant arching develops in the lateral direction of the culverts
that can create pressure in the head walls or wing walls and result in tension in the
direction perpendicular to traffic. All these conditions invalidate the simple
assumption of plane stress condition and necessitate 3-D analysis and design
procedure that considers the stress developed in the direction of stream in addition to
the stress developed in the direction of traffic.
Fig-2.15: Boundary Conditions of the Ahmed (2005)’s Model.
Ahmed (2005) also performed parametric study and investigated the effect of i) co-
efficient of friction, ii) fill height, iii) side slope, iv) length of culvert in the direction
of stream, v) culvert size and vi) soil modulus. Examining the effect of above
mentioned parameters on axial force and bending moment along the direction
perpendicular to the traffic he developed an empirical formulae for prediction of

27
maximum bending moment developed at the mid-span of the culvert. A comparison
between his study and the present stidy is discused in chapter 4.
2.5 REMARKS
This chapter give a brief account of summarizes the analytical and experimental
research work conducted for studying the behaviour of buried reinforced concrete box
culvert. It appears that the earlier computational or analytical research in this area is
confined in two-dimensional plane-strain idealization of the problem. The stress
developed in the direction of stream is not given much attention except in the works
of Ahmed et al. (2001) and Ahmed (2005). The work of Ahmed et al. (2001)
identified the importance of considering stress in the direction of stream, but no
guideline was developed so that, the controlling parameters are identified and a
rational reinforcement design can be made. Ahmed (2005) identify the parameters
influence the behaviour of box culvert and proposed a formula to calculate the
maximum bending moment developed at the mid-span along the stream of the culvert.
But a linear elastic soil model of Ahmed (2005) may not be adequate to show the
complex behaviour of soil. Hence, it is obvious that there is a scope of further study in
this area with more realistic non-linear soil model.

Chapter 3
DEVELOPMENT OF FINITE ELEMENT MODEL
3.1 INTRODUCTION
This chapter describes the three-dimensional finite element modeling of box culvert
buried under fill soil. The finite element model consists of three components – the
reinforced concrete box culvert, the soil and the interface between these two.
Selection of element type for modeling the soil, the culvert and the interface is also
described
3.2 SELECTION OF FINITE ELEMENT SOFTWARE
There are a number of good finite element analysis computer tools or packages
readily available in the civil engineering field. They vary in degree of complexity,
usability and versatility. Such packages are ABAQUS, DIANA, ANSYS, STRAND,
ADINA, FEMSKI, and STAAD etc. Some of these programs are intended for a
specific type of structure. Of all these, the package ABAQUS has been proved to be
relatively easy to use considering its detailed documentation, flexibility and versatility
of its capabilities. Moreover different feature of soil and soil-structure interaction can
be easily simulated by ABAQUS. The version of ABAQUS that has been used for
this research work is ABAQUS 6.8.
3.3 DEVELOPMENT OF SOIL CULVERT FINITE ELEMENT MODEL
For developing a box culvert buried under fill soil, its different parts have to be
understood clearly. Fig. 3.1 shows a typical diagram of a box culvert buried under fill
soil. Soil under the box culver can be divided in two layers as original site soil and
bedding soil. Original soil is the existing field soil. To install the culvert, upper layer
of the field soil has to be prepared, which is called bedding layer. Generally this layer
is improved from original soil layer or it may be prepared from fill soil. After
preparation of bedding layer box culvert is installed. Finally embankment is build

27
with fill soil. Fill soil can be divided in to two layers. Soil layer from top of the
bedding layer up to the height of box culvert can be called side fill layer and the layer
over the box culvert can be called top fill soil. Actually fill height is the height of top
fill soil layer. Property of side fill soil and top fill soil are usually similar. Different
soil layers are shown in Fig. 3.2. For stability both side of the embankment is sloped.
This slope varies from 1:1 to 1:3 generally 1:2.
Fig. 3.1: Schematic Diagram of the Buried Box Culvert System
Fig. 3.2: Different layers of soil in buried box culvert system
The finite element modeling of the current problem consists of three components –
the soil, the box culvert and the interface between the soil and the culvert. Fig. 3.1
shows the schematic diagram of a buried box culvert system. It has two plane of
Z
Y
Fill Soil
Original Soil Layer ((ho)
Bedding Layer
Side Fill Soil Box Culvert

28
symmetry also shown in Fig.3.1, one along the center line of embankment and another
along the center line of the box culvert. Because of the symmetry, only quarter of the
culvert is analyzed with appropriate boundary conditions. Fig. 3.3 shows the
schematic diagram of the quarter of the buried box culvert system that will be used for
developing the present 3-D FE model.
Fig. 3.3: Schematic View of the quarter of the Buried Box Culvert System
3.3.1 Modeling of Soil
3.3.1.1 Element

29
The behavior of soil is quite complex because of its nonlinear phenomena and several
other factors such as its interaction with structures and time dependent effects creep,
temperature and load history. Due to the orthotopic nature of soil, selection of proper
element and material property inputs are very important to simulate the actual
condition. The soil is modeled using C3D8 and C3D6 elements. C3D8 is 8-noded
brick used for the three-dimensional modeling of solid structures. Each nodes of the
element has three degrees of freedom at each node: translations in the nodal x, y, and
z directions. C3D6 is 6-noded wedge. Like C3D8 each nodes of the element has three
degrees of freedom. Soil of different soil layers modeled by same elements but they
are differ as using different material properties
Fig. 3.4: C3D8 and C3D6 elements
3.3.1.2 Material
Soil is modeled as a elastoplastic isotropic material. So elastic property and plastic
property have to be defined. Elastic property is defined as a linear elasticity base on
elastic modulus (E) and Poisson’s ratio (ν). But defining plastic property of a soil is
rather complex. ABAQUS have four plastic martial models for soil as:
Extended Drucker-Prager models
Modified Drucker-Prager/Cap model
Mohr-Coulomb plasticity
Critical state (clay) plasticity model

30
In the present study Extended Drucker-Prager model is selected for soil plasticity as it
has following features.
to be used to model frictional materials, which are typically granular-like
soils and rock, and exhibit pressure-dependent yield (the material becomes
stronger as the pressure increases).
to be used to model materials in which the compressive yield strength is
greater than the tensile yield strength.
allow a material to harden and/or soften isotropically.
generally allow for volume change with inelastic behavior: the flow rule,
defining the inelastic straining, allows simultaneous inelastic dilation
(volume increase) and inelastic shearing.
can include creep if the material exhibits long-term inelastic deformations.
can be defined to be sensitive to the rate of straining.
can be used in conjunction with either the elastic material model like
Linear elastic behavior.
can be used in conjunction with the models of progressive damage and
failure to specify different damage initiation criteria and damage evolution
laws that allow for the progressive degradation of the material stiffness
and the removal of elements from the mesh and
to be intended to simulate material response under essentially monotonic
loading.
The yield criteria for this class of models are based on the shape of the yield surface
in the meridional plane. The yield surface can have a linear form, a hyperbolic form,
or a general exponent form.
For this analysis hyperbolic yield surface is selected. This surface is illustrated in Fig.
3.5 and 3.6. Basic parameter of this model is the inclined angle of yield surface in the
meridional plane (β), cohesion of the material (d′) and the dilation angle (ψ). Angle to
yield surface (β) can be easily relate to the angle internal frictional angle (φ) of soil by
the equation 3.1
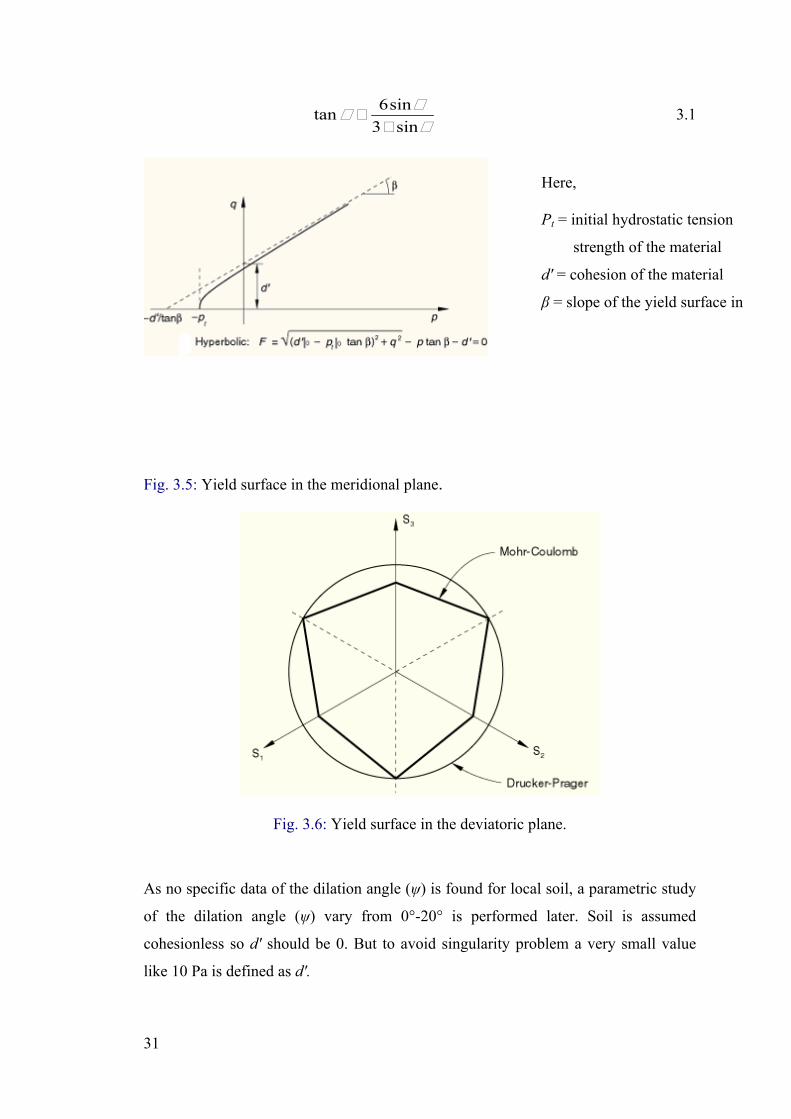
31
jjj
sin3sin6tan=
= 3.1
Fig. 3.5: Yield surface in the meridional plane.
Fig. 3.6: Yield surface in the deviatoric plane.
As no specific data of the dilation angle (ψ) is found for local soil, a parametric study
of the dilation angle (ψ) vary from 0°-20° is performed later. Soil is assumed
cohesionless so d′ should be 0. But to avoid singularity problem a very small value
like 10 Pa is defined as d′.
Here,
Pt = initial hydrostatic tension
strength of the material
d′ = cohesion of the material
β = slope of the yield surface in the p–q stress plane

32
Extended Drucker-Prager model is capable of hardening and softening. Fig. 3.7 shows
yield surface and hardening in the p–q plane and flow rule of this model. Fig. 3.8
shows a typical hardening curve of soil.
:
Fig. 3.7: Yield surface and hardening in the p–q plane and flow rule
of Hyperbolic model
0
50
100
150
200
250
0 0.02 0.04 0.06 0.08 0.1 0.12Plastic Strain
Yiel
d St
ress
, KPa
Fig. 3.8: Typical hardening curve of soil (BRTC Test Result)
3.3.2 Modeling of Box Culvert

33
The reinforced concrete box culvert is modeled using four-nodded element named
S4R and S3R. S4R is 4-noded doubly curved general-purpose shell element with
reduced integration with hourglass control and finite membrane strains. S3R is 3-
noded triangular general-purpose shell element. Both the elements have six degree of
freedom at each node: translations in the nodal x, y and z directions, and rotations
about the nodal x, y, and z-axes. Stress stiffening and large deflection capabilities are
included. The geometry and node locations for shell elements are shown in Fig. 3.9.
Box culverts are generally made of Reinforced Cement Concrete (RCC). Linear
elastic model is selected as material model.
Fig. 3.9: S4R and S3R shell elements
3.3.3 Semi infinite Soil Modeling
Generally any soil problem can be assumed as semi infinite problem. Original soil,
bedding soil and fill soil are extended to a large extent compare to the studied area in
all direction. To simulate the phenomena spring element is used at bottom of original
soil layer and side of the original soil, bedding soil and fill soil as shown in Fig 3.10.
The normal stiffness, K of spring should be based upon the stiffness of the surfaces in
contact. To calculate the normal stiffness K equation 3.2 is be used.
K = ES Asoil 3.2
Where:
K = The normal stiffness; ES = The modulus of elasticity of the corresponding Soil
and ASoil = The area of the soil effective in the contact.
34
Fig. 3.10: Schematic diagram of spring arrangement
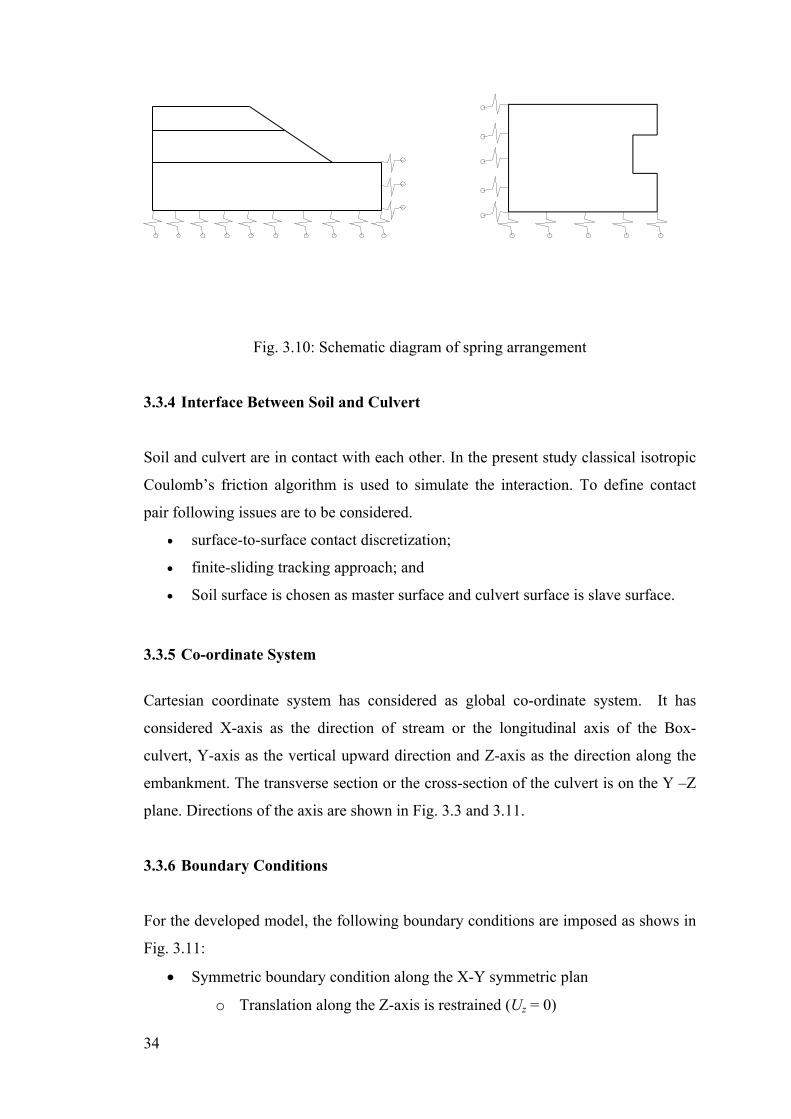
3.3.4 Interface Between Soil and Culvert
Soil and culvert are in contact with each other. In the present study classical isotropic
Coulomb’s friction algorithm is used to simulate the interaction. To define contact
pair following issues are to be considered.
surface-to-surface contact discretization;
finite-sliding tracking approach; and
Soil surface is chosen as master surface and culvert surface is slave surface.
3.3.5 Co-ordinate System
Cartesian coordinate system has considered as global co-ordinate system. It has
considered X-axis as the direction of stream or the longitudinal axis of the Box-
culvert, Y-axis as the vertical upward direction and Z-axis as the direction along the
embankment. The transverse section or the cross-section of the culvert is on the Y –Z
plane. Directions of the axis are shown in Fig. 3.3 and 3.11.
3.3.6 Boundary Conditions
For the developed model, the following boundary conditions are imposed as shows in
Fig. 3.11:
Symmetric boundary condition along the X-Y symmetric plan
o Translation along the Z-axis is restrained (Uz = 0)

35
o Rotation about X-axis is restrained ( Rx = 0)
o Rotation about Y-axis is restrained ( Ry = 0)
Symmetric boundary condition alone the y-z symmetric plan
o Translation along the X-axis is restrained (Ux = 0)
o Rotation about Y-axis is restrained ( Ry = 0)
o Rotation about Z-axis is restrained ( Rz = 0)
Fig. 3.11: Boundary Condition of the Developed Model
3.4 IDEALIZATION OF MATERIALS AND INTERFACE PROPERTIES
For the purpose of analyses, it is essential to estimate the material properties of the
components of the soil-structure interaction system. This section describes the
simplification of different properties of actual structure to be used in the finite
element model.
3.4.1 Soil Properties

36
Subsurface exploration should be carried out to determine the presence and influence
of geologic and environmental conditions that may affect the performance of buried
structures. For buried structures supported on footings and for pipe arches and large
diameter pipes, a subsoil investigation should be conducted to evaluate the capacity of
foundation materials to resist the applied loads and to satisfy the movement
requirements of the structure. The type and anticipated behavior of the foundation soil
shall be considered for stability of bedding and settlement under load. The type,
compacted density and strength properties of the soil envelope adjacent to buried
structure should be established. For standard concrete structures, the backfill soils
comprising the soil envelope should conform to the requirement of AASHTO M145
or ASTM D2487-92 given in Table 3.1 and 3.2.
Table: 3.1. Soil Classifications for Secant Modulus of Soil, Es
Soil Group
Grain Size Soil Types
Unified Soil Classification
Symbols*
I Coarse Well Graded Gravel or Sandy Gravel GW
Poorly Graded Gravel or Sandy Gravel GP
Well Graded Sand or Gravelly Sand SW
Poorly Graded Sand or Gravelly Sand SP
II Medium Clayey Gravel or Clayey-sandy Gravel GC
Clayey Sand or Clayey Gravelly Sand SC
Silty Sand or Silty Gravelly Sand SM
(CAN/CSA-S6-00, 1996)
For parametric study, the modulus of elasticity of the soil is estimated using the SPT
values from RPT-Nedeco-BCL (May, 1987) and equations suggested by J.E. Bowles
(1988). Standard values of Poisson’s ratio suggested by J.E. Bowles (1988) are used
for performing the analysis. The values have been tabulated in table 3.3 and table 3.4.
Table 3.5 shows the data used for the surrounding soil of the culvert (W17) in the FE
model.

37
Table: 3.2. Values of Es for Various Soils
Soil Group
No.
Grain Size
Standard Proctor Density (According to ASTM D 698-91) Es (MPa)
I Coarse Between 85% and 90% 6
Between 90% and 95% 12
Greater than 95% 24
II Medium Between 85% and 90% 3
Between 90% and 95% 6
Greater than 95% 12
(CAN/CSA-S6-00, 1996)
Table: 3.3. Soil modulus of elasticity (Es)
Soil type Es (MPa)
Very soft Clay Soft ClayMedium ClayHard ClaySandy Clay
2-155-2515-5050-10025-250
Loose sandSiltyLooseDense
5-2010-2550-81
Sand and gravelLooseDense
50-150100-200
Table: 3.4. Values of Poisson’s Ratio (ν)
Soil Type ν
Clay, Saturated 0.4-0.5Clay, unsaturated 0.1-0.3Sandy Clay 0.2-0.3Silt 0.3-0.35Sand (Dense)Coarse (voids ratio= 0.4-0.7)Fine-grained (voids ratio= 0.4-0.7)
0.150.25

38
Table: 3.6. Unit Weights, Effective Angles of Internal Friction and Coefficients of Friction with Concrete (Nilson et al (1986))
Soil Unit weightspcf (Kg/m3)
ΦDegrees µ
1.Sand or gravel without fine particles , highly permeable
110 – 120(1760-1920) 33 – 40 0.5 – 0.6
2.Sand or gravel with silt mixture, low
permeability
120 – 130(1920-2080) 25 – 35 0.4 – 0.5
3.Silty sand, sand arid gravel with high clay content .
110 – 120(1760-120) 23 – 30 0.3 – 0.4
4. Medium or stiff clay 100 – 120(1600-1920) 25 – 35 0.2 – 0.4
5. Soft clay. Silt 90 – 110(1440-1760) 20 – 35 0.2 – 0.3
Table: 3.5. Properties of culvert materials and dimension (for W17)
Data used for analyses of W17
Location of soil
Unit weight (N/mm 3)
Modulus of ElasticityEs (MPa)
Poisson’s ratio
Depth/height of soil
(m)Embankment
soil-1 1.73x10⁻⁵ 41.0 0.35 7.35
Underlying soil-2 1.00x10⁻⁵ 15.0 0.35 1.00
Underlying soil-3 5.0x10⁻⁶ 5.0 0.35 5.00
Table: 3.7 Angle of Internal Friction of Different River Deposit of Bangladesh (Yasin, S.J.Md. (1990)

39
Location Relative Density
(%)
Angle of
Internal Friction (degree)
Teesta at Rangpur 46 36.67
8 34.910 34.1
Maghna at Dhaka 52 34.9
35 34.2815 32.71
Rajarbagh at Dhaka 77 32.26
42 31.6914 30.28
Jamuna at Bhuiyanpur,
Tangail81 38.2
50 36.4326 34.65
3.4.2 Concrete properties
For modeling different components of the reinforced concrete box-culvert, modulus
of elasticity of concrete Ec and Poisson’s ratio v are assumed 25MPa and 0.2
respectively.
3.5 SENSITIVITY ANALYSIS
For sensitivity analysis a reference model is chosen on which sensitivity of different
parameters are analyzed. The model developed for the present study consisting of a
single box culvert is shown in Fig. 3.12. For the reference model, the height of the
culvert is 6 m with a span of 6 m parallel to traffic. Hence, the culvert chosen for the
sensitivity analysis is an average sized 6 m by 6 m box with 6 m of backfill above the
top slab. There are two distinct underlying soil profiles below the bottom slab of the
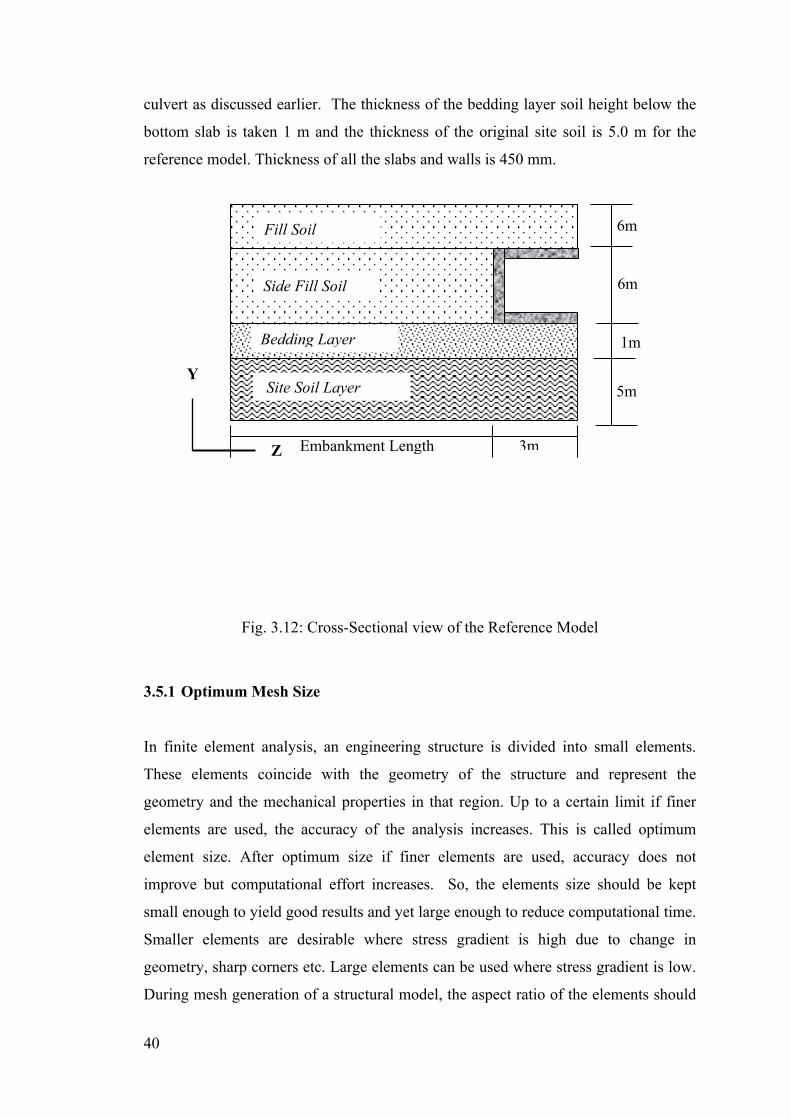
40
culvert as discussed earlier. The thickness of the bedding layer soil height below the
bottom slab is taken 1 m and the thickness of the original site soil is 5.0 m for the
reference model. Thickness of all the slabs and walls is 450 mm.
Z
Y
1m
5m
6m
6m
Embankment Length 3m
Fill Soil
Site Soil Layer
Bedding Layer
Side Fill Soil
Fig. 3.12: Cross-Sectional view of the Reference Model
3.5.1 Optimum Mesh Size
In finite element analysis, an engineering structure is divided into small elements.
These elements coincide with the geometry of the structure and represent the
geometry and the mechanical properties in that region. Up to a certain limit if finer
elements are used, the accuracy of the analysis increases. This is called optimum
element size. After optimum size if finer elements are used, accuracy does not
improve but computational effort increases. So, the elements size should be kept
small enough to yield good results and yet large enough to reduce computational time.
Smaller elements are desirable where stress gradient is high due to change in
geometry, sharp corners etc. Large elements can be used where stress gradient is low.
During mesh generation of a structural model, the aspect ratio of the elements should

41
be kept in consideration. If the aspect ratio of any element in the developed model is
abnormally high, solution may not converge
The aim of optimization for any specific problem is to determine the rational values of
design variables in order to minimize or maximize an objective function with given
constraints. It is very significant to determine, “what should be the exact number of
elements for a structure for which the FEA mesh is optimum?” There is no
exact answer to this question. However, if the mesh becomes continuously finer
until the variation in the result is less than a specified value or percentage, the
optimum mesh density will be reached.
Fx
Z
Mz
Y
X
Fig. 3.13: Culvert Moment (Mz) and Axial Force (Fx) of the Box Culvert
From the earlier studied it is evident that huge tensile stress developed at bottom slab
along the longitudinal direction of the culvert. Reason of this stress may be either
bending moment or axial force or both. So, only the culvert moment (Mz) along the

42
direction of stream and and axial force (Fx) are studied. Fig. 3.13 clearly shows
Mz and Fx of the box culvert. So culvert moment and deflection of the midpoint
of the top slab of the box culvert are considered as the prime variable for
mesh sensitivity analysis. Fig. 3.14 and 3.15 show the variation of culvert
moment at midsection and deflection of the midpoint of top slab with different
element sizes and found that 1m element size is well enough to get optimum
result.
0
100
200
300
400
0 0.5 1 1.5 2 2.5
Element Size, m
Cul
vert
Mom
ent (
Mz),
MN
-m
Fig. 3.14: Culvert Moment (Mz) at midsection Vs Element Size

43
-150
-125
-100
-75
-50
-25
00 0.5 1 1.5 2 2.5
Element Size, m
Def
lect
ion,
mm
Fig. 3.15: Deflection of the midpoint of the Box Culvert Vs Element Size
3.5.2 Effect of Soil Extension
Generally any soil problem can be idealized as a semi infinite problem. Original site
soil is extended downward (Y-direction) to a large extent. Original site soil also
extended to a large extent along the direction of stream (X-direction) and along the
direction of embankment (Z-direction). Fill soil is extended along the direction of
embankment (Z-direction). However, FE models can not extent to infinity. So, it is
necessary to determine the optimum extent of that soil after which the effect of soil
becomes nominal.
3.5.2.1 Soil Extension along the Y-direction (Downward)
44
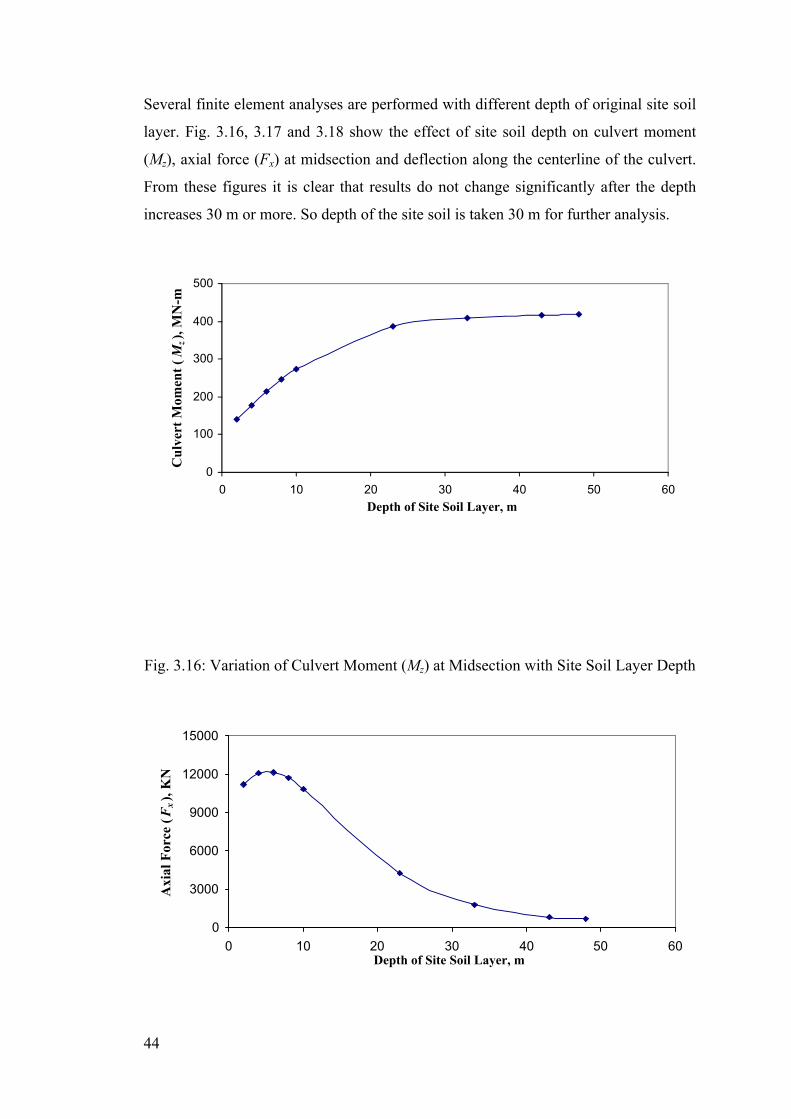
Several finite element analyses are performed with different depth of original site soil
layer. Fig. 3.16, 3.17 and 3.18 show the effect of site soil depth on culvert moment
(Mz), axial force (Fx) at midsection and deflection along the centerline of the culvert.
From these figures it is clear that results do not change significantly after the depth
increases 30 m or more. So depth of the site soil is taken 30 m for further analysis.
0
100
200
300
400
500
0 10 20 30 40 50 60Depth of Site Soil Layer, m
Cul
vert
Mom
ent (Mz)
, MN
-m
Fig. 3.16: Variation of Culvert Moment (Mz) at Midsection with Site Soil Layer Depth
0
3000
6000
9000
12000
15000
0 10 20 30 40 50 60Depth of Site Soil Layer, m
Axi
al F
orce
(Fx),
KN

45
Fig. 3.17: Variation of Culvert Axial Force (Fx) at Midsection with Site Soil Layer
Depth
-60.0
-50.0
-40.0
-30.0
-20.0
-10.0
0.00 5 10 15 20 25
Distance from Mid Section, m
Diff
eren
tial D
iffle
ctio
n, m
m
6m Site Soil Layer24m Site Soil Layer32m Site Soil Layer42m Site Soil Layer48m Site Soil Layer
Fig. 3.18: Variation of Differential Deflection at Midpoint of the Culvert with Site
Soil Layer Depth
3.5.2.2 Soil Extension along X-direction (Stream Direction)
Fig. 3.19 and 3.20 show the effect of soil extension from the edge of embankment at
existing ground level along the X-direction on culvert moment (Mz) and axial force
(Fx) at midsection of the box culvert. From these figures it is clear that results do not
change significantly after the soil extension increases 10 m or more. So soil extension
along X-direction from the edge of embankment is taken 10 m for further analysis.

46
0
200
400
600
800
0 5 10 15 20 25
Soil Extension along X-Direction, m
Culv
ert M
omen
t (Mz)
, MN-
m)
Fig. 3.19: Variation of Culvert Moment (Mz) at midsection with Soil Extension along
X-direction
0
1000
2000
3000
4000
0 5 10 15 20 25
Soli Extension along X-Direction, m
Axi
al F
orce
(Fx),
KN
Fig. 3.20: Variation of Culvert Axial Force (Fx) at midsection with Soil Extension

47
along X-direction
3.5.2.2 Soil Extension along Z-direction (Embankment Direction)
Original site soil and fill soil are extended to a large extent along the direction of
embankment. Several analyses are performed for different values of embankment
length. Fig. 3.21 and 3.22 show the effect of soil extension along Z-direction on
culvert moment and axial force at midsection of the box culvert. From these figures it
is clear that results do not change significantly after the depth increases 24 m more.
So soil extension from the side wall of the culvert is taken 24 m for further analysis.
0
200
400
600
800
10 15 20 25 30 35 40
Soil Extension along Z-Direction, m
Cul
vert
Mom
ent (Mz)
, MN
-m
Fig. 3.21: Variation of Culvert Moment (Mz) at midsection with Soil Extension along
Z-direction

48
0
1000
2000
3000
4000
10 15 20 25 30 35 40Soil Extension along Z-Direction, m
Axi
al F
orce
(Fx),
KN
Fig. 3.22: Variation of Culvert Axial force (Fx) at midsection with Soil Extension
along Z-direction
3.5.3 Analysis Steps
Nonlinear analysis may be step sensitive. If large step increment is used accuracy may
not be achieved up to the level and difficult to converge. If very too small increment
is used it may led to unnecessary computational effort. In the present study soil is
modeled as a nonlinear material. Any kind of contact analysis is always nonlinear
problem. Significant amount of nonlinearity is involved in the present model.
Carefully selection of number of analysis steps is really important for convergence,
accuracy and to save computational time. In the present study automatic steps is used
but it is controlled by assigning maximum and minimum increment values. Several
analyses are performed to check the steps sensitivity. Fig. 3.23 and 3.24 show the
effect of number of steps on culvert moment at midsection and deflection of top slab
at midpoint of the culvert with respect to slab edge. It is clear that present analysis is
not largely depend on number of analysis steps and number of steps more than 20 is
well enough for accuracy.

49
0
50
100
150
200
250
300
0 50 100 150 200 250
Number of Analysis Steps
Cul
ver
t M
omen
t (M
z),
MN
-m
Fig. 3.23: Variation of Culvert Moment at midsection with Number of Analysis Steps
-40-35-30-25-20-15-10-50
0 50 100 150 200 250
Number of Analysis Steps
Diff
ere
nti
al
Def
orm
atio
n,
mm
Fig. 3.24: Variation of Differential Deflection of the Midpoint of the Culvert with
Number of Analysis Steps
3.5.4 Effect of Co-efficient of Friction of Soil with Concrete Box Culvert

50
The bottom and top slabs and side wall of the culvert are in direct contact with
surrounding soil. Their contact is simulated with the contact algorithm of Coulomb’s
frictional criteria. Co-efficient of friction (f) between soil and concrete surface is an
important parameter for this kind of interaction. To observe the effect of f, a typical
range is selected which varies from 0.15 to 0.5. For different values of f, a series of
analyses are performed using the selected standard model for sensitivity analysis. The
effect of coefficient of friction (f) on the behavior of the buried box culvert in fill soil
is shown in Fig. 3.25 and 3.26.
Fig. 3.25 illustrates the effect of f on the maximum moment at the midsection of the
box culvert. From Fig-3.25, it can be revealed that there is no significant variation in
the values of Culvert Moment (Mz) at midsection with the variation of f. For the
purpose of simplicity, the coefficient of friction value is taken as 0.3 in the
forthcoming studies. From Fig. 3.26, it can be observed that the culvert axial force
(Fx) in the X direction or in the direction of stream increases with the increases of f.
0
50
100
150
200
250
0.1 0.15 0.2 0.25 0.3 0.35 0.4 0.45
Frictional Coefficent (f )
Cul
vert
Mom
ent (Mz),
MN
-m

51
Fig-3.24: Variation of Culvert Moment at Midsection with Frictional Coefficient
0
3000
6000
9000
12000
0.1 0.15 0.2 0.25 0.3 0.35 0.4 0.45
Frictional Coefficent (f )
Axi
al F
rce
(Fx),
KN
Fig-3.25: Variation of Culvert Axial Force at Midsection with Frictional Coefficient
3.5.5 Effect of Soil Parameters on Box Culvert
Soil is modeled by Extended Drucker-Prager model. Basic parameters of this model is
the inclined angle of yield surface in the meridional plane (β), cohesion of soil (d′)
and the dilation angle (ψ). Inclined angle to yield surface (β) can be easily relate to the
angle of internal friction (φ) of soil by the equation 3.1.
Angle of internal friction (φ) of soil varies a lot from soil to soil. Table 3.5 and 3.7
recommend the various values of φ of different types of soil. A series of analysis are
performed to see the effect of φ on box culvert where φ varies from 25° to 45°. Fig.
3.27 and 3.28 show the effect of φ on culvert moment (Mz) at midsection and
differential deflection at midpoint of the culvert top slab with respect to slab edge.
From these curves it is clear that with the variation of φ, the culvert moment (Mz) at

52
mid section along the direction of stream does not vary significantly. Differential
settlement also does not vary significantly with the variation of φ. So it clear that
angle of internal friction (φ) of soil has little effect on the observed behavior of the
box culvert. On the other hand Yasin (1990) tested different river deposit of
Bangladesh and found that angle of internal friction of river deposit varies from 32° to
38°. As soil from river deposit is generally used as dredge fill soil, a median value of
φ is taken 35° for the further analysis.
0
50
100
150
200
250
300
350
400
20 25 30 35 40 45 50
Angle of Internal Friction (φ) of soil
Cul
ver
t M
omen
t (M
z),
MN
-m
Fig. 3.27: Variation of Culvert Moment at midsection with Angle of Internal
Friction of Soil

53
-40
-35
-30
-25
-20
-15
-10
-5
020 25 30 35 40 45 50
Angle of Internal Friction of Soil
Diff
eren
tial D
efor
mat
ion,
mm
Fig-3.28: Variation of Differential Deflection at midpoint of the Culvert with Internal
Frictional Angle of Soil
No recommended value for dilation angle (ψ) of soil is found. A series of analysis
have performed with different values of ψ varying from 2° to 20° to see the effect of
dilation angle on the present model. Fig. 3.29 and 3.30 show the effect of ψ on culvert
moment at midsection and deflection of top slab with respect to slab edge at midpoint
of the culvert. From these figures it is clear that influence of dilation angle on the
present model is insignificant. So a value of 10° is taken for dilation angle for further
studies.

54
0
50
100
150
200
250
300
350
400
0 5 10 15 20 25
Dilation Angle
Cul
ver
t M
omen
t (M
z),
MN
-m
Fig-3.29: Variation of Culvert Moment at Midsection with Dilation Angle of Soil
-40
-35
-30
-25
-20
-15
-10
-5
00 5 10 15 20 25
Dilation Angle
Diff
ere
nti
al
Def
orm
atio
n,
mm

55
Fig. 3.30: Variation of Differential Deflection at Midpoint of the Culvert with Dilation Angle of Soil
3.6 VERIFICATION OF FE MODEL
A number of analytical investigations on studying the behavior of reinforced concrete
box culverts (RCBC) have been conducted over the last two decades and important
advances have been achieved. It appears that the computational research in this area is
confined in two-dimensional plane-strain idealization of the problem. Few
experimental and analytical (with 3-D finite element modeling) investigations for
studying the behavior of soil-structure interaction of buried RCBC have been made.
Although there have been a number of analytical investigations carried out, there is no
special attention has been given on the stresses developed in the direction of stream or
the longitudinal direction of a buried RCBC in fill soil. In this article, the numerical
modeling of the buried RCBC is verified with the available experimental results and
the 2-D and 3-D analysis performed by others.
3.6.1 Verification of FE Results with the Results of 3-D Analysis
As discussed earlier, the present study is initiated upon failure of two box culverts
W10 and W17 located approximately 3.5 km away from the west end of Jamuna
Multipurpose Bridge (JMB). Large cracks were developed shortly after constructions
of these culverts. On April 17, 1998, Ahmed, et al (2001) visited the culvert sites and
investigated the cracks. Figs. 3.30 (a) and 3.30 (b) show the cracks of W17 (before
repair) and W10 (after repair) respectively. It appeared that the cracks were due to the
soil settlement caused by the dredge filled soil of the approach road embankment. To
investigate the causes of the cracks necessity of numerical simulation of the structures
was felt.
Ahmed, et al. (2001) carried out an analytical investigation of the problem using finite
element method to find out the reasons for formation of these cracks and checked the

56
consultants design report. Settlement of the soil was found to be the most prominent
contributing factor in producing the cracks. The problem is further complicated by the
fact that soil settlement has at least four different components – elastic, inelastic,
consolidation and creep components. However, to assess the adequacy of
reinforcement design, it is not always necessary to consider all these factors.
Vertical cracks along the walls of W17
Physical separation of bars at the base slab of W17
a. Cracks and separatedreinforcements of underpassW17
b. Repaired cracks of culvert W10
Fig. 3.30: Cracked and Repaired Structures
FE analyses based on elastic material properties had been conducted by Ahmed, et al.
(2001) to investigate the causes of failure of the structures. Their study presented a
finite element analyses of these structures using three dimensional model that
explained causes of cracking and showed the inadequacy of the two dimensional
modeling done by the consultants. Focus was drawn on the design assumptions that
were required for these structures. Results of FE analysis conducted by them showed
that the structures were highly stressed in the direction perpendicular to traffic at the
bottom due to elastic settlement without considering the presence of live loading
which revealed that the reinforcement in the direction perpendicular to traffic was
inadequate. Their experience with failure of two box culverts suggested that proper
attention must be given to design appropriate reinforcement for the stresses developed
in the direction of stream.

57
Ahmed, et al. (2001) had analyzed these two culverts by using a finite element
package STRAND6.1. Results obtained from their analysis are used to verify the
model developed by another finite element package ABAQUS in this present study.
Data from table 3.5 were used for the analyses of the culvert (W17). Fig. 3.32 shows
the contours of vertical deformation for the culvert (W17) and Fig. 3.33 shows the
contours of vertical deformation for that culvert (W17) studied by them.
Fig. 3.32: Contour of vertical deformation of the box culvert (W17) developed in the present study
Fig. 3.33 Contour of vertical deformation for the box culvert (W17) studied by
Ahmed, et al (2001)
Results obtained from the present FE analysis shows that the vertical deflection of the
soil at the centerline of culvert section (section perpendicular to traffic) is 108.55 mm

58
and at the edge of the road is 98.12 mm giving a differential settlement of 10.43 mm.
Fig. 3.34 shows the graphical presentation of the vertical deflections from the
centerline of the culvert to the edge of the roadway. Results obtained from FE
analysis done by Ahmed et al (2001) using STRAND6.1 shows that the vertical
deflection of the soil at centerline of culvert section (section perpendicular to traffic)
is 81.3 mm and at the edge of the road is 69.8 mm giving a differential settlement of
11.5 mm. From the comparison of the two results, it is observed that the variation of
the differential settlement is only about 10%. Ahmed (2005) also analyzed the same
W17 culvert with ANSYS found this differential settlement 11.329 mm. Variation of
differential settlement with the present study is near 8%. Differential settlement is less
in present study. Reason for this variation may be the nonlinear behavior of soil where
stress may be redistributed easily.
-150
-130
-110
-90
-70
-50
-30
-10
0 5 10 15
Distance from midsection of culvert,m
defle
ctio
n, m
m
Fig. 3.34: Vertical Deformations or Settlement of the Culvert along the direction of the stream in the present study

59
Results of FE analysis performed by Ahmed et al. (2001) had shown that the culvert
was highly stressed at the bottom due to differential settlement. According to their
analysis results, peak tensile stress at the bottom of the culvert is about 4.9 N/mm2 for
W17. Ahmed (2005) also observed the same phenomena and found the peak tensile
stress at the bottom is about 8.526 N/mm2. Results obtained from the present FE
analysis also illustrate that the culvert was highly stressed at the bottom. From the
results of the present study, it is observed that the peak tensile stress at the bottom of
the culvert is about 5.87 N/mm2. From the comparison with two results, it is evident
that the variations of peak tensile stress are about 16.5 % and 45.2% respectively.
There may be a number of reasons for this variation. One of the reasons behind this
variation is the consideration of the frictional drag between the culvert and the
surrounding soil in the present developed model which is ignored in Ahmed et al.
(2001)’s study.
3.6.2 Verification of FE Model with Test Results
3.6.2.1 Kentucky Test result
To validate the box culvert model, present study model are compared with test data
from a full scale field installation. Test data on buried box culvert is very limited.
However, Russ (1975) and Allen et al. (1978) for the Kentucky Department of
Transportation have supplied some test data. From these reports data was obtained
from a box culvert with interior dimensions of 1.2 m and 1.2 m and 254 mm thick
walls (4×4ft and 10in. thick) in Clark Country, Kentucky, designed as an embankment
with yielding foundation within a bedding rock foundation. Instrumentation on the
box included 8 normal pressure gauges 2 for each side and few strain gages on
reinforcement which are reported not to function properly. So, normal pressures are
used to verify the present model. Pressure gage readings were taken at the backfill
height of 6.6 m (21.6 ft) and 23.5 m (77 ft).
Fig. 3.35 shows the soil pressure around the box culvert predicted analytically by
ABAQUS in present study. Soil pressure on top slab at 6.6m fill is 166 Kpa and 166.8
KPa respectively in Kentucky test and in present study and at 23.5 m fill height they
are 660KPa and 655 KPa respectively. Under bottom slab test soil pressures are 220
KPa and 758 Kpa for 6.6 m and 23.5 m fill height respectively but in present studu

60
these pressures are 218 KPa and 763Kpa. Soil pressures on side wall are found little
bit less in present study than Kentucky test data. In present study soil pressures on
side wall are 43KPa and 45.8 KPa at 6.6m fill height and 145KPa and 160KPa at
23.5m Fill height where Kentucky results are 43 KPa, 56KPa, 149KPa and 169KPa
respectively. The analytically predicted soil pressure values are fairly close to those
determined experimentally. Ahmed (2005) also simulate the Kentucky test result for
23.5 m fill height. Results of his study are also shown in Fig. 3.35.

62
0
250
500
750
1000
012
Culvert Width, ft
Nor
mal
Str
ess,
KP
a
Present Study (H=6.6m)
Kentucky test Result(H=6.6m)Present Study(H=23.5m)
Kentuky Test Result(H=23.5m)Ahmed (2005)'s Study(H=23.5m)
0
250
500
750
1000
1250
012Culvert Width, ft
Nor
mal
Str
ess,
KPa
0
1
2
3
4
0200400
Normal Stress, KPa
Cul
vert
Hei
ght,
ft
Center Line of Culvert
Culvert Width, ft

63
Fig. 3.35: Comparison of Kentucky Test (1975) and Present Study Results for Soil Pressure on Box Culvert (4ft by 4ft) in Kpa.
3.6.2.2 Dasgupta and Sengupta (1991)’s Test on Square Box Culvert
The FE model developed in the present study is also compared with test data from a
full scale field installation of square box culvert by Dasgupta and Sengupta (1991).
They performed a large scale model test on square box culvert backfilled with sand.
A box culvert of internal dimensions of 1,200 by 1,200 mm, with 75- mm-thick
reinforced concrete slab and wall and a length of 9 m was built for the test. An area of
7-m wide and 10-m long was excavated to a depth of 2.4 m from ground level, and
the excavated pit was backfilled with dry sand. The culvert was cast on this sand bed
with M15 grade concrete. An area encompassing 2.4 m from the outer face of the side
walls of the culvert was filled with dry sand in 400-mm layers to a height of 2.4 m
above the top slab of the culvert. Sand was placed manually by a wooden box and the
sand fill was compacted by a wooden tamper. The sand fill above ground level was
retained by a brick wall with suitable stays and tie bars. The whole model was
covered to prevent water ingress into the sand fill during the experiment. The general
arrangement of the model is shown in Fig. 3.36. Twelve pressure cells (deflecting
diaphragm type) with a capacity of 200 kPa were placed at the central section of the
culvert, as shown in Fig. 3.37(a). The pressure cells were connected to two pressure
recorders (digital type) housed inside the culvert, with 10 channels in each recorder.
Twenty dial gauges were located at a section 1,200 mm from the central section, as
shown in Fig. 3.37(b). The dial gauges were set from a slotted angle frame freely
suspended within the culvert and supported outside the culvert.

64
Fig. 3.36: General arrangement of test model performed by Dasgupta .A and Sengupta .B (1991)
Fig. 3.37: (a) Location of Pressure gages, (b) Location of Dial gages
In this present study same model is analysis with ABAQUS and compare the
analytical results with test results. Fig. 3.38 and 3.39 show the comparison of
deflection of top and bottom slab of the box culvert and find that their shape and
values are fairly close. Fig. 3.40 shows the soil pressure around the box culvert. Soil
pressures obtain on top and under the bottom slab are close to the test result except the
corner region. This may happen due to the stress averaging at corner node. Pressure
on side wall is large in the model than test result but their maximum soil pressure
value appears to be very close.
(b)(a) (b)(a)

65
-4
-3
-2
-1
00 0.3 0.6 0.9 1.2
Culvert Width , m
Def
lect
ion,
mm
Present Study
Test Result
Fig. 3.38: Comparison of the Deflection of Top Slab between Present Study and Dasgupta and Sengupta (1991)’s Test
-2
-1.5
-1
-0.5
00 0.3 0.6 0.9 1.2
Culvert Width , m
Def
lect
ion,
mm
Present Study
Test Result
Fig. 3.39: Comparison of the Deflection of Bottom Slab between Present Study and Dasgupta and Sengupta (1991)’s Test

65
0
50
100
150
00.20.40.60.811.2
Nor
mal
Str
ess,
KP
a
Present Study
Dasgupta andSengupta (1991)'s Test
0
50
100
150
00.20.40.60.811.2
Nor
mal
Str
ess,
KPa
0
0.2
0.4
0.6
0.8
1
1.2
010203040
Normal Stress, KPa
Box Culvert
Fig-3.40: Comparison of the Soil Pressure around the Box Culvert in KPa between Present Study and Dasgupta .A and Sengupta .B (1991) Test
3.7 REMARKS
This chapter summarizes the development of the 3-D finite element model of the
reinforced concrete box culvert (RCBC) taking into account of the soil-structure
interaction. This chapter also describes the analytical and experimental work
conducted in the area of RCBC and verifies the performance of the developed 3-D
model with the analysis results of the 3-D and 2-D FE model and the limiting field
test data available. From this chapter, it is observed that the developed model can
successfully simulate the experimental results and the adopted FE analysis
methodology predicts the stresses to an acceptable degree of accuracy. Hence, it can
be concluded that the developed model may be utilized for the purpose of the
parametric study.

Chapter 4
BEHAVIOUR OF BURIED BOX CULVERT
4.1 INTRODUCTION
The development of the 3-D finite element model of reinforced concrete box culvert and
verification of the performance of the developed model has been described in the
previous chapter. The good agreement of the results obtained from the FE analysis of the
present model and the results available from the earlier analytical and experimental
studies indicate that the developed model can be utilized for studying the behavior of the
soil-structure interaction of the buried box culvert on fill soil. This chapter covers a
detailed study of concrete box culvert buried under fill soil with special attention to the
stress developed along the direction of stream (perpendicular to the road). Parametric
study for all the parameters that may influence the stress behavior of the box culvert is
performed. With a view to achieve this goal, parameters such as fill height, roadway
width, side slope, culvert size and coefficient of friction, etc are selected as key
influencing parameter. A number of analyses are performed to observe the response of
box culvert for each parameter. These responses have been represented graphically for
ease of understanding. The probable reasons for these behaviours have also been
explained.
4.2 SELECTION OF PARAMETERS AND DIMENSIONS OF THE REFERANCE
MODEL
In order to study the detailed behaviour of the buried box culvert in fill soil, reference
model has been chosen and analysed. For reference model the height (hc) and width (B)
of the box culvert section are chosen 6 m. Thickness of the top and bottom slabs and the
sidewalls are 450mm. Height of the fill soil (hf) is 6 m. From the sensitivity analysis
discussed in chapter 3, it is decided that height of the original site soil layer (ho) is 30m,

62
Z
1m
6m
6m
24m 3m
Fill Soil (hf)
Site Soil Layer (ho)
Bedding Layer (hb)
Side Fill Soil (hc)
Fig. 4.1: Cross Section view of the Reference Model
Y30m

63
1m
Side Slope (1:2)
10m
Site Soil Layer
Fill Soil
Bedding Layer (hb)
6m
6m hf
Box Culvert
X
Y
Fig. 4.2: Longitudinal Section view of the Reference Model
extension of soil along X-direction (direction of stream) is 10 m and the extension of the
soil along Z-direction (direction of embankment) is 24 m. For reference model these
limiting values are chosen with 1m thick bedding soil layer (hb). Width of the
embankment is taken as 20 m. Co-efficient of friction between soil and concrete surface
is taken 0.3. Fig. 4.1 and 4.2 show the sectional views of the model. Modulus of
Elasticity of Soil of all layers is taken 10 MPa, Poison’s ratio is 0.35 and density is 1920
kg/m3. Plastic properties of soil as Drucker-Prager Model parameters are 35° angle of
internal friction, 10 Pa cohesion and 10° dilation angle. For concrete modulus of
elasticity and Poisson’s ratio are 25 GPa and 0.2 and density is 2400 kg/m3. Side slope of
30m

64
the embankment is 1:2. Different parameters of the reference model are tabulated in
Table 4.1.
Table: 4.1. Different parameters of the reference model
Coefficient of Friction 0.3
Modulus of Elasticity of Soil 10 MPa
Poisson’s Ratio of Soil 0.35
Angle of internal Friction of Soil 35°
Dilation Angle of Soil 10°
Unit weight of Soil 1920 kg/m3
Modulus of Elasticity of Concrete 25 GPa
Poisson’s Ratio of Concrete 0.2
Unit weight of Concrete 2400 kg/m3
4.3 BEHAVIOUR OF REFERENCE MODEL
Reference model discussed in the previous article is analysis to understand the behaviour
to the box culvert buried under an embankment. Fig. 4.3 and 4.4 show the contours of
vertical deflection (Uy) of the model and box culvert. Form the contours, it is observed
that deflection is maximum at the midsection and decreases along the direction of Stream
(X-direction). Fig. 4.5 shows the deflection of the middle point of the top slab of the box
culvert along the stream (X-direction) and found that deflection is maximum at
midsection and minimum at the edge.

65
Fig-4.3: Contours of Vertical Deflection (Uy) of the Reference Model
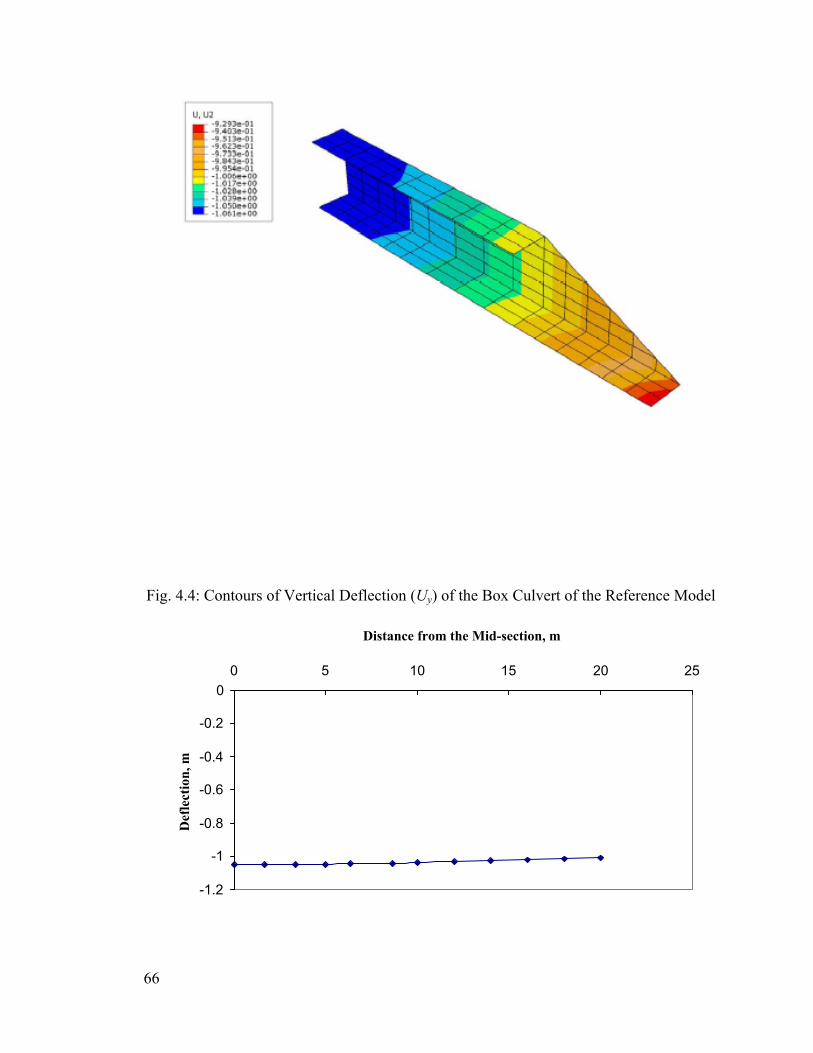
66
Fig. 4.4: Contours of Vertical Deflection (Uy) of the Box Culvert of the Reference Model
-1.2
-1
-0.8
-0.6
-0.4
-0.2
00 5 10 15 20 25
Distance from the Mid-section, m
Def
lect
ion,
m

67
Fig. 4.5: Vertical Deflection (Uy) of the Middle Point of the Top Slab along the Central
Line
Fig. 4.6 shows the culvert moment (Mz) of box culvert along the stream (X-direction) and
found that moment is also maximum at midsection and minimum at the edge with a
parabolic distribution. Magnitude of the moment at midsection (Mz) is significantly high
and should not be ignored is design. Fig. 4.7 shows the axial force (Fx) of box culvert
along the stream (X-direction) and found that axial tensile force decreases from mid
section to edge and become compressive at the edge. This kind of axial force is involved
from the frictional interaction between soil and box culvert. Maximum tension involves
at midsection but its magnitude is not significantly heigh. Normal Stress along X-
direction (σxx) involved only for axial force at midsection is 0.16 MPa which can be
ignored in design consideration. But according to the Ahmed et al. (2001), this tension
stress due to axial force is significant for culvert with wing walls.
0
100
200
300
400
500
0 5 10 15 20 25
Distance from the Mid-section, m
Mom
ent (Mz)
, MN
-m
Fig-4.6: Variation of Culvert Moment (Mz) along the Stream Direction
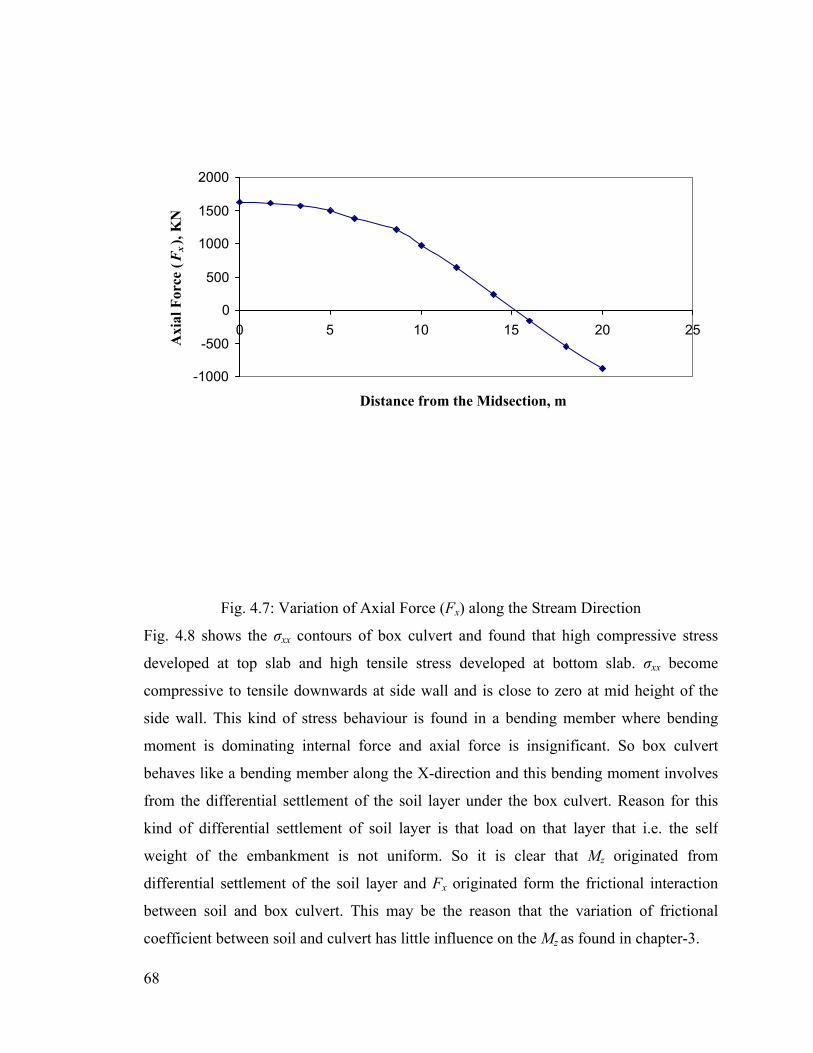
68
-1000
-500
0
500
1000
1500
2000
0 5 10 15 20 25
Distance from the Midsection, m
Axi
al F
orce
(Fx),
KN
Fig. 4.7: Variation of Axial Force (Fx) along the Stream Direction
Fig. 4.8 shows the σxx contours of box culvert and found that high compressive stress
developed at top slab and high tensile stress developed at bottom slab. σxx become
compressive to tensile downwards at side wall and is close to zero at mid height of the
side wall. This kind of stress behaviour is found in a bending member where bending
moment is dominating internal force and axial force is insignificant. So box culvert
behaves like a bending member along the X-direction and this bending moment involves
from the differential settlement of the soil layer under the box culvert. Reason for this
kind of differential settlement of soil layer is that load on that layer that i.e. the self
weight of the embankment is not uniform. So it is clear that Mz originated from
differential settlement of the soil layer and Fx originated form the frictional interaction
between soil and box culvert. This may be the reason that the variation of frictional
coefficient between soil and culvert has little influence on the Mz as found in chapter-3.

69
Fig-4.8: Contours of Normal Stress (σxx) along X-Direction
Stress paths of two soil elements are shown in Fig. 4.9 and 4.10. Stress path of soil under
the box culvert goes well below the yield surface so actually they behave like an elastic
material as shown in Fig. 4.9. Soil beside the box culvert also behaves like this. But
stress path of the soil over the top slab of the box culvert cross the yield surface. Plastic
deformation involves only at that portion of the soil but it has little influence on the
whole model. This may be the reason that, plastic parameter of the soil like angle of
internal friction, dilation angle and hardening curve has little influence over the model.

70
0
150
300
450
600
750
900
0 100 200 300 400 500 600p , KPa
q, K
PaStress PathYield Surface
Fig. 4.9: Typical Stress Path of a Soil Element below the Box Culvert
0
20
40
60
80
0 5 10 15 20 25 30 35p , KPa
q, K
Pa
Stress PathYield Surface
71
Fig. 4.10: Typical Stress Path of a Soil Element above the Top Slab of the Box Culvert
4.4 BEHAVIOUR OF A BOX CULVERT IN TRENCH INSTALLATION
Further understanding the behaviour of the box culvert a model similar to the
reference model in trench where load does not vary along the stream direction (X-
direction), as there is no embankment, is analysed. Fig. 4.11 and 4.12 show the Uy
contours of the whole model and of the box culvert in trench and Fig. 4.13 shows the
vertical deflection of top slab and found no significant differential deflection. Fig.
4.14 shows the culvert moment (Mz) of box culvert along the X-direction and Fig.
4.15 shows the variation of axial force (Fx) along the X-direction. Values of Mz is
significantly lower than that of the culvert with embankment but Fx is higher than the
axial force found in culvert with embankment as discussed is the previous article.
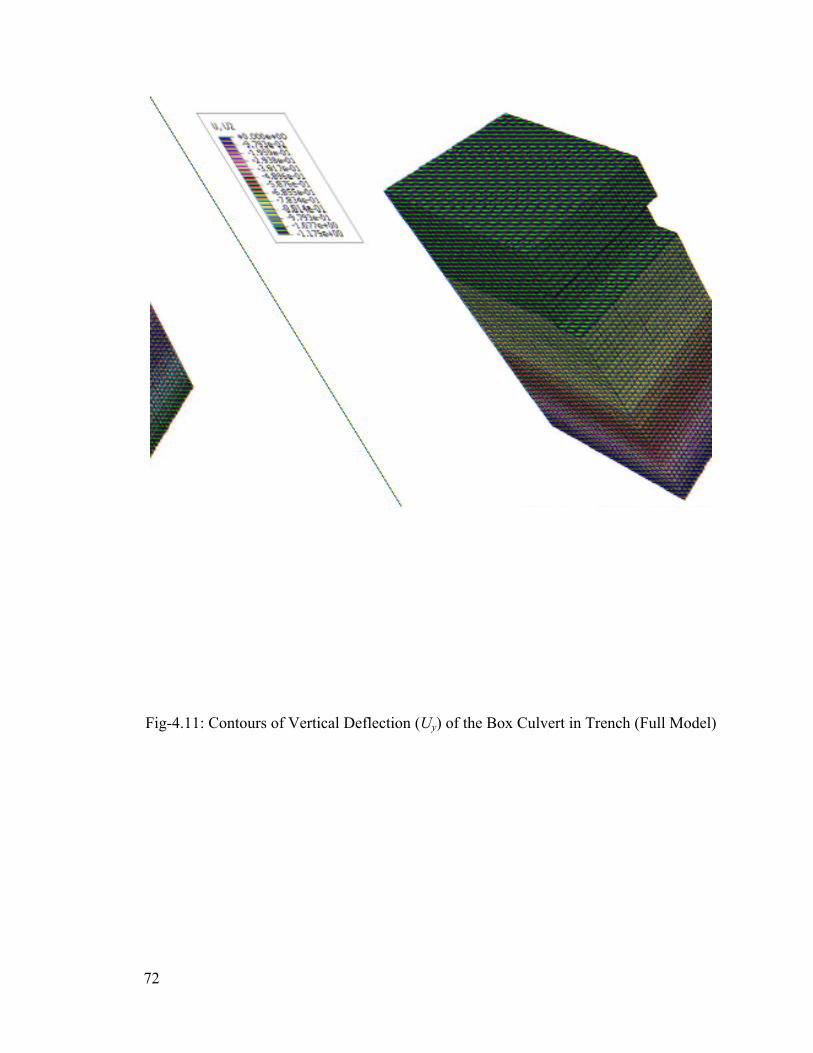
72
Fig-4.11: Contours of Vertical Deflection (Uy) of the Box Culvert in Trench (Full Model)

73
Fig. 4.12: Contours of Vertical Deflection (Uy) of the Box Culvert in Trench
-1.2
-1
-0.8
-0.6
-0.4
-0.2
00 5 10 15 20 25
Distance from the Mid-section, m
Def
lect
ion,
m

74
Fig. 4.13: Vertical Deflection (Uy) of the Middle Point of the Top Slab of the Box
Culvert in Trench along the Central Line
0
1
2
3
4
0 5 10 15 20 25
Distance from the Mid-section, m
Mom
ent (Mz)
, MN
-m
Fig. 4.14: Variation of Culvert Moment (Mz) along the Stream Direction of the Box
Culvert in Trench
0
2000
4000
6000
8000
0 5 10 15 20 25
Distance from the Midsection, m
Axi
al F
orce
(F x
), K
N

75
Fig. 4.15: Variation of Axial Force (Fx) along the Stream Direction of the Box Culvert in
Trench
So it is clear that differential load due to embankment is the main cause of such a high
moment at midsection of the box culvert buried under embankment. Plane strain analysis
of a box culvert is not sufficient for embankment installation but it can be enough for
trench installation as moment and axial force along the stream is not significantly high for
considering in design.
4.5 SELECTION OF PARAMETERS
Different parameters selected to assess their influence on the behaviour of the concrete
box culvert buried in fill soil are listed below:
1. Fill Height (hf),
2. Embankment Width (W),
3. Culvert Size (B ×B)
4. Side Slope (1:H),
5. Modulus of Elasticity of Original Site Soil (Esite)
6. Modulus of Elasticity of Fill Soil (Efill)
7. Thickness of Culvert Slab and Wall (t)
These parameters are shown in Fig. 4.1. Wide ranges of data are used for the purpose of
the parametric study. To perform the parametric study the reference model described
earlier is used. To observe the influence of a single parameter, only values of that
parameter is changed with reasonable values remaining the other parameters unchanged.
4.5.1 Effect of Fill Height(hf)
To observe the effect of soil fill height, a series of analyses has been performed using the
selected reference model for a wide range of fill height that varies from 4 m to 15 m. The
fill height (hf) is measured from the top of the top slab of the box culvert as shown in Fig.
4.1. For different values of hf, other data of reference model remain unchanged. The
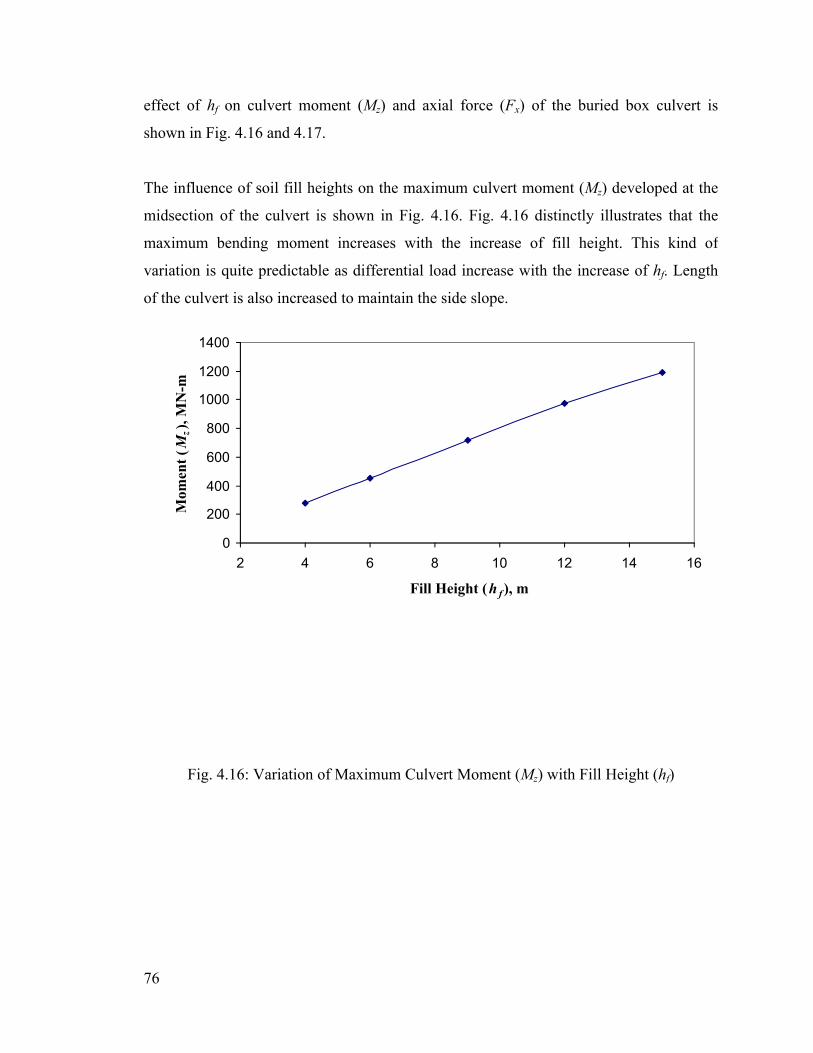
76
effect of hf on culvert moment (Mz) and axial force (Fx) of the buried box culvert is
shown in Fig. 4.16 and 4.17.
The influence of soil fill heights on the maximum culvert moment (Mz) developed at the
midsection of the culvert is shown in Fig. 4.16. Fig. 4.16 distinctly illustrates that the
maximum bending moment increases with the increase of fill height. This kind of
variation is quite predictable as differential load increase with the increase of hf. Length
of the culvert is also increased to maintain the side slope.
0
200
400
600
800
1000
1200
1400
2 4 6 8 10 12 14 16
Fill Height (h f ), m
Mom
ent (Mz)
, MN
-m
Fig. 4.16: Variation of Maximum Culvert Moment (Mz) with Fill Height (hf)

77
0
5000
10000
15000
20000
25000
30000
2 4 6 8 10 12 14 16
Fill Height (h f ), m
Axi
al F
orce
(Fx),
KN
Fig. 4.17: Variation of Maximum Axial Force (Fx) with Fill Height (hf)
Fig. 4.17 shows the effect of hf on the maximum axial tension (Fx) developed at the
midsection of the culvert. It is found that that the maximum axial force increases
exponentially up to 9 m of fill height and then increases almost linearly with the increase
of fill height. This may be due to the increase of frictional surface with the increases of
the culvert length.
4.5.2 Effect of Embankment Width
To observe the effect of embankment width (W) on culvert moment (Mz) and axial force
(Fx), a series of analyses has been performed using the selected reference model with
different embankment width. As the embankment width increases the length of the
culvert also increases. Embankment width varies from 10 m to 30 m in the present study.

78
Other data of reference model remain unchanged. The effect of embankment width is
shown in Fig. 4.18 and 4.19.
The effect of embankment width on the maximum culvert moment (Mz) developed at the
midsection of the culvert is shown in Fig. 4.18. From Fig. 4.18 it can be interpreted that
the maximum bending moment increases with the increase of roadway width. The effect
of embankment width on the maximum axial tension (Fx) developed at the midsection of
the culvert is shown in Fig. 4.19. Fig. 4.19 distinctly illustrates that the maximum axial
force increases almost linearly with the increase of roadway width. This may be due to
the increases of frictional surface with the increases of the culvert length.
0
100
200
300
400
500
600
5 10 15 20 25 30 35
Embankment Width (W ), m
Mom
ent (Mz)
, MN
-m
Fig. 4.18: Variation of Maximum Culvert Moment (Mz) with Embankment Width.

79
0
1000
2000
3000
4000
5 10 15 20 25 30 35
Embankment Width (W ), m
Axi
al F
orce
(Fx),
KN
Fig. 4.19: Variation of Maximum Axial Force (Fx) with Embankment Width.
4.5.3 Effect of Side Slope
To build an embankment a gentle side slope has to be maintained for stability of the
sides. Practically side slope varies from 1:1 to 1:3 and 1:2 is the most common. The
arrangement of the side slope is shown in schematic longitudinal section of the culvert in
Fig. 4.2. In this parametric study, the horizontal component of the side slope (1:H) is
considered as a variable. To study its influence, a number of analyses have been
performed using the reference model for different values of H that varies from 1.0 to 3.0.
The influence of side slope (1:H) on the maximum culvert moment (Mx) developed at the
midsection of the culvert is shown in Fig. 4.20. From Fig. 4.20, it can be interpreted that
the culvert moment (Mz) increases with the increase of H. The effect of H on the
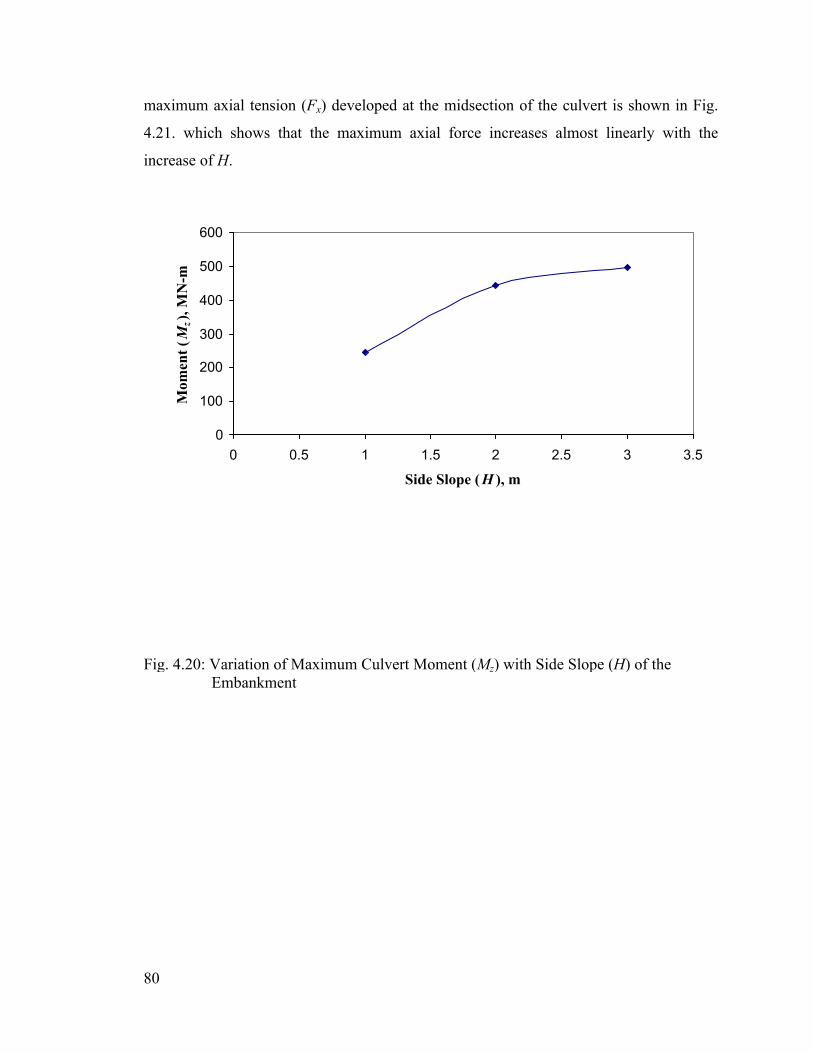
80
maximum axial tension (Fx) developed at the midsection of the culvert is shown in Fig.
4.21. which shows that the maximum axial force increases almost linearly with the
increase of H.
0
100
200
300
400
500
600
0 0.5 1 1.5 2 2.5 3 3.5
Side Slope (H ), m
Mom
ent (Mz)
, MN
-m
Fig. 4.20: Variation of Maximum Culvert Moment (Mz) with Side Slope (H) of the Embankment
81
0
1000
2000
3000
4000
0 0.5 1 1.5 2 2.5 3 3.5
Side Slope (H ), m
Axi
al F
orce
(Fx),
KN
Fig. 4.21: Variation of Maximum Axial Force (Fx) with Side Slope (H) of the Embankment
4.5.4 Effect of Culvert Size
To observe the effect of culvert size five different culvert sizes are selected to represent a
full range of culverts. The shape of the culvert is considered square (B meters by B
meters) in this parametric study. The sizes chosen ranged from 4 × 4 m to 8 × 8 m culvert
where other parameters of the reference model remain unchanged.
The influence of culvert size on the maximum culvert moment (Mz) developed at the
midsection of the culvert is shown in Fig. 4.22 for different values of B. From Fig. 4.22,
it is evident that Mz at the midsection increases with the increase of the culvert size. The
moment of inertia of the culvert section increases with the increases of the box culvert
size. So for the same differential settlement of the soil below the culvert creates more
moment at the midsection with the increases of box size.

82
0
100
200
300
400
500
600
700
800
3 4 5 6 7 8 9
Box Culvert Size ( B ), m
Mom
ent (Mz)
, MN
-m
Fig. 4.22: Variation of Maximum Culvert Moment (Mz) with Box Culvert Size (B)
The effect of culvert size on the maximum axial tension (Fx) developed at the midsection
of the box culvert is shown in Fig. 4.23. Fig. 4.23 clearly points out that the maximum
axial force increases with the increase of culvert size. As the box size increases, frictional
surfaces increases which induce more axial force.

83
0
1000
2000
3000
4000
3 4 5 6 7 8 9
Box Culvert Size ( B ), m
Axi
al F
orce
(Fx),
KN
Fig-4.23: Variation of Maximum Axial Force (Fx) with Box Culvert Size (B)
4.5.5 Effect of Modulus of Elasticity of Site Soil
The modulus of elasticity (Esite) of the original site soil has significant influence on
culvert moment (Mz) and axial force (Fx) of buried box culvert. For different values of
Esite, series of analyses are performed using the reference model. A typical range of Esite is
selected which varies from 5 MPa to 160 MPa. Higher the values of Esite represent the
stiffer soil and lower values of Esite represent the softer soil. Values of other parameters of
reference model remain unchanged.
Fig. 4.24 shows the effect of Esite� on the maximum culvert moment (Mz) developed at the
midsection of the box culvert. Maximum moment decreases exponentially with the
increases of Esite. The settlement of the soil below the culvert is more for lower values of

84
Esite. As a result the differential settlement of the box culvert becomes higher for lower
values of Esite which resulted higher values of Mz for lower values of Esite.
0
100
200
300
400
500
0 20 40 60 80 100 120 140 160 180
Modulus of Elasticity of Site Soil (E site ), MPa
Mom
ent (Mz)
, MN
-m
Fig. 24: Variation of Maximum Culvert Moment (Mz) with Modulus of Elasticity of Site
Soil (Esitel)

85
0
3000
6000
9000
12000
15000
0 20 40 60 80 100 120 140 160 180
Modulus of Elasticity of Site Soil (E site ), MPa
Axi
al F
orce
(Fx),
KN
Fig. 4.25: Variation of Maximum Axial Force (Fx) with Modulus of Elasticity of Site Soil
(Esite)
The effect of Esite on the maximum axial tension (Fx) developed at the midsection of the
culvert is shown in Fig. 4.25. Fig. 4.25 clearly points out that the maximum axial force
increases almost linearly upto the 50 MPa of Esite and after that their variation is not
significant. Maximum value of Pz is 12.15 MN which create 1.125 MPa tensile stress in
the culvert midsection.
4.5.6 Effect of Modulus of Elasticity of Fill Soil
Fig. 4.26 and 4.27 show the influence of the modulus of elasticity of fill soil (Efill) on the
buried box culvert. A series of analyses are performed using the reference model with

86
typical range of Efill which varies from 2.5 MPa to 300 MPa. From Fig. 4.26 and Fig.
4.27 it is clear that the Efill has very little influence of on Mz and Fx.
0
100
200
300
400
500
600
0 5 10 15 20 25 30 35
Modulus of Elasticity of Fill Soil (E fill ), MPa
Mom
ent (Mz)
, MN
-m
Fig. 4.26: Variation of Maximum Culvert Moment (Mz) with Modulus of Elasticity of Fill
Soil (Efill)

87
0
1000
2000
3000
4000
5000
0 5 10 15 20 25 30 35
Modulus of Elasticity of Fill Soil (E fill ), MPa
Axi
al F
orce
(Fx)
, KN
Fig. 4.27: Variation of Maximum Axial Force (Fx) with Modulus of Elasticity of Fill Soil
(Efill)
4.5.7 Effect of Box Thickness
Thickness (t) of the top and bottom slabs and side walls of a box culvert mainly depends
on the box size and fill height. With increase of box thickness self weight slightly
increases but the stiffness of the box culvert section increase significantly. For this reason
maximum culvert moment (Mz) increases with the increases of box thickness as shown in
Fig. 28. The effect of t on the maximum axial tension (Fx) developed at the mid span of
the culvert is shown in Fig-4.29. There is no significant influence of t on Fx.

88
0
100
200
300
400
500
600
0.2 0.3 0.4 0.5 0.6 0.7 0.8
Box Culvert Thickness ( t ), m
Mom
ent (Mz)
, MN-
m
Fig. 4.28: Variation of Maximum Culvert Moment (Mz) with Box Culvert Thickness (t)
0
1000
2000
3000
4000
0.2 0.3 0.4 0.5 0.6 0.7 0.8
Box Culvert Thickness ( t ), m
Axi
al F
orce
(Fx),
KN

89
Fig-4.29: Variation of Maximum Axial Force (Fx) with Box Culvert Thickness (t)
The effect of t on the maximum axial tension (Fx) developed at the mid span of the
culvert is shown in Fig-4.29. There is no significant influence of t on Fx.
4.6 COMPARISON OF PRESENT STUDY TO AHMED.A.U. (2005) STUDY
Ahmed (2005) developed a 3-D FE model of the box culverts with surrounding soil
considering soil-structure interaction with ANSYS as descried in chapter 2. In his study
the effect of the different parameters like i) co-efficient of friction, ii) fill height, iii) side
slope, iv) length of culvert in the direction of stream, v) culvert size and vi) soil modulus
are also shown. Here a comparison between the present study and Ahmed (2005) study is
presented.
There are some differences between two models developed in two studies as, Ahmed
(2005) modelled soil as linear elastic material where as in present studys Extended
Drucker-Prager model is used for soil which can better simulate the soil properties. He
used element based node to node contact to simulate the soil structure interaction where
in present study surafce to surface contact based on Coulomb friction model is used.
Ahmed (2005) imposed following boundary conditions:
Vertical planes parallel to traffic on the roadway i.e. x-y plane: z movement is
restrained.
Vertical planes parallel to the direction of stream or traffic of the culvert i.e. z-y
plane: x movement is restrained.
Bottom surface of the soil surface modeled i.e. x-z plane: y movement is
restrained.
But in the present study spring element is used to simulate the continuity of the soil along
all three directions.

90
In the present study sensitivity of soil exrention along all three directions are performed
to set the optimum dimensions of the reference model. But only sensitivity analysis of the
soil extension to the direction of embankment is performed in his study. In present study
it is clear that the behaviour of box culvert is highly sensitive to the depth of the site soil
layer up to 30 m, where as 6 m depth is selected in his study. Differential settlement of
the mid point of the culvert as shown is Fig. 3.25 varies from 21mm to 45mm when depth
of the base soil varies from 6m to 30m. and maximun culvert moment varies from
213MN-m to 443 MN-m. This makes the comparison of results of the two studies
difficult.
To compare the results of the present study with Ahmed (2005)’s study some analysis
are performed with base depth 6m. Fig. 4.30 and 4.31 show the comparison of maximum
culvert moment (Mz) and maximum axial foece (Fx) along the stream direction. From
Fig. 4.30 it is clear that Mz in present study is greater than Mz found in his study and theie
difference increases with the increases of fill height. Reason of this veriation may be the
introducing of spring elements at the bottom of the base which increase the differential
settlement further. From Fig. 4.31 it is found that axial tension is greater in present study
than his study. This may be due to follow difference approachs to simulation the soil
structure interaction in different models.
0
50
100
150
200
250
300
350
2 4 6 8 10 12
Fill Height (h f ), m
Mom
ent (Mz)
, MN
-m
Present Study
Ahmed (2005)'s Study

91
Fig. 4.30: Comparison between Present Study and Ahmed (2005)’s study, variation of
Maximum Culvert Moment (Mz) with Fill Height (hf).
0
5000
10000
15000
20000
25000
30000
2 4 6 8 10 12Fill Height (h f ), m
Axi
al F
orce
(Fx),
MN
-m
Present Study
Ahmed (2005)'s Study
Fig. 4.31: Comparison between Present Study and Ahmed, A.U. (2005)’s study, variation
of Maximum Axial Force (Fx) with Fill Height (hf).
4.7 REMARKS
This chapter discussed the detailed behaviour of the box culvert buried under fill soil and
found that there are noticeable stress variations in the two orthogonal directions in the
box culvert with embankment installation. But in case of trench installation stress
variation along the longitudinal direction is not too significant. It also summarizes the

92
detailed parametric study carried out for observing the behaviour of the developed FE
model under different conditions. It is quite evident from this study that these stress
variations appear to develop significant bending moment along the stream direction. To
minimize possible adverse effect of different parameters such as fill height, embankment
width, side slope, culvert size etc. on the culvert performance, the bending moment
induced by the mentioned parameters need to be properly considered. Finally, the
findings of the parametric study are used to develop a formula for maximum moment at
the centreline of the box culvert.

Chapter 5
PROPOSAL FOR A DESIGN RATIONALE
5.1 INTRODUCTION
Based on the results of the parametric study presented in chapter 4, an attempt would be
made to formulate a suitable empirical equation for estimating the maximum culvert
moment (Mz) at midsection of the box culvert in terms of different parameters such as fill
height, embankment width, side slope, culvert size, modulus of elasticity of site soil etc.
In the following articles, the development of the empirical equations and comparison of
the performance of the proposed equation with the finite element results is done.
5.2 DEVELOPMENT OF PROPOSED FORMULAS
From the results of parametric study discussed in Chapter 4, it can be said that there are
significant influence of different of parameters on the maximum culvert moment (Mz)max
developed at the midsection of the culvert. However, to generalize the results, all of the
maximum culvert moments (Mz) obtained from the analytical results of the developed FE
model are normalized by diving the maximum culvert moments of the reference model
(M�r).
If Mmax is the maximum moment along the stream of any box culvert, then it can be
calculated by the following equation 5.1.
Mmax = Ch Cw Cb Cs Ce Ct Mr 5.1
Where,
Mmax = The maximum moment at the midsection of the culvert in MN-m;
Mr = Constant with a value of 443 MN-m ((Mz)max of Reference Model);
Ch= Coefficient for fill heights (hf);
Cw= Coefficient for Embankment Width;
Cb= Coefficient for Box Culvert Size (B);

87
Cs= Coefficient for Side Slope (1:H) of Embankment;
Ce= Coefficient for Modulus of Elasticity of Site soil (Esite) and
Ct= Coefficient for Box Culvert Thickness (t).
Values of all these coefficients are determined in the following articles.
5.2.1 Coefficient for Fill Height (Ch)
To get the coefficient for fill heights (Ch), the culvert moment values of fig. 4.16 showing
the influence of hf on Mz, are divided by the Mr. Coefficient for fill heights (M/Mr) are
plotted against fill heights (hf) as shown in fig. 5.1. Equation 5.2 expresses Ch as a
function of hf.
Ch = 0.1824 hf -0.0905; (4m< h <15m) 5.2
Where, hf = fill height of soil above top slab of the culver in meters (up to 15 m).
y = 0.1824x - 0.0905R2 = 0.9983
0
0.5
1
1.5
2
2.5
3
0 2 4 6 8 10 12 14 16
Fill Height (h f ), m
M/M
r

88
Fig. 5.1: Coefficient for fill height (Ch) versus Fill Heights
5.2.2 Coefficient for Embankment Width (Cw)
To get the coefficient for Embankment Widths (Cw), the moment values of fig-4.18
showing the influence of Embankment width (w) on (Mz), are divided by the Mr.
Coefficient for embankment width (M/Mr) are plotted against fill heights as shown in fig.
5.2. Equation 5.3 expresses Cw as a function of Embankment Widths (w).
Cw = -0.0005 w 2 + 0.0459 w + 0.2975; (10m< w < 30m) 5.3
Where, w = Embankment width in meter.
y = -0.0005x2 + 0.0459x + 0.2975R2 = 0.9994
0
0.2
0.4
0.6
0.8
1
1.2
1.4
5 10 15 20 25 30 35
Embankment Width (w ), m
C w
Fig. 5.2: Coefficient for Embankment Width (Cw) versus Embankment Widths

89
5.2.3 Coefficient for Box Culvert Size (Cb)
To get the coefficient for box culvert size (Cb), the moment values of fig. 4.22 showing
the influence of box culvert size on Mz, are divided by the Mr. Coefficient for box culvert
size (M/Mr) are plotted against box culvert size as shown in fig. 5.3. Equation 5.4
expresses Cb as a function of culvert size.
Cb = 0.0217 B2 +0.014 B + 0.143; (4m< B < 8m) 5.4
Where, B = Height or Width of the Culvert in meters (up to 8 m).
y = 0.0217x2 + 0.014x + 0.143R2 = 0.9997
0
0.2
0.4
0.6
0.8
1
1.2
1.4
1.6
1.8
2
3 4 5 6 7 8 9
Box Culvert Size ( B ), m
M/M
r
Fig. 5.3: Coefficient for Box Culvert Size (Cb) versus Box Culvert Size (B)
5.2.4 Coefficient for Side Slope (Cs)

90
To get the Coefficient for side slope of the embankment (Cs), the moment values of fig.
4.20 showing the influence of side slope on Mz, are divided by the Mr. Coefficient for side
slope (M/Mr) are plotted against side slope as shown in fig. 5.4. Equation 5.5 expresses Cs
as a function of horizontal component of side slope.
Cs = -0.1606 H2 + 0.9266 H - 0.2107; 5 .5
Where, H = Horizontal Component of Side Slope (1:H); (1.0 to 3.0)
5.2.5 Coefficient for Modulus of Elasticity of Site Soil (Ce)
To get the Coefficient for modulus of elasticity of site soil (Ce), the moment values of fig.
4.24 showing the influence of modulus of elasticity of site soil on Mz, are divided by the
Mr. Coefficient for modulus of elasticity of site soil (M/Mr) are plotted against modulus of
elasticity as shown in fig. 5.5. Equation 5.6 expresses Ce as a function of Esite.
Ce = -0.0000005 E 3+0.0002 E2 - 0.0192 E +1.1641 5.6
Where, E = Modulus of Elasticity of site soil in MPa. (5 MPa < E < 175 MPa)
y = -0.1606x2 + 0.9266x - 0.2107R2 = 1
0
0.25
0.5
0.75
1
1.25
1.5
0 1 2 3 4
Side Slope (1:H )
M/M
r
.

91
Fig. 5.3: Coefficient for Side Slope of embankment (Cs) versus side slope
y = -5E-07x3 + 0.0002x2 - 0.0192x + 1.1641R2 = 0.9967
0
0.2
0.4
0.6
0.8
1
1.2
0 25 50 75 100 125 150 175 200
Modulus of Elasticity of Site Soil (E site ), MPa
M/M
r
Fig. 5.5: Coefficient for Modulus of Elasticity of Site Soil (C�e) versus Side Slope
5.2.6 Coefficient for Box Culvert Thickness (Ct)
To get the Coefficient for box culvert thickness (Ct), the moment values of fig. 4.28
showing the influence of box culvert thickness on Mz, are divided by the Mr. Coefficient
for box culvert thickness (M/Mr) are plotted against box culvert thickness as shown in fig.
5.6. Equation 5.7 expresses Ct as a function of t.
Ce = -0.9604 t 2 + 1.6952 t + 0.4303 5.4

92
Where, t= Box culvert thickness in meter.
y = -0.9604x2 + 1.6952x + 0.4303R2 = 0.9995
0
0.25
0.5
0.75
1
1.25
1.5
1.75
0.2 0.4 0.6 0.8
Box Culvert Thickness ( t ), m
M/M
r
Fig-5.6: Coefficient for Box Culvert Thickness (Ct) versus Box Culvert Thickness
5.3 COMPARATIVE ASSESSMENT OF THE PROPOSED EQUATIONS
Ten arbitrary sets of input data for soil fill heights (hf), side slope (1:H), embankment
width (W) width, culvert sizes (B), modulus of elasticity of site soil (Esite) and box culvert
thickness (t) are used to verify the competence of the proposed empirical relationships.
Table 5.1: Different Sets of Input Data
Example
Fill Height
Embankm
Box Size (B
Side Slope
Modulus of Elas
Box Thickness (t), m
Maximum Bending Moment, MN-m

93
(hf), m
ent Width, m
),m
(1:H)
ticity (Esite), MPa
Proposed Formula
FE Analysis
Ex-1 5 22 5 1 10 0.35 146 150Ex-2 5 20 6 2 20 0.45 319 327Ex-3 7 16 6 2 40 0.45 327 337Ex-4 7 25 7 1 20 0.5 383 391Ex-5 5 28 7 3 100 0.3 403 398Ex-6 6 20 6 2 10 0.45 451 443Ex-7 10 25 7 1 30 0.5 493 487Ex-8 12 20 5 2 25 0.35 518 504Ex-9 12 22 5 2 10 0.35 672 680Ex-10 11 28 7 3 75 0.5 981 996
0
200
400
600
800
1000
1200
Ex-1 Ex-2 Ex-3 Ex-4 Ex-5 Ex-6 Ex-7 Ex-8 Ex-9 Ex-10
Max
imun
Mom
ent (Mz)
, MN
-m Proposed FormulaFE Method

94
Fig. 5.7: Comparison of maximum culvert moment (Mz)max obtained from the analytical
results and from the proposed equation.
The values of the maximum bending moment (Mz)max at the mid of the culvert for 10
different sets of data are calculated by using proposed formula of 5.1. Finite element
analysis has been performed using the 3-D FE model developed in the present study for
the given 10 sets of data to compute (Mz)max . All two sets of results are compared in fig.
5.7. It is observed that the proposed equations provide comparable values with finite
element results for all the examples for maximum culvert moment of a box culvert along
the stream direction.
5.4 DESIGN EXAMPLE
The application of the proposed empirical equations discussed in this chapter is shown
here. The box culvert W17 near Jamuna Multipurpose Bridge as discussed in Chapter 2
and 3 is redesigned using the proposed equations as an example.
Geometry
Culvert Width (B) = 5.7 m (224.4 inch)
Culvert Height (B) = 5.7 m (224.4 inch)
Slab Thickness (t) = 450 mm (17.7 inch)
Wall Thickness (tw) = 450 mm (17.7 inch)
Fill Height above the Top Slab (h) = 2.0 m
Side Slope of the Embankment (1:H) = 1:2
Embankment Width (w) = 18 m
Loads
Only Earth Load i.e. soil over burden pressure is considered
Material Property
Compressive Strength of Concrete, fc’ = 24.8 MPa (3,600 psi)
Tensile (Yield) Strength of Steel, fy = 414 MPa (60,000 psi)

95
Unit Weight of Soil, γsoil = 1920 Kg/m3
Modulus of Elasticity of Site Soil, Esite = 5 MPa
Analysis
Maximum bending moment at the mid span of the box culvert along the longitudinal
direction is calculate using equations 5.1 to 5.6 as given below.
Coefficient for Fill Height (Ch)
Ch = 0.1824 hf -0.0905
= 0.2743
Coefficient for Embankment Width (Cw)
Cw = -0.0005 w 2 + 0.0459 w + 0.2975
= 0.9617
Coefficient for Box Culvert Size (Cb)
Cb = 0.0217 B2 +0.014 B + 0.143
= 0.9278
Coefficient for Side Slope (Cs)
C4 = -0.1606 H2 + 0.9266 H - 0.2107
= 1.0
Coefficient for Modulus of Elasticity of Site Soil (Ce)
Ce = -0.0000005E3+0.0002 E2 - 0.0192 E +1.1641
= 0.1073
Coefficient for Box Culvert Thickness (Ct)
Ct = -0.9604 t 2 + 1.6952 t + 0.4303
= 0.9967
Maximum Moment at the mid Span of the Culvert
M = Ch Cw Cb Cs Ce Ct Mr
= 116 MN-m

96
= 85495 Kip-ft
Design
The calculated value of the moment is working stress value. As mentioned earlier, the
box section is designed by LRFD method in this present case.
Fig. 5.8 Cross section of the culvert
It should be noted that the box culvert section shown in fig. 5.6 has been analyzed as T-
beam.
Factored Culvert Moment =1.3 × 85495 = 111143.5 Kip-ft
Let, assume, a = t = 17.7 inch
b = B = 224.4 inch
bw = 2tw= 35.44 inch
d = h - 75 mm = 5625 mm (221.4 inch)
As = M /[φfy{d-(a/2)}] (φ = 0.90)
= 116.2 in2
Check a = As fy/(0.85 fy b)
= 10.15 in
here, a < t, so this section is considered as rectangular beam
As = 114 in2
= 6.09 in2/ft
h tw=bw/2
t
d

97
According to 2-D analysis, temperature and shrinkage reinforcement should be provided
at both face of a section in the longitudinal direction. So, Minimum Reinforcement as
suggested by code
As = 2×0.002bt
= 0.86 in2/ft
So, it can be said that reinforcement calculated from the empirical formula proposed in
the present study is about 8 times higher than that provided by existing code. This
reinforcement is also calculated by Ahmed (2005) using his proposed formula and found
it 8.01in2/ft, but he designed the culvert using WSD method.
5.5 REMARKS
This chapter summarizes the development of an empirical relationship for maximum
bending moment of a box culvert along the stream direction. Based on the findings of the
parametric analysis, the empirical equation has been developed to calculate the maximum
bending moment that can be readily used for design purpose without going to
complicated numerical FE analysis. The validity of the proposed equation has been
established by comparing predicted moments with those obtained from the FE analysis
and it has been shown that the proposed equation predicts moments with reasonable
accuracy.
Chapter 6
CONCLUSIONS AND RECOMMENDATIONS
6.1 CONCLUSIONS
Outcomes of this analytical study on the reinforced concrete (RC) box culverts buried
under fill soil are summarized in this chapter. Through out the study a finite element
model is developed and its performance is verified with available numerical and
experimental results. The study conducted here in focuses on the development of stresses
in the box culvert developed in the longitudinal direction i.e. in the direction of the
stream, which has been ignored in the previous studies as well as in code provisions and
standard design specifications.
From this study it is clear that two dimensional plain strain analyses is adequate only for
the box culvert installed in a trench where differential settlement along the longitudinal
direction of the culvert is not significant. But in case of embankment installation there is
a noticeable stress variations in the box culvert along the direction of stream due to
differential settlement along that direction and this stress is such high that it should not be
ignored in design consideration. This kind of behavior can not be analyzed as a two
dimensional plain strain simplification. So, three dimensional analyses should be carried
out. Different parameters, which have significant influence over the stress variation, are
identified. Finally a formula is proposed for designer to calculate the maximum moment
along the direction of stream considering all influencing parameters.
In brief, the following conclusion can be derived from the current investigation:
1. 3-D numerical model should be used to get the culvert moment along the
direction of stream in case of box culvert with embankment installation. But axial
force developed due to the frictional drag is significantly low and can be ignored.
2. 2-D plain strain analysis of the box culvert is adequate for trench installation.

98
3. The parametric analysis shows that different parameters such as fill height,
embankment width, culvert size, side slope, modulus of elasticity of site soil and
thickness of culvert slab and wall have significant influence on the moment
developed in the direction of stream.
4. Parameters like coefficient of friction of soil with concrete, angle of internal
friction of soil and modulus of elasticity of fill soil has little effect on the
maximum moment developed at the midsection of the culvert along stream
direction. But, Coefficient of Friction has considerable effect on the frictional
drag along the culvert i.e. on the axial force along the direction of stream.
5. Based on the findings of the parametric study, empirical equations have been
developed to calculate the maximum moment developed at midsection that can be
readily used for design purpose without going to complicated numerical analysis.
6. The validity of the proposed equation has been established by comparing
moments calculated by proposed equation with those obtained from the FE
analysis and it has been shown that the proposed equation predicts moments with
reasonable accuracy.
6.2 RECOMMENDATIONS FOR FUTURE STUDIES
Consistent with the objectives of the present study, the overall behavior of the buried box
culvert in fill soil has been analyzed and specific guidelines have been formulated for the
stresses developed in the longitudinal direction of the culverts. However, further works
remain to be done, some indications of which are given below:
For gaining confidence in the application of the proposed equations, a full
scale model may be tested.
This study has limited to square shaped single cell box culverts. Investigations
can be extended to cover other shapes of the culverts.
Effect of water table is not included in the present study. So effect of water
table can be considered for further study.

99
Nonlinear soil properties like consolidation, creep etc can be incorporated in
the numerical model to investigated the behavior of buried box culverts.

REFERENCES
AASHTO (1996), "Standard Specifications for Highway Bridges," Sixteenth Edition,
American Association of State Highway and Transportation Officials, Washington, D.C.,
1996, pp. 355-375.
ABAQUS user’s manual (2008), Dassault Systemes Simulia Corp., Providence, RI, USA
Ahmed, A. U. (2005), "Behavior of Buired Box Culvert in Fill Soil", M.Sc. Engineering
Thesis, Department of Civil Engineering, BUET, Dhaka, 2005.
Ahmed, B., Amanat, K. M., Safiullah, A. M. M., and Choudhury, J. R. (2001), "Causes of
Cracking of Culverts on Filled Soil and their Performance after Repair," Journal of Civil
Engineering, IEB, Vol. CE 30, No.1, June 2002.
Allen, D. L., and Russ, R. L. (1978), "Loads on Box Culvert Under High Embankments:
Analysis and Design Considerations," Report No. 491, Kentucky Department of
Transportation, Lexington, Jan. 1978, pp 19.
Alkhrdaji, T. and Nanni, A. (2000), "Design, Construction, and Field-Testing of an RC Box
Culvert Bridge Reinforced with GFRP Bars", The Center for Infrastructure Engineering
Studies, University of Missouri-Rolla, CIES 02-25, 2000.
Analysis of Rigid Frame Concrete Bridges Without Higher Mathematics, 4th Edition,
Portland Cement Association (1941), Skokie, 1941, pp 40.
Attewell, P. B., Yeates, J. and Selby, A. R. (1986), "Soil Movements Induced by Tunnelling
and their Effects on Pipelines and Structures", Chapman & Hall, New York, 1986.
Bealey, Mike (1977), "Buried Concrete Pipe Soil-Structure Interaction-System Model -
NUPIPE," Concrete Pipe News, V. 27, No.2, Feb. 1977, pp. 7-12.

116
Bowles, J.E. (1988), "Foundation Analysis and Design", 4th edition, McGraw Hill.
Caltrans (2000), "Bridge Design Specifications", Section 4, 6, 17, Technical Publications,
Caltrans, U.S.A.
CAN/CSA-S6-00 (1996), "Canadian Highway Bridge Design Code", Section 7, Buried
Structures, Canada, pp. 253-293.
Chowdhury, Md. S. H. (2003), "Finite Element Analysis of Box Culvert Soil Interaction",
B.Sc. Engineering Thesis, Department of Civil Engineering, BUET, Dhaka, 2003.
Dasgupta, A. and Sengupta,, B (1991), "Laege-Scale Model Test on Square Box Culvert
Backfilled with Sand", Journal of Geotechnical Engineering, ASCE, Vol. 117, No. I,
January, 1991, pp. 156 -161.
Design Report on Structures WI0 & W17 under Contract-4, West Approach Road, May
1998, RPT-NEDECO-BCL, Ref.: PMlBI0307/563IMJT/ALG Dated 7/5/98.
Diab, Y. G., "Mechanical Method to Evaluate Safety Factors in Buried Pipes", Journal of
Transportation Engineering, ASCE, Vol. 121, No. I, JanlFeb, 1995, pp. 94 -101.
Donnaes, P., "Controlling Subsidence with Grout Injection", Concrete International, ACI
Journal, Proceedings Vol. 20, No.ll, November 1998, pp. 47-54.
Dawkins, W. P. (1981), "User's Guide: Computer Program for Design or Investigation of
Orthogonal Culverts (CORTCUL)," Instruction Report No. K-81-7, U.S. Army Corps of
Engineers, Washington, D.C., Mar. 1981, pp. 191.
Duncan, J. O., Seed, R. B., and Drawsky, R. H. (1986), "Design of Corgurrated Metal Box
Culverts", Transport Research Record, 1008, pp 33-41.
117
Federal Highway Administration, (1989), "BOXCAR User and Programmer Manual,"
Version 1.0, Publication No. FHW A-IP-89-018, Turner-Fairbamk Highway Research
Center, Mclean, Virginia, 231 pp.
Heger, F. J. and Long, K. N., (1976), " Structural Design of Precast Concrete Box Sections
to Support Surface Highway Wheel Loads with Zero to Deep Earth Cover," presented at
ASTM Committee C-12 Symposium on Concrete Pipe, Chicago, IL.
Helwany, S. (2007), “Applied Soil Mechanics with ABAQUS Applications”, Willy, John
& Sons, Inc.
Jao, M., (1995), "Interaction between Strip Footings and Concrete-Lined Soft Ground
Tunnels," Ph.D. Thesis, The Pennsylvania State University, University Park.
Jao, M., Ahmed, F., Nulwala, H. M. and Wang, M. C. (2003), "Footing-Induced Soil
Pressure around Box Culverts" EJGE paper, www.eige.com.
Katona, M. G., Vittes, P. D., Lee, C. H., and Ho, H. T. (1981), "CANDE-1980: Box Culverts
and Soil Models," Report No. FWHAIRD-80/172, Federal Highway Administration,
Washington, D.C., May 1981, pp 214.
Katona, M. G. and Vittes, P. D. (1982), "Soil-Structure Analysis and Evaluation of buried
Box-culverts Designs", Transportation Research Record No. 878, Transportation Research
Board, 1982, pp. 1-7.
Katona, Michael G. (1988), "Allowable Fill Heights for Corrugated Polyethylene Pipe",
Transportation Research Record 1191, Transportation Research Board, 1988, pp.97-105.
Lykke, S., Skotting, E. and Kjaer, U. (2000), "Prediction and Control of Early-Age
Cracking: Experiences from the Qresund Tunnel", Concrete International, ACI Journal,

118
Proceedings Vol. 22, No.9, September 2000, pp. 61-65.
Mikhelson, I. (1992), "Presast Concrete Structures for Underground Construction", Concrete
International, ACI Journal, Proceedings Vol. 14, No.ll, November 1992, pp. 30-32.
Nehdi, M., Khan, A. and Lo, K.Y. (2002), "Development of Deformable Protective System
for Underground Infrastructure Using Cellular Grouts", Concrete International, ACI Journal,
Proceedings Vol. 99, No.5, September 2002, pp. 490-498.
Nilson, A. H. and Winter, G. (1986), "Design of Concrete Structures", 10th edition, McGraw
Hill, pp. 492.
Noble, Glenn E. (1984), "Circumferential Cracking of Concrete Linings in Soft Ground
Tunnels", Concrete International, ACI Journal, Proceedings Vol. 6, No. 10, October 1984,
pp. 31-34.
Okamura, H., and Tsuji, Y. (1974), "Behavior of Chemically Prestressed Concrete
Members," Transactions, Japan Society of Civil Engineers, Tokyo, No. 225, May
1974, pp. 101-108.
Raju, N. K. (2001), "Advanced Reinforced Concrete Design", S. I. units, CBS publishers
and Distributors, New Delhi, pp. 131-140.
Report on causes of cracking of culvert WI0 and underpass W17, contract 4, JMBP, June
1998, Bureau of Research Testing & Consultation (BRTC) Department of Civil
Engineering, Bangladesh University of Engineering & Technology, Dhaka
1000, Bangladesh.
Roa, Fernando R. (2002), "Ground Subsidence due to a Shallow Tunnel in Dense Sandy
Gravel ", Journal of Geotechnical and Geoenvironmental Engineering, ASCE, Vol. 128,
No.5, May 2002, pp. 426 - 434.

119
RPT-Nedeco-BCL (1987), "Repairing of Crack Structures", Ref.: PM/BI0078/ 519/ 356/
456/ FCM, Dated 7/5/87. Drawing Nos. 4316A, 4301, 4336,4324A, 4326A, 4337 A, 4323,
4325.
Rude, Lawrence C. (1983), "Computer Modeling of the Cross Canyon Culvert",
Transportation Research Record 903, Transportation Research Board, 1983, pp. 109�
114.
Russ, R. L. (1975), "Loads on Box Culverts Under High EI ments: Positive Projection,
Without Imperfect Trench," Report No. 431, Kentucky Department of Transportation,
Lexington, Aug. 1975, pp 34.
Sargand, Shad M., Hazen, Glenn A. and Hurd, John O. (1992), "Structural Evaluation of
Box Culverts", Journal of Structural Engineering, ASCE, Vol. 118, No. 12, December 1992,
pp. 3297-3314.
Selig, E. T., McVay, M. C. and Chang, C. S. (1982), "Finite-Element Modeling of Buried
Concrete Pipe Installations (SPIDA)," Transportation Research Record No. 878,
Transportation Research Board, 1982, pp 17-23.
Smeltzer, P. and Bentz, E. (2004), "Research Suggests Conservative Design of Concrete Box
Culverts", Environmental Science and Engineering, May 2004. Retrieved from
www.esemag.com.
STRAND6.1 Finite Element Analysis System, G+D Computing System, Ptv. Ltd., Suit 508,
3 Small Street, Ultimo, NSW 2007, Australia.
Tadros, M. K. (1988), "Cost Effective Concrete Box Culvert Design," Project No. HRP83-
3, Engineering Research Center, University of Nebraska, Lincoln, 1984, pp. 224. Also,
summary paper, "Current Practice of Reinforced Concrete Box Culvert Design,"

120
Transportation Research Board, Washington, D.C., 1988, pp 26.
Tadros, K. M., Benak, J. V. and Gilliland, M. K. (1989), "Soil Pressure on Box Culverts",
ACI Structural Journal, Vol. 86, No.4, July-August 1989, pp. 439-450.
Tsuji, Y. (1975), "Fundamental Study on the Use of Chemical Prestress in Concrete,"
Transactions, Japan Society of Civil Engineers, Tokyo, No. 235, March 1975, pp.
111-124.
Tsuji, Y. and Miyake, N. (1988), "Chemically Prestressed Precast Concrete Box Culverts",
Concrete International, ACI Journal, Proceedings Vol. 10, No.5, May
1988, pp. 76-82.
Webb, Mark C., Mcgrath, Timothy J. and Selig, Ernest T. (1996), "Field Tests of Buried
Pipe Installation Procedures", Transportation Research Record 1541, Transportation
Research Board, 1996, pp. 30-38.
Yasin, S. J. Md.(1990), "Effect of Particle Characteristics on the Strength and Volume
Change Behavior of Selected Granular Deposits of Bangladesh", M.Sc. Engineering Thesis,
Department of Civil Engineering, BUET, Dhaka, 1990.

7
Table of ContentsDeclaration ivAcknowledgement vAbstract viContents vii
Chapter 1 Introduction 1.1 General 11.2 Background of Research 11.3 Objective of the Present Study 41.4 Scope and Methodology of the Study 51.5 Organization of the Thesis 5
Chapter 2 Literature Review 2.1 Introduction 72.2 Different Types of Box Culvert 82.3 Different components of Box Culvert 102.4 Works on Reinforced Concrete Box Culverts 112.5 Remarks 25
Chapter 3 Development of Finite Element Model 3.1 Introduction 263.2 Selection of Finite Element Software 263.3 Development of soil culvert finite element model 26
3.3.1 Modeling of Soil 283.3.1.1 Element 283.3.1.2 Material 29
3.3.2 Modeling of Box Culvert 323.3.3 Semi infinite Soil Modeling 333.3.5 Interface Between Soil and Culvert 343.3.6 Co-ordinate System 343.3.7 Boundary Conditions 34
3.4 Idealization of materials and interface properties 353.4.1 Soil Properties 353.4.2 Concrete properties 38
3.5 Sensitivity Analysis for Mesh Optimization 393.5.1 Optimum Mesh Size 393.5.2 Effect of Soil Extension 42
3.5.2.1 Soil Extension along the Y-direction 423.5.2.2 Soil Extension along the X-direction 433.5.2.3 Soil Extension along the Z-direction 44
3.5.3 Analysis Steps 453.5.4 Effect of Co-efficient of Friction of Soil with Concrete Box Culvert 47

8
3.5.5 Effect of Soil Parameters on Box Culvert 483.6 Verification of FE model 51
3.6.1 Verification of FE Results with the Results of 3-D Analysis 513.6.2 Verification of FE Model with Test Results 55
3.6.2.1 Kentucky Test result 553.6.2.2 Dasgupta and Sengupta (1991)’s Test on Square Box Culvert 57
3.7 Remarks 60
Chapter 4 Behavior of Buried Box Culvert 4.1 Introduction 614.2 Selection of Parameters and dimensions of the referance model 614.3 Behaviour of Reference Model in Embankment 634.4 Behaviour of a Box Culvert in Trench Installation 694.5 Selection of Parameters 72
4.5.1 Effect of Fill Height(hc) 724.5.2 Effect of Embankment Width 744.5.3 Effect of Side Slope 754.5.4 Effect of Culvert Size 774.5.5 Effect of Modulus of Elasticity of Site Soil 784.5.6 Effect of Modulus of Elasticity of Fill Soil 804.5.7 Effect of Box Thickness 81
4.6 Comparison of present study to Ahmed.A.u. (2005) study 824.7 Remarks 85
Chapter 5 Proposal for a design rationale 5.1 Introduction 865.2 Development of Proposed Formulas 86
5.2.1 Coefficient for Fill Height (Ch) 875.2.2 Coefficient for Embankment Width (Cw) 885.2.3 Coefficient for Box Culvert Size (Cb) 885.2.4 Coefficient for Side Slope (Cs) 895.2.5 Coefficient for Modulus of Elasticity of Site Soil (Ce) 895.2.6 Coefficient for Box Culvert Thickness (Ct) 91
5.3 Comparative Assessment of the Proposed Equations 915.4. Design Example 935.4 Remarks 96
Chapter 6 Conclusions and Recommendations 6.1 Conclusions 976.2 Recommendations for future studies 98
100REFERENCES 115