three essays on environmental innovation and … · departmento de economÍa de la empresa ....
TRANSCRIPT

TESIS DOCTORAL
Three Essays on Environmental Innovation and Corporate Social
Responsibility
Autora:
Rasi Kunapatarawong
Directora:
Ester Martínez-Ros
DEPARTMENTO DE ECONOMÍA DE LA EMPRESA
Universidad Carlos III de Madrid
Getafe, May 2014


TESIS DOCTORAL
THREE ESSAYS ON ENVIRONMENTAL INNOVATION AND CORPORATE SOCIAL RESPONSIBILITY
Autora: Rasi Kunapatarawong
Directora: Ester Martínez-Ros
Firma del Tribunal Calificador:
Firma
Presidente: (Nombre y apellidos)
Vocal: (Nombre y apellidos)
Secretario: (Nombre y apellidos)
Calificación:
Getafe, de de


Acknowledgement This dissertation is the result of three years of research at the Department of Business Administration, Universidad Carlos III de Madrid, where I was funded. I gratefully acknowledge the financial support from the Department, which has made my research possible. I am greatly indebt to my advisor, Ester Martínez-Ros. I would not have come this far without her. I very much appreciate all the insightful comments from the internal PhD committee (Jordi Surroca Aguilar, Itziar Castelló Molina and Elcio Mendonça Tachizawa) and other professors from Universidad Carlos III de Madrid (Josep Antoni Tribó, Andrea Fosfuri, Eduardo Melero Martín and Neus Palomeras Vilches). I would also like to express my sincere thanks to Amonrat Thoumrungroje, Olimpia C. Racela and Radha Sirinukul for believing in me and giving me the chances. Lastly, I would like to thank my father, my mother, my sister, my friends and all my supporters. Rasi Kunapatarawong May 2014


Table of content
INTRODUCCIÓN………………………………………………………………. INTRODUCTION……………………………………………………………….
i iv
CHAPTER 1: Institutional pressures and CSR attitude as determinants of CSR choices……………………………………………………………………... 1.1. Introduction…………………………………………………………………. 1.2 Theoretical background and hypotheses……………………………………... 1.2.1 CSR continuum…………………………………………………... 1.2.2 Institutional salience and CSR…………………………………… 1.2.3 Managers, attitudes and CSR…………………………………….. 1.3 Methodology…………………………………………………………………. 1.3.1 Data and procedures……………………………………………… 1.3.2 Respondents………………………………………………………
1.3.3 Measures…………………………………………………………. 1.4 Results……………………………………………………………………….. 1.5 Discussions…………………………………………………………………... 1.6 Conclusion…………………………………………………………………… 1.7 References…………………………………………………………………… 1.8 Appendix A…………………………………………………………………...
1 2 4 4 6 7 9 9 11 11 14 18 22 24 30
CHAPTER 2: A resource pool for environmental innovation………………. 2.1 Introduction………………………………………………………………….. 2.2 Literature review and hypotheses…………………………………………….
2.2.1 Where do firms get producing inputs to make decisions to develop green innovation?..............................................................
2.2.2 And the relation with size………………………………………... 2.2.3 And the relation with the intensity of sources of knowledge used………………………………………………….. 2.3 Methodology…………………………………………………………………. 2.4 Results……………………………………………………………………….. 2.5 Discussions…………………………………………………………………... 2.6 Conclusion…………………………………………………………………… 2.7 References…………………………………………………………………… 2.8 Appendix A: Correlation coefficients………………………………………...
33 34 37 37 38 40 41 47 50 55 56 61
CHAPTER 3: Environmental innovation and its impact on employment….. 3.1 Introduction………………………………………………………………….. 3.2 Literature review and hypotheses……………………………………………. 3.2.1 Environmental innovation and employment……………………... 3.2.2 Voluntary versus compliance-driven
environmental innovation………………………………………... 3.3 Methodology………………………………………………………………… 3.4 Results……………………………………………………………………….. 3.5 Discussions…………………………………………………………………... 3.6 Conclusion…………………………………………………………………… 3.7 References…………………………………………………………………… 3.8 Appendix A: Industry classification: Dirty and clean industries……………..
63 64 66 66 70 72 79 83 86 88 92


i
INTRODUCCIÓN
Dada la creciente presión sobre las organizaciones para cumplir con metas
sociales más amplias (Matten & Crane, 2005), las firmas responden incluyendo la
responsabilidad social corporativa (RSC) como una forma de reducir las tensiones entre
las necesidades humanitarias de las firmas hacia grupos más amplios de stakeholders y
compromisos económicos con propietarios/stakeholders (Margolis & Walsh 2003;
Carroll, 1991). La RSC no sólo provee beneficios a la firma (Porter & Kramer, 2006;
Graafland et al., 2003), sino que también es claro que “una corporación puede tener un
buen desempeño haciendo el bien” (Kotler & Lee, 2005).
Actualmente cerca del setenta por cien de las firmas de capital abierto en los 34
países más grandes adoptan RSC (KPMG, 2011). Sin embargo, un número de firmas
emplean RSC del tipo ‘lavado verde’ o ‘greenwashing’. Aunque también existen firmas
que son más ‘sinceras’ acerca de su implicación en RSC. En esta tesis tomamos
prestado de la teoría institucional, donde la RSC está considerada como una parte de la
nueva legitimidad (Matten & Moon, 2008; Wood, 1991), para mejorar nuestra
comprensión sobre el tema. Nuestro primer estudio trata específicamente la influencia
de presiones institucionales en la actitud individual del manager acerca de RSC y en los
diferentes tipos de RSC que la firma toma.
La evidencia empírica sobre RSC se ha centrado hasta ahora, casi
exclusivamente, en la respuesta de las firmas a presiones externas y raramente considera
las presiones internas (Mayo et al., 2013). El marco teórico híbrido que ofrecemos en el
primer estudio ayuda a contribuir a la literatura en el sentido de que ni factores externos
ni factores internos por sí solos tienen la capacidad de proveer una explicación sobre
conductas organizacionales.
La literatura ha identificado, por ejemplo, estrategias de prevención de polución
e innovación ambiental como RSC con fondo (Klassen and Whybark, 1999; Russo and
Fouts, 1997; Hart, 1995). Esto da pie al segundo y al tercer artículo de esta tesis
doctoral.
Las empresas están siendo presionadas para lograr metas más verdes junto con
sus metas económicas (Elkington, 1994; Johnstone et al., 2008). Dado que uno de los
mecanismos para que las firmas lidien con el cambio ambiental es a través de
innovaciones (Schoonhoven et al., 1990), la innovación ambiental se presenta como una
opción apropiada para tratar con esta presión creciente y el contexto cambiante (De

ii
Marchi, 2012; Johnstone et al., 2008). En el segundo capítulo, examinamos la estrategia
de búsqueda de innovación ambiental de las firmas. En el tercer capítulo, examinamos
el impacto de la innovación ambiental en el empleo.
En este momento, el estudio sobre innovación ambiental es aún escaso (Chang,
2011; Horbach, 2008; Toshi et al., 2007). Con el segundo estudio, ayudamos a arrojar
luz sobre la estrategia de búsqueda de innovación ambiental de las firmas,
específicamente sobre dónde buscan conocimiento y la importancia de cada fuente de
conocimiento para firmas de diferentes tamaños. Dado que analizamos varias fuentes de
conocimiento juntas, podemos evaluar también el grado de apertura de la estrategia de
búsqueda de las firmas. En este artículo, lo llamamos ‘breadth’ o ‘amplitud’.
Uno de los tópicos más comúnmente tratados durante debates políticos tiene que
ver con la pregunta de cómo las transformaciones de las firmas hacia ser verdes afecta
el desempeño económico y el empleo (Rennings et al., 2004). Aún así, los efectos de la
innovación ambiental sobre el empleo no son particularmente bien conocidos y las
diferentes visiones sobre el tema, así como los posibles impactos, estimulan el debate,
que se mantiene vigente. Con el tercer artículo, intentamos reducir la brecha proveyendo
más evidencia empírica al nivel de la firma. Analizamos los impactos, tanto de manera
agregada, como de manera individual para cada tipo de innovación ambiental.
Descomponemos la innovación ambiental entre voluntaria e impulsada por el
cumplimiento. Nuestro estudio también tiene importantes implicaciones,
particularmente en el diseño de micro-políticas que ayudarán a mejorar el crecimiento
del empleo.
Definición: Responsabilidad social corporativa (RSC)
En esta tesis doctoral, el término RSC recoge “expectativas económicas, legales,
éticas y discrecionales que la sociedad tiene sobre las organizaciones” (Carroll, 1979:
500). En esencia, implica conducir las empresas de una manera que sea
económicamente rentable, que cumpla con la legislación vigente y que brinde apoyo
social y ético.

iii
Definición: Innovación ambiental
La innovación ambiental es similar a la innovación en general (van Leeuwen &
Mohnen, 2013). Sin embargo, a diferencia de innovaciones convencionales, factores del
empuje de la tecnología (technology-push) y la demanda del mercado (market-pull) por
sí mismos no proveen suficientes incentivos para que las firmas se involucren en
innovación ambiental (Rennings, 2000). La innovación ambiental produce los mismos
efectos secundarios (spillovers) de la innovación tradicional, pero además genera menos
costos ambientales. Mientras que la sociedad como un todo se beneficia de la
innovación ambiental, es la firma quien carga con los costos de ésta. A pesar del hecho
de que una cierta innovación verde puede ser comercializada exitosamente, la habilidad
de las firmas de apropiarse de los beneficios de tal innovación puede ser difícil si los
beneficios ambientales tienen un carácter de bien público o el conocimiento
correspondiente es fácilmente asequible. Adicionalmente, mientras los mercados no
castiguen impactos ambientales perjudiciales, se distorsiona la competencia entre
innovadores ambientales e innovadores no ambientales. Las fuerzas del mercado por sí
mismas no proveen suficientes incentivos de innovación y la disposición de los
consumidores a pagar por características ambientales sería muy baja. Esto es lo que
Rennings (2000) llama ‘problema de doble externalidad’. Consecuentemente, este
problema lleva a una importancia creciente del marco regulatorio, puesto que tales
externalidades resultan en inversión sub-óptima en innovaciones ambientales. En este
contexto, la política ambiental se convierte en una fuerza importante para dar empuje a
las innovaciones verdes. Véase la Figura 1.

iv
FIGURA 1 Un modelo de determinantes de la innovación ambiental
Fuente: Rennings, 2000.
Los términos eco-innovación, innovación ambiental e innovación verde han sido
y aún son utilizados como sinónimos (Tietze et al., 2011). En esta tesis doctoral
adoptamos la siguiente definición:
“Las innovaciones ambientales consisten en procesos, técnicas, prácticas, sistemas y productos, nuevos o modificados, para eludir o reducir el daño ambiental. Las innovaciones ambientales pueden desarrollarse con o sin el objetivo explícito de reducir el daño ambiental. También pueden ser motivadas por las metas usuales de la empresa, tales como reducción de costos o mejorar la calidad del producto. Muchas innovaciones ambientales combinan un beneficio ambiental con un beneficio para el establecimiento o usuario” (Hemmelskamp, 1997; Rennings, 2000; Rennings et al., 2004: 376).
Conclusión:
A través de los tres artículos sobre RSC e innovación ambiental, esperamos
proveer nuevas percepciones sobre cómo las firmas pueden tratar con RSC y la
innovación ambiental en esta economía moderna donde hay una demanda elevada para
firmas que se comportan de una manera no sólo responsable socialmente, sino también
amigable con el medio ambiente, acercándose a la sostenibilidad.

v
INTRODUCTION
As the world is increasingly exerting pressures on organizations to fulfill
broader social goals (Matten & Crane, 2005), firms respond by including CSR as a way
to ease tension between firms’ humanitarian needs towards broader stakeholder groups
and economic commitments towards owners/shareholders (Margolis & Walsh 2003;
Carroll, 1991). Not only that CSR provides benefits to the firm (Porter & Kramer, 2006;
Graafland et al., 2003), but also it is now clear that “a corporation can do well by doing
good” (Kotler & Lee, 2005).
Nowadays, about seventy percent of publicly traded firms in the largest thirty-
four countries adopt CSR (KPMG, 2011). However, a number of firms in fact engage in
‘greenwashing’ type of CSR. Nonetheless, there also exist firms that are more ‘truthful’
about their CSR engagement. We borrow from institutional theory, where CSR is
considered as a part of a new legitimacy (Matten & Moon, 2008; Wood, 1991), to help
us understand more. Our first study specifically studies the influence of institutional
pressures on individual manager’s attitude about CSR and on the different types of CSR
activities firms undertake.
Empirical research on CSR thus far has focused almost exclusively on firms’
responses towards external pressures and rarely considers internal pressures (Mayo et
al., 2013). The hybrid framework we offer in the first study helps to contribute to the
literature in the sense that neither external nor internal factors alone in its own right
have the capacity to provide a full explanation of organizational behaviors.
The literature has identified, for instance, pollution prevention strategies and
environmental innovation as CSR with substance (Klassen & Whybark, 1999; Russo &
Fouts, 1997; Hart, 1995). This leads to the second and the third paper of this
dissertation.
Businesses are being pressured to play a role in achieving greening goals
alongside their economic goals (Elkington, 1994; Johnstone et al., 2008). Since one of
the mechanisms for firms to deal with the changing environment is through innovations
(Schoonhoven et al., 1990), environmental innovation presents itself as an appropriate
option to deal with this mounting pressure and changing environment (De Marchi,
2012; Johnstone et al., 2008). In the second paper, we study the relationship between
knowledge sourcing and firm’s environmental innovation. In the last paper, we examine
the impact of environmental innovation on employment.

vi
As of this moment, the study on environmental innovation is still scarce (Chang,
2011; Horbach, 2008; Toshi et al., 2007). With the second study, we help shed light on
firms’ environmental innovation search strategy, specifically on where firms seek
knowledge from and the importance of each knowledge source for firms of different
sizes. As we analyze several knowledge sources together, we could access the degree of
openness of firms’ search strategies as well. We call it ‘breadth’ in this paper.
One of the topics commonly addressed during political debates concerns the
question of how firms’ transformations towards being green affect economic
performance and employment (Rennings et al., 2004). Yet, the consequence of
environmental innovation on employment is not particularly well-known and the views
and impacts spur ongoing debate. With the third paper, we try to fill the gap by
providing more empirical evidence at the firm-level. We analyze the impacts both in
aggregate manner as well as of the different types of environmental innovation that
exists. We decompose environmental innovation into voluntary and compliance-driven.
Our study also has major policy implications, particularly on the design of micro-
policies that will help to improve growth in employment.
Definition: Corporate social responsibility (CSR)
In this dissertation, the term CSR encompasses “economic, legal, ethical, and
discretionary expectations that society has of organizations” (Carroll, 1979: 500). In
essence, it involves conducting business in a way that is economically profitable, law
abiding, ethical and socially supportive.
Definition: Environmental innovation
Environmental innovation is similar to innovation in general (van Leeuwen &
Mohnen, 2013). Yet, unlike conventional innovations, technology-push and market-pull
factors alone do not provide enough incentives for firms to be engaged in environmental
innovation (Rennings, 2000). Environmental innovation produces the usual spillovers of
innovations in general as well as creates less environmental costs. While the society as a
whole benefits from environmental innovation, the cost is borne by a firm. Despite the
fact that a certain green innovation can be marketed successfully, firms’ ability to
appropriate profits from such innovation can be difficult if the environmental benefits

vii
have a public good character or the corresponding knowledge is easily accessible.
Additionally, as long as the markets do not punish environmental harmful impacts,
competition between environmental innovators versus non-environmental innovations is
distorted. Market forces alone do not provide sufficient innovation incentives and that
consumers’ willingness to pay for environmental features would be too low. This is
what Rennings (2000) calls ‘double externality problem’. Consequently, this double
externality problem leads to an increasing importance of regulatory framework since
such externalities result in suboptimal investment in environmental innovations.
Environmental policy becomes another important driving force for green innovations.
See Figure 1.
FIGURE 1 A model of the determinants of environmental innovation
Source: Rennings, 2000
The terms eco-innovation, environmental innovation and green innovation have
been and are still used synonymously (Tietze et al., 2011). In this dissertation, we adopt
the definition below.
“Environmental innovations consist of new or modified processes, techniques, practices, systems and products to avoid or reduce environmental damage. Environmental innovations may be developed with or without the explicit aim of reducing environmental damage. They also may be motivated by the usual business goals such as reducing costs or enhancing product quality. Many environmental

viii
innovations combine an environmental benefit with a benefit for the establishment or user” (Hemmelskamp, 1997; Rennings, 2000; Rennings et al., 2004: 376).
Conclusion
Through the three papers on CSR and environmental innovation, we hope to
provide new insights into how firms can deal with CSR and environmental innovation
in this modern economy where there is a heightened demand for firms to behave not
only in a socially responsible manner, but also in environmentally-friendly manner,
approaching sustainability.

ix
References
Carroll, A.B.: 1979, ‘A Three-Dimensional Conceptual Model of Corporate Performance’, Academy of Management Review 4(4), 497-505.
Carroll, A.B. 1991. The pyramid of corporate social responsibility: Toward the moral management of organizational stakeholders. Business Horizons, 34(4):39-48.
Chang, C.H. 2011. The influence of corporate environmental ethics on competitive advantage: The mediation role of green innovation. Journal of Business Ethics, 104: 361-370.
De Marchi, V. 2012. Environmental innovation and R&D cooperation: Empirical evidence from Spanish manufacturing firms. Research Policy, 41(3): 614-623.
Elkington, J. 1994. Towards the sustainable corporation: Win-win-win business strategies for sustainable development. California Management Review, 36(2): 90-100.
Graafland, J., van de Ven, B., & Stoffele, N. 2003. Strategies and instruments for organizing CSR by small and large businesses in the Netherlands. Journal of Business Ethics, 47(1): 45-60.
Hart, S.L. 1995. A natural-resource-based view of the firm. Academy of Management Review, 20(4): 986-1014.
Hemmelskamp, J. 1997. Environmental policy instruments and their effects on innovation. European Planning Studies, 5(2): 177-194.
Horbach, J. 2008. Determinants of environmental innovation – New evidence from German panel data sources. Research Policy, 37: 163-173.
Johnstone, N., Hascic, I, & Ostertag, K. 2008. OECD studies on environmental innovation: Environmental policy, technological innovation and patents. Paris: OECD Publishing.
Klassen, R.D., & Whybark, D.C. 1999. The impact of environmental technologies on manufacturing performance. Academy of Management Journal, 42(6): 599-615.
Kotler, P.E., & Lee, N. 2005. Corporate social responsibility: Doing the most good for your company and your cause. NJ: John Wiley and Sons.
KPMG. 2011. KPMG International Survey of Corporate Responsibility Reporting 2011. KPMG, USA.
Margolis, J.D., & Walsh, J.P. 2003. Misery loves companies: Rethinking social initiatives by business. Administrative Science Quarterly, 48(2): 268-305.
Matten, D., & Crane, A. 2005. Corporate citizenship: Toward an extended theoretical conceptualization. Academy of Management Review, 30(1): 166-179.
Matten, D., & Moon, J. 2008. “Implicit” and “explicit” CSR: A conceptual framework for a comparative understanding of corporate social responsibility. Academy of Management Review, 33(2): 404-424.
Mayo, M., Gomez-Mejia, L., Berrone, P., Firfiray, S., & Villena, V. 2013. The reconciliation of instrumental and normative views of social practices: Determinants of telecommuting provision. Working Paper.
Porter, M.E., & Kramer, M.R. 2006. Strategy and society: The link between competitive advantage and corporate social responsibility. Harvard Business Review, 84(12): 78–92.
Rennings, K. 2000. Redefining innovation – eco-innovation research and the contribution from ecological economics. Ecological Economics, 32(2): 319-332.

x
Rennings, K., Ziegler, A., & Zwick, T. 2004. The effect of environmental innovations on employment changes: An econometric analysis. Business Strategy and the Environment, 13(6): 374-387.
Russo, M.V., & Fouts, P.A. 1997. A resource-based perspective on corporate environmental performance and profitability. Academy of Management Journal, 40(3): 534-559.
Schoonhoven, C., Eisenhardt, K., & Lyman, K. 1990. Speeding products to market: Waiting time to first product introduction in new firms. Administrative Science Quarterly, 35: 177-207.
Tietze, F., Schiederig, T., & Herstatt, C. 2011. What is green innovation? A quantitative literature review. Paper presented at the XXII ISPIM Conference, Hamburg.
Toshi, H.A., Hibiki, A., & Johnstone, N. 2007. An empirical study of environmental R&D: What encourages facilities to be environmentally innovative? In N. Johnstone (Ed.), Environmental policy and corporate behavior: 142-173. Cornwall: MPG Books.
van Leeuwen, G., & Mohnen, P.A. 2013. Revisiting the Porter hypothesis: An empirical analysis of green innovation for the Netherlands. Working paper number 2013-002, UNU-Merit, Maastricht.
Wood, D.J. 1991. Corporate social performance revisited. Academy of Management Review, 16(4): 691-718.

1
CHAPTER 1 Institutional pressures and CSR attitude as
determinants of CSR choices ---------------------------------------------------------------------------------------------------------- This paper reports research on the influence of institutional pressures and individual manager’s attitude about corporate social responsibility (CSR) on the different types of CSR activities firms undertake. The data was taken from questionnaires sent to publicly-listed firms in Thailand and US, UK and Japanese subsidiaries of publicly-listed firms abroad that are currently located in Thailand. This paper argues that CSR programs can fall along a continuum between two endpoints: symbolic CSR and substantive CSR. The results indicate that mid-level managers experienced (1) negative attitude about CSR when pressured by external actors, inducing firms to adopt symbolic CSR; and (2) positive attitude about CSR when pressured by internal actors, influencing firms to adopt substantive CSR. ----------------------------------------------------------------------------------------------------------

2
1.1 Introduction
Corporate social responsibility (CSR) of business encompasses “economic,
legal, ethical, and discretionary expectations that society has of organizations” (Carroll,
1979: 500). It involves conducting business in a way that is economically profitable,
law abiding, ethical and socially supportive. In today’s world, of the hundred largest
companies in each of the 34 countries, about seventy percent of publicly traded
companies adopt CSR. European companies continue to lead the pack, with 71%, while
Asia Pacific continues to trail behind, with 49% (KPMG, 2011). However, a number of
firms are in fact engaging in ‘greenwashing’ type of CSR. Nonetheless, there also exist
firms that are more ‘truthful’ about their CSR engagement. Thus, it is proposed in this
study that CSR program configuration lies on a continuum with a CSR position at the
two opposing end points – symbolic CSR and substantive CSR. Our interest lies in the
determinants leading firms towards a symbolic CSR versus substantive CSR. Assuming
substantive CSR can be riskier and more expensive since it entails higher costs and
involvement, and greater potential exposure to coming up short in terms of meeting
expectations from institutions, firms might then be naturally drawn to the symbolic
choice – assuming a lower downside risk. Accordingly, our objective is to empirically
examine the interrelationships of the determinants – institutional pressures and
managers’ individual attitudes towards CSR – that would help explain the variations in
firms’ CSR adoption. We hypothesize that firms’ different approach towards CSR are
affected by different institutions which influence mid-level manager’s attitude towards
CSR.
The research extends not only CSR literature but also institutional theory. The
research extends the literature on CSR by exhibiting interactions between institutional
pressures and individual managers’ CSR attitude that influence the nature of CSR firms
adopt. Empirical research on CSR has focused almost exclusively on a firm’s responses
to external pressures and rarely considers internal pressures (Mayo et al., 2013). In
contrast, we study both the external and internal factors. The hybrid framework we
propose is motivated by the complementary nature of both external and internal factors
and it is relevant since neither external nor internal factors alone in its own right have
the capacity to provide a full explanation of organizational behaviors. In this way, we
could offer a more holistic view that helps to provide a solid platform for understanding
the determinants of firms’ approach towards CSR adoption. The research further

3
extends the field by examining the impact of cross-national context on firms’ CSR
practices where research is still scarce and there are many important implications (i.e.,
Matten & Moon, 2008; Maignan & Ralston, 2002). We also contribute empirically to
this field by conducting research in the region where research and data are almost non-
existent. Some research on country-level CSR in Thailand has been conducted, but there
are still not many company-level analyses on CSR practices of Thai firms. The research
also adds to institutional theory by encompassing both supra-individual bodies and
interactions among individuals together, where the latter is often neglected in studies
based on neo-institutionalism (Selznick, 1996). In this manner, we are able to
incorporate the multi-level nature of institutions in our model as institutions operate at
many levels from world system to interpersonal interactions (Scott, 2007). Additionally,
instead of studying the influence of institutions on CSR at aggregated level, treating all
constituencies as essentially a homogeneous block like most previous research studies,
we divide institutions into different groups so we could have a clearer picture of the
effects of different institutions on CSR.
In Thailand, about 35% of firms just learnt about CSR, 50% have launched some
activities and 15% showed impressive progress (Yodprudtikan, 2009). CSR dimensions
commonly addressed are labor, human rights, environment and governance issues
(Prayukvong & Olsen, 2009). There exist both green-washing trend (Prayukvong &
Olsen, 2009) and a more substantive version of CSR (CSR Asia Center at AIT, 2010).
However, all in all, most firms see CSR as beneficial especially in terms of building
good will and community trust. Firms often engage in CSR activities that consist of
philanthropy and employee volunteering. A report by the Association of Thai
Registered Companies in 2008 showed that 80% of publicly-listed firms’ CSR activities
were donations to charities. This unique CSR characteristic is influenced by the
social/religious context in Thailand where performing good deeds is the basis of
Buddhist merit-making culture. Another factor contributing to this is Thai people’s
enormous amount of respect and devotion towards its monarch, who has set up
numerous royal foundations to assist the poor (Prayukvong & Olsen, 2009), triggering
firms to donate to these foundations to show supports to His Majesty the King’s
initiatives. Multinational companies in Thailand are also aligning their global CSR
activities with local CSR concepts (Prayukvong & Olsen, 2009). However, despite
significant efforts to build CSR awareness through several approaches, Thai firms still
have a limited knowledge on CSR essence and practices (Prayukvong & Olsen, 2009).

4
The research is based on a survey of 174 firms that are Thai publicly-listed firms
and foreign subsidiaries of firms listed in New York, London and Tokyo stock
exchanges. Our study is limited to only publicly-held firms as they are subjected to
greater public scrutiny, prompting greater social responsiveness (McWilliams & Siegel,
2001; Waddock & Graves, 1997; Carroll 1991; Pfeffer & Salancik, 1978). The results
indicate that neither external nor internal institutional pressures alone have significant
relationships with symbolic or substantive CSR. Instead these forces display an effect
through CSR attitude of individual managers, which successively, induce them to make
differing decisions pertaining to types of CSR to be involved in. CSR attitude mediates
the relationship between (1) external institutional pressure and symbolic CSR, and (2)
internal institutional pressure and substantive CSR. The results also show that ethical
education and ethical training are factors that influence a more socially responsible
behavior.
The paper proceeds as follows. We briefly discuss the literature on CSR and
how managers affect the nature and outcomes of CSR. Then, we continue on to
proposals of hypotheses, the results and future research.
1.2 Theoretical background and hypotheses
1.2.1 CSR continuum: Symbolic CSR versus substantive CSR
A failure to distinguish among different types of CSR can result in much of the
confusion because varying structures of CSR programs can be found today (Pirsch et
al., 2007) due to varying CSR tactics used by companies and a multi-dimensional nature
of CSR construct that encompasses diverse aspects (Waddock & Graves, 1997; Carroll,
1979). Institutional theory identifies two general types of organizational responses to
institutional pressures – symbolic and substantive (Oliver, 1991; Ashforth & Gibbs,
1990, Meyer & Rowan, 1977). We thus propose that CSR programs can fall along a
continuum between the two endpoints of symbolic CSR and substantive CSR.
Sansiri, a publicly-traded real estate developer who positions itself as a premium
developer, adopts what this paper terms a symbolic CSR. Symbolic activities are
“actions in which the actor displays or tries to draw other actors’ attention to the
meaning of an object or action that goes beyond the object’s or action’s intrinsic content
or functional use” (Zott & Huy, 2007: 70). Sansiri pretends to appear socially

5
responsible by forging with UNICEF to raise awareness for children’s rights (Sansiri,
2013) while it behaves irresponsibly, ignores the safety of its consumers and violates
law by substituting concrete with foam in its building (Bangkok Post, 2013). If Sansiri’s
client had not torn down his wall to fix the continuous water leak, Sansiri would have
achieved in taking up good causes of helping children to project a ‘good image’ because
the firm has recently received ‘Best CSR Practice across Southeast Asia’ award in 2011
(Sansiri, 2013). In sum, symbolic CSR represents ceremonial conformity (Weaver et al.,
1999), involves weaker commitments such as short-term cause sponsorship programs,
and is a decoupled implementation from core practices (Berrone et al., 2009). The final
goal is to influence societal perceptions by using more visual actions rather than
substance in order to obtain benefits (Berrone et al., 2009) such as legitimacy, greater
appeal, and increase in sales from better reputation. Symbolic CSR is in essence
impression management. Firms engaged in CSR of this nature are more concerned with
corporate benefits rather than to genuine concerns for societies (Pirsch et al., 2007).
At the other end of the spectrum, Siam Cement Group (SCG) provides an
excellent example of firms that is engaged in what this paper calls substantive CSR.
SCG develops sustainable policies with substance, that is, with goals, measurement and
implementation guidelines for each of its business units. SCG also places importance in
producing innovative products that are both environmentally friendly and meet the
demands of the consumers. Environmental labeling, such as Green Label, Carbon Label,
Carbon Footprint Label, is one of the tools that SCG uses (SCG, 2013). The literature
has identified, for instance, pollution prevention strategies and environmental
innovation as CSR with substance (Klassen & Whybark, 1999; Russo & Fouts, 1997;
Hart, 1995). Further, substantive CSR also involves the use of renewable energy, green
technologies, and long-term CSR projects with specified goals and measurements.
Unlike symbolic CSR, substantive CSR are real actions that often requires changes in
core practices and organizational culture, long-term commitment and investments
(Eccles et al., 2013) and entails certain risks (Berrone et al., 2009). In this way, CSR
options for companies operate on a continuum, with symbolic CSR companies at one
end of the spectrum and substantive CSR programs at the other end.

6
1.2.2 Institutional salience and CSR
A central tenet of institutional theory, despite old, new, institutional
entrepreneurship, institutional work, is the idea that there are institutions that have a
profound effect on the thoughts, feelings and behavior of collective actors as well as
individuals (Lawrence & Suddaby, 2006). Collective actors such as firms conform to
rationalized myths in their institutional environment in order to obtain legitimacy,
resources and survival capabilities (Selznick, 1996; Meyer & Rowan, 1977).
Particularly firms are predicted to conform even more when these ‘myths’ are so
externally accepted and validated (DiMaggio, 1988) or when these ‘myths’ render the
only ‘obvious’ approach to conduct organizational activities (Zucker, 1987). Thus,
institutional pressures lead firms to adopt similar structures, strategies and processes –
or what instituttional literature calls “organizational isomorphism” (DiMaggio &
Powell, 1983) – that reflect institutionalized elements without any questions (Meyer &
Rowan, 1977). As institutions are exerting pressures on firms to execute CSR, firms are
increasingly adhering to socially responsible behavior as a way to satisfy institutional
demands (Matten & Moon, 2008; Weaver et al., 1999).
Institutions operate at multiple levels, from world system to interpersonal
interaction (Scott, 2007). We therefore split institutional pressures on firms to embrace
CSR into external and internal institutional actors. In this manner, we could capture
normative pressures – from both external sources such as the state and from within the
firm – that influence firms’ behaviors (Selznick, 1996; Zucker, 1987) as well as
encompass both world system aspects of the theory and interactions among individuals
into our model. Our external institutions are supra-individual bodies operating outside
firms at the macro-level within which firms maneuver (DiMaggio & Powell, 1983) such
as government. Our internal institutions are interactions among individuals inside firms
such as employees, management (Campbell, 2007). There are other factors triggering
firms to respond differently to CSR as well, for instance, the features of the social
problems. However, it is beyond the scope of this paper to discuss triggers other than
varying pressures from different institutional actors.
Even though institutional pressures do direct firms’ behavior towards
homogeneity, there are still complexities and variety of organizational responses in
order to shape the ‘best’ organizational practices (Powell & Colyvas, 2007).
Institutional forces merely define ‘the range of organizational reality’ and limit ‘the

7
repertoire of possible actions’ (Hoffman, 1997), allowing for differences in strategies
among individual companies (Sharma, 2000). As a result, specific CSR initiatives are
more or less appropriate for certain firms (McWilliams et al., 2006). Previous research
confirm this argument, showing how firm responses towards CSR vary greatly (Oliver,
1991), particularly across countries with differing institutional environment (Maignan &
Ralston, 2002).
From institutional theory stance, symbolic actions are effective responses to
external pressures (Meyer & Rowan, 1977). Symbolic CSR is likely to be a preferred
choice as “the appearance [of conformity] is often presumed to be sufficient for the
attainment of legitimacy” (Oliver, 1991: 155) and making firms easy to insulate
themselves from external expectations (Weaver et al., 1999). For instance, Weaver et al.
(1999) found that governmental pressure begets firms to implement symbolic CSR. On
the contrary, some firms find substantive CSR the right vehicle to implement as there is
no penalty or destructive impact from allocating resources to CSR (Waddock & Graves,
1997). In fact, such investments are actually advantageous (Hillman & Keim, 2001;
McWilliams & Siegel, 2001; Russo & Fouts, 1997; Waddock & Graves, 1997). Weaver
et al. (1999) reported that managers are an essential part to what drives organizations to
be involved in a more substantive version of CSR. In sum, in responding to these
external and internal pressures, firms have the option to engage in either symbolic or
substantive CSR.
From the above arguments, if we are to accept that firms adopt two main CSR
choices – symbolic and substantive – then we should also expect that such choices cater
to specific, yet different, institutions. Accordingly, we posit the following hypotheses:
H1a: External institutional pressures are positively related to symbolic CSR. H1b: Internal institutional pressures are positively related to substantive CSR.
1.2.3 Managers, attitudes and CSR
Concerning CSR, managers matter because “there cannot be socially responsible
firms without socially responsible managers” (Godos-Díez et al., 2011: 531). Top
managers are charged with strategy making and then organizing middle management for
precise planning and components implementation of such strategy (Dutton et al., 1997).
It is often middle managers, rather than top managers, who have their hands on the

8
actual ‘pulse of the organization’ (Dutton et al., 1997), closer to day-to-day operations
and closer to employees, customers and all other stakeholders involved (Huy, 2001).
For instance, it is more common to see CEOs setting up directions for firms to be
socially responsible and to see CSR managers at a tree-planting CSR event. In this
regard, middle managers are crucial towards the implementation of CSR.
Drawing from Upper Echelon (UE) theory, managers lead and managers rely on
their cognitive bases when making decisions (Hambrick & Mason, 1984). This
cognitive base, which is a part of what forms an attitude of a person (Zanna & Rempel,
1988), is what influences managers’ interpretations of the issues, facilitating them to
make certain choices (Hambrick & Mason, 1984). Likewise, as suggested by Dutton
and Jackson (1987) and Tversky and Hemenway (1983), individuals employ schema –
organizing objects into meaningful groups – in order to categorize information. For a
straightforward issue of physical objects like how much output the new machine is
going to produce, individuals can easily observe and allocate the issue to pre-
determined categories. But for societal phenomena like CSR that presents individuals
with ambiguity, individuals draw on their cognition to help identify categorizations
(Dutton & Jackson, 1987; Tversky & Hemenway, 1983). As a result, attitude
particularly matters for ambiguous issue like CSR.
Besides from institutions having influence on firms’ CSR behaviors (Margolis &
Walsh, 2003; Maignan & Ralston 2002), pressures from these institutions do affect
attitudes of managers as well (Lawrence & Suddaby, 2006). Assessment of external
environment has an objective base, i.e., through industry analysis, but also is influenced
by subjective perceptions of individuals inside the firm (Schneider & Meyer, 1991; Daft
& Weick, 1984). Responding to external demand to instigate CSR could create a
perception of a ‘forced compliance (Festinger, 1957)’. If displaying such behavior is
brought about by, say, threats of punishment from decreased firm legitimacy by
institutional environment, the magnitude of dissonance is increased, and in such state,
individuals may feel frustration, anger, etc (Festinger, 1957). It can then be expected
that negative attitude is created. On the contrary, in the case of internal pressures, the
processes in the firms are set in a way to promote CSR. For instance, top management
includes socially responsible behavior as part of firm’s core value or integrates CSR
goals and strategies into core business strategy. A structure and culture would be
developed that hold workers committed to CSR and seeing it as having value.
Particularly, managers responsible for CSR then know they would receive support from

9
above and below. It is then likely that this would lead to a more positive CSR attitude in
managers.
Since attitude triggers different decision processes and behaviors (Nutt, 1979;
Dutton & Jackson, 1987), CSR attitude may mediate the basic relationship between
institutional pressures and the approach towards CSR that firms adopt. We conjecture
that institutional forces affect CSR attitude of managers, which successively, influences
certain approach towards CSR managers consider and engage in. We propose the
following hypotheses:
H2a: External institutional pressures are negatively related to managers’ CSR attitude. H2b: Internal institutional pressures are positively related to managers’ CSR attitude.
H3a: Managers’ attitude towards CSR is a mediating variable affecting the relationship between external institutional pressures and symbolic CSR. H3b: Managers’ attitude towards CSR is a mediating variable affecting the relationship between internal institutional pressures and substantive CSR.
1.3 Methodology
1.3.1 Data and procedures
The sample was taken from a list of publicly traded firms in Thailand and
foreign subsidiaries (located in Thailand) of publicly traded firms in the US, UK and
Japan. The cover letter and questionnaire were distributed to middle managers and/or
employees who are responsible for or have the most knowledge of CSR of their firms.
The respondents could choose if they wanted Thai or English questionnaire. This is to
ensure that concepts are appropriate and valid in cultures under investigation and to
reduce misunderstandings in responses because some respondents may be more
comfortable in one language over another. Details of the survey administration are
contained in Appendix A.
Of 1,100 questionnaires distributed to the total population, 174 completed
questionnaires were returned for a response rate of 15.81%: 42.6% Thai firms (74 firms)

10
and 57.4% foreign subsidiaries (34 US, 17 UK and 49 Japanese subsidiaries). These
firms operate in several sectors as reported in Table 1.
TABLE 1 Industry and firm’s country of origin
Countries
Industry
Agr
o &
Foo
d in
dust
ry
Con
sum
er p
rodu
cts
Fina
ncia
ls
Indu
stria
ls
Prop
erty
& c
onst
ruct
ion
Res
ourc
es
Serv
ices
Tech
nolo
gy
Elec
tric
appl
ianc
es
Total
US 1 5 . 11 . 1 9 6 1 34 UK 1 2 3 2 . 1 7 1 . 17
Japan 1 4 . 17 3 . 12 5 7 49 Thai 7 3 8 11 15 4 17 9 . 74 Total 10 14 11 41 18 6 45 21 8 174
From our sample, 88% of these firms are currently engaging in CSR programs.
For firms that are doing CSR, 94% reported that they are highly likely to continue with
their CSR projects, 79% are satisfied with their CSR results, and 85% have financial
resources allocated for CSR projects. These firms mostly spend 0-1% of net income on
CSR projects. For firms that are not currently engaged in CSR, 88% reported they are
planning for CSR, mostly within 1-3 years. Firm’s two most important stakeholders are
community/state welfare (58%) and employees (17.5%). More information is reported
in Table 2.
TABLE 2 Firm’s important stakeholders
Community/state welfare 58.48% Employees 17.54% Shareholders/investors 12.87% Customers 10.53% Suppliers 0.58%
It is interesting to note that most firms (77%) offer ethical training to employees,
with the average of one ethical training per year. Of all firms in our sample, 65% of all

11
Japanese subsidiaries provide ethical training for their employees while it is 76% for US
subsidiaries, 94% for UK subsidiaries, and 81% for Thai firms.
1.3.2 Respondents
Our respondents perform a wide range of business functions. They are, for
example, CSR managers, human resources mangers, marketing managers, and brand
managers. The majority of respondents are of Thai nationality (97%). The rest is one
British, one Chinese, one Japanese, and one US citizen. Most respondents (92.49%)
reported having previously received ethical education, with the average of 3-6 years of
ethical education.
1.3.3 Measures
Measures: Institutional pressures
The respondents were asked what the most important motivation for the firm to
engage in CSR was. The results report pressures from top management as the strongest
force (33.53%), followed by society (25.15%) and other organizations (14.97%). The
lowest level of pressure came from shareholders with only 1.20%. No option for ‘no
internal’ or ‘no external’ was available. We also did not include all the possible
institutional actors in the questionnaires, only the most relevant and influential ones to
our context. For example, we did not include unions as they are not powerful and do not
really exist in Thailand, nor did we include NGOs. We grouped top management,
employees and shareholders together using dummy of 1 as internal institutional
pressures and 0 otherwise. We then grouped competitors, community at large,
government and other external pressures (i.e., industry trend) using dummy of 1 as
external institutional pressures and 0 otherwise.
Measures: CSR attitude
The attitude towards CSR we study here refers to a belief in socially responsible
behaviors of the firms. It is managers’ ‘personal view’ of CSR of their firms. We
adopted the scale developed by Hunt et al. (1990) to measure the extent to which
12
individuals hold beliefs that firms have duties to serve not only firms but also society.
The items were averaged for each respondent with higher composite score representing
a stronger belief in the importance of businesses to engage in CSR activities. We
adapted from a 7-point to a 9-point Likert scale in order to increase scale sensitivity
while maintaining reliability and validity of the original scale (Preston & Colman,
2000). We also removed a reversed-worded item. East Asians experience positive and
negative emotions in a more holistic manner rather than in a bipolar manner (Bagozzi et
al., 1999). A mixed-worded Likert scale (positively-worded versus negatively-worded)
would be problematic and result in lower internal consistency and dimensionality
problem (Wong et al., 2003). We re-ran the analysis using factor analysis (principal-
component method) to compare the results of both the original scale of four items and
the reduced scale of three items. The adjusted scale of three items resulted in an
improvement. The final three items are: (1) socially responsible manager must
occasionally place the interests of society over the interests of the company; (2) as
corporations have great economic power, they have a social responsibility beyond the
interests of their shareholders; and (3) as long as corporations generate acceptable
shareholder returns, managers have a social responsibility beyond the interests of
shareholders.
Measures: CSR continuum
In order to operationalize the two differing concepts along the CSR continuum,
twelve statements were used to inquire respondents about their perceptions on current
and future CSR projects. These items were compiled from existing literature, experts
and practitioners in business fields to ensure content validity. Items were placed
randomly in a single set to (1) reduce the likelihood of a halo response pattern
(Thorndike, 1920) and (2) to find out how managers take an approach towards CSR
programs in terms of deciphering from CSR behaviors. Our items address diverse but
broad CSR issues. Different social issues are of varying concerns to different
institutional environment. The degree and types of social issues businesses should
address also change with time as societal values (Preston & Post, 1975). Therefore, we
designed these statements to be general in order to capture a distinct nature of CSR
construct that is multi-dimensional (Carroll, 1979).

13
We used factor analysis (principal-component method and rotation) to identify
latent variables. Before performing factor analysis, we tested if the items were suitable
using KMO and Bartlett tests. The results indicated that a factor analysis was a good
idea (KMO = 0.89; Bartlett: p-value 0.00). Two factors were clearly identified as
expected, accounting for 64.63% of the common variance.
Previous studies have operationalized symbolic and substantive actions based on
the degree of implementation (Westphal & Zajac, 1994). However, given the difficulties
in separating the degrees of implementation in CSR context, scholars use an alternative
way of measuring symbolic and substantive actions based on widely held beliefs and
definitions of what is symbolic and what is substantive (Hawn & Ioannou, 2013;
Berrone et al., 2009). In this regard, we labeled the first factor substantive CSR. This
factor highlights the point that it is CSR with substance, that is, with specified goals and
measurements, with genuine commitment and deeply-integrated with core business and
day-to-day operations. The component is correlated with statements such as “are well
integrated into all aspects of firms (factor loading 0.76)”, “have met objectives
previously specified before initiating CSR programs (factor loading 0.84)” and
“increase the well-being of beneficiaries of those CSR programs(factor loading 0.74).”
We labeled the second factor symbolic CSR. CSR components of this type are cosmetic,
decoupled, and often aimed for media coverage and public relations to publicize that I
am a good corporate citizen (Porter & Kramer, 2006). Studies have found that symbolic
actions can still yield the desired effect of appearing conformed to institutional demands
(Weaver et al., 1999); thus, entitling corporate with benefits (Berrone et al., 2009) such
as enhanced social acceptance, positive public relations (Hemingway & Maclagan,
2004) or increase in sales from better reputation or higher consumer loyalty (Pirsh et al.,
2007). The factor is correlated with statements such as “increase in direct economic
value (i.e., sales) generated by CSR programs (factor loading 0.86)” and “receive a
satisfactory level of media coverage (factor loading 0.68).”
Control variables
CSR practices are conditioned by characteristics of firms and managers (Godos-
Díez et al., 2011; Hillman & Keim, 2001; Waddock & Graves, 1997) as well as CSR
characteristics (McWilliams & Siegel, 2001); hence, we included these factors as
control variables to add precision to our model.

14
First, we included industry, size, country and ethical training as controls for
firm’s characteristics. Industry was included to ensure that differences in types of CSR
engagement are not merely an effect of industry differences. In this paper, industry
dummies were coded as categorized by the stock exchange of Thailand. Size was
included because there is evidence that larger firms exhibit more overt socially
responsible behaviors than smaller firms (McWilliams & Siegel, 2001; Waddock &
Graves, 1997; Carroll, 1991), and therefore, might affect the nature of CSR involved,
for instance, simple donation for smaller firms for symbolic purpose versus fully-
integrated CSR for purpose with substance for bigger firms. Firm size was measured
using logarithm of total revenues of 2011 taken from the annual reports and Thai
government database. A country’s culture and ideology affect behavior (Hofstede &
Hofstede, 2005); thus, country dummies were also included. We expect country to have
an effect on the differing preferences for CSR types. A dummy of whether ethical
training is offered by firms was also included because firms’ ethical trainings affect
employees’ socially responsible behaviors (Graafland et al., 2003).
Second, we included a dummy of a respondent having previously received
ethical education or no ethical education as control. Ethical education forms a part of
personal characteristics that affect moral reasoning processes, which in turn, influence
socially responsible behaviors (Goolsby & Hunt, 1992). Likewise, formal training in
moral philosophy shapes the processes through which individual ethical decisions are
made (Graafland et al., 2003; Goolsby & Hunt, 1992); consequently, making particular
CSR activities appear more preferred than others.
Third, Lantos (2001) stated that certain characteristics of firms’ CSR influence
CSR practices; therefore, we controlled for whether a firm has financial allocation for
CSR along with a dummy stating whether a manager’s performance evaluation is tied to
CSR or not.
1.4 Results
Aggregation
Table 3 and Table 4 report Cronbach’s α and results of a factor analysis in this
study. Our constructs all have Cronbach’s α above 0.7; therefore, they are considered
reliable (Hair et al., 1998). Our constructs are also unidimensional. The variance

15
inflation factors (VIFs) are in the range of 1.06-6.19 with the mean of 2.36, which are
below the threshold of 10, indicating no evidence of multicollinearity.
TABLE 3 Cronbach’s α coefficients of the constructs
Constructs Number of items Cronbach’s α
CSR attitude 3 0.70 Symbolic CSR 4 0.78 Substantive CSR 8 0.92
TABLE 4 Factor analysis of this study
Constructs Number of
items Number of
factors Accumulation percentage of explained variance (%)
CSR attitude 3 1 62.15 Substantive CSR 8 1 64.60 Symbolic CSR 4 1 61.40
The descriptive statistics and correlation matrix for the main variables are
presented in Table 5. It is interesting to note that internal and external institutional
pressures are not significantly correlated with either symbolic CSR or substantive CSR,
whereas CSR attitude is significantly correlated with internal and external pressures (r =
0.17, p < 0.05; r = -0.17, p < 0.05) and symbolic CSR and substantive CSR (r = 0.16, p
< 0.05; r = 0.14, p < 0.10). Concerning control variables, firm size, ethical training,
ethical education and CSR allocation are positively correlated with substantive CSR (r
= 0.19, p < 0.05; r = 0.27, p < 0.01; r = 0.12, p < 0.01; r = 0.26, p < 0.01) while only
ethical education is positively correlated with symbolic CSR (r = 0.19, p < 0.05). Firm
size is also positively correlated with firm’s financial allocation for CSR (r = 0.23, p <
0.01), consistent with theoretical and empirical work by McWilliams and Siegel (2001),
Waddock and Graves (1997) and Carroll (1991). Interestingly, managers’ incentive tied
to CSR does not correlate with any variables. A plausible explanation can be that most
respondents answered no to this question.

16
TABLE 5 Descriptive statistics and correlation matrix
Variable 1 2 3 4 5 6 7 8 9 10
1. Symbolic CSR 1 2. Substantive CSR 0.63* 1 3. Internal pressure -0.06 -0.03 1 4. External pressure 0.06 0.03 -1* 1
5. CSR attitude 0.16* 0.14 0.17* -0.17* 1
6. Firm size 0.09 0.19* 0.09 -0.09 0.01 1 7. Ethical training 0.09 0.27* -0.04 0.04 0.05 0.1 1
8. Ethical education 0.19* 0.22* 0.06 -0.06 -0.09 0 0.08 1
9. CSR allocation 0.11 0.26* 0.11 -0.11 -0.1 0.23* 0.03 0.02 1 10. Managers’
incentive tied to CSR 0.04 0 0.12 -0.12 0.11 0.04 0.12 0.01 0.06 1
Mean 1.88e-10 -2.34e-9
0.41 0.60 5.62 4.47 0.77 0.92 0.79 0.09
S.D. 1 1 0.49 0.49 1.57 2.50 0.42 0.26 0.41 0.28 Minimum -2.57 -3.68 0 0 1.67 -4.18 0 0 0 0 Maximum 2.27 1.49 1 1 9 11.30 1 1 1 1 p< 0.10, * p < 0.05 n = 174
Test of hypotheses
To test the hypotheses, we performed hierarchical regression (with robust). This
allows us to examine the influence of several predictors in a sequential way. The usual
procedure used when examining the presence of mediation requires three regression
equations: (1) the dependent variable is regressed on independent and control variables
(Model 1), (2) the mediating variable is regressed on independent and control variables
(Model 2), and (3) the dependent variable regressing on independent, mediating, and
control variables (Model 3) (Baron & Kenny, 1986). However, contemporary analysts
(i.e., MacKinnon et al., 2007; Kenny et al., 1998) express that the significance of
independent variable in Model 1 is not required since the relationship is implied if
Model 2 and Model 3 are met. MacKinnon et al. (2007) refer to this as inconsistent
mediation. The results of regression analysis in this study are shown in Table 6 and 7.
Additionally, robustness checks, using other regression method (GLM) and different
proxy for some control variables, did not change the results.

17
TABLE 6 Regression results of external pressures
Symbolic CSR
Model 1a CSR attitude
Model 2a Symbolic CSR
Model 3a External 0.2390 -0.5380* 0.3319* CSR attitude 0.1432** Constant -1.7606** 5.2689** -2.5368** Controls: Firm size 0.0824 0.0326 0.0806 Eth training 0.1229 0.0663 0.1036 Eth education 0.9058** -0.6000 0.9890** CSR financing 0.2076 -0.3708 0.2694 Managers’ incentives
0.2438 0.8219* 0.1375
Industry dummies Yes Yes Yes Country dummies Yes Yes Yes R2 0.14 0.14 0.19 F 1.70* 2.44** 2.45**
TABLE 7 Regression results of internal pressures
Substantive
CSR Model 1b
CSR attitude Model 2b
Substantive CSR
Model 3b Internal -0.1409 0.5380* -0.2121 CSR attitude 0.1240* Constant -2.1086** 4.7309** -2.6767** Controls: Firm size 0.0611 0.0326 0.0556 Eth training 0.6158** 0.0663 0.6019** Eth education 0.7949* -0.6000 0.8699** CSR financing 0.5549* -0.3708 0.6032* Managers’ incentives
-0.1643 0.8219* -0.2708
Industry dummies Yes Yes Yes Country dummies Yes Yes Yes R2 0.22 0.14 0.25 F 2.45** 2.44** 2.87**
Hypotheses 1a and 1b predict that external pressures are positively related to
symbolic CSR and internal pressures to substantive CSR. Coefficients of institutional
pressures in Model 1a and 1b are insignificant; therefore, both hypotheses are not
supported.
The second set of hypotheses posits that external pressure is negatively related
to individual managers’ CSR attitude while internal pressure is positively related. For
external pressure as independent variable (Table 6), the coefficient for CSR attitude in

18
Model 2a is significant and the direction is as hypothesized (β = -0.5380, p < 0.05). In
Model 2b, the result shows that internal pressure is positively related to CSR attitude of
individual managers. Support is found for Hypotheses 2a and 2b. Thus, the first
necessary condition for a mediating effect to exist is fulfilled.
Hypothesis 3a states that CSR attitude of managers mediates the relationship
between external institutional pressures and symbolic CSR. The coefficients for external
pressure (β = 0.3319, p < 0.05) and CSR attitude (β = 0.1432, p < 0.01) in Model 3a are
significant. The result indicates a partial mediation and a support for Hypothesis 3a. For
Hypothesis 3b (Table 7), the coefficient for CSR attitude (β = 0.1240, p < 0.05) is
significant and positive but the coefficient of internal pressure is not significant,
indicating a full mediation and a support for Hypothesis 3b.
We do not report total, direct nor indirect effect because Kenny (2013) suggests
this measure should not be computed especially in the case of inconsistent mediation.
Thus, we follow MacKinnon et al. (2002) and conducted Sobel test (Sobel, 1982) to
determine the significance of a mediating effect. The test verifies significant mediation
for both symbolic CSR (z = 1.89, p < 0.10) and substantive CSR (z = 1.7, p < 0.10).
Though p values are not so low, we suspect a larger sample size would fix this as Sobel
test is based on normality assumption, requiring large sample size in order to have
sufficient power to detect significant effect. Ergo we did bootstrap, which is a more
appropriate method for a small sample size (Preacher & Hayes, 2004). 95% bias
corrected bootstrap confidence intervals (based on 1,000 bootstrap samples) concluded
that the indirect effect is significant. Taken together, these results indicate that CSR
attitude mediates the relationship between (1) external institutional pressure and
symbolic CSR, and (2) internal institutional pressure and substantive CSR. We
elaborate further in the discussion section.
1.5 Discussions
Our objective is to explore the impact of different institutional pressures and
CSR attitude on the selection of choices for the types of CSR activities adopted by
firms.
Our results show that institutional contexts lead to both firms’ homogeneity and
heterogeneity, consistent with Sharma (2000). Homogeneity in adopting CSR and
heterogeneity in enacting differing CSR approaches along the CSR continuum proposed

19
in this paper. Our study reveals that firms do not respond in the same fashion to
different sets of institutional pressures – internal versus external. Firms appear to be
selecting between symbolic or substantive CSR. The study supports the fact that
institutional forces indeed merely define the range of possible options for firms to adopt
(Sharma, 2000; Hoffman, 1997). This is because firms are subjected to multiple and
varying institutional influences rather than a common set of pressures (Sharma, 2000).
The two types of actions, be it symbolic or substantive, have different effects. For
instance, symbolic actions deter substantive actions and become a threat to firms’
external legitimacy (Maclean & Behnam, 2010) and financial performance (Walker &
Wan, 2012). On the other hand, CSR program of substantive nature creates consumer
loyalty, intention to buy and positive attitude towards the firm (Pirsch et al., 2007).
However, symbolic CSR is not without merit. A study by Pirsch et al. (2007) shows that
consumers do indeed place value on even the most basic forms of CSR. It is merely that
the positive impact of symbolic action on firms is short-term while substantive action
lasts for both short-term and long-term (Berrone et al., 2009). For this reason,
substantive CSR should be preferred. After all, firms exist because the institutional
environment has set up necessary structures for them; therefore, firms have ‘social
contracts’ that obligate them to treat institutions ethically and fairly in return (Cragg,
2002).
Our study also reveals that middle managers react differently to institutional
pressures. External pressures produce negative attitude towards CSR among middle
managers (Hypothesis 2a) while internal pressures instill positive attitude (Hypothesis
2b). Due to this, when external players demand CSR, managers can become defensive
because they might feel attacked and they then become protective of themselves and
their firms. Further, if there exists a misalignment between firm’s orientation (not
believing in CSR) and external expectation (expecting the firm to adopt CSR), it will
lead to dissonance. Negative attitude is then can be expected. On the contrary, when
internal institutions pressure for CSR, organizational structure and processes including
corporate culture are set in a way to allow and promote CSR. In that case, firms would
automatically prepare, organize, train, and motivate their internal workers to be ready
and to embrace CSR. Thus, more positive CSR attitude in managers is created. The
implication here is that not only that positive attitude helps in influencing satisfaction,
involvement and commitment (Robbins & Judge, 2010), but positive attitude also would
help overcome a barrier created when a new practice is adopted (Blackman et al., 2013).

20
A positive attitude is better than a negative attitude. Internal institutional pressure is
indeed vital towards the creation of positive attitude among managers who are
designated to implement CSR.
Further, though many multinational companies (MNCs) employ ‘global CSR’
initiated by head office, our results report insignificant country dummies, implying that
institutional pressure from host country determines managers’ CSR attitude. Our results
are consistent with a study by Maignan & Ralston (2002), which illustrates that
institutional environment of host country has stronger effect in shaping CSR attitude of
workers than institutional environment of home country. Some aspects of CSR can be
globalized, but it is still recommended that many dimensions of firms’ CSR be localized
to cater to local institutional environment and social issues at hand.
An interesting finding is how CSR attitude partially mediates the relationship
between symbolic CSR and external pressures while CSR attitude fully mediates the
relationship between substantive CSR and internal pressures (Hypotheses 3a and 3b).
Neither external nor internal pressures alone have enough power to influence symbolic
or substantive CSR. It is only through the mediation effect of CSR attitude. An
explanation for this mediation is that conception and implementation are different things
(Huy, 2001). Firms are increasingly dependent on mid-level managers (Dutton et al.,
1997; Bartlett & Ghoshal, 1993) because they can spread words and get people on
board. Senior managers have their own networks, of course, but they are too far
removed from most workers (Huy, 2001). Middle managers indeed do play vital role in
implementation. Managing them involves understanding about their values, preferences
and attitudes toward particular activities (Linstone & Mitroff, 1994). Thus, their
attitude, which influences commitment, satisfaction and involvement (Robbins & Judge,
2010), matters in turning vision into reality. In the case of negative attitude, as it does
not lead to deep commitment or involvement (Robbins & Judge, 2010), the most likely
response is symbolic actions that are easily decoupled, require less investment and/or
are less risky. For example, a decision by CSR manager to do a one-time donation is
less risky, requires less investment, and is enough to appear conformed to external
demands. CSR actions are difficult for institutions to monitor and verify (Perez-Batres
et al., 2012). In most cases, institutions can only assess a company’s CSR based on their
symbolic representations (Berrone et al., 2009). Adopting CSR of symbolic nature is
sufficient for legitimacy attainment (Oliver, 1991). Positive attitude, on the other hand,
is likely to result in substantive actions like developing environmental innovation, green

21
supply chain, CSR with specific goals and measurements, etc. Our study empirically
confirms that for institutionalization to take shape, the process of institutionalization
starts with institutions influencing attitude of individuals which then is transformed into
adoption of practices (Gavetti & Levinthal, 2000), which in this case is CSR. This
indicates that stronger internal pressure is needed to instill a more positive attitude
towards CSR in managers and subsequently the adoption of a more comprehensive and
expansive CSR programs.
Another interesting finding is that ethical education is positive and significant to
both types of CSR as expected. Ethical education introduces virtues and morality in
individuals’ decision-making (Carroll, 2000), which in turn, influences socially
responsible behaviors. Thus, a consideration to implement any types of CSR at least
requires some ethical concerns, impregnated through ethical education. Similarly,
ethical training positively influences substantive CSR but not symbolic CSR. Since
ethical trainings foster ethical behaviors in firms (Graafland et al., 2003), more ethical
trainings provided to employees would fabricate more ethical behaviors, producing
stronger commitment and more genuine interest in CSR. Thus, this would lead to an
engagement in substantive CSR rather than symbolic CSR.
We recognize some limitations of our approach to measuring our constructs. We
used composite subjective indexes based on survey data. The nature of the topic and the
use of self-report surveys could provoke social desirability bias and percept-percept
inflation. Though we employed several methods such as using forced-choice items
(Nederhof, 1985) and supplementing subjective data with secondary data, a better
alternative could be to develop more objective measures of these constructs. We also
note a potential challenge in measuring managers’ personal view of CSR and CSR
approaches when the field still lacks consistent definition (McWilliams et al., 2006). It
is then difficult for respondents to fully understand CSR; therefore, an observational and
longitudinal type of approach on firms’ CSR behavior can be more appropriate.
Furthermore, another limitation we would note is our use of cross-sectional
methodology, which did not allow full examination of the effect of external pressures
on internal pressures. It can be argued that external pressures influence internal actors,
and subsequently, generating certain internal pressures. Careful interpretations of results
are needed as we only captured internal pressures as a given at a point in time when
research was conducted.

22
As such, this study presents us with several possibilities for future research and
theoretical and empirical refinement on CSR and institutional theory. First, this study
examines firms’ adoption of CSR practices of large publicly-traded firms only.
However, small and medium-sized and privately-held companies do play critical roles
in the societies as well. It would be beneficial to replicate the research and compare
privately-held firms with publicly-traded firms so we could gain a richer understanding
of the topic. For example, are there any differences in the relationships found in this
study for privately-held firms or do privately-held firms respond differently to
institutional pressures than publicly-held firms? Second, this study did not take into
account the varying level of intensity of institutional pressure on firms. It will be very
interesting to see at which degree institutional pressure actually triggers firms to be
engaged in CSR. Third, this study is limited to only the two opposite ends of the CSR
continuum. An empirical development of finer scale of CSR continuum would have
important implications on firms. Such study would offer firms insights into the different
CSR strategies firms can adopt. In addition, a finer categorization of different types of
institutional actors and/or other sources of institutional pressures would help
practitioners and researchers alike to understand this complex relationship better. Lastly,
as CSR varies considerably among countries due to variations in national systems
(Chapple & Moon, 2005), a replication in other settings, possibly in very different
national and cultural settings, is worthy of further research.
1.6 Conclusion
For firms and their managers, one of the many dilemmas they face is in choosing
the most appropriate approach towards CSR in order to meet business goals and social
expectations (Pirsch et al., 2007) in their institutional environments. This study seeks to
provide an answer to this question by providing insights about the complexity of several
factors that influence the selection of firms’ CSR approach. The responses provide an
answer to what leads to the two proposed endpoints of the CSR continuum: symbolic
CSR and substantive CSR. The results reveal that the resulting firm’s decision to adopt
either symbolic or substantive CSR is influenced by different sets of institutional
pressures and CSR attitude of individual managers. Middle managers experience
negative attitude towards CSR when pressured by external institutions, inducing firms
to adopt symbolic CSR. On the contrary, pressures from internal institutions instill

23
positive attitude in managers, influencing firms to adopt substantive CSR. The novelty
of our study is that not only are we able to show there exist institutional influences on
CSR practices, but we are also able to shed some light on how different types of
institutional pressures affect managers’ attitude towards CSR and CSR practices. This
study hopes to provide new insights into how firms can deal with CSR in this modern
economy where there is a heightened demand for firms to behave in a socially
responsible manner.
24
1.7 References
Ashforth, B.E. and B.W. Gibbs: 1990, ‘The Double-Edge of Organizational Legitimation’, Organization Science 1(2), 177-194.
Association of Thai Registered Companies: 2008, ‘First Quarter Report: CSR Budget of the Companies Listed in SET 2008’, Accessed: July 25, 2013.
Bagozzi, R.P., W. Nancy and Y. Youjae: 1999, ‘The Role of Culture and Gender in the Relationship between Positive and Negative Affect’, Cognition and Emotion 13(6), 641-672.
Bangkok Post: 2013, ‘Foam Found Stuffed in Condo Wall’, http://www.bangkokpost.com/news/local/367346/sansiri-faces-heat-over-shoddy-wall-construction, Accessed: September 10, 2013.
Baron, R.M. and D.A. Kenny: 1986, ‘The Moderator-Mediator Variable Distinction in Social Psychological Research: Conceptual, Strategic and Statistical Considerations’, Journal of Personality and Social Psychology 51, 1173-1182.
Bartlett, C.A. and S. Ghoshal: 1993, ‘Beyond the M-Form: Toward a Managerial Theory of the Firm’, Strategic Management Journal 14(2), 23-46.
Berrone, P., L. Gelabert and A. Fosfuri: 2009, ‘The Impact and Substantive Actions on Environmental Legitimacy’, Working Paper, IESE Business School, University of Navarra 778.
Blackman et al., 2013, ‘Corporate Social Responsibility and Individual Resistance: Learning as the Missing Link in Implementation’, Management Learning, 44(3): 237-252..
Campbell, J.L.: 2007, ‘Why Would Corporations Behave in Socially Responsible Ways? An Institutional Theory of Corporate Social Responsibility’, Academy of Management Review 32(3), 946-967.
Carroll, A.B.: 1979, ‘A Three-Dimensional Conceptual Model of Corporate Performance’, Academy of Management Review 4(4), 497-505.
Carroll, A.B.: 1991, ‘The Pyramid of Corporate Social Responsibility: Toward the Moral Management of Organizational Stakeholders’, Business Horizons 34(4), 39-48.
Carroll, A.B.: 2000, ‘Ethical Challenges for Business in the New Millennium: Corporate Social Responsibility and Models of Management Morality’, Business Ethics Quarterly 10(1), 33-42.
Chapple, W. and J. Moon: 2005, ‘Corporate Social Responsibility (CSR) in Asia. A Seven-Country Study of CSR Website Reporting’, Business & Society 44(4), 415-441.
Cragg, W.: 2002, ‘Business Ethics and Stakeholder Theory’, Journal of Business Ethics 12(2), 113-142.
CSR Asia Center at AIT: 2010, ‘Corporate Social Responsibility in Thailand’, CSR Asia Center, Asian Institute of Technology (AIT), Bangkok, Thailand.
Daft, R.L. and K.E. Weick: 1984, ‘Toward a Model of Organizations as Interpretation Systems’, Academy of Management Review 9(2), 284-295.

25
DiMaggio, P.J.: 1988, ‘Interest and Agency in Institutional Theory’, in L.G. Zucker (ed.), Institutional Patterns and Organizations: Culture and Environment, (Ballinger, Cambridge, MA), pp, 3-21.
DiMaggio, P.J. and W.W. Powell: 1983, ‘The Iron Cage Revisited: Institutional Isomorphism and Collective Rationality in Organizational Fields’, American Sociological Review 48(2), 147-160.
Dutton, J.E. and S.E. Jackson: 1987, ‘Categorizing Strategic Issues: Links to Organizational Action’, Academy of Management Review 12(1), 76-90.
Dutton, J.E., S.J. Ashford, R.M. O’Neill, E. Hayes, E.E. Wierba: 1997, ‘ Reading the Wind: How Middle Managers Assess the Context for Selling Issues to Top Managers’, Strategic Management Journal 18(5), 407-425.
Eccles, R., I. Ioannou and G. Serafeim: 2013, ‘The Impact of a Corporate Sustainability on Organizational Processes and Performance’, Working Paper, HBS 12-035.
Festinger, L.: 1957, A Theory of Cognitive Dissonance (Standford University Press, Stanford, CA).
Gavetti, G. and D. Levinthal: 2000, ‘Looking Forward and Looking Backward: Cognitive and Experiential Research’, Administrative Science Quarterly 45(1), 113-137.
Godos-Díez, J.L., R. Fernández-Gago and A. Martínez-Campillo: 2011, ‘How Important Are CEOs to CSR Practices? An Analysis of the Mediating Effect of the Perceived Role of Ethics and Social Responsibility’, Journal of Business Ethics 98(4), 531-548.
Goolsby, J.R. and S.D. Hunt: 1992, ‘Cognitive Moral Development and Marketing’, Journal of Marketing 56(1), 55-68.
Graafland, J., B. Van de Ven and N. Stoffele: 2003, ‘Strategies and Instruments for Organizing CSR by Small and Large Businesses in the Netherlands’, Journal of Business Ethics 47(1), 45-60.
Hair, J.F., R.E. Anderson, R.L. Tatham and W.C. Black: 1998, Multivariate Data Analysis (Prentice-Hall, Inc, Upper Saddle River, NJ), pp. 192-193.
Hambrick, D.C. and P.A. Mason: 1984, ‘Upper Echelons: The Organization as a Reflection of Its Top Managers’, Academy of Management Review 9(2), 193-206.
Hart, S.L.: 1995, ‘A Natural-Resource-Based View of the Firm’, Academy of Management Review 20(4), 986-1014.
Hawn, O. and I. Ioannou: 2013, ‘Do Actions Speak Louder than Words? The Case of Corporate Social Responsibility (CSR)’, SSRN Working Paper Series, Available at SSRN: http://ssrn.com/abstract=2101775.
Hemingway, C.A. and P.W. Maclagan: 2004, ‘Managers’ Personal Values as Drivers of Corporate Social Responsibility’, Journal of Business Ethics 50, 33-44.
Hillman, A.J. and G.D. Keim: 2001, ‘Shareholder Value, Stakeholder Management, and Social Issues: What’s the Bottom Line?’, Strategic Management Journal 22(2), 125-139.
Hoffman, A.J.: 1997, From Heresy to Dogma: An Institutional History of Corporate Environmentalism. (New Lexington Press, San Francisco).

26
Hofstede, G. and G.J. Hofstede: 2005, Cultures and Organizations: Software of the Mind (McGraw-Hill, NY).
Hunt, S.D., P.L. Kiecker and L.B. Chonko: 1990, ‘Social Responsibility and Personal Success: A Research Note’, Journal of Academy of Marketing Science 18(3), 239-244.
Jackson, S.E. and J.E. Dutton: 1988, ‘Discerning Threats and Opportunities’, Administrative Science Quarterly 33(3), 370-387.
Huy, Q.N.: 2001, ‘In Praise of Middle Managers’, Harvard Business Review 80(8), 72-79.
Kenny, D.A.: 2013, ‘Mediation’, http://davidakenny.net/cm/mediate.htm, Accessed: April 24, 2013.
Kenny, D.A., D.A. Kashy and N. Bolger: 1998, ‘Data Analysis in Social Psychology’, in D. Gilbert, S. Fiske and G. Lindzey (eds.), The handbook of social psychology,(McGraw-Hill, Boston, MA), pp. 233-265.
Klassen, R.D. and D.C. Whybark: 1999, ‘The Impact of Environmental Technologies on Manufacturing Performance’, Academy of Management Journal 42(6), 599-615.
KPMG: 2011, ‘KPMG International Survey of Corporate Responsibility Reporting 2011,’ KPMG, USA.
Lantos, G.P.: 2001, ‘The Boundaries of Strategic Corporate Social Responsibility’, Journal of Consumer Marketing 18(7), 595-630.
Lawrence, T.B. and R. Suddaby: 2006, ‘Institutions and Institutional Work’, in S. Clegg, C. Hardy, T.B. Lawrence and W.R. Nord (eds.), Handbook of Organization Studies, 2nd edition (Sage, London), pp. 215-254.
Linstone, H.A. and I.I. Mitroff: 1994, The Challenge of the 21st Century. (State University of New York Press, NY)
MacKinnon, D.P., C.M. Lockwood, J.M. Hoffman, S.G. West and V. Sheets: 2002’ ‘A Comparison of Methods to Test the Significance of the Mediated Effect’, Psychological Methods 7(1), 83-104.
MacKinnon, D.P., A.J. Fairchild and M.S. Fritz: 2007’ ‘Mediation Analysis’, Annual Review of Psychology 58, 593-614.
Maclean, T.L. and M. Behnam: 2010, ‘The Dangers of Decoupling: The Relationship between Compliance Programs, Legitimacy Perceptions, and Institutionalized Misconduct’, Academy of Management Journal 53(6), 1499-1520.
Maignan, I. and D.A. Ralston: 2002, ‘Corporate Social Responsibility in Europe and the U.S.: Insights from Businesses’ Self-Presentations’, Journal of International Business Studies 33(3), 497-514.
Margolis, J.D. and J.P. Walsh: 2003, ‘Misery Loves Companies: Rethinking Social Initiatives by Business’, Administrative Science Quarterly 48(2), 268-305.
Mayo, M., L. Gomez-Mejia, P. Berrone, S. Firfiray and V. Villena: 2013, ‘The Reconciliation of Instrumental and Normative Views of Social Practices: Determinants of Telecommuting Provision’, Working Paper.

27
Matten, D. and J. Moon: 2008, “Implicit” and “Explicit” CSR: A Conceptual Framework for a Comparative Understanding of Corporate Social Responsibility’, Academy of Management Review 33(2), 404-424.
McWilliams, A. and D.S. Siegel: 2001, ‘Corporate Social Responsibility: A Theory of Firm Perspective’, Academy of Management Review 26(1), 117-127.
McWilliams, A., D.S. Siegel and P.M. Wright: 2006, ‘Corporate Social Responsibility: Strategic Implications’, Journal of Management Studies 43(1), 1-18.
Meyer, J.W. and B. Rowan: 1977, ‘Institutionalized Organizations: Formal Structure as Myth and Ceremony’, The American Journal of Sociology 83(2), 340-363.
Nederhof, A.J.: 1985, ‘Methods of Coping with Social Desirability Bias: A Review’, European Journal of Social Psychology 15(3), 263-280.
Nutt, P.: 1984, ‘Types of Organizational Decision Processes’, Administrative Science Quarterly 29, 414-450.
Oliver, C.: 1991, ‘Strategic Responses to Institutional Processes’, Academy of Management Review 16(1), 145-179.
Perez-Batres, L.A., J.P. Doh, V.V. Miller and M.J. Pisani: 2012, ‘Stakeholder Pressures as Determinants of CSR Strategic Choice: Why Do Firms Choose Symbolic versus Substantive Self-Regulatory Codes of Conduct?’, Journal of Business Ethics 110, 157-172.
Pfeffer, J. and G.R. Salancik: 1978, The External Control of Organizations. (Harper & Row, NY).
Pirsch, J., S. Gupta and S.L. Grau: 2007, ‘A Framework for Understanding Corporate Social Responsibility Programs as a Continuum: An exploratory study’, Journal of Business Ethics 70(2), 125-140.
Porter, M.E. and M.R. Kramer: 2006, ‘Strategy and Society: The Link between Competitive Advantage and Corporate Social Responsibility’, Harvard Business Review 84(12), 78–92.
Powell, W.W. and J.A. Colyvas: 2007, ‘New Institutionalism’, in S.R. Clegg and J.R. Bailey (eds.), International Encyclopedia of Organization Studies (Sage Publication, Thousand Oaks, CA), pp. 976-980.
Prayukvong, P. and M. Olsen: 2009, “Research Paper on Promoting Corporate Social Responsibility in Thailand and the Role of Volunteerism’, The NETWORK Thailand for UNDP Thailand, Bangkok, Thailand.
Preacher, K.J. and A.F. Hayes: 2004, ‘SPSS and SAS Procedures for Estimating Indirect Effects in Simple Mediation Models’, Behavior Research methods, Instruments, and Computers 36(4), 717-731.
Preston, C.C. and A.M. Colmam: 2000, ‘Optimal Number of Response Categories in Rating Scales: Reliability, Validity, Discriminating power, and Respondent Preferences’, Acta Psychologica 104, 1-15.
Preston, L.E. and J.E. Post: 1975, Private Management and Public Policy: The Principle of Public Responsibility. (Prentice Hall, Englewood Cliffs, NJ).

28
Porter, M.E. and M.R. Kramer: 2006, ‘Strategy and Society: The Link between Competitive Advantage and Corporate Social Responsibility’, Harvard Business Review 84(12), 78–92.
Robbins, S.P. T.A. Judge: 2010, Organizational behavior, 14th edition. (Prentice Hall, Englewood Cliffs, NJ).
Russo, M.V. and P.A. Fouts: 1997, ‘A Resource-Based Perspective on Corporate Environmental Performance and Profitability’, Academy of Management Journal 40(3), 534-559.
Sansiri: 2013, ‘Social Change’, http://www.sansiri.com/socialchange/, Accessed: September 10, 2013.
Schneider, S.C. and A.D. Meyer: 1991, ‘Interpreting and Responding to Strategic Issues: The Impact of National Culture’, Strategic Management Journal 12(4), 307-320.
Scott, W.R.: 2007, Institutions and Organizations: Ideas and Interests, 3rd edition. (Sage Publication, Thousand Oaks, CA).
Selznick, P.: 1996, ‘Institutionalism “Old” and “New”, Administrative Science Quarterly 41, 270-277.
Sharma, S.: 2000, ‘Managerial Interpretations and Organizational Context as Predictors of Corporate Choice of Environmental Strategy’, Academy of Management Journal 43(4), 681-697.
Siam Cement Group (SCG): 2013, ‘Sustainable Development’, http://www.scg.co.th/en/05sustainability_development/, Accessed: September 10, 2013.
Sobel, M.E.: 1982, ‘Asymptotic Confidence Intervals for Indirect Effects in Structural Equation Models’, in S. Leinhardt (ed.), Sociological Methodology (American Sociological Association, Washington, D.C.), pp. 290-312.
Thorndike, E.L.: 1920, ‘A Constant Error in Psychological Ratings’, Journal of Applied Psychology 4, 25-29.
Tversky, B. and K. Hemenway: 1983, ‘Categories of Environmental Scenes’, Cognitive Psychology 15, 121-149.
Waddock, S. and S.B. Graves: 1997, ‘The Corporate Social Performance-Financial Performance Link’, Strategic Management Journal 18(4), 303-319.
Walker, K. and F. Wan: 2012, ‘The Harm of Symbolic Actions and Green-Washing: Corproate Actions and Communications on Environmental Performance and Their Financial Implications’, Journal of Business Ethics 109(2), 227-242.
Weaver, G.R., L.K. Treviño and P.L. Cochran: 1999, ‘Integrated and Decoupled Corporate Social Performance: Management Commitments, External Pressures, and Corporate Ethics Practices’, Academy of Management Journal 42(5), 539-552.
Westphal, J.D. and E.J. Zajac: 1994, ‘Substance and Symbolism in CEOs’ Long-Term Incentive Plans’, Administrative Science Quarterly 39(3), 367-390.
Wong, N., A. Rindfleisch and J.E. Burroughs 2003, ‘Do Reverse-Worded Items Confound Measures in Cross-Cultural Consumer Research? The Case of the Material Value Scale’, Journal of Consumer Research 30(1), 72-91.

29
Yodprudtikan, P.: 2009, ‘Responsible Business Conduct in Thailand’, Paper presentation for Asia-Pacific conference (Thaipat Institute and United Nations).
Zanna, M.P. and J.K. Rempel: 1988, ‘Attitudes: A New Look at an Old Concept’, in D. Bartal and A.W. Kruglanski (eds.), The Social Psychology of Knowledge, (Cambridge University Press, Cambridge, UK), pp. 315–334.
Zott C, Huy QN. 2007. How Entrepreneurs Use Symbolic Management to Acquire Resources. Administrative Science Quarterly 52(1): 70-105.
Zucker, L.G.: 1987, ‘Institutional Theories of Organization’, Annual Review of Sociology 13,443-464.

30
1.8 Appendix A
In order to test the hypotheses, we first compiled a list of all publicly traded
firms in Thailand from Stock Exchange of Thailand (SET) and Market for Alternative
Investment (mai). We then catalogued all foreign subsidiaries (located in Thailand) of
publicly traded firms in the stock exchanges of United States (NYSE and Nasdaq),
United Kingdom (London Stock Exchange: LSE) and Japan (Tokyo Stock Exchange:
TSE, first section). For firms that are listed in several stock exchanges, we determined
the origin of these foreign subsidiaries based on the location of the firm’s headquarter.
Questionnaire data was collected due to the nature of research and the lack of
secondary data. We did a pre-test to check for clarity and validity of questionnaires, as
well as to test for the relationships among major variables in the study. The final version
is a 5-page questionnaire.
The total population of 1,100 firms was approached for approval from the
management to participate in the research. We employed a group of Thai
undergraduates (fourth year) to help administer the surveys. These students were
carefully instructed for the task. Respondents were asked to retain their own and their
firms’ anonymity in the belief that they would be more likely to take part in the research
and to answer questions more frankly. One questionnaire was sent to each firm during
January-March, 2012, along with cover letter and directions on how to answer. The
respondents had the option to have the questionnaires sent by fax, email or in person.
The respondents could choose if they prefer Thai or English questionnaire. This is to
ensure that concepts are appropriate and valid in cultures under investigation and to
reduce misunderstandings in responses because some respondents may be more
comfortable in one language over another. We translated our questionnaires into Thai
using a back-translation to assure comparability and equivalence in the meaning of
questionnaire (Brislin, 1970). Non-respondents were mailed a reminder note every week
for three times in order to try to increase response rate. However, because the data
collection period was during the firms re-opening after the flood incident of Thailand in
2011-2012, this may be a principal justification why response rate is a bit low. We
believe firms did not have enough time to partake in the research due to pressing issues
caused by the flood.
The results obtained from the questionnaires were compared with those from the
pre-test involving business practitioners. The comparison of results revealed no

31
significant differences with respect to major variables and their relationships in the
study.

32

33
CHAPTER 2 A resource pool for environmental innovation
---------------------------------------------------------------------------------------------------------- This paper reports research on the relationship between sourcing strategy of a firm and its environmental innovation. The data is taken from the Spanish Technological Innovation Panel (PITEC) survey during the period of 2007-2011. The uniqueness of the Spanish innovation structure and the increasing relevance of environmental issues for the Spanish economy make it a proper setting to investigate environmental innovation dynamics. The results from over five thousand firms indicate that large firms are more likely to undertake environmental innovation than small- and medium-sized firms (SMEs). These firms rely equally on all four sources of knowledge – internal, market, institutional and freely-available sources – when deciding to develop environmental innovation. Therefore, the broad horizons with respect to knowledge sources are likely to increase firms’ environmental innovation. In addition, we provide the differences in the nature of firm’s innovation search depending on firm size. Of all the four sources, a reliance on market sources does not lead small firms to develop environmental innovation. Medium firms that rely on internal, market and freely-available sources are more likely to develop environmental innovation, while it is market and institutional sources for larger firms. ----------------------------------------------------------------------------------------------------------

34
2.1 Introduction
The concern for the environment has brought about increasing pressure on
mankind to preserve and maintain natural resources (Bilbao-Osorio et al., 2012;
Elkington, 1994). This has led to various developments of environmental laws, policies
and programs in recent years such as Clean Air Act, ISO14001, tradable emissions, or
United Nations Environment Program (UNEP). It is now becoming increasingly clear
that business should play a role in achieving these greening goals (Elkington, 1994;
Johnstone, Hascic, & Ostertag, 2008) and since one of the mechanisms for firms to deal
with the changing environment is through innovations (Schoonhoven, Eisenhardt, &
Lyman, 1990), environmental innovation therefore presents itself as an effective and
indispensable solution to respond to this mounting pressure and changing environment
(De Marchi, 2012; Johnstone et al., 2008).
The purpose of this paper is to extend traditional innovation literature on search
strategy, into environmental innovation context. Though innovation is a risky business,
firm’s success indeed depends on its ability to innovate consistently (Rosenkopf &
Nerkar, 2001). The fact that firm’s core knowledge development is inextricably linked
to its search strategy that shapes firm’s innovation (Katila & Ahuja, 2002), a study on
search strategy warrants a detailed study. Greek myth has goddess of wisdom, Athena,
bursts fully-grown from Zeus’ head, but firms’ knowledge does not aborn in one
instance like Athena (Leonard-Barton, 1995). No wonder ‘learning organizations’ are
lauded for their ability to generate, source, acquire, and integrate different sources of
knowledge (Nonaka & Takeuchi, 1995; Rosenkopf & Nerkar, 2001). We are interested
in studying the relationship between knowledge sourcing and firms’ environmental
innovation. We empirically examine different sources – namely market sources, internal
sources – firms employ as inputs into their decisions to develop environmental
innovation. We also examine the effect of what we call ‘breadth’ of knowledge sources
on environmental innovation.
Indeed, numerous papers have addressed the relationship between environmental
issues and firms, such as how to develop proactive environmental strategy (Aragón-
Correa & Sharma, 2003) or benefits from operating in an environmentally-friendly
manner (Bansal & Clelland, 2004). However, innovation with respect to environment
per se has not yet been analyzed in sufficient depth, principally due to unavailability of

35
data (Toshi, Hibiki, & Johnstone, 2007). The paper contributes in several important
ways.
First, we help shed light on the nature of environmental innovation search,
specifically, on where firms seek knowledge from during their search process and the
importance of each knowledge source, whether they are small or big firms, new or old,
or in the manufacturing or service industries. In this regard, we offer an insight into the
evolutionary nature of firms’ reliance on different sources of knowledge as they grow
from small to big. As yet, few attempts have been made to theoretically and empirically
link firms’ search strategy with environmental innovation. Basically, empirical analyses
on any types of driving forces of environmental innovation whatsoever are still rare
(Chang, 2011; Horbach, 2008).
Second, we add to the field by analyzing not just one type of knowledge source,
but different types of knowledge sources together. Such study provides the opportunity
to not only examine the different search strategies firms employ, but also to assess the
degree of openness of firms’ search strategies, or as we call ‘breadth’ in this paper. To
our knowledge, rarely are several types of knowledge sources are compared
simultaneously.
Third, our data spans forty-three industries. We are not confined to one single
sector study or on small samples of particular industries like most previous works in
search strategy literature (Laursen & Salter, 2004). Furthermore, the existing literature
is largely based on patent analysis, which provides an incomplete perspective on
innovation. Patents vary in economic importance across sectors (Laursen & Salter,
2004) and particularly patent data is still not an effective mean to measure
environmental innovation (Toshi et al., 2007). In addition, overall patenting activity in
Spain, including eco-patenting is low. Spain has one of the lowest ratios of patents per
million habitants in Europe according to the European patent office (Sorli & Zambrano,
2011). As we are not using patent data, we surmount this limitation and provide
intelligence into environmental innovation issue from another perspective.
Lastly, previous studies mainly provide a small sample analysis of listed firms or
of specific industry, particularly the environmental goods and services industry (Kemp
& Pearson, 2007). Our study, on the contrary, is based on a large scale dataset of over
five thousand observations, ranging from local micro-firms to very large multinational
companies. In doing so, we could expand the literature into other types of firms and
other industries. Moreover, we use Spanish Technological Innovation Panel (PITEC)

36
survey, which is based on the Community Innovation Survey (CIS). PITEC is not only a
valid tool in studying innovation, but it also offers direct comparisons of this work with
other numerous works based on CIS data.
Spain is considered a moderate innovator (Hollanders & Es-Sadki, 2013) with
1.45% gross domestic expenditure on R&D in 2010 versus 2% of the EU average
(Eurostat, 2013), yet Spain is very advanced in terms of environmental innovation,
being among one of the top in the world (Barranco, 2013). In this manner, Spain
provides an interesting context to study environmental innovation.
Our results show that firms rely equally on the four sources of knowledge –
internal, market, institutional and freely-available sources. Thus, the broad knowledge
horizons are likely to increase firms’ environmental innovation. In addition, the results
also indicate that firms of different sizes rely on different sources. Small firms rely on
internal, institutional and freely-available sources equally, while market and
institutional sources are relevant for large firms in driving environmental innovation.
To date, the terms eco-innovation, environmental innovation and green
innovation have been used synonymously (Tietze, Schiederig, & Herstatt, 2011). In this
paper, we adopt the definition below.
“Eco-innovation is the production, assimilation or exploitation of a product, production process, service or management or business method that is novel to the organization… and which results, throughout its life cycle, in a reduction of environmental risk, pollution and other negative impacts of resources use (including energy use)…” (Kemp & Pearson, 2007: 7).
The remainder of the paper is organized into four parts. Part two focuses on the
literature explaining the relationship between knowledge sources and environmental
innovation. In Part three, we present the data, and in Part four, we analyze the results.
Part five discusses and part six concludes.

37
2.2 Literature review and hypotheses
2.2.1 Where do firms get producing inputs to make decisions to develop green
innovation?
According to a prevalent model of technological change by Griliches (1979),
innovative output is the product of knowledge generating inputs. A successful
innovation depends on how successful firms are at identification of, deliberate search
for, reaching out to, managing and implementing these promising sources (Cohen &
Levinthal, 1990; von Hippel, 1988).
Internal knowledge offers a number of advantages over the reliance on outside
research and development, particularly when aspects of relevant knowledge needed to
develop innovation is tacit and somewhat idiosyncratic (Nelson, 1986). With an inward
focus, firms focus on similar technology previously developed and become experts in
their current technological domains (Dosi, 1988). On the other hand, firms’ ability to
detect and exploit outside knowledge proves to be critical to the innovation processes
(Leiponen & Helfat, 2010). They gain ideas for innovating from a wide variety of
different sources (Cohen & Levinthal, 1990; Laursen & Salter, 2004), particularly from
market sources such as from customers and users (von Hippel, 2009), suppliers
(Leiponen, 2002), and competitors (Cassiman and Veugelers, 2006).
Empirical evidence shows that knowledge from and cooperation with suppliers
are important for the development of environmental innovation, especially to ensure
eco-friendly features of the inputs (De Marchi, 2012). Exchanges of information with
customers also prove to be a key to help firms reach their environmental targets
(Theyel, 2006). Although knowledge on environmental innovation is still rather
concentrated in the public sector (Horbach, Oltra & Belin, 2013), the ability of firms to
draw knowledge directly or indirectly from these public institutions such as universities,
government-funded research centers may be difficult. Resource limitations might
constrain firms’ reach to these institutions during their search process, especially for
small firms. It may also be that it is not that simple and easy to establish appropriate
network of contracts with these public sectors for their scientific and technological
expertise. Knowledge transfer from freely-available sources through formal events such
as trade fairs or exhibitions may be more difficult than through informal social activities
such as going out to lunch or drinks. According to knowledge-based theory of the firm,

38
informal interpersonal networks play critical role in knowledge transfer process. They
ease knowledge transfer, helping to motivate individuals to invest energy, time and
effort in sharing knowledge. Particularly an individual is more likely to exert greater
effort to transfer knowledge to a close personal contact (Reagans & McEvily, 2003).
We propose the following hypothesis:
Hypothesis 1: Firms that draw knowledge more from internal and market sources are more likely to decide to introduce environmental innovation than firms that draw knowledge from institutional or freely-available sources.
2.2.2 And the relation with size
Firms of different sizes behave differently in terms of innovation and face
different innovation-related circumstances, for instance, access to funding differs by
size (Busom, Martinez-Ros & Corchuelo, 2011), inducing them to employ different
search strategies. They exhibit changes in the way they organize, reorganize, outsource
and/or shift the origin of their knowledge creation (Laursen & Salter, 2004).
Small firms, particularly small start-ups, are often viewed as key vehicles
transferring university research into commercial innovation (Acs, Audretsch and
Feldman, 1994; Jaffe, 1989). Moreover, with entrepreneurial spirits from small start-
ups, entrepreneurs tend to possess self-efficacy trait (Bandura, 1986). They believe in
their own ability to complete tasks. This might be what drives smaller firms to rely on
themselves more. On the other hand, it might also be that other firms or institutions are
not interested in working with small firms due to the liability of smallness (Bruderl &
Schussler, 1990; Freeman, Carroll & Hannan, 1983). It can be difficult for most small
firms to establish appropriate network of contracts with external actors for scientific and
technological expertise. After all, innovation is essentially a learning process, where it
often involves more than two actors (Freel, 2003). These can be the reasons obliging
small firms to look to their internally-generated knowledge as the first option.
For medium firms, we expect them to draw on internal knowledge. As the size
becomes bigger, these medium-sized firms start to be able to afford internal R&D,
conduct more R&D and be involved in more R&D projects (Cohen et al., 2002).
Internal R&D provides firms with the capability to both develop new products and
processes as well as to absorb knowledge from outside the firm (Cohen & Levinthal,

39
1990). Even under circumstances where collaborative effort with external actors is
required, it is thought essential that firms develop internal competencies first in order to
be able to facilitate the effective recognition, appraisal, negotiation and assimilation of
external expertise (Dosi, 1988).
Furthermore, we also expect small and medium firms (SMEs) to draw rather
equally from freely-available sources. Cohen et al. (2002) suggest that the most
important channels for firms to access public research, or as we call it institutional
source in this paper, are through publications and conferences rather than licenses or
cooperative ventures. These firms are confronted with limited resources and often are
faced with internal shortages of information (Lu & Beamish, 2001). The standard
practice to move knowledge across firm boundaries often involves contractual
agreements (Rosenkopf & Nerkar, 2001) that can be costly for these SMEs. Drawing
from freely-available sources presents itself as an appropriate strategy because it does
not incur or incur little costs.
We postulate the following hypotheses:
Hypothesis 2: Small firms draw knowledge from internal, institutional and freely-available sources when deciding to introduce environmental innovation.
Hypothesis 3: Medium firms draw knowledge from internal and freely-available sources when deciding to introduce environmental innovation.
Larger firms are the ones who are more responsive to the changes in their
industry R&D than smaller firms (Acs et al., 1994). Because larger firms often have a
wider spread of knowledge base, they are better apt at absorbing and exploiting
complementarities from external sourcing (Laursen & Salter, 2004; Veugelers &
Cassiman, 1999). Many times, larger firms simply buy their smaller-sized competitors
in order to obtain their knowledge (Arora & Gambardella, 1990; Veugelers &
Cassiman, 1999). Besides, technology outsourcing creates considerable costs, ex ante in
terms of search and ex post in terms of execution and enforcement (Veugelers &
Cassiman, 1999). It will not be surprising if these firms form strategic alliances or joint
ventures with suppliers and competitors. Firms can also work closely with customers, or
even hire consulting firms, notably the ones who are specialized in environmental

40
compliance or sustainability. We expect larger firms to be the ones who are able to
afford this option more than their smaller counterparts.
Concerning drawing from institutional sources, prior argument is that larger
firms can dedicate greater time and resources in building the links with universities than
small firms who may operate in a more resource-constrained context. Larger firms may
also employ more staff with professional background, who may be able to draw from
their relationships with the universities to support the work of the firms. In this regard,
larger firms are more likely to have the capability to exploit this external knowledge and
to manage interactions with universities. As most research in this field is still
concentrated in the public sector (Horbach et al., 2013), it is only natural that firms look
to these institutions for ideas.
Consistent with previous research, the hypothesis can be stated as:
Hypothesis 4: Large firms draw knowledge from market and institutional sources when deciding to introduce environmental innovation.
2.2.3 And the relation with the intensity of sources of knowledge used
Since Solow’s work in 1957, researchers and practitioners alike have been
associating strong internal knowledge with innovativeness (Gassmann, 2006). However,
prior research also argues that myopic behavior of narrow search from only within firms
leads to potential developments of ‘competency traps’ (Levitt & March, 1988) and/or
‘core rigidities’ (Leonard-Barton, 1995). Gains associated with internal technology
development alone are not sustainable unless firms integrate outside knowledge
(Rosenkopf & Nerker, 2001). As a consequence, a wider and more diverse search create
more opportunities to access and integrate knowledge sets (Katila, 2002; Nelson &
Winter, 1982). Because innovation often results from knowledge fusion or novel
recombination from several sources (Kogut & Zander, 1992), pursuing breadth of
knowledge helps to increase the odds of innovation success.
For environmental innovation that is riskier, requires greater financial
commitment than traditional innovations (Berrone, Fosfuri, Gelabert & Gomez-Mejia,
2013) and is still relatively new and unknown (Horbach et al., 2013), similar logic could
be applied and may be needed even more so than the case of traditional innovations.
Our key assumption is that a diverse search could help ready firms for environmental

41
innovations. Breadth of knowledge would warrant firms with a vast supply of
knowledge inputs to develop innovation with eco-friendly features. Particularly in a
context where there exists a high uncertainty about which knowledge domain would
provide potentially useful information, broad and simultaneous search could help firms
hedge against uncertainties, ensuring that at least one of the sources would lead to
environmental innovation. Knowledge diversity provides not only a more robust basis
for learning, but also interactions across different knowledge sources would help
augment firms’ ability in making novel linkages and associations beyond the reliance on
a single source alone (Cohen & Levinthal, 1990). In order to examine this question, we
develop a proxy variable for ‘breadth’ of a firms’ innovation search strategy. The
variable is based on the number of different sources of knowledge each firm draws on in
its innovative activities. The foregoing arguments suggest the following hypothesis:
Hypothesis 5: The higher the level of breadth of knowledge sources the individual firm draws from, the more likely it will develop environmental innovation.
2.3 Methodology
Data, Empirical Setting and Methodology
The empirical setting in this study is Spanish firms. The data is taken from
Spanish Technological Innovation Panel (PITEC) survey1. It is carried out yearly by the
Spanish National Statistics Institute (INE) in collaboration with the Spanish Science and
Technology Foundation (FECYT) and the Foundation for Technological Innovation
(COTEC).
The choice for this dataset is multifold. First, PITEC is one of the very few
large-scale surveys that provides usable data on environmental innovation. Second,
PITEC is based on the Community Innovation Survey (CIS) framework, which is a
valid tool in studying innovation and is one of the most used datasets for studying
innovation (Laursen & Salter, 2004, 2006). This enables direct comparisons of this
work with previous empirical literature as well as future research using similar datasets.
Finally, the uniqueness of the Spanish innovation structure and the increasing relevance
1 The dataset, the questionnaire and the description of each variable is available free of charge at the website http://icono.fecyt.es/PITEC/Paginas/por_que.aspx

42
of environmental issues for the Spanish economy (De Marchi, 2012) make it a proper
setting to investigate environmental innovation dynamics. Spain is considered as a
moderate innovator (Hollanders & Es-Sadki, 2013). The gross domestic expenditure on
R&D was 1.45% in 2010 versus 2% of the EU average (Eurostat, 2013). In terms of the
overall innovation performance based on the Innovation Union Scoreboard 2013 by the
European Commission, Spain also under-performed with respect to other EU 27
countries, scoring 0.41 versus 0.54 (Hollanders & Es-Sadki, 2013). However, Spain is
aiming towards more environmental innovation to help boost its economic growth.
Spanish green patent applications have grown the most, among others of China, India,
Italy and Japan, between 2000 and 2009 (Barranco, 2013).
Given the lack of data availability at a project level, we study environmental
innovation at a firm level. Though PITEC has been administered since 2003, the
changing nature of the sample and of PITEC questionnaire poses challenges for inter-
temporal analyses. In addition, data on environmental innovation is available only in a
block of period. We therefore are restricted to cross-sectional methodology.
At present, PITEC sample contains about 13,000 firms and comprises four sub-
samples. The first sub-sample is composed of firms with 200 employees or more while
the second represents firms with internal R&D expenditures. In 2004, two more sub-
samples were included. They are firms with less than 200 employees who report
external but no internal R&D and the last sub-sample is firms with no innovation
expenditures. The degree of representativeness of the population depends on the size of
the company. While it is representative for the firms with more than 200 employees, the
representativeness of firms with less than 200 employees are biased towards firms
having internal and/or external R&D. About 74% of firms in the sample claim to
innovate. They are identified by their answer to the question regarding whether or not
they have introduced innovation in the previous two years.
We combine PITEC survey for the period of 2011 with PITEC survey for the
period of 2009. The former contains our dependent variable while the latter contains our
explanatory and control variables. Given the nature of the innovation process and its
complexity, it is quite unlikely that the explanatory variables immediately generate
environmental innovation. For this reason, we use probit model to regress
environmental innovation in year 2011 (which is referred to environmental innovation
for the period of 2009-2011) on sources of knowledge and breadth of knowledge that
firms drew on during the period of 2007-2009. We use a two-year window as the data

43
on environmental innovation and knowledge sources are available only in a block of
period of two years. The use of lag helps to alleviate simultaneity issue as well as to
reduce the potential problem of common method variance (Podsakoff & Organ, 1986)
and reverse causality (Wooldridge, 2013). Nevertheless, we check for common method
variance using Harman’s one-factor test. We perform factor analysis on all variables
using unrotated factor analysis and principal component analysis with and without
varimax rotation. The results suggest no potential problem of common method variance.
No single factor emerges and no factor accounts for a majority of variance (with 36%
for the first factor). Our effective sample consists of 5,321 firms from forty-three
industries.
Dependent variable
To measure environmental innovation, we follow the approach of De Marchi
(2012) in using self-report data on the objectives of the innovation introduced. In many
previous studies, environmental innovation has been commonly measured using
questionnaire surveys (Anton, Deltas & Khanna, 2004; Christmann, 2000). Kemp and
Pearson (2007) suggest using this method to measure environmental innovation, rather
than using environmental investments (input) or environmental patents (output) that
have been extensively employed (Nameroff, Garant, & Albert, 2004). Using
environmental R&D presents problems as this proxy could lead to over- or under-
estimation of innovation (De Marchi, 2012). Further, allocation of expenditures for
specific objectives is determined by managers; however, drawing the exact boundaries
between different objectives is by no means straightforward (Grupp, 1998). The use of
green patents also raises methodological issues (Toshi et al., 2007). There is no widely
accepted agreement in the literature yet as to what constitutes environmental technology
and the patent classification system does not provide specific categories for
environmental patents. The identification of green patents is based solely on
researchers’ judgments and understandings (Kemp & Pearson, 2007). In addition,
patenting activity in Spain, including eco-patenting is low. Spain has one of the lowest
ratios of patents per million habitants in Europe according to the European patent office
(Sorli & Zambrano, 2011). Consequently, one may argue that the use of objective is not
inferior to the use of environmental R&D or environmental patents.

44
To construct our dependent variable, we utilize questions of PITEC survey that
ask about the importance of the following objectives for their innovations: (1) using less
material; (2) using less energy; (3) lower impact on the environment; and (4) complying
to the requirements on environment. The survey asks each firm to evaluate the
importance of each objective based on a Likert scale of 1 to 4, with 4 as null and 1 as
very important. We first assign binary values for each objective. A response of 1 (very
important) or 2 (important) receive a binary value of 1, where responses of 3 (some
importance) and 4 (null) receive a binary value of 0. We then aggregate these answers
and rescale the total score into 0 and 1, with firms having 0s across all four objectives as
0, and 1 otherwise. About 78% of firms in the sample are environmental innovators.
Binary values help to reduce the problem where the ordinal nature of Likert scale cannot
be interpreted as interval scale (Leiponen & Helfat, 2010). The use of a dummy as a
dependent variable also allows comparing the emerging evidence with existing literature
(De Marchi, 2012, Horbach, 2008).
Unfortunately, PITEC is not specifically designed to investigate green
innovation per se. This variable thus could be criticized. To mitigate the potential
problem, we employ different specifications for our dependent variable, testing the
robustness of the model.
Explanatory variables
The key explanatory variables in our study represent different sources of
knowledge and breadth of knowledge sources firms utilize in their innovation activities.
PITEC asks respondents to identify the importance of each of the sources of information
used in innovation activities. The survey lists altogether eleven different sources of
information for innovation, listed in Table 1.

45
TABLE 1 Knowledge Sources
Sources Mean s.d.
Internal Own firm (within the firm and/or group) 0.86 0.35 Market Suppliers 0.59 0.49
Customers 0.60 0.49 Competitors 0.42 0.49 Consulting firms, private research institutes 0.36 0.48
Institutions Universities or other higher educational centers 0.29 0.45 Public research institutes 0.21 0.41 Technology centers 0.30 0.46
Freely-available Conferences, trade fairs, exhibitions 0.43 0.50 Scientific journals and trade/technical publications 0.38 0.48 Professional associations 0.28 0.45
To construct variables for different types of knowledge sources, we adopt the
approach used in Leiponen and Helfat (2010)’s paper. We assign a response of 1 (very
important) or 2 (important) to a binary value of 1, and a response of 3 (some
importance) and 4 (null) to a binary value of 0. To simplify the model and to account
for potential overlap among knowledge sources, we group knowledge sources into
broader categories. The first type of knowledge source remains as it is and it represents
an internal source. The next four are grouped into market sources, the next three into
institutional sources, and the three remaining sources into a fourth category of freely-
available sources. These represent external knowledge sources. We follow Veugelers
and Cassiman (1999)’s approach when aggregating different sources together: summing
binary scores on related variables and rescale the total score to a 0 and 1.
To construct a variable indicating breadth of knowledge sources, we follow the
approach other researchers (Laursen & Salter, 2006; Leiponen & Helfat, 2010) have
used with CIS data. We sum binary values of the eleven sources together. This variable
has a maximum value of eleven. The mean value is 4.71.
Control variables
Firm type: listed, private or institutes. Firms that are listed face more pressure to
be environmentally friendly due to transparency and visibility of being listed;
nonetheless, being listed facilitates easier access to capital to finance environmental
innovation (Toshi et al., 2007). Consequently, we include dummies of private firms,
listed firms, or institutes as controls. For private firms, we control for (1) private firms
with no foreign capital, (2) private firms with foreign capital less than 10%, (3) private

46
firms with foreign capital between 10-50%, and (4) private firms with foreign capital
more than 50%.
Size. Size has been found to affect environmental innovation propensity. Smaller
firms are found to have difficulties in finding investments needed to switch to greener
technologies and in dealing with complexities of environmental innovation (Toshi et al.,
2007). Firm size is included through three dummies: small (1-50 employees), medium
(51-200 employees) and large (more than 200 employees).
Innovation effort. Cassiman and Veugelers (2006) find that higher innovation
expenditure, controlling for size, increases firms’ likelihood to engage in innovation
activities. The data on the R&D expenditures is simulated so using R&D intensity
would be more appropriate. We extend from traditional innovation literature and use the
same approach of using the natural log of total innovation expenditures divided by total
sales to control for R&D intensity, or firms’ previous innovation effort from 2007-2009,
for environmental innovation context.
Innovation output. Serial innovators are more likely to introduce green
innovation (De Marchi, 2012, Horbach, 2008). The variable ‘product innovation’ gets
the value of 1 if firm reports to have introduced product innovation during 2007-2009.
Funding. We include dummies reflecting public support to innovate; valuing 1 if
firms have received public support in the form of subsidies for innovation purposes
during the period of 2007-2009. Policymakers have been using a market-based
instrument such as subsidies to stimulate development and diffusion of environmental
technologies (Rennings, 2000). We control for both local funding from the Spanish
government and European Union-level funding.
Industry dummies. It is necessary to control for industry differences. Level of
R&D for environmentally-related innovation differs by industry type (Toshi et al.,
2007). Demands and technological opportunities along with consumers’ awareness and
policy restrictions concerning environments also vary across sectors (De Marchi, 2012;
Toshi et al., 2007). We hence include forty-three industry dummies in our model.
We would like to include a control of firm’s environmental performance, as
suggested by previous literature (Lázaro, Dorronsoro, Casas, Rodríguez, & Sedano,
2008). This control variable could be a dummy of whether or not a firm is ISO14001
certified, EMAS registered, has environmental reports, or the like. Unfortunately,
PITEC data is anonymized. We could not complement the dataset with externally-
obtained information.
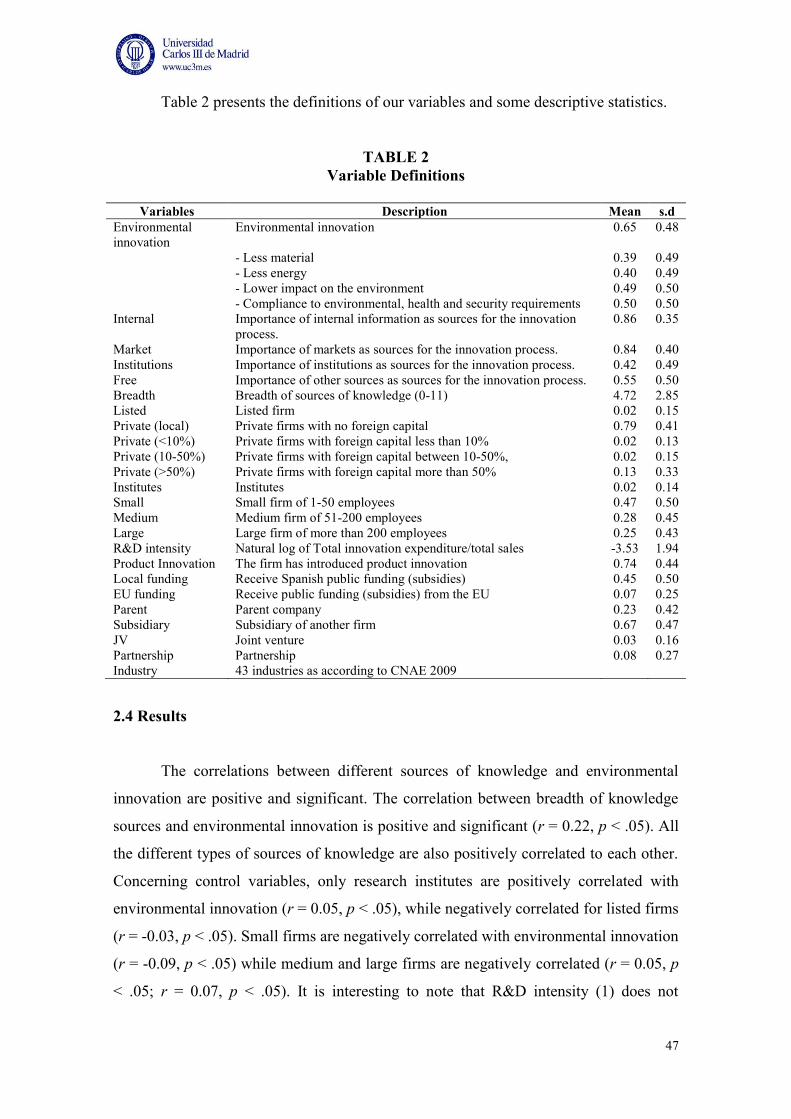
47
Table 2 presents the definitions of our variables and some descriptive statistics.
TABLE 2 Variable Definitions
Variables Description Mean s.d
Environmental innovation
Environmental innovation 0.65 0.48
- Less material 0.39 0.49 - Less energy 0.40 0.49 - Lower impact on the environment 0.49 0.50 - Compliance to environmental, health and security requirements 0.50 0.50 Internal Importance of internal information as sources for the innovation
process. 0.86 0.35
Market Importance of markets as sources for the innovation process. 0.84 0.40 Institutions Importance of institutions as sources for the innovation process. 0.42 0.49 Free Importance of other sources as sources for the innovation process. 0.55 0.50 Breadth Breadth of sources of knowledge (0-11) 4.72 2.85 Listed Listed firm 0.02 0.15 Private (local) Private firms with no foreign capital 0.79 0.41 Private (<10%) Private firms with foreign capital less than 10% 0.02 0.13 Private (10-50%) Private firms with foreign capital between 10-50%, 0.02 0.15 Private (>50%) Private firms with foreign capital more than 50% 0.13 0.33 Institutes Institutes 0.02 0.14 Small Small firm of 1-50 employees 0.47 0.50 Medium Medium firm of 51-200 employees 0.28 0.45 Large Large firm of more than 200 employees 0.25 0.43 R&D intensity Natural log of Total innovation expenditure/total sales -3.53 1.94 Product Innovation The firm has introduced product innovation 0.74 0.44 Local funding Receive Spanish public funding (subsidies) 0.45 0.50 EU funding Receive public funding (subsidies) from the EU 0.07 0.25 Parent Parent company 0.23 0.42 Subsidiary Subsidiary of another firm 0.67 0.47 JV Joint venture 0.03 0.16 Partnership Partnership 0.08 0.27 Industry 43 industries as according to CNAE 2009
2.4 Results
The correlations between different sources of knowledge and environmental
innovation are positive and significant. The correlation between breadth of knowledge
sources and environmental innovation is positive and significant (r = 0.22, p < .05). All
the different types of sources of knowledge are also positively correlated to each other.
Concerning control variables, only research institutes are positively correlated with
environmental innovation (r = 0.05, p < .05), while negatively correlated for listed firms
(r = -0.03, p < .05). Small firms are negatively correlated with environmental innovation
(r = -0.09, p < .05) while medium and large firms are negatively correlated (r = 0.05, p
< .05; r = 0.07, p < .05). It is interesting to note that R&D intensity (1) does not

48
correlate with environmental innovation or listed firms; (2) correlates positively with
research institutes (r = 0.26, p < .05) and small firms (r = 0.41, p < .05); and (3)
negatively correlates with large firms (r = -0.37, p < .05). Both Spanish and EU
subsidies correlate positively with environmental innovation (r = 0.12, p < .05; r = 0.04,
p < .05, respectively). Firms that introduced innovation in the previous two years are
positively correlated with environmental innovation (r = 0.15, p < .05). See Appendix A
for further detail. The correlations indicate low probability of multicollinearity problem.
Nonetheless, we further verify using Collin command in Stata. The variance inflation
factors (VIFs) are in the range of 1.07-8.16 with the mean of 2.13, indicating no
evidence of multicollinearity.
Table 4 reports results of hypotheses 1-5, testing the relationships between four
different sources of knowledge and environmental innovation. Column (I) reports the
coefficients and marginal effects of the full model, testing hypothesis 1. The result
testing hypothesis 5 is reported in Column (II), investigating the impact of breadth of
knowledge sources on environmental innovation. The results of hypotheses 2-4 are
reported in Column (III), (IV) and (V), testing the relationships run on different sub-
samples based on firm size: small (1-51 employees), medium (51-200 employees) and
large (more than 200 employees), respectively.

49
TABLE 4 Regression Results for Knowledge Sources
(I) Full (II) Breadth (III)
Small (IV)
Medium (V)
Large β ME β ME ME ME ME Internal 0.2489** 0.0880** 0.0945** 0.0962* 0.0742 Market 0.2522** 0.0892** 0.0524 0.0829* 0.1521** Institutions 0.1635** 0.0578** 0.0829** 0.0175 0.0682* Free 0.1997** 0.0706** 0.0868** 0.0759** 0.0409 Breadth 0.0820** 0.0290** Constant -0.5815** -
0.3649**
Controls: Private (local) 0.2020 0.0714 0.2205 0.0778 0.1041 0.1897 0.0504 Private (<10%) 0.2404 0.0850 0.2180 0.0770 0.1097 0.3900* -0.0588 Private (10-50%)
0.2260 0.0799 0.2352 0.0831 0.2240 0.1232 -0.0091
Private (>50%) 0.2937* 0.1049* 0.3143* 0.1110* 0.1319 0.2187* 0.0535 Institutes 0.5228* 0.1849* 0.4992* 0.1763* 0.2497 0.2292 0.2672 Medium 0.1495** 0.0528** 0.1456** 0.0514** Large 0.3745** 0.1324** 0.3714** 0.1311** R&D intensity 0.0493** 0.0175** 0.0499** 0.0176** 0.0090 0.0200* 0.0192* Product innovation
0.2779** 0.0983** 0.2842** 0.1004** 0.0960** 0.0977** 0.0758*
Local funding 0.1157** 0.0409** 0.1097** 0.0388** 0.0321 0.0317 0.0606* EU funding 0.0029 0.0010 -0.0148 -0.0052 -0.0372 0.0628 0.0583 Industries Yes Yes Yes Yes Yes Yes Yes Predicted probabilities
71.11% 70.72% 68.04% 74.30% 76.17%
N 5321 5321 5321 5321 2478 1510 1305 Probit model: Log likelihood -3005.44 -3005.09 -1495.32 -818.11 -636.28 LR Chi2 (50) 725.33** 726.04** 293.89** 198.32** 274.30** Pseudo R2 10.77% 10.78% 8.95% 10.81% 17.73% *p < .05, **p < .01 Note: the β column reports coefficients, while the ME column contains marginal effects of the coefficients calculated at means.
The results from Column (I) show that the coefficients and marginal effects of
all four sources are positive and significant. However, the t-test of difference shows that
these coefficients are not significantly different from others, therefore, not supporting
hypothesis 1. The signs of most control coefficients are as expected. Large and medium
firms are more likely to develop environmental innovation. Firms that have previously
developed innovation display a stronger likelihood to introduce environmental
innovation. Local funding, rather than EU funding, even in the form of subsidies, still
are likely to encourage firms to develop environmental innovation. Surprisingly, there
are only few manufacturing industries that are likely to develop environmental

50
innovation. They are food and drinks, chemicals, plastics. Service industries such as
transport, information and communication services and other auxiliary services, on the
contrary, are unlikely to develop environmental innovation. The model correctly
predicts 71.11%.
The results from Column (II) support hypothesis 5. The higher the level of
breadth of knowledge sources employed by individual firm, the more likely it will
develop environmental innovation, compared to other firms with lower level of breadth.
The result for hypothesis 5 merely highlights the reason why hypothesis 1 is not
supported.
Concerning the different sub-samples, Column (III) shows that the decisions of
small firms to develop environmental innovation depends on internal knowledge and
equally on institutional and freely-available sources. Our findings support hypothesis 2.
The results from Column (IV) do not support hypothesis 3. Large firms relying on
market and institutional sources are more likely to develop environmental innovation,
confirming hypothesis 4.
We perform additional robustness checks. Another specification of the
dependent variable is again used. Instead of a dummy, we perform a factor analysis on
the four objectives. We then run OLS and GLM regression on this factor. We also
perform Heckman in case of potential selection problem as the sample in PITEC for
small firms is biased towards firms with internal and/or external R&D expenditures.
Furthermore, we run regressions with different specifications for our proxies for
explanatory and some control variables. The results do not change.
2.5 Discussions
Our results indicate that firms with broader horizons with respect to knowledge
sources are more likely to introduce environmental innovation. An interesting finding is
how firms rely equally on the different sources for environmental innovation. In this
manner, it is no surprise that the coefficient of breadth of knowledge type is positive
and significant. This evidence of the co-occurrence of internal and external knowledge
sourcing activity is consistent with previous works on the sourcing strategy for
traditional innovation (Leiponen & Helfat 2010; Nelson & Winter, 1982). Firms do
indeed tap into external knowledge sources in addition to internal knowledge (Arora &
Gambardella, 1990). Even the largest innovation-active firms today rely on both internal

51
sourcing and external knowledge when developing innovations (Cassiman & Veugelers,
2006; Rigby & Zook, 2002). Because innovation often draws on many sources of ideas,
results from knowledge recombination (Kogut & Zander, 1992; Leiponen & Helfat,
2010) and due to information asymmetry (Venkataraman, 2002), firms with access to a
larger variety of sources of knowledge are in a better position to identify and develop
environmental innovation opportunities. Despite discussions concerning how
knowledge is tacit, the mobility of knowledge has increased tremendously over the
years (Gassmann, 2006). A chance of success is indeed maximized when firms search
broadly (Jewkes, Sawers, & Stillerman, 1958; Leiponen & Helfat, 2010).
The fact that small firms draw from internal source, despite its small size and
resource constraints, is not strange. Internalized corporate search allows firms the ability
to exploit the future cumulativeness and the complexity of technological knowledge as
well as helping to reduce the uncertainty of innovative search without eliminating the
chance to innovate (Dosi, 1988). After all, in most industries, the greater part of the
innovation effort is made by the firms themselves (Gassmann, 2006; Solow, 1957).
Small firms also rely on institutional and freely-available sources as we postulate. Our
findings are consistent with Jaffe (1989)’s and Acs et al. (1994)’s works. They show
that spillovers from university research laboratories are more important in producing
innovative activity in small firms.
Prior research shows that increasing firm size is positively associated with
external linkages (Freel, 2003). Particularly innovative activities of larger firms are
more responsive to industry innovations as compared to smaller firms (Acs et al., 1994).
In line with previous research, our results show that market and institutional sources
drive the probability to develop environmental innovation in large firms. Our findings
concerning the importance of large firm size in the use of university knowledge
corresponds to those of Cohen et al., (2002) and Laursen and Salter (2004). This can be
because larger firms are more likely to both make and buy technology, as suggested by
the literature. Larger firms can simply acquire new environmentally-related
technologies both through the embodied format of hiring away competitors’ top
personnel or working with consultants, or through the disembodied format of directly
acquiring other firms, buying blueprints or R&D outsourcing to other firms (Veugelers
& Cassiman, 1999). Property rights theory (Grossman & Hart, 1986) and transaction
costs economics (Pisano, 1990; Williamson, 1985) explain that such R&D outsourcing
helps firms to tap into existing, often specialized, knowledge and aids firms in time
52
gains, lower innovation costs, and allowing for R&D economies of scale to be more
efficiently exploited (Veugelers & Cassiman, 1999).
Likewise, instead of contracts with external actors that can be expensive and
may cause opportunistic behavior (Veugelers & Cassiman, 1999), another possible
option is cooperative agreements (Oxley, 1997) such as alliances. In particular,
environmental innovation is riskier, requires more resources than traditional innovations
(Berrone et al., 2013) and is still largely unknown (Horbach et al., 2013). This option of
cooperative agreement can present itself as appropriate. It allows firms to share costs
and risks. It allows firms to have access to external technologies that would otherwise
be impossible to get a hand on. It also allows firms to have the opportunity to exploit
the synergy from knowledge complementarity among partners (Arora & Gambardella,
1990; Veugelers & Cassiman, 1999). To form or enter into such a network of alliance, it
is usually based on a careful selection of partners where reputation does matter (Gulati,
1995). Additionally, hold-up problem can occur. The typical complex and uncertain
nature of R&D projects can also exacerbate the problem (Veugelers & Cassiman, 1999).
Thus, this could be a difficult option for smaller firms to pursue or there can be too little
incentives or too high costs for smaller firms to deal with, again largely due to liability
of smallness and newness (Bruderl & Schussler, 1990; Freeman et al., 1983;
Stinchcombe, 1965).
Care should be taken into account when interpreting the reliance of SMEs on
internal sourcing to spur environmental innovation. We cannot distinguish from our
dataset if these environmental innovations are end-of-the-pipe type or clean
technologies. End-of-the-pipe technologies involve implementing add-on measures that
do not require complex technologies, while cleaner technologies are seen as involving
more advanced and complex technologies (Frondel et al., 2007). If these green
technologies in these small firms are more end-of-the-pipe type, the fact that SMEs
conduct internalized corporate search, while larger firms do not, make sense. To
develop very advanced clean technologies, a reliance on other partners in order to help
reduce risks does not seem to be a strange choice.
Consistent with the work by Toshi et al. (2007), our study also reveals that
larger firms are more likely to develop green innovations than small- and medium-sized
firms. Smaller firms can have more difficulties in finding investments needed to switch
to greener technologies and in dealing with complexities of environmental innovation.
While previous research shows that smaller firms do recognize potential gains from

53
green innovation, the lack of financial resources and time can constrain their ability to
develop environmental innovation. For instance, the work by Worthington and Patton
(2005) shows that firms with fewer than 25 employees are less likely to be able to
commit resources to environmental improvements. On top of that, larger firms, often
publicly-held firms, are more subjected to limelight and are often more scrutinized by
the public about their actions, particularly concerning social and environmental issues
(McWilliams and Siegel, 2001; Waddock and Graves, 1997). The incentives for them to
develop environmental innovation can also be high due to this reason.
However, careful interpretations about size are needed as we could not
distinguish if these firms engage in environmental innovation for compliance purpose,
operation-driven, or from a strategic stance where they see green innovation as a
business opportunity to be exploited. Indeed larger firms often show that they are
sincere about their environmental concerns, but they usually respond to these pressures
through incremental process innovation by adopting environmental communication or
management systems (Hockerts & Wustenhagen, 2010). They can be less ambitious in
developing environmental innovation than smaller firms because they are already well-
established and their sales have not been affected by the whole greening concept.
Moreover, they are anchored by their existing assets that reflect past investments
(Hockerts & Wustenhagen, 2010). Thus, though larger firms are more likely to
introduce green innovation, they can just be doing simply compliance-driven green
innovation type.
PITEC data is useful yet it has its limitations. Besides that the sample is biased,
as most firms in the dataset are innovators, PITEC is also not built specifically to assess
environmental innovation. It limits our approach to measuring environmental
innovation from innovation objectives with environmental concerns. We cannot tell the
actual outputs and/or economic values from innovation objectives. Our measure also
does not allow us to distinguish between firms that introduced end-of-the pipe
technology from others whose entire innovative effort is devoted toward the reduction
of environmental impact. In general, the main challenge we face is scarce information.
Large-scale survey like CIS has attempted to ease the problem by including a section on
innovations with environmental benefits in its 2008 questionnaire. However, the section
was dropped from its later questionnaires. Also, PITEC data for some variables are
provided in blocks of period rather than yearly, limiting us to use cross-sectional
methodology.

54
This study is a preliminary examination on the topic. It presents us with
numerous possibilities for future research. First, a great contribution that future research
should attempt is to use panel data.
Second, the use of other measures of environmental innovation would help to
improve this analysis. An alternative input measure can be environmental innovation
expenditures. Another option can be the use of innovation effort factors combined with
eco-efficiency performance parameters (Lázaro et al., 2008). The use of a different
output measure, besides environmental patent, such as the number of new
environmental products or processes will also offer interesting insights (Kemp &
Pearson, 2007).
Third, knowledge sourcing for environmental innovation has received the least
attention in the environmental innovation surveys so far (Arundel & Kemp, 2009). A
valuable avenue for future research could be to break down the relationship studied here
into the different typologies of environmental innovation that exist or to study the link
between knowledge sourcing and valuable environmental innovation with strong
environmental and/or economic impact. Researchers could also extend the field by
analyzing the issue focusing on the recipients of the spillovers rather than just upon the
source. Or researchers could combine with the data on perhaps licensing or managerial
choice in shaping firms’ propensity to draw from certain sources (Laursen & Salter,
2004). Beyond a diverse knowledge structure, a study of the sort of knowledge that
firms possess to help enhance their absorptive capacity to introduce environmental
innovation would also be interesting. Critical knowledge does not mean only technical
knowledge, but it also includes awareness of where useful complementary expertise
resides, be it within or outside firms (Cohen & Levinthal, 1990).
Fourth, theoretical and empirical analyses on determinants of environmental
innovations are still rare (Horbach, 2008). A study of other determinants such as public
support for environmental innovation (i.e., market-based incentives such as public
financing or subsidies specifically for environmental innovations) would be fruitful. In
essence, a study on any determinants of environmental innovation would help to
advance the field and to help us see whether or not general innovation theories can be
applied to environmental innovation contexts.
Lastly, we hope to strengthen our results by comparing our Spanish case against
those of other countries that have participated in the CIS survey, as PITEC uses the
same questionnaire format as CIS.

55
2.6 Conclusion
Existing literature has extensively addressed environmental issues and firms but
innovation with respect to environment per se has not yet been analyzed in sufficient
depth. A lot of understanding about environmental innovation is still needed. This paper
reports research on the relationship between sourcing strategy of a firm and its
environmental innovation. The data is taken from the Spanish Technological Innovation
Panel (PITEC) survey during the period of 2007-2011. Our empirical results suggest
that firms that rely on greater breadth of knowledge sources are more likely to introduce
environmental innovation. This is no surprise in our context of environmental
innovation as the extent of breadth of sources is known to be associated with new
approaches towards innovation (Leiponen & Helfat, 2010). The novelty of our study is
that, to our knowledge, this is the first statistical study at the firm level that assesses the
different types of knowledge sources together along with breadth of knowledge sources.
Existing empirical studies have yet to provide hard evidence on the use of knowledge
sources in relationship with environmental innovation. This study hopes to provide new
insights into how firms can deal with environmental innovation in this modern economy
where there is a heightened demand for firms to be environmentally-friendly.

56
2.7 References
Acs, Z.J., Audretsch, D.B., & Feldman, M.P. 1994. R&D spillovers and recipient firm size. Review of Economics and Statistics, 76(2): 336-340.
Anton, W.R.A., Deltas, G., & Khanna, M. 2004. Incentives for environmental self-regulation and implications for environmental performance. Journal of Environmental Economics and Management, 48(1): 632-654.
Aragón-Correa, J. A., & Sharma, S. 2003. A contingent resource-based view of proactive corporate environmental strategy. Academy of Management Review, 28(1): 71-88.
Arora, A., & Gambardella, A. 1990. Complementarity and external linkages: The strategies of the large firms in biotechnology. Journal of Industrial Economics, 38: 361-379.
Arundel, A., & Kemp, R. 2009. Measuring eco-innovation. Working paper number 2009-017, UNU-Merit, Maastricht.
Bandura, A. 1986. Social foundations of though and action: A social cognitive theory. Englewood Cliffs, NJ: Prentice-Hall.
Bansal, P., Clelland, I. 2004. Talking trash: Legitimacy, impression management, and unsystematic risk in the context of the natural environment. Academy of Management Journal, 47(1): 93-103.
Barranco, J.S. 2013. Informe COTEC 2013. Fundación COTEC para la innovación tecnológica, Madrid.
Berrone, P., Fosfuri, A., Gelabert, L., & Gomez-Mejia, L.R. 2013. Necessity as the mother of ‘green’ inventions: Institutional pressures and environmental innovations. Strategic Management Journal, 34(8): 891-909.
Bilbao-Osorio, B., Blanke, J., Crotti, R., Hanouz, M.D., Fidanza, B., Geiger, T., Ko, C., & Serin, C. 2012. Chapter 1.2: Assessing the sustainable competitiveness of nations: The global competitiveness report 2012-2013. World Economic Forum 2012.
Bruderl, J., & Schussler, R. 1990. Organizational mortality: The liabilities of newness and adolescence. Administrative Science Quarterly, 35(3): 530-547.
Busom, I., Martines-Ros, E., & Corchuelo, B. 2011. Obstáculos a la innovación y uso de incentivos ¿Subvenciones o estímulos fiscales? Economía industrial, 382: 35-44.
Cassiman, B., & Veugelers, R. 2006. In search of complementarity in innovation strategy: Internal R&D and external knowledge acquisition. Management Science, 52(1): 68-82.
Chang, C.H. 2011. The influence of corporate environmental ethics on competitive advantage: The mediation role of green innovation. Journal of Business Ethics, 104: 361-370.
Christmann, P. 2000. Effects of ‘best practices’ of environmental management on cost advantage: the role of complementary assets. Academy of Management Journal, 43(4): 663-680.
Cohen, W.M., & Levinthal, D.A. 1990. Absorptive capacitive: A new perspective on learning and innovation. Administrative Science Quarterly, 35(1): 128-152.

57
Cohen, W.M., Nelson, R.R., & Walsh, J. 2002. Links and impacts: The influence of public research on industrial R&D. Management Science, 48: 1-23.
De Marchi, V. 2012. Environmental innovation and R&D cooperation: Empirical evidence from Spanish manufacturing firms. Research Policy, 41(3): 614-623.
Dosi, G. 1988. Sources, procedures and microeconomic effects of innovation. Journal of Economic Literature, 26(3): 1120-1171.
Elkington, J. 1994. Towards the sustainable corporation: Win-win-win business strategies for sustainable development. California Management Review, 36(2): 90-100.
Eurostat. 2013. Statistics: Science, technology and innovation. http://epp.eurostat.ec.europa.eu/portal/page/portal/science_technology_innovation/introduction, Accessed: December 1, 2013.
Freel, M.S. 2003. Sectoral patterns of small firm innovation, networking and proximity. Research Policy, 32(5): 751-770.
Freeman, J., Carroll, G. R., & Hannan, M.T. 1983. The liability of newness: Age dependence in organizational death rates. American Sociological Review, 48(5): 692-710.
Frondel, M., Horbach, J., & Rennings, K. 2007. End-of-pipe or cleaner production? An empirical comparison of environmental innovation decisions across OECD countries. Business Strategy and the Environment, 16(8): 571-584.
Gassmann, O. 2006. Opening up the innovation process: Towards an agenda. R&D Management, 36(3): 223-228.
Griliches, Z. 1979. Issues in assessing the contribution of R&D to productivity growth. Bell Journal of Economics, 10(Spring): 92-116.
Grossman, S., & Hart, O. 1986. The costs and benefits of ownership: A theory of vertical and lateral integration. Journal of Political Economy, 94: 691-719.
Grupp, H. 1998. Foundations of the economics of innovation – Theory, measurement and practice. Cheltenham: Edward Elgar.
Gulati, R. 1995. Does familiarity breed trust? The implications of repeated ties for contractual choice in alliances. Academy of Management Journal, 38: 85-112.
Hockerts, K., & Wustenhagen, R. 2010. Greening Goliaths versus emerging Davids – Theorizing about the role of incumbents and new entrants in sustainable entrepreneurship. Journal of Business Venturing, 25: 481-492.
Hollanders, H., & Es-Sadki, N. 2013. Innovation union scoreboard 2013. Maastricht Economic and Social Research Institute on Innovation and Technology, UNU-MERIT, Maastricht.
Horbach, J., Oltra, V., & Belin, J. 2013. Determinants and specificities of eco-innovations compared to other innovations – An econometric analysis for the French and German industry based on the community innovation survey. Industry and Innovation, 20(6): 523-543.
Horbach, J. 2008. Determinants of environmental innovation – New evidence from German panel data sources. Research Policy, 37: 163-173.

58
Jaffe, A.B. 1989. Real effects of academic research. American Economic Review, 79: 957-970.
Jewkes, J., Sawers, D. & Stillerman, R. 1958. The sources of invention. London: Macmillian.
Johnstone, N., Hascic, I, & Ostertag, K. 2008. OECD studies on environmental innovation: Environmental policy, technological innovation and patents. Paris: OECD Publishing.
Katila, R. 2002. New product search over time: Past ideas in their prime? Academy of Management Journal, 45: 995–1010.
Katila, R., & Ahuja, G. 2002. Something old, something new: A longitudinal study of search behavior and new product introduction. Academy of Management Journal, 45: 1183-1194.
Kemp, R., & Pearson, P. 2007. Final report of the MEI project measuring eco-innovation. MEI Project number 044513. Deliverable 15.
Kogut, B., & Zander, U. 1992. Knowledge of the firm, combinative capabilities, and the replication of technology. Organization Science, 3(3): 383-397.
Laursen, K., & Salter, A. 2004. Searching high and low: What types of firms use universities as a source of information? Research Policy, 33: 1201-1215.
Laursen, K., & Salter, A. 2006. Open for innovation: The role of openness in explaining innovation performance among UK manufacturing firms. Strategic management journal, 27: 131-150.
Lázaro, J.E., Dorronsoro, I.C., Casas, S.H., Rodríguez, D.G., & Sedano, J.A.G. 2008. Indirect measurement of eco-innovation based on company environmental performance data. MEI project workpackage 7. Deliverable D12.
Leiponen, A. 2002. Why do firms not collaborate? Competencies, R&D collaboration, and innovation under different technological regimes. In A. Kleinknecht & P. Mohnen (Eds.). Innovation and firm performance: Econometric explorations of survey data: 253-277. London: Palgrave.
Leiponen, A., & Helfat, C.E. 2010. Innovation objectives, knowledge sources, and the benefits of breadth. Strategic Management Journal, 31: 224-236.
Leonard-Barton, D. 1995. Wellsprings of knowledge: Building and sustaining the sources of innovation. Boston, MA: Harvard Business School Press.
Levitt, B., & March, J.G. 1988. Organizational learning. Annual Review of Sociology, 14: 319–340.
Lu, J.W., & Beamish, P.W. 2001. The internationalization and performance of SMEs. Strategic Management Journal, 22: 565-586.
McWilliams, A., & Siegel, D.S. 2001. Corporate social responsibility: A theory of firm perspective. Academy of Management Review, 26(1): 117-127.
Nameroff, T., Garant, R. & Albert, M. 2004. Adoption of green chemistry: An analysis based on US patents. Research Policy, 33: 959–974.
Nelson, R. 1986. Institutions generating and diffusing new technology. In F. Arcangeli, P. David & G. Dosi (Eds.). Frontiers in innovation diffusion. Oxford: Oxford University Press.

59
Nelson, R.R., & Winter, S. 1982. An evolutionary theory of economic change. Cambridge, MA: Harvard University Press.
Nonaka, I., & Takeuchi, H. 1995. Knowledge-creating company: How Japanese companies create the dynamics of innovation. NY: Oxford University Press.
Oxley, J. 1997. Appropriability hazards and governance in strategic alliances: A transaction cost approach. Journal of Law, Economics and Organization, 13(2): 387-409.
Pisano, G. 1990. The R&D boundaries of the firm: An empirical analysis. Administrative Science Quarterly, 35: 153-176.
Podsakoff, P.M., & Organ, D.W. 1986. Self-reports in organizational research: Problems and prospects. Journal of Management, 12(4): 531-544.
Reagans, R., & McEvily, B. 2003. Network structure and knowledge transfer: The effects of cohesion and range. Administrative Science Quarterly, 48(2): 240-267.
Rennings, K. 2000. Redefining innovation – Eco-innovation research and the contribution from ecological economics. Ecological Economics, 32: 319-332.
Rigby, D., & Zook, C. 2002. Open-market innovation. Harvard Business Review, 80(10): 80-89.
Rosenkopf, L., & Nerkar, A. 2001. Beyond local search: Boundary-spanning, exploration, and impact in the optical disk industry. Strategic Management Journal, 22: 287-306.
Schoonhoven, C., Eisenhardt, K., & Lyman, K. 1990. Speeding products to market: Waiting time to first product introduction in new firms. Administrative Science Quarterly, 35: 177-207.
Solow, R. 1957. Technical change and the aggregate production function. Review of Economics and Statistics, 39: 312–320.
Sorli, M., & Zambrano L.G. 2011. Eco-innovation observatory in Spain: EIO country profile 2011. Eco-innovation observatory (EIO).
Stinchcombe, A.L. 1965. Social structures and organizations. In J. G. March (Ed.). Handbook of organizations: 142-193. Chicago: Rand McNally.
Theyel, G. 2006. Customer and supplier relations for environmental performance. In J. Sarkis (Ed.), Greening the supply chain: 139-149. Berlin, Springer-Verlag, Berlin.
Tietze, F., Schiederig, T., & Herstatt, C. 2011. What is green innovation? A quantitative literature review. Paper presented at the XXII ISPIM Conference, Hamburg.
Toshi, H.A., Hibiki, A., & Johnstone, N. 2007. An empirical study of environmental R&D: What encourages facilities to be environmentally innovative? In N. Johnstone (Ed.), Environmental policy and corporate behavior: 142-173. Cornwall: MPG Books.
Venkataraman, S. 2002. The distinctive domain of entrepreneurship research. UK: Edward Elgar Press.
Veugelers, R., & Cassiman, B. 1999. Make and buy in innovation strategies: Evidence from Belgian manufacturing firms. Research Policy, 28: 63-80.
von Hippel, E. 1988. The sources of innovation. New York: Oxford University Press.

60
von Hippel, E. 2009. Democratizing innovation: The evolving phenomenon of user innovation. International Journal of Innovation Science, 1(1): 29-40.
Waddock, S., & Graves, S.B. 1997. The corporate social performance-financial performance link. Strategic Management Journal, 18(4): 303-319.
Williamson, O. 1985. The economic institutions of capitalism, firms, markets, relational contracting. New York: The Free Press.
Wooldridge, J.M. 2013. Introductory econometrics: A modern approach (5th international edition). Australia: South-Western.
Worthington, I., & Patton, D. 2005. Strategic intent in the management of the green environment within SMEs: An analysis of the UK screen-printing sector. Long Range Planning, 38: 197-212.

61
2.8 Appendix A: Correlation coefficients
Appendix A Correlation Coefficients
1 2 3 4 5 6 7 8 9 10 11 12 13 14 15 16 1. Environmental innovation
1
2. Internal 0.15* 1 3. Market 0.16* 0.35* 1 4. Institutions 0.15* 0.16* 0.21* 1 5. Free 0.16* 0.22* 0.33* 0.30* 1 6. Breadth 0.22* 0.41* 0.54* 0.62* 0.70* 1 7. Listed -0.03* -0.03* -0.03* 0.04* -0.00 0.01 1 8. Private -0.01 0.00 -0.01 -0.12* -0.06* -0.12* -0.72* 1 9. Institutions 0.05* 0.03* 0.04* 0.13* 0.09* 0.16* -0.02 -0.68* 1 10. Small -0.09* -0.06* -0.03* -0.02 0.01 -0.04* -0.08* 0.04* 0.03* 1 11. Medium 0.05* 0.03* 0.01 0.03* 0.02 0.03* -0.03* 0.01 0.02 -0.59* 1 12. Large 0.07* 0.04* 0.01 -0.01 -0.03* 0.01 0.13* -0.06* -0.05* -0.54* -0.36* 1 13. R&D intensity
0.01 0.05* 0.06* 0.21* 0.15* 0.21* 0.01 -0.20* 0.26* 0.40* -0.09* -0.37* 1
14. Product innovation
0.15* 0.15* 0.18* 0.10* 0.18* 0.21* -0.04* 0.02 0.01 0.00 0.04* -0.04* 0.13* 1
15. Local funding
0.12* 0.13* 0.15* 0.38* 0.17* 0.31* 0.03* -0.11* 0.13* -0.01 0.03* -0.01 0.32* 0.13* 1
16. EU funding 0.04* 0.04* 0.07* 0.19* 0.10* 0.18* 0.12* -0.26* 0.25* -0.04* 0.00 0.04* 0.23* 0.03* 0.21* 1 *p < .05

62

63
CHAPTER 3 Environmental innovation and its impact on
employment ---------------------------------------------------------------------------------------------------------- This paper examines the relationship between environmental innovation and employment from firm-level evidence. The data is taken from the Spanish Technological Innovation Panel (PITEC) survey and it covers the period of 2007-2011. The increasing relevance of environmental issues for the Spanish economy, its unemployment problem and the uniqueness of the Spanish innovation structure (De Marchi, 2012) make it a proper and interesting context to investigate environmental innovation dynamics. Based on our regression results on more than five thousand firms, we find an increase in employment for environmental innovators, as compared to non-environmental innovators and non-innovators, both before and during the Spanish crisis that started in 2008. The increase in employment is higher for dirty industries. Our results show that no matter firms introduce environmental innovation voluntarily or merely to comply with regulations, they create jobs. In addition, our results show a positive and significant relationship between employment and firms that report an increase or at least no change in the degree of importance paid to environmental innovation. This analysis has major policy implications on the Spanish economy, which is experiencing a severe unemployment problem. ----------------------------------------------------------------------------------------------------------

64
3.1 Introduction
Undesirable environmental consequences from human activities advance at an
alarming speed (Pacala & Socolow, 2004). From climate change and global warming
leading to melting ice cap, to stronger storms and hurricanes and major flooding (Patz,
Campbell-Lendrum, Holloway, & Foley, 2006; Easterling et al., 2000) or even to
China’s toxic air pollution that is so bad now it resembles a ‘nuclear winter’ (Kaiman,
2014). And the list continues on. Our technologies have indeed helped elevate our lives
in an unprecedented manner, but we will soon outstrip these advantages if growth
continues in this way.
As corporations have been portrayed as one of the key causes of current
environmental state, numerous firms take on active roles in environmental management
(Walker & Wan, 2012). Different actions are set out in favor of environmental
protection and improvement. Some firms merely adopt the management of the
environment, while some are being more strategic by encompassing environmental and
economic aspects together through environmental innovation development. Not only
because corporations are being scrutinized and put under pressures to respond, but also
the increasing regulatory pressures and public incentives control and induce firms
towards innovation developments with positive environmental implications (Bilbao-
Osorio et al., 2012; Johnstone, Hascic, & Ostertag, 2008).
From the perspective of the economy at large, one of the topics commonly
addressed during political debates concerns the question of how firms’ transformations
towards being green affect economic performance and employment (Rennings, Ziegler
& Zwick, 2004). For instance, the Strategy EU2020 sets out guidelines for a new
economy where the crisis should be turned into an opportunity for creating jobs,
building a smarter and greener economy that rest on innovation and better use of
resources (Europe 2020, 2014). Innovation literature and existing empirical evidence
shows that the relationship between technological progress and job creation is clearly
not negative (Harrison et al., 2008; Rennings et al., 2004). In contrast, environmental
innovation leads to an increase, a decrease or even no effect on job creation. For
instance, environmental product innovation has a positive effect on employment
(Rennings et al., 2004); while cost reductions envisaged by environmental innovation
create job losses and innovations purely motivated by environmental goals have no
effect (Rennings & Zwick, 2002). With the few empirical works that exist, these studies

65
are weak because many works lie in case study methodology (Rennings et al., 2004).
The consequences of green innovation on job creation are thus of our particular interest
as the relationship is not particularly well-known and the views and impacts indeed spur
ongoing debate.
In an effort to resolve this seeming paradox, the focus of our paper is to estimate
the effect of environmental innovation on job creation from the best data available at
hand, considering the scarcity nature of environmental innovation data (Horbach &
Rennings, 2013). We base our study on the Spanish Technological Innovation Panel
(PITEC) survey of more than five thousand firms during the period of 2007-2011.
PITEC is based on the Community Innovation Survey (CIS) framework, which is a
valid tool in studying innovation and is one of the most used datasets for studying
innovation (Laursen & Salter, 2004, 2006). It is carried out yearly by the Spanish
National Statistics Institute (INE) in collaboration with the Spanish Science and
Technology Foundation (FECYT) and the Foundation for Technological Innovation
(COTEC). The paper contributes in several important ways.
First, this paper tries to fill the gap, at least partially, by providing more
empirical evidence about the impact of environmental innovation on job creation at
firm-level. As PITEC is based on CIS framework, it enables direct comparisons of this
work with previous empirical literature as well as future research using similar datasets.
Not only that this paper helps to enlarge the very few findings that exist in this field, but
it is also useful towards the design of micro-policies that will help to improve growth in
employment, especially the employment crisis in Spain.
Second, we address criticisms from prior research concerning the needs to
expand the study on firm’s environmental friendliness to other settings outside the
predominant U.S. sample (Walker & Wan, 2012). In this paper, we focus on Spanish
firms. Spain is a moderate innovator (Hollanders & Es-Sadki, 2013) with gross
domestic R&D expenditure in 2011 roughly 0.5% below the European Union (EU)
average (Eurostat, 2013), yet Spain is very advanced in terms of environmental
innovation. In 2011, Spain’s composite index of eco-innovation scoreboard was 28%
above the EU27 average (EIO, 2011; Sorli & Zambrano, 2011). Many environmental
efforts both at national- and autonomous community-level have continued to offer a
range of strategies and documents related to innovation and sustainable development
such as an environmental technology platform (PLANETA) to promote green growth
and co-operation on environmental technologies among public and private research

66
organizations (OECD, 2012). To date, voluntary green certifications have been adopted
countrywide and have received a high recognition among Spanish firms. Spain is the
first country in Europe and the third in the world with 16,433 ISO14001 certificates.
The number of eco-management and audit scheme (EMAS) certified organizations is as
well very high, with 1,235 certified workplaces (Sorli & Zambrano, 2011). Moreover,
Spain aims to use environmental innovation to help boost economic growth (Barranco,
2013). The expenditures on environmental protection in 2011 stand at 2.39 million
Euros, representing a 0.2% increase from the previous year (INE, 2013a). The
increasing relevance of environmental issues for the Spanish economy, its
unemployment problem and the uniqueness of the Spanish innovation structure (De
Marchi, 2012) make it a proper and interesting context to investigate environmental
innovation dynamics.
Lastly, we present the results in aggregate manner like in previous studies as
well as distinguishing between types of environmental innovation that exists. We
decompose environmental innovation into voluntary and compliance-driven.
From our results, we can establish a ‘trace’ of an increase in employment for
environmental innovators, as compared to non-environmental innovators and non-
innovators, both before and during the Spanish crisis. The increase in employment is
higher for dirty industries. Our results show that no matter firms develop environmental
innovation in order to comply to regulations or voluntarily, the bottom line is that they
create jobs. In addition, our results show a positive and significant relationship between
employment and firms that report an increase or at least no change in the degree of
importance paid to environmental innovation.
The remainder of the paper is organized into four parts. Part two focuses on the
literature explaining what environmental innovation is and its relation to job creation at
firm-level. In Part three, we present the data and methods. In Part four, we analyze the
results. Part five discusses and part six concludes.
3.2 Literature review and hypotheses
3.2.1 Environmental innovation and employment
In recent years, environmental technologies have received a lot of attention from
scholars and policymakers alike. Despite its importance, the study about the impact of

67
environmental innovation on job creation at the macroeconomic-level is still rare
(Pfeiffer & Rennings, 2001; Rennings et al., 2004) and very perplexed, notably when
coupled with the effect from environmental policies.
On one hand, environmental regulations have created many new firms, in which
according to the literature, firm entry is an important source of employment growth
(Harrison et al., 2008). For example, a group of entrepreneurs saw an increase in
environmental stringency as an opportunity and founded a new firm called LanzaTech
in 2005. It develops and commercializes technologies that turn carbon monoxide into
low-carbon fuels such as ethanol, and chemicals such as propylene for plastic. One of
its most recent projects is with Baosteel, one of China’s largest steel manufacturers.
(LanzaTech, 2014; Tilley, 2014). On top of that, environmental regulations have
resulted in entirely new industries such as those of ‘green industry’. In many cases,
green industry is characterized by substantial potential for growth. The latest report on
environmental sector in Spain shows that employment in this sector has grown
considerably despite economic and unemployment crisis. In 2011, employment in the
sector represents 2.62% of the working population. The structural change in the society
from Spanish’s sustainable economy bill is also expected to create up to 2.8 million
green jobs by 2020 (Jiménez Herrero & Leiva, 2011). In this regard, environmental
innovation impact on employment is positive.
On the other hand, clean production reduces demand for material or energy and
thus reduces demand for labor in these industries. The net effect of green innovation on
employment is therefore uncertain (Pfeiffer & Rennings, 2001).
It is no doubt necessary to understand the impact of technological change at the
macro-level (see Pfeiffer and Rennings (2001) for the discussion of green innovation on
employment at the economy-level). However, it also makes sense to go down to the
micro-level. After all, the change starts from individual firms. The remaining of the
paper focuses only on firm-level effect.
Comparing with evidence of the impact of technological progress on labor
demand at firm level, a basic distinction is drawn between product and process
innovation. Both kinds of innovation can be associated with compensation effects (or
employment stimulating effects) and displacement effects (or labor-saving effects)
which reduce employment. (see Table 1, Harrison et al. (2008) and Dachs and Peters
(2014) for further detail).

68
TABLE 1 Effects of product and process innovation on employment at firm level
Displacement effect Compensation effect Product innovation
Productivity effect: (-): New products require less (or more) labor input Indirect demand effect: (-): Decrease in demand of existing substitutes
Direct demand effect: (+): New products increase overall demand Indirect demand effect: (+): Increase in demand of existing complementary products
Process innovation
Productivity effect: (-): Less labor input for a given output
Price effect: (+): Cost reduction passed on to price expands demand
Source: Dachs & Peters, 2014
Existing studies differ widely in terms of modeling strategies and methods. A
study by Harrison et al. (2008) agrees with the already existing literature. Their results
illustrate a strong positive effect of product innovation on employment. Bogliacino and
Pianta (2010) distinguish between innovation’s technological and cost competitiveness.
They find that technological competitiveness has a significant positive effect on labor
inputs, while cost competitiveness has a negative impact. Lachenmaier and Rottman
(2011) find a positive effect on employment growth for both product and process
innovation, with process innovation having higher effect than product innovation.
Dachs and Peters (2014) show that foreign-owned firms experience higher job losses
than domestically-owned firms due to general productivity increases and process
innovation. At the same time, the impact of product innovation on employment is larger
for foreign-owned firms. In general, results show innovative firms clearly have higher
employment record (Dachs & Petersm 2014; Harrison et al., 2008; Lachenmaier &
Rottman, 2011).
The very few prior environmental innovation studies are in line with
conventional innovation literature. Positive effects of environmental-innovations on
employment are detected. Horbach and Rennings (2013) show that though
environmental product innovation does not trigger employment growth, green process
innovation leads to job creation, particularly for green process innovations that lead to
material and energy savings. Rennings et al. (2004) find that product environmental-
innovations have a positive effect on the probability of an employment increase.
Rennings and Zwick (2002) illustrate that environmental innovations have a small but
positive effect on employment. The shift from end-of-pipe technologies to cleaner
production creates jobs. Overall, there appears to be a positive relationship between
employment and environmental innovation.

69
Although firms might be doing the similar type of environmental innovation
because, say, they are located in the same region and are subject to the same set of
environmental regulations, their impact on employment may differ because of the ex
ante heterogeneity among them. Certain industries may be more likely than other
industries to increase employment, given that they do environmental innovations.
Specifically, we focus on one source of ex ante heterogeneity across firms, which is the
industry firms belong to. This is whether or not the firms belong to a so-called ‘dirty’ or
‘clean’ industry. We base our typology on not only the pollution level but also toxins as
according to the latest Toxic Release Inventory (TRI)’s annual report of 2011 and the
US Environmental Protection Agency (EPA). See Appendix A for further detail. This
typology is more appropriate to study environmental innovation than the usual
manufacturing versus service industries in the traditional innovation.
Firms in dirty industries are more scrutinized by the public as well as are subject
to stricter and more environmental regulations than firms in clean industries. As a result,
they may have stronger internal environmental orientation. Environmental innovations
for dirty firms may have a much substantial meaning than for clean firms. They may
analyze new product development for the whole life cycle rather than symbolically such
as the end-of-the-pipe technologies. For example, Dangelico and Pujani (2010) report
that one of the managers in their study from the wood industry emphasizes going
beyond ‘cradle to grave’ approach. He says that “the product development process in
our company is strictly focused on eco-design and therefore on life cycle thinking… for
the environmentally friendliness of our products, we use the necessary quantity of
materials without exceeding in the use, we reduce the environmental impact of
production process through the use of renewable energy and of water and energy
efficient machineries… we use only FSC or PEFC certified wood… we try to create a
network to obtain a short supply chain… products can be reused (with and without
repairing),… collected, dissembled and components recycled… Our product is different
from a ‘cradle to grave’ path because it follows a ‘cradle to cradle logic’” (P. 478).
Another manager from a chemical industry in Dangelico and Pujani (2010)’s study
points out that “regulations represent for us constraints but also caution for avoiding
risks of activity breakdown, money losses or damage to the company image” (P. 474).
He further adds that “the reduction of packaging materials and of environmental risk is
quantified and easily recognizable at the eyes of our main market, and so environmental
innovations in products and packaging gives added value to our company” (P. 476).

70
Taken together, by being in a dirty industry, firms may feel stronger need to
differentiate themselves more than clean firms in order to avoid being punished by the
public from not being green or to capture the opportunities in the green markets.
Furthermore, just the fact that these firms are in dirty industry, with the improved
environmental technologies, the public might feel like these firms provide substantial
change towards sustainability. This is as compared to clean industry where the public
probably does not notice, care, or feel firms’ environmental impact as much since the
existing level of environmental footprint may be small. The public may respond to
environmental innovation from dirty industry more positively. Subsequently, this new
green product development may result in higher potential and higher substantial impact
to market success and competitive advantage. We thus expect the effect of
environmental innovation on employment to be stronger than for clean industries. We
posit the hypothesis as follow:
H1: At firm-level, environmental innovators create more jobs than non-environmental innovators and non-innovators. This increase is greater for the so called ‘dirty industries’ than ‘clean industries’.
3.2.2 Voluntary versus compliance-driven environmental innovation
The green business literature usually makes a distinction between firms that
adopt a more proactive or voluntary stance, taking into account a variety of forces other
than government regulations, versus firms that are compliance-driven with a mere aim
to meet legal requirements (Buysse & Verbeke, 2003; Schot & Fischer, 1993). We
distinguish between the different types of environmental innovation, not only because
there exist different types of environmental innovation (Frondel, Horbach & Rennings,
2007; Kemp & Pearson, 2007; Rennings et al., 2004), but also the expected outcomes
on employment are different (Horbach & Rennings, 2013). Consequently, we combine
Renning’s (2000) technology-push and market-pull factors together and call it
‘voluntary’, or we can also think of it as ‘proactive’. The rationale behind is that firm’s
decision whether or not to develop environmental innovation is voluntary. The decision
is not forced upon by law. While for regulatory-push factor, we call it ‘compliance-
driven environmental innovation’. In this case, firms develop environmental innovation
to conform to legal requirements.

71
Theoretically and empirically, proactive corporate environmental strategies that
go beyond compliance with environmental regulations are found to be associated with
improved financial performance (Klassen & McLaughlin, 1996; Klassen & Whybark,
1999; Russo & Fouts, 1997) and competitive advantage (Aragón-Correa & Sharma,
2003). The literature also shows that there is a market for green products (Dangelico &
Pujari, 2010; OECD, 2013). Dangelico and Pujari (2010) state that “the size of green
markets is increasing and is likely to get bigger in the future” (p. 473). Green innovation
indeed seems to have potential in leading firms to achieve growth.
Prior empirical evidence agrees with the above arguments. When the goal
behind developing environmental innovation is driven by market share or to respond to
competitors’ actions, there is a positive effect on the probability of an employment
change (Rennings et al., 2004). Moreover, environmental innovation that leads to
material and energy savings induce cost savings which lead to higher competitiveness
of firm, and subsequently, higher employment (Horbach & Rennings, 2013). As such,
no matter the goal of environmental innovation is to increase market share, to improve
the image, or to save costs, once it is a voluntary and proactive, we expect a positive
impact on employment.
In contrast, some researchers argue that increased environmental regulations
could lead to higher costs, unproductive investments or even a possible loss of
competitive advantage (Walley & Whitehead, 1994). Firms’ response to regulations
may become very expensive when faced with rapidly evolving and increasingly
complex and severe environmental regulations (Berry & Rondinelli, 1998). Others, such
as Porter and van der Linde (1995) argue that stringent environmental regulations
provide firms with opportunities for improved efficiency. It appears the effect on
employment due to environmental regulations can go in both directions.
Horbach and Rennings (2013) illustrate that when environmental-innovation is
driven by regulations, there is no significant increase in employment. Stringency of
environmental policies is known to lead to more end-of-the-pipe type technologies
(Aragón-Correa & Sharma, 2003; Frondel et al., 2007; Hart, 1995). Rennings et al.
(2004) show that the effect of end-of-the-pipe technologies on employment is negative.
At the same time, Rennings et al. (2004) also show that environmental regulations in
order to induce environmental innovation have both positive and negative influence on
employment. As such, we expect compliance-driven to result in a lower level of
72
employment increase as compared to voluntary-driven environmental innovation. We
postulate the hypothesis as follows.
H2: Environmental innovators that develop environmental innovation voluntarily create more jobs than environmental innovators that develop environmental innovation due to compliance with environmental regulations.
3.3 Methodology
Data
The sample of firms for this study is drawn from the Spanish Technological
Innovation Panel (PITEC) survey2. It is carried out yearly by the Spanish National
Statistics Institute (INE) in collaboration with the Spanish Science and Technology
Foundation (FECYT) and the Foundation for Technological Innovation (COTEC). Most
questions in the questionnaire are related to firms’ innovation behavior in the preceding
two years.
The use of PITEC survey provides several advantages. First, PITEC is a large-
scale survey that offers the opportunity to study environmental innovation. Second,
PITEC is based on the Community Innovation Survey (CIS) framework, one of the
most used datasets for analyzing innovation (Laursen & Salter, 2004, 2006). Thus,
PITEC is a valid tool in studying innovation and offers direct comparisons of this work
with other works based on CIS.
At present, PITEC sample contains over 13,000 firms. The degree of
representativeness of the population depends on firm size. The dataset is representative
of the population for firms with more than 200 employees. However, the
representativeness of firms with less than 200 employees is biased towards firms having
external and/or internal R&D.
We combine PITEC survey of year 2011 together with PITEC surveys of 2007-
2010, with 2011 as the latest available dataset. This helps to reduce the potential
problem of common method variance (Podsakoff & Organ, 1986) and reverse causality
(Wooldridge, 2013). Nonetheless, we perform Harman’s one-factor test to check for
2 The dataset, the questionnaire and the description of each variable is available free of charge at the website http://icono.fecyt.es/PITEC/Paginas/por_que.aspx

73
potential common method variance. The results from unrotated principal component
analysis with and without varimax rotation performed on all variables suggest no
potential problem of common method variance. No single factor emerges and no factor
accounts for a majority of variance (with 21.60% for the first factor).
We screen PITEC dataset three times in selecting firms. First, only those firms
that exist from the period of 2007-2011 are selected due to the changing nature of the
sample. Second, we drop petroleum industry as there are only two observations. Last,
we drop observations for which we cannot compute employment, environmental
innovation and other essential information due to incomplete data. After applying these
screens to the population, we end up with 5,137 firms for our study sample, without
missing values.
Econometric model
According to the literature, a model based on a static estimation equation that
uses cross-sectional data leads to problems. The high costs of hiring and firing,
especially in European economies, are well-known arguments as to why there is a time
lag between implementation of innovation and its effect on employment adjustments
(Lachenmaier & Rottman, 2011). Other relevant studies also allow for an adjustment
process by including lagged values of innovation (van Reenen, 1997). These authors
test the relationship based on a panel data.
However, the changes in the questions in PITEC questionnaire pose challenges
for inter-temporal analysis. Additionally, data on environmental innovation and other
essential variables are available in a block of 2-year period. We thus base the
construction of our econometric regression by adapting from Harrison et al. (2008)’s
model and combine it with Lachenmaier and Rottman (2011). We assume the two-stage
decision process in employment as in Konig et al., (1995) and Rennings et al., (2004),
where firms first decide to invest in environmental innovation, and then decide to
increase or decrease volume of labor input at a second stage. Our study focuses only on
firms’ second-stage employment decision. We do not consider why and how firms
innovate and grow. We perform OLS with robust standard errors to account for
heterogeneity and lack of normality. We regress log of employment level of firm i at
time t on environmental innovation at time t-1 that is referred to environmental
innovation objectives in the last two years.

74
We perform additional robustness checks. We run our model with robust
regression to address potential outlier problem. We run generalized linear model (GLM)
to address the issue of heteroskedasticity. A different specification for our explanatory
variable is also used. Instead of a dummy, we perform a factor analysis on the four
environmental innovation objectives. We try adding controls to our model. For instance,
we try controlling for the supply situation in the industry that can have potential
influence on firms’ decision to employ more or less employees, using the average labor
cost per industry as provided INE’s annual labor cost surveys. Furthermore, we run
regressions with different specifications for our proxies for some control variables. The
results are consistent.
Dependent variable
The dependent variable, employment, is obtained from PITEC survey. The
dataset provides very detailed information on employment such as total employment,
total employment for internal R&D by occupation and by education level and whether
or not they are full-time. Unfortunately, PITEC data is anonymized to avoid disclosure
problems. We could not complement this dataset with external information.
Prior researchers (e.g., Harrison et al., 2008) use rate of employment growth as a
proxy to test if innovation stimulates employment. In our study, however, we follow the
approach of Lachenmaier and Rottman (2011) in using natural log of employees.
Employment tends to be quite stable over time, as compared to for instance growth in
sales. The use of our proxy is thus appropriate.
Figure 2 illustrates the trend of firm’s total employment and total R&D
personnel from 2007 to 2011. We can see that the trend in employment in Spain is
decreasing. This is not surprising considering the Spanish crisis, particularly in
employment. The number of R&D personnel also decreases but at a slower rate. Again,
the result is to be expected, given Spain’s overall decrease in expenditure on innovation,
with the annual growth rate of -8.8% from 2010 to 2011 (INE, 2013b).

75
We further break down the data into three types of firms to examine any
differences. In this dataset, about 65.51% of firms are innovators. They are identified by
their answer to the question regarding whether or not they have introduced innovation in
the previous two years. Among these innovators, 73.40% are environmental-innovators.
They are identified by their answers on the degree of importance paid to
environmentally-related innovation objectives. It might seem that the number of green
innovators in Spain is high in our sample. However, when we consider the fact that
Spanish firms regard environmental issues highly, it is not surprising. Spain is the first
country in Europe and the third in the world with 16,433 ISO14001 certificates. The
number of eco-management and audit scheme (EMAS) certified organizations is as well
very high, with 1,235 certified workplaces (Sorli & Zambrano, 2011).
In Figure 3, we show total employment for environmental-innovators, non-
environmental innovators and non-innovators. Environmental-innovators were less
affected by the Spanish crisis, with smaller rate of decrease from 2007 leading to 2009.
They performed better than the other two types of firms in terms of employment, with
an increasing trend from 2009 to 2011. Non-environmental-innovators were affected
severely by the crisis, with the sharp decrease in employment. However, non-
environmental-innovators performed better in terms of employment as compared to
non-innovators, with an increasing trend from 2010 to 2011.
10.50
11.00
11.50
12.00
12.50
13.00
13.50
270.00
275.00
280.00
285.00
290.00
295.00
300.00
2007 2008 2009 2010 2011
Num
ber
of e
mpl
oyee
s (m
ean)
FIGURE 2 Total employees and total R&D personnel
Total employees
Total R&D personnel

76
Explanatory variable
Our independent variable, environmental innovation, is based on a self-report
data on the objectives of innovation firm introduced in the last two years. In many
previous studies, environmental innovation has been commonly measured using
questionnaire surveys (Anton et al., 2004; Christmann, 2000). Kemp and Pearson
(2007) also suggest using a self-reported input-oriented data rather than using the
extensively employed measures of environmental investments (inputs) or environmental
patents (outputs) (Nameroff, Garant, & Albert, 2004). Both environmental R&D
expenditures and environmental patents pose problems (Toshi et al., 2007). Drawing
exact boundaries between different investment objectives is by no means
straightforward (Grupp, 1998). Environmental R&D expenditures can be used to show
how much is spent on equipment and processes that will result in environmentally-
products and processes, but we do not know if they are spent on new to the market
innovations or old standardized ones (Lázaro, Dorronsoro, Casas, Rodríguez & Sedano,
2008). R&D, in general, captures only parts of innovation. It is usually more important
for high-tech products but less so for other types of innovation or in small firms (Kemp
& Pearson, 2007). Particularly, roughly 70% of our sample is SMEs firms. Furthermore,
the patent classification system has not yet provided specific categories for
environmental patents. There is still no widely accepted agreement in the literature as to
what constitutes environmental technology. Green patent identification is based solely
on researchers’ judgments and understandings (Kemp & Pearson, 2007) and eco-patents
mainly measure identifiable inventions that are mostly end-of-the-pipe technologies or
150
200
250
300
350
2007 2008 2009 2010 2011
Num
ber
of e
mpl
oyee
s (m
ean)
FIGURE 3 Total employees and total R&D personnel by types of firms
Total employees : Eco-innovators
Total employees : Non-eco-innovators
Total employees : Non-innovators

77
green product innovations (Arundel & Kemp, 2009; Kemp & Pearson, 2007). Many
innovations that take the form of changes in production processes such as ‘clean
production’ are harder to identify and patent. Therefore, not all environmental
innovations are patented. In addition, patenting activity in Spain, including eco-
patenting is low. Spain has one of the lowest ratios of patents per million habitants in
Europe according to the European patent office (Sorli & Zambrano, 2011). As such,
these proxies could lead to over- or under-estimation of innovation (De Marchi, 2012);
we can argue that the use of objective, as in our study, is not inferior to other proxies of
environmental innovation.
PITEC provides information on the degree of importance of the following firm’s
innovation objectives: 1) using less material; (2) using less energy; (3) lower impact on
the environment; and (4) complying with the requirements on environment. The degree
of importance for each objective is based on a Likert scale of 1 (very important) to 4
(null). We reverse the scale into 1 (null) and 4 (very important) for ease of
understanding. We follow the approach of Kunapatarawong and Martinez-Ros (2014)
when constructing environmental innovation. We first assign binary values for each
objective. A response of 4 (very important) or 3 (important) receive a binary value of 1,
where responses of 2 (some importance) and 1 (null) receive a binary value of 0. We
then aggregate these answers and rescale the total score into 0 and 1, with firms having
0s across all four objectives as 0, and 1 otherwise.
From the data, firms are increasingly paying more attention to environmental
innovation, with year 2010 showing higher average of importance paid to all
environmental innovation objectives than 2008. On average, firms pay more importance
on decreasing environmental impact and to comply with environmental and health
regulations than on reducing material and energy usage per unit of production input.
Figure 4 illustrates the means of the degree of importance paid to each
environmental objective when firms innovate by size and industry. On average, dirty
industries and larger firms are more concerned with environmental innovation than
clean industries or smaller firms. In PITEC, the industry is classified according to the
Spanish National Activities Classification, CNAE2009. We distinguish dirty from clean
industries based on not only the pollution level but also toxins as according to the latest
Toxic Release Inventory (TRI)’s annual report of 2011 and the US Environmental
Protection Agency (EPA). See Appendix A for further detail. We perform both t-test
and Wilcoxo-Mann-Whitney test (not reported here) to test for the mean differences

2
2.2
2.4
2.6
2.8

79
survey that reports the average annual earnings per worker per industry. As well, we
control for market characteristic by including sales growth per industry. The
information on prices is unavailable at firm level. To deal as best we can, we deflate
growth in nominal sales with consumer price index as reported by INE. Different
industries are subject to different market and economic contexts (Lachenmaier &
Rottman, 2011). We can expect that this results in the differences in workers’ structure
and demand among industries. We include forty-two industry dummies as according to
CNAE2009.
3.4 Results
Table 2 reports correlation coefficients. The untransformed value for
employment averages 282 employees, with the maximum value of 38,619 employees.
Examination of the correlations indicates that organization’s environmental innovation
is positively related with firm’s employment. Specifically, green innovation is
correlated significantly with firms having received subsidies from autonomous
community and at the national level (r = 0.08, p < .05; r = 0.10, p < .05). As well, firms
having received national-level subsidies (r = 0.12, p < .05) or subsidies from the
European Union (r = 0.04, p < .05) correlate positively with employment. Average
wage by industry also correlates positively with employment (r = 0.13, p < .05). The
correlations indicate low probability of multicollinearity problem. Nonetheless, we
further verify using Collin command in Stata. The variance inflation factors (VIFs) are
in the range of 1-2.29 with the mean of 1.37, indicating no evidence of
multicollinearity.

80
TABLE 2 Correlation Coefficients
1 2 3 4 5 6 7 8 9 10 1. Employment 1 2. Green innovation 0.11* 1 3. Listed firms 0.15* -0.04* 1 4. Private firms -0.08* 0.01 -0.72* 1 5. Institutes -0.04* 0.03* -0.02 -0.67* 1 6. Autonomous community subsidies
-0.01 0.08* 0.03* -0.14* 0.17* 1
7. National subsidies 0.12* 0.10* 0.01 -0.10* 0.13* 0.27* 1 8. EU subsidies 0.04* 0.02 0.10* -0.25* 0.25* 0.24* 0.26* 1 9. Industry wage 0.13* 0.01 0.10* -0.02 -0.08* -0.03* -0.03* -0.04* 1 10. Industry sales growth (deflated) -0.01 0.02 -0.01 0.01 0.01 -0.01 0.02 0.03 -0.01 1 Mean 4.10 0.71 0.03 0.95 0.02 0.28 0.30 0.07 24751.59 0.03 s.d. 1.55 0.45 0.15 0.21 0.14 0.45 0.46 0.26 3971.96 0.66 Minimum 0 0 0 0 0 0 0 0 14629.55 -1.02 Maximum 10.56 1 1 1 1 1 1 1 48803.35 29.18 *p < .05

81
Table 3 reports results for hypotheses 1-2. Column (I) reports the results of the
full model on the effect of environmental innovation in 2010 on employment in 2011.
Column (II) reports the results with the interaction effect. The results support hypothesis
1. We find the increase of employment for environmental innovators and the effect is
stronger for firms in dirty industries. The signs of most of the control variables are as
expected. Listed firms are positively related with employment while private firms are
negatively related. The relationship between employment and firms that have received
subsidies from the Spanish government (national level) and the EU in the previous two
years are positive. For manufacturing industry, firms in food, beverage and tobacco,
paper and graphic arts, rubber and plastic products, metallurgy, motor vehicles
experience an increase in employment. For service industry, the industries that create
jobs are construction, wholesale and retail, transportation and warehousing.
In Column (III) of Table 3, we distinguish between voluntary and compliance-
driven environmental innovation, testing hypothesis 2. We aggregate the answers for (1)
reducing material; (2) reducing energy; and (3) lower environmental impact together
and rescale the total score into 0s and 1s. We then use this score as a proxy for
environmental innovation of voluntary type as these actions are completely voluntary.
For compliance-driven environmental innovation, we use the same method to rescale a
Likert scale of 1-4 (null to very important) into binary values. Firms reporting that they
innovate in order to comply with environmental requirements receive a value of 1, and 0
otherwise. For Column (III), we perform the test on the equality of the two coefficients.
The results show that the two coefficients are the same. Hypothesis 2 is not supported.

82
TABLE 3 Regression results for environmental innovation
(I) Full
model: 2011
(II) Full model: 2011
(III) Voluntary vs compliance
driven
(IV) Full model: 2009
(V) Positive change in green innovation
Green innovation 0.2400** 0.1950** 0 .1388** Dirty industry 0.1768** Green innovation*dirty
0.2093**
Voluntary 0.2056** Compliance 0.1129* Change in green innovation
0.1696**
Constant 1.2032 2.2795** 1.1494 1.5768 1.0681 Controls: Listed 0.8543** 1.7656** 0.8649** 0 .0451 0.8325** Private -0.3461* 0.3191* -0.3339* -0.6402** -0.3589* Autonomous community subsidies
-0.0298** -0.1385** -0.0363 -0.2024** -0.0149
National subsidies 0.5565** 0.4279** 0.5521** 0.4687** 0.5741** EU subsidies 0.3138** 0.1611 0.3087** 0.5741** 0.3071** Industry wage 0.0001* 0.0001** 0.0001* 0.0001* 0.0001* Industry sales growth (deflated)
0.0124 -0.0238 0.0131 -0.0187* 0 .0172
Industry Yes Yes Yes Yes N 5,137 5,137 5,137 5,137 5,137 R2 21.59% 7.62% 21.84% 21.43% 21.38% F 25.87** 35.32** 25.73** 25.18** 25.67** *p < .05, **p < .01
We report additional results in Column (IV) and (V) of Table 3. Column (IV)
investigates the impact of environmental innovation in 2008 on employment in 2009.
Employment is consistently higher for environmental innovators than for non-
environmental innovators in the period leading to the Spanish crisis. In Column (V),
firms that report an increase or a constant degree of importance paid to environmental
innovation from one period to another receive a value of 1, and 0 if firms report a
decrease in the degree of importance. Instead of regressing employment in 2011 on
environmental innovation in 2010, we regress employment in 2011 on the change in
environmental innovation from 2006-2008 to 2008-2010. We are aware that firms’
priorities might have changed over the years. It is one of the limitations of our model
that we cannot address. The results show a positive and significant relationship between
employment and firms that report an increase or at least no change in the degree of
importance paid to environmental innovation.

83
3.5 Discussions
Our results show that environmental innovators increase employment more than
non-environmental innovators and non-innovators, and the effect is stronger for dirty
industries. Our results are consistent with previous studies (Horbach & Rennings, 2013;
Rennings et al., 2004; Rennings & Zwick, 2002). It appears that market do reward
firm’s environmentally innovative behavior because environmental innovators seem to
be better off than non-innovators or non-environmental-innovators if we judge it from
the fact that these firms still expand and employ more people both before and during the
crisis. Subsequently, such rewarding behavior goes back to the society in the form of
increased employment.
Merely because of the fact that the firm is in a dirty industry, the idea for new
environmental innovation may come more from firm’s internal sensitive to
environmental issues rather than from having to comply with regulations or customers’
requirements in terms of environmental issues. This would make their strategies more
proactive rather than reactive. Prior literature shows that proactive environmental
strategies are associated with improved firm’s financial performance (Klassen &
McLaughlin, 1996; Klassen & Whybark, 1999; Russo & Fouts, 1997) and competitive
advantage (Aragón-Correa & Sharma, 2003). Likewise, for whichever reasons, top
management may be more personally committed to sustainability, thus helping to drive
environmental innovation that may have substantial environmental impact and stronger
economic impact. Similarly, these firms may have a clearer and a better specified plan
to deal with environmental innovation than say cleaner industries that are less subject to
scrutiny and environmental regulations. These plans are likely to be put in place as a
result of a thorough study of the product-life cycle analysis, resulting in many
advantages such as optimization in energy costs and packaging, logistical advantages,
reduction in material consumption, lower risks for health and safety of consumers as
well as employees, etc. After all, green markets do exist and is likely to get much bigger
in the future (Dangelico & Pujari, 2010; OECD, 2013). In sum, these are likely to result
in an increase in firm performance and consequently labor input.
From a macroeconomic background in Spain, the time period from 2007-2011
was characterized by an economic crisis and high unemployment rate that was at 21.6%
in 2011, the highest in EU-27 (INE, 2012). Our results hence have serious policy
implications. More efforts to promote and provide incentives towards green growth at

84
national- and autonomous community-level should be made in order to improve the
overall Spanish framework regarding environmental technological competencies and
consequences. After all, Spain aims to use environmental innovation to help boost
economic growth (Barranco, 2013). Our results provide valuable evidence that Spain is
heading in the right direction in terms of using green growth to boost growth.
Further, our study reveals that no matter firms develop environmental innovation
merely in response to environmental regulations or they voluntarily develop
environmental innovation, these environmental innovators create jobs. Though both
cost-savings from managing resources efficiently and cost-increase from having to
comply with regulations might lead to a decrease in employment, it seems
environmental regulations can still become an opportunity for new business creation
(Dangelico & Pujari, 2010), thus, job creation. Our results are consistent with Porter
Hypothesis that environmental regulations provide firms with opportunities for
improved efficiency; therefore, an increase in employment. It seems ‘the end justifies
the means’.
Care should be taken when interpreting this result. A myriad of environmental
instruments on environmental innovation exist. With our proxy for compliance-driven
environmental innovation, we cannot make distinction between command and control
type or market-based regulations. End-of-the pipe technologies fall under the first
category. Tradable emissions, environmental certificates or environmental taxes fall
under the latter category (van Leeuwen & Mohnen, 2013). We cannot conclude that
command and control type regulation is more effective than market-based regulation or
vice versa. In addition, prior literature asserts that what determines the impact on the
change in employment depends on the level of stringency and concreteness of
environmental measures (Rennings et al., 2004). We cannot tell at which level of policy
stringency triggers positive impact on employment through environmental technology
developments.
Empirical work on environmental innovation-employment relationship can be
influenced by a wealth of different factors. This work presents us with limitations.
First, PITEC dataset is not built specifically to assess environmental innovation.
It limits our approach to measuring environmental innovation from innovation
objectives with environmental concerns. We cannot tell the actual outputs or economic
values from innovation objectives. We also cannot determine when or whether the
objectives get turned into actual environmental-friendly technologies. Too, responses to

85
questionnaires can by seriously biased as respondents tend to present a socially
responsible image of themselves or their firms (Berrone et al., 2013).
Second, our measure of environmental innovation is an all-encompassing
construct. We could only distinguish voluntary from compliance-driven environmental
innovation. We could not decompose our measure into more types of environmental
innovation that exist.
Third, we only provide firm-level analysis on employment and environmental
innovation. To draw implications for aggregate level from this study, caveats should be
taken into consideration.
Fourth, we consider only the total level of employment. We do not consider its
composition in terms of skills or types of worker. The demand for skilled labor might be
higher than for unskilled labor, or even a decrease in a demand for unskilled labor in
some cases. Our study could not address the possibility that environmental innovators
lead to more or less employment of skilled or unskilled workers.
Future research could use other measures to help improve the analysis on the
topic. Costs and benefits of environmental innovation vary and are probably correlated
with employment changes incurred by them. The use of other measures of
environmental innovation that incorporate costs and benefits factor into the measure
would help to improve the analysis. An alternative measure can be sales or revenue
growth due to environmental innovations. Another option can be environmental patent
or the number of new environmental products or processes (Kemp & Pearson, 2007). In
this manner, we would be able to estimate gross effect of environmental output on
employment.
In addition, as we cannot supplement our analysis with external data due to
confidentiality nature of PITEC dataset, we think it is important for future research to
include information on environmental-related performance. For instance, the analysis
could be improved by including a control for firms’ environmental performance such as
whether or not a firm is ISO14001 certified, EMAS registered, or the like. Firm’s
previous environmental performance or previous environmental crises might be a factor
causing firms to be more or less attractive among employees. Prior literature shows that
firms’ corporate social performance (which includes environmental performance) is
positively related to their reputations and attractiveness as employers (Turban &
Greening, 1997).

86
The effect of environmental innovation on employment at the aggregate level is
of great value for future research. As we do not consider why and how firms innovate
and grow, future research on firm-level employment growth should be complemented
with other firms’ economic or regulatory situations or other organizational factors. For
instance, the size of environmental innovation, the information on government policies
influencing employment, bursts in capacity utilization and labor, or temporary
organizational problems would help to improve the model (Harrison et al., 2008).
Moreover, autonomous regions in Spain present considerable differences in their
physical, social and economic conditions as well as in terms of environmental policies
and public financing received (INE, 2012; OECD, 2004). A regional-level control
should be taken into consideration. For future research at the aggregate level, as we do
not observe the effect of firm entering or exiting in our sample, a full analysis
incorporating entry, exit and competition between rival firms would be fruitful. Firm
entry and exit are an important source impacting growth or decline in employment
(Harrison et al., 2008).
Lastly, a great contribution that future research should attempt is to not only
distinguish between green product and process innovation, but also to further subdivide.
It would also be interesting to conduct comparable studies, especially comparing
countries that are considered to be in an environmental innovation-rich context versus
countries that are less developed in terms of being green. A comparable study on
entirely different institutional, economical and environmental contexts would help to
explain whether or not the structural effects play a large role in influencing firms to go
‘green’ or even more importantly to be sustainable. Such comparable study has both
direct policy implications as well as indirect benefits on green consumerism and
sustainable literature.
3.6 Conclusion
We can establish ‘the existence’ of a positive relation between variables
proxying environmental innovation and employment at firm-level. For a variety of
reasons, relatively little work has been completed, both theoretically and empirically, on
the changes in employment as a result of environmental innovation. Results at the firm-
level are still ambiguous and views about the impacts are highly controversial
(Rennings et al., 2004). The novelty of our study is that, to our knowledge, this is one of
87
the very few statistical studies assessing the impact of environmental innovation on
employment at the firm-level.
We base our study on PITEC dataset. The increasing relevance of environmental
issues for the Spanish economy, its unemployment problem and the uniqueness of the
Spanish innovation structure (De Marchi, 2012) make it a proper and interesting context
to investigate environmental innovation dynamics. Our estimation results on more than
five thousand firms show the increase of employment for environmental innovators, as
compared to non-environmental innovators and non-innovators, both before and during
the Spanish crisis that started in 2009. The increase in employment is higher for dirty
industries. Our results show that no matter firms introduce environmental innovation
voluntarily or merely to comply with regulations, they create jobs. In addition, our
results show a positive and significant relationship between employment and firms that
report an increase or at least no change in the degree of importance paid to
environmental innovation. This study hopes to provide not only a clearer understanding
of the impact of environmental innovation on employment at firm-level, but also policy
implications on the Spanish economy where it has and is still experiencing a severe
unemployment problem.

88
3.7 References
Anton, W.R.A., Deltas, G., & Khanna, M. 2004. Incentives for environmental self-regulation and implications for environmental performance. Journal of Environmental Economics and Management, 48(1): 632-654.
Aragón-Correa, J. A., & Sharma, S. 2003. A contingent resource-based view of proactive corporate environmental strategy. Academy of Management Review, 28(1): 71-88.
Arundel, A., & Kemp, R. 2009. Measuring eco-innovation. Working paper number 2009-017, UNU-Merit, Maastricht.
Barranco, J.S. 2013. Informe COTEC 2013. Fundación COTEC para la innovación tecnológica, Madrid.
Berrone, P., Fosfuri, A., Gelabert, L., Gomez-Mejia, L.R. 2013. Necessity as the mother of ‘green’ inventions: Institutional pressures and environmental innovations. Strategic Management Journal, 34: 891-909.
Berry, M.A., & Rondinelli, D.A. 1998. Proactive corporate environmental management: A new industrial revolution. Academy of Management Executive, 12(2): 35-50.
Bilbao-Osorio, B., Blanke, J., Crotti, R., Hanouz, M.D., Fidanza, B., Geiger, T., Ko, C., & Serin, C. 2012. Chapter 1.2: Assessing the sustainable competitiveness of nations: The global competitiveness report 2012-2013. World Economic Forum 2012.
Bogliacino, F., & Pianta, M. 2010. Innovation and employment: A reinvestigation using revised Pavitt classes. Research Policy, 39(6): 799-809.
Buysse, K., & Verbeke, A. 2003. Proactive environmental strategies: A stakeholder management perspective. Strategic Management Journal, 24(5): 453-470.
Christmann, P. 2000. Effects of ‘best practices’ of environmental management on cost advantage: the role of complementary assets. Academy of Management Journal, 43(4): 663-680.
Dachs, B., & Peters, B. 2014. Innovation, employment growth, and foreign ownership of firms: A European perspective. Research Policy, 43(1): 214-232.
Dangelico, R.M., & Pujari, D. 2010. Mainstreaming green product innovation: Why and how companies integrate environmental sustainability. Journal of Business Ethics, 95(3): 471-486.
De Marchi, V. 2012. Environmental innovation and R&D cooperation: Empirical evidence from Spanish manufacturing firms. Research Policy, 41(3): 614-623.
Easterling, D.R. et al. 2000. Climate extremes: Observations, modeling, and impacts. Science, 289(5487): 2068-2074.
Eco-innovation observatory (EIO). 2011. Eco-innovation scoreboard 2011.
Europe 2020. (2014). http://ec.europa.eu/europe2020/index_en.htm, Accessed: March 30, 2014.
Eurostat. 2013. Statistics: Science, technology and innovation. http://epp.eurostat.ec.europa.eu/portal/page/portal/science_technology_innovation/introduction, Accessed: December 1, 2013.

89
Frondel, M., Horbach, J., & Rennings, K. 2007. End-of-pipe or cleaner production? An empirical comparison of environmental innovation decisions across OECD countries. Business Strategy and the Environment, 16(8): 571-584.
Grupp, H. 1998. Foundations of the economics of innovation – Theory, measurement and practice. Cheltenham: Edward Elgar.
Harrison, R., Jaumandreu, J., Mairesse, J., & Peters, B. 2008. Does innovation stimulate employment? A firm-level analysis using comparable micro-data from four European countries. National Bureau of Economic Research. No. w14216.
Hart, S.L. 1995. A natural-resource-based view of the firm. Academy of Management Review, 20(4): 874-907.
Hemmelskamp, J. 1997. Environmental policy instruments and their effects on innovation. European Planning Studies, 5(2): 177-194.
Hollanders, H., & Es-Sadki, N. 2013. Innovation union scoreboard 2013. Maastricht Economic and Social Research Institute on Innovation and Technology, UNU-MERIT, Maastricht.
Horbach, J., & Rennings, K. 2013. Environmental innovation and employment dynamics in different technology fields – an analysis based on the German Community Innovation Survey 2009. Journal of Cleaner Production, 57: 158-165.
Instituto Nacional de Estadística (INE). 2010. España en cifras 2010. Instituto Nacional de Estadística (INE). 2011. España en cifras 2011. Instituto Nacional de Estadística (INE). 2012. España en cifras 2012. Instituto Nacional de Estadística (INE). 2013a. España en cifras 2013. Instituto Nacional de Estadística (INE). 2013b. Survey on industry expenditure on
environmental protection: 2011.
Jiménez Herrero, L.M., & Leiva, A. (Eds.) 2011. Green jobs in a sustainable economy: Executive summary. Fundación biodiversidad and Observatorio de la sostenibilidad en españa (OSE).
Johnstone, N., Hascic, I, & Ostertag, K. 2008. OECD studies on environmental innovation: Environmental policy, technological innovation and patents. Paris: OECD Publishing.
Kaiman, J. 2014. China’s toxic air pollution resembles nuclear winter, say scientists. The Guardian. http://www.theguardian.com/world/2014/feb/25/china-toxic-air-pollution-nuclear-winter-scientists. Accessed: March 10, 2014.
Kemp, R., & Pearson, P. 2007. Final report of the MEI project measuring eco-innovation. MEI Project number 044513. Deliverable 15.
Klassen, R.D., & McLaughlin, C.P. 1996. The impact of environmental management on firm performance. Management Science, 42(8): 1199-1214.
Klassen, R.D., & Whybark, D.C. 1999. The impact of environmental technologies on manufacturing performance. Academy of Management Journal, 42(6): 599-615.
Konig, H., Buscher, H., & Licht, G. 1995. Investment, employment and innovation. In Investment, productivity and innovation: 67-84. Paris: OECD.

90
Kunapatarawong, R., & Martinez-Ros, E. 2014. A resource pool for environmental innovation. Working paper 14-03. Universidad Carlos III de Madrid. Spain.
Lachenmaier, S. & Rottmann, H. 2011. Effects of innovation on employment: A dynamic panel analysis. International Journal of Industrial Organization, 29(2), 210-220.
Laursen, K., & Salter, A. 2004. Searching high and low: What types of firms use universities as a source of information? Research Policy, 33: 1201-1215.
Laursen, K., & Salter, A. 2006. Open for innovation: The role of openness in explaining innovation performance among UK manufacturing firms. Strategic management journal, 27: 131-150.
Lázaro, J.E., Dorronsoro, I.C., Casas, S.H., Rodríguez, D.G., & Sedano, J.A.G. 2008. Indirect measurement of eco-innovation based on company environmental performance data. MEI project workpackage 7. Deliverable D12.
LanzaTech. 2014. Who we are. http://www.lanzatech.com/content/who-we-are, Accessed: March 26, 2014.
Nameroff, T., Garant, R. & Albert, M. 2004. Adoption of green chemistry: An analysis based on US patents. Research Policy, 33: 959–974.
OECD. 2004. OECD environmental performance reviews: Spain 2004. Paris: OECD Publishing.
OECD. 2012. Chapter 10: Science and innovation: Spain. OECD science, technology and industry outlook 2012. Paris: OECD Publishing.
OECD. 2013. Greening household behavior: Overview from the 2011 survey. Paris: OECD Publishing.
Pacala, S., & Socolow, R. 2004. Stabilization wedges: Solving the climate problem for the next 50 years with current technologies. Science, 305(5686): 968-972.
Patz, J.A., Campbell-Lendrum, D., Holloway, T., & Foley, J.A. 2005. Impact of regional climate change on human health. Nature, 438(7066): 310-317.
Pfeiffer, F., & Rennings, K. 2001. Employment impacts of cleaner production – Evidence from a German study using case studies and surveys. Business Strategy and the Environment, 10(3): 161-175.
Podsakoff, P.M., & Organ, D.W. 1986. Self-reports in organizational research: Problems and prospects. Journal of Management, 12(4): 531-544.
Porter, M.E., & van der Linde, C. 1995. Green and competitive: Ending the stalemate. Harvard Business Review, 73(5): 120-134.
Rennings, K. 2000. Redefining innovation – eco-innovation research and the contribution from ecological economics. Ecological Economics, 32(2): 319-332.
Rennings, K., & Zwick, T. 2002. Employment impact of cleaner production on the firm level: Empirical evidence rom a survey in five European countries. International Journal of Innovation Management, 6(3): 319-342.
Rennings, K., Ziegler, A., & Zwick, T. 2004. The effect of environmental innovations on employment changes: An econometric analysis. Business Strategy and the Environment, 13(6): 374-387.

91
Russo, M.V., & Fouts, P.A. 1997. A resource-based perspective on corporate environmental performance and profitability. Academy of Management Journal, 40(3): 534-559.
Schot, J., & Fischer, K. 1993. Introduction: the greening of the industrial firm. In K. Fischer, J. Schot (Eds.), Environmental strategies for industry: 3-33. Washington D.C.: Island Press.
Sorli, M., & Zambrano L.G. 2011. Eco-innovation observatory in Spain: EIO country profile 2011. Eco-innovation observatory (EIO).
Tietze, F., Schiederig, T., & Herstatt, C. 2011. What is green innovation? A quantitative literature review. Paper presented at the XXII ISPIM Conference, Hamburg.
Tilley, A. 2013. Japanese giant Mitsui leads $60M investment in a startup that turns pollution into pure money. Forbes. http://www.forbes.com/sites/aarontilley/2014/03/26/japanese-giant-mitsui-leads-60m-investment-in-a-startup-that-turns-pollution-into-pure-money/, Accessed: March 26, 2014.
Toshi, H.A., Hibiki, A., & Johnstone, N. 2007. An empirical study of environmental R&D: What encourages facilities to be environmentally innovative? In N. Johnstone (Ed.), Environmental policy and corporate behavior: 142-173. Cornwall: MPG Books.
Turban, D.B., & Greening, D.W. 1997. Corporate social performance and organizational attractiveness to prospective employees. Academy of Management Journal, 40(3): 658-672.
van Leeuwen, G., & Mohnen, P.A. 2013. Revisiting the Porter hypothesis: An empirical analysis of green innovation for the Netherlands. Working paper number 2013-002, UNU-Merit, Maastricht.
van Reenen, J. 1997. Technological innovation and employment in a panel of British manufacturing firms. Journal of Labor Economics, 15(2): 255-284.
Walker, K., & Wan, F. 2012. The harm of symbolic actions and green-washing: Corporate actions and communications on environmental performance and their financial implications. Journal of Business Ethics, 109(2): 227-242.
Walley, N., & Whitehead, B. 1994. It’s not easy being green. Harvard Business Review, 72(3): 46-52.
Wooldridge, J.M. 2013. Introductory econometrics: A modern approach (5th international edition). Australia: South-Western.

92
3.8 Appendix A: Industry classification: Dirty and clean industries
Dirty Clean Agriculture, livestock, fishing Garment Extractive industries Other machinery Food, beverage and tobacco Other transport equipment Textile Miscellaneous manufacturing Leather Machinery repair Wood Commerce Pulp and paper Warehousing Printing Accommodation Chemicals Telecommunication Plastics Information technology Pharmacy Software development Non-metallic mineral products Finance and insurance Metallurgy Real estates Metal R&D Computers and electronics Other activities Electronics Administrative services Cars Education Shipbuilding Social services Airplanes Arts, recreations and entertainment Furniture Other services Energy and water Waste management Construction