three-phase contact line phenomena in droplets on solid
TRANSCRIPT

University of Central Florida University of Central Florida
STARS STARS
Electronic Theses and Dissertations, 2004-2019
2013
Three-phase Contact Line Phenomena In Droplets On Solid And Three-phase Contact Line Phenomena In Droplets On Solid And
Liquid Surfaces: Electrocapillary, Pinning, Wetting Line Velocity Liquid Surfaces: Electrocapillary, Pinning, Wetting Line Velocity
Effect, And Free Liquid Surface Deformation Effect, And Free Liquid Surface Deformation
Roxana Shabani University of Central Florida
Part of the Mechanical Engineering Commons
Find similar works at: https://stars.library.ucf.edu/etd
University of Central Florida Libraries http://library.ucf.edu
This Doctoral Dissertation (Open Access) is brought to you for free and open access by STARS. It has been accepted
for inclusion in Electronic Theses and Dissertations, 2004-2019 by an authorized administrator of STARS. For more
information, please contact [email protected].
STARS Citation STARS Citation Shabani, Roxana, "Three-phase Contact Line Phenomena In Droplets On Solid And Liquid Surfaces: Electrocapillary, Pinning, Wetting Line Velocity Effect, And Free Liquid Surface Deformation" (2013). Electronic Theses and Dissertations, 2004-2019. 2803. https://stars.library.ucf.edu/etd/2803

THREE-PHASE CONTACT LINE PHENOMENA IN DROPLETS ON
SOLID AND LIQUID SURFACES: ELECTROCAPILLARY, PINNING,
WETTING LINE VELOCITY EFFECT, AND FREE LIQUID SURFACE
DEFORMATION
by
ROXANA SHABANI
B.S. University of Tehran, 2007 M.Sc. University of Central Florida, 2011
A dissertation submitted in partial fulfillment of the requirements for the degree of Doctor of Philosophy
in the Department of Mechanical and Aerospace Engineering in the College of Engineering and Computer Science
at the University of Central Florida Orlando, Florida
Summer Term 2013
Major Professor: Hyoung Jin Cho

ii
© 2013 Roxana Shabani
iii
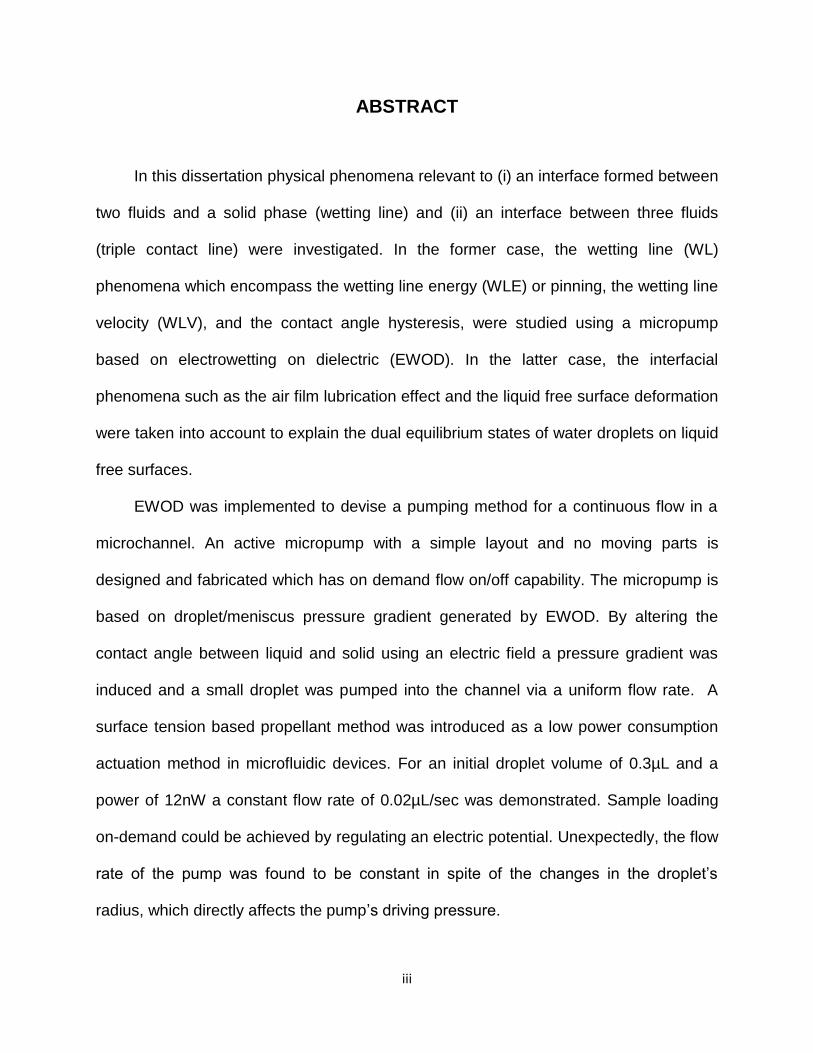
ABSTRACT
In this dissertation physical phenomena relevant to (i) an interface formed between
two fluids and a solid phase (wetting line) and (ii) an interface between three fluids
(triple contact line) were investigated. In the former case, the wetting line (WL)
phenomena which encompass the wetting line energy (WLE) or pinning, the wetting line
velocity (WLV), and the contact angle hysteresis, were studied using a micropump
based on electrowetting on dielectric (EWOD). In the latter case, the interfacial
phenomena such as the air film lubrication effect and the liquid free surface deformation
were taken into account to explain the dual equilibrium states of water droplets on liquid
free surfaces.
EWOD was implemented to devise a pumping method for a continuous flow in a
microchannel. An active micropump with a simple layout and no moving parts is
designed and fabricated which has on demand flow on/off capability. The micropump is
based on droplet/meniscus pressure gradient generated by EWOD. By altering the
contact angle between liquid and solid using an electric field a pressure gradient was
induced and a small droplet was pumped into the channel via a uniform flow rate. A
surface tension based propellant method was introduced as a low power consumption
actuation method in microfluidic devices. For an initial droplet volume of 0.3µL and a
power of 12nW a constant flow rate of 0.02µL/sec was demonstrated. Sample loading
on-demand could be achieved by regulating an electric potential. Unexpectedly, the flow
rate of the pump was found to be constant in spite of the changes in the droplet’s
radius, which directly affects the pump’s driving pressure.

iv
The WL phenomena were studied in details to unravel the physical concept behind
the micropump constant flow rate during the operation. An interesting observation was
that the shrinking input droplet changes its shape in two modes in time sequence: (i) in
the first mode its contact angle decreases while its wetting area remains constant due to
the pinning, (ii) in the second mode the droplet’s WL starts to move while its contact
angle changes as a function of its velocity. Contact angles were measured for the
droplet advancing and receding WLs at different velocities to capture a full picture of
contact angle behavior due to pinning and WLV effects. These results are also relevant
to the meniscus inside the channel. The changes on the contact angle caused by the
presence of EWOD at the bottom of the channel were studied in detail.
The EWOD based micropump was used as a platform to study the contribution of
the pinning and WLV effects on its constant flow rate. The effects of the WLE on the
static contact angle and the WLV on the dynamic contact angle in the pump operation
were investigated. Also the effect of EWOD voltage on the magnitude and uniformity of
the micropump flow rate was studied.
Dynamic contact angles (as a function of pinning and WLV) were used to
accurately calculate the pressure gradient between the droplet and the meniscus and
estimate the flow rate. It was shown that neglecting either of these effects not only
results in a considerable gap between the predicted and the measured flow rates but
also in an unphysical instability in the flow rate analysis. However, when the WLE and
WLV effects were fully taken into account, an excellent agreement between the
predicted and the measured flow rates was obtained.

v
For the study of the TCL between three fluids, aqueous droplets were formed at
oil-air interface and two stable configurations of (i) non-coalescent droplet and (ii)
cap/bead droplet were observed. General solutions for energy and force analysis were
obtained and were shown to be in good agreement with the experimental observations.
Further the energy barrier obtained for transition from configuration (i) to (ii), was
correlated to the droplet release height and the probability of non-coalescent droplet
formation. Droplets formed on the solid surfaces and on the free surface of immiscible
liquids have various applications in droplet-based microfluidic devices. This research
provides an insight into their formation and manipulation.

vi
To my husband, Farzad.

vii
ACKNOWLEDGMENTS
I would like to thank my supervisor and mentor, Prof. Hyoung Jin Cho for his
unwavering support and insightful guidance throughout my endeavor as a PhD
candidate, and for giving me numerous research opportunities that have allowed me to
achieve my goals as a researcher. His enthusiasm and hard work, and his honest
pursuit of scientific knowledge, have set a great example for me as a successful
scientist. I feel lucky to be among his students and I am hopeful that our scientific
collaborations will be continued in my entire professional carrier, in the same way that I
am confident our friendship will be lasting through my personal life.
I want to also thank my lab members, Dr. Ganashyam Londe, Dr. Peng Zhang, Dr.
Ehsan Yakhshi-Tafti, Dr, In-Sung Hwang, Dr. Sanghoon Park, Andrea Wesser, David
Summerlot, and H. M. Iftekhar Jaim for continuous scientific discussions and
collaborations and above all for their life lasting friendship. Thanks also to our
collaborators, Prof. Ranganathan Kumar and Prof. Jong-Hyun Ahn, for providing me
with their support and scientific insight.
Thanks also to my committee members Prof. Ranganathan Kumar, Prof. Jayanta
Kapat, Prof. Louis Chow, and Prof. Lei Zhai, for taking time to evaluate my work and for
their constructive comments and discussions.
Special thanks to my husband and my best friend Farzad, who has been a great
source of hope, joy and support, without whom this work would not have been
accomplished.
Some of the materials used in this dissertation are previously published by The
Royal Society of Chemistry, Elsevier, Springer and American Institute of Physics, in the
format of journal articles in which I have been the first author.

viii
TABLE OF CONTENTS
LIST OF FIGURES ........................................................................................................ x
LIST OF TABLES .......................................................................................................... xv
LIST OF ACRONYMS .................................................................................................. xvi
CHAPTER 1: INTRODUCTION ..................................................................................... 1
CHAPTER 2: EWOD BASED MICROPUMP ............................................................... 10
2.1 Introduction ....................................................................................................... 10
2.2 Materials, design and fabrication ...................................................................... 11
2.2.1 EWOD substrate ........................................................................................ 12
2.2.2 Soft lithography and bonding ...................................................................... 15
2.2.3 Microfluidic interconnections and electrical contacts .................................. 16
2.3 Micropump operation ........................................................................................ 16
2.3.1 Characterization of EWOD substrate ......................................................... 16
2.3.2 Working principle ........................................................................................ 20
2.3.3 EWOD microvalve ...................................................................................... 25
2.3.4 Input droplet wetting modes ....................................................................... 32
CHAPTER 3: DROPLETS ON SOLID SURFACES AND WETTING LINE .................. 35
3.1 Introduction ....................................................................................................... 35
3.2 Contact angle hysteresis ................................................................................... 35
3.3 Wetting line velocity effect ................................................................................ 39
3.4 EWOD effect on wetting line pinning ................................................................. 43
CHAPTER 4: DYNAMIC WETTING LINE EFFECT ON MICROPUMP ....................... 47
4.1 Introduction ....................................................................................................... 47
4.2 Micropump switch in operation.......................................................................... 47
4.3 Wetting line velocity effect on micropump ......................................................... 52
4.4 EWOD voltage effect on micropump flow rate .................................................. 53
ix
CHAPTER 5: MICROPUMP FLOW RATE ANALYSIS ................................................ 55
5.1 Introduction ....................................................................................................... 55
5.2 Experimental assumptions ................................................................................ 56
5.3 Derivation of governing equations..................................................................... 57
5.4 Model 1 based on wetting line energy and velocity effects ............................... 59
5.4.1 Droplet size effect ....................................................................................... 62
5.4.2 EWOD voltage effect .................................................................................. 63
5.5 Comparison with wetting line energy model and Young contact angle model .. 65
CHAPTER 6: DROPLETS ON LIQUID SURFACES AND TRIPLE CONTACT LINE ... 69
6.1 Introduction ....................................................................................................... 69
6.2 Stable configurations of floating droplets .......................................................... 69
6.2.1 Probability of formation of non-coalescent droplets versus Weber number 71
6.2.2 Non-coalescence of droplets due to thin film of air ..................................... 73
6.3 Energy analysis and prediction of stable equilibrium states .............................. 74
6.3.1 Calculation of liquid free surface profile ...................................................... 77
6.3.2 Droplet’s size effect on liquid surface deformation ..................................... 79
6.3.3 Force analysis ............................................................................................ 81
6.4 Estimation of energy barrier between dual equilibrium states ........................... 83
6.5 Non-dimensional analysis of liquid surface deformation ................................... 87
CHAPTER 7: CONCLUSIONS ..................................................................................... 89
REFERENCES .......................................................................................................... 106
LIST OF PUBLICATIONS .......................................................................................... 116

x
LIST OF FIGURES
Fig. 1 Electrowetting on dielectric (EWOD): a voltage is applied between the water
droplet and the conductor of the EWOD substrate. An electrical bi-layer is
formed which generates a fringing electric field at the interface of liquid-air
and solid surface. The electric force parallel component to the surface, FE,
pulls the liquid forward, reducing θD. The surface tension forces at the three-
phase interface are shown. .................................................................................... 3
Fig. 2 WLE and WLV effects on Young’s equilibrium droplet contact angle (a) A
droplet resting on a horizontal surface has a static θD (b) Droplet adjusts its
contact angles depending on the advancing or receding modes of WLs, θA
and θR respectively, as the surface is slightly tilted. Droplet resists motion and
its WL is pinned to the substrate (c) Droplet WL starts to move on the surface
as it is further tilted. θA and θR are further changed as a function of droplet WL
velocity, U. ............................................................................................................. 5
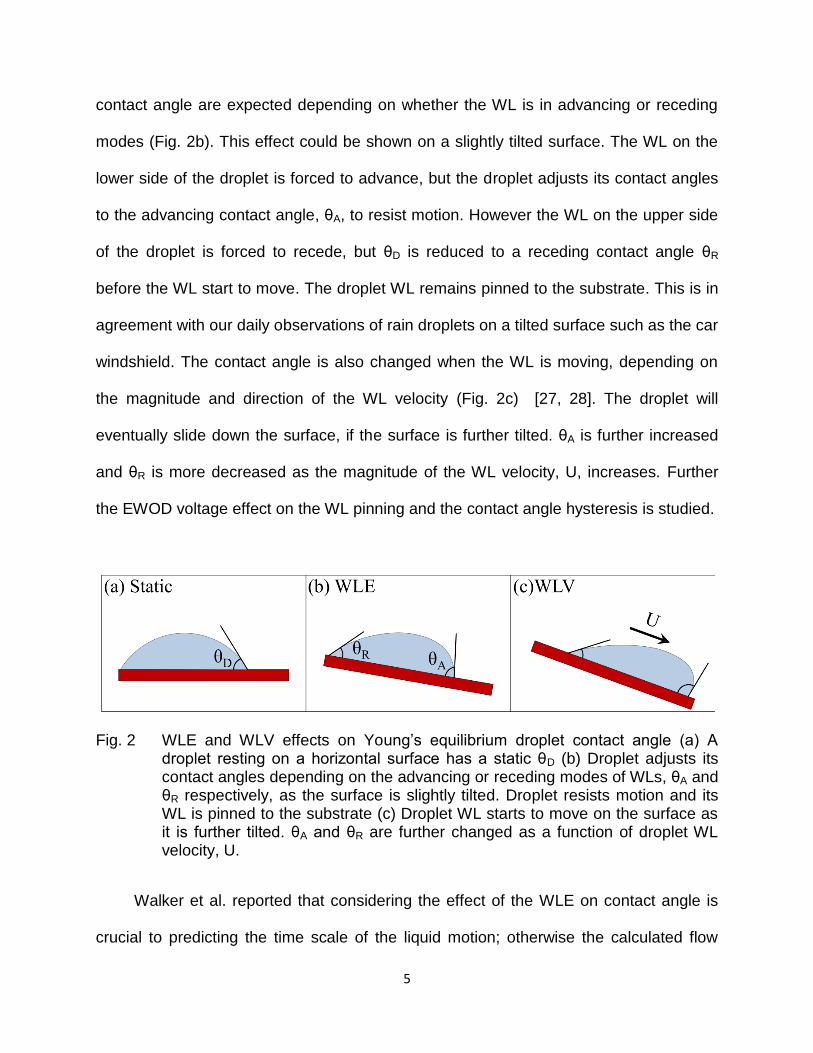
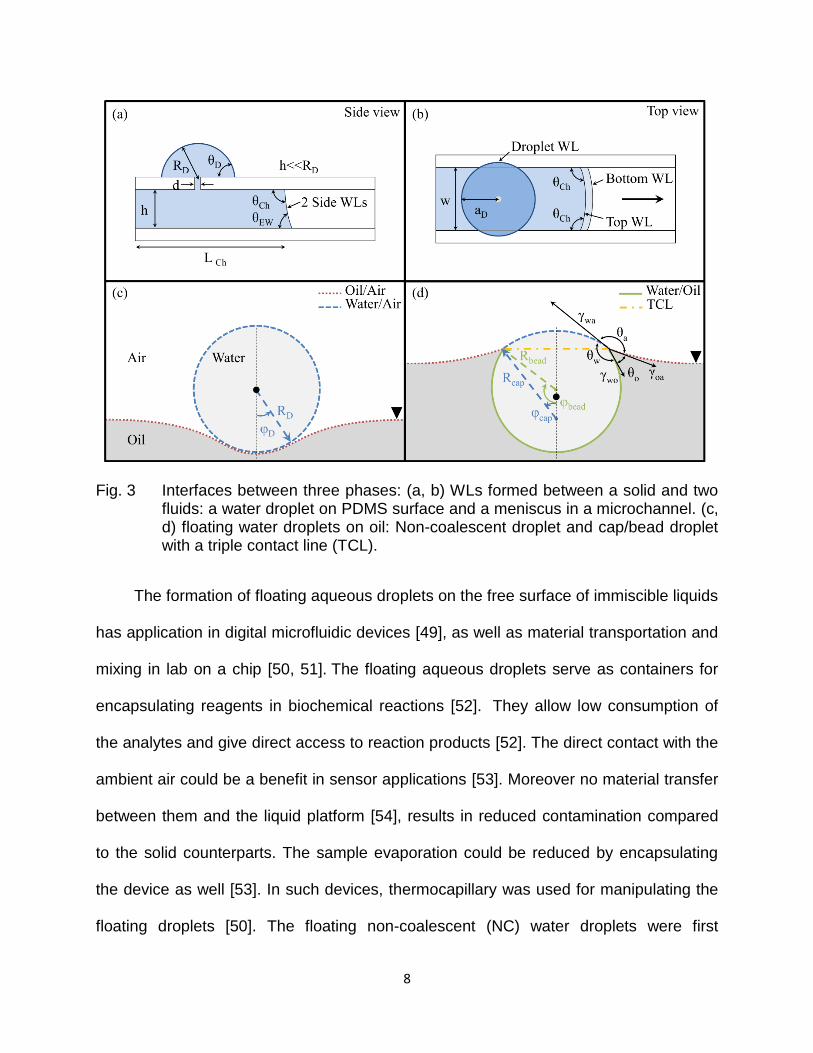
Fig. 3 Interfaces between three phases: (a, b) WLs formed between a solid and two
fluids: a water droplet on PDMS surface and a meniscus in a microchannel.
(c, d) floating water droplets on oil: Non-coalescent droplet and cap/bead
droplet with a triple contact line (TCL). .................................................................. 8
Fig. 4 Fabrication steps for the micropump: (a) Silicon wafer was used as the bottom
electrode. Diluted PDMS was spin-coated to mask the defects. A SOG film
was formed as an insulating layer (b) Diluted PDMS was spin-coated again to
form a thin hydrophobic film (c) A SU-8 mold was fabricated on a separate
silicon wafer using photolithography (d) A PDMS block was cast using the
SU-8 mold to form microchannels (e) PDMS slab was peeled off the modl and
liquid inlet, the air outlet and the drop formation hole were punched (f) PDMS
slab with microchannels was bonded to the PDMS film (g) Microfluidic
interconnection and the electrical contacts were made. ...................................... 14
Fig. 5 Droplet contact angle on EWOD substrate vs. voltage: the dash line is the
theoretical fit to the data. The hysteresis contact angle is shown as θmax, the
saturation contact angle is shown as θmin, and the onset voltage is shown as
Vonset. In the equation: A is a constant, c is the capacitance of the EWOD
substrate. ............................................................................................................. 17

xi
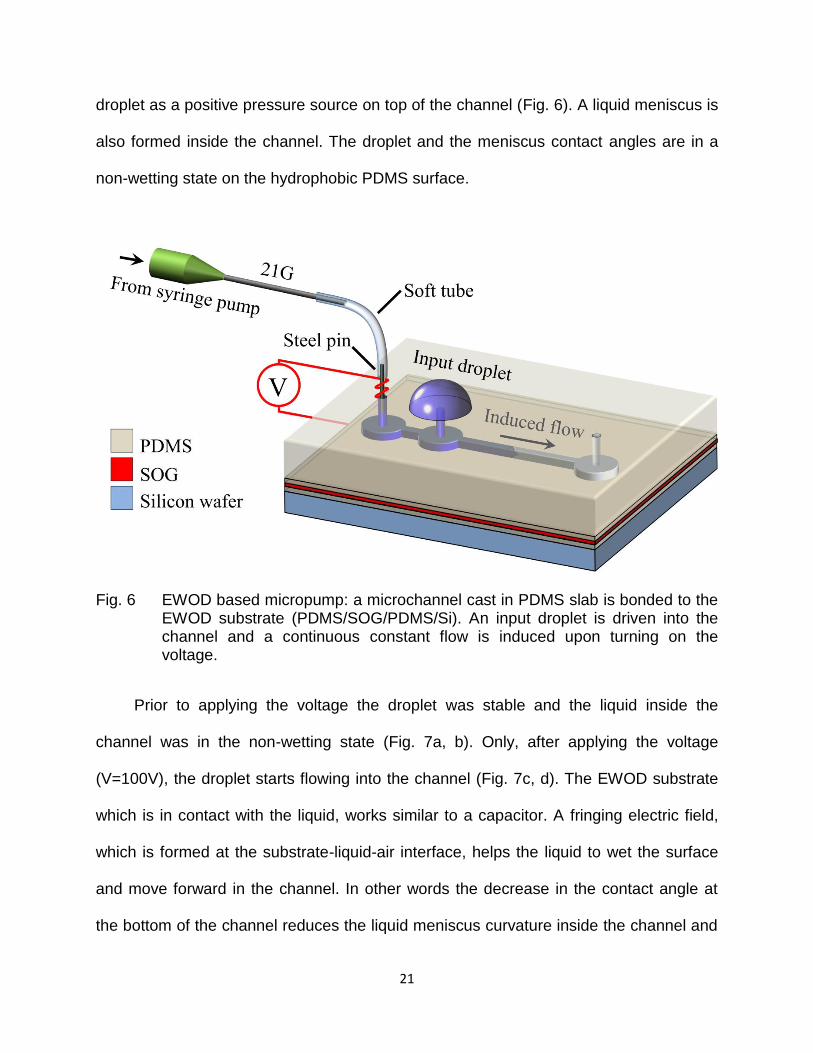
Fig. 6 EWOD based micropump: a microchannel cast in PDMS slab is bonded to
the EWOD substrate (PDMS/SOG/PDMS/Si). An input droplet is driven into
the channel and a continuous constant flow is induced upon turning on the
voltage. ................................................................................................................ 21
Fig. 7 The micropump in operation at 100 V (a) a slanted view of the input droplet
and the meniscus before applying voltage, (b) a magnification of the same
meniscus in a, observed from top, (c) a slanted view of the reduced input
droplet and the advanced meniscus in the channel after applying voltage (d)
the same meniscus in c, observed from top which shows the increased
wetting area. ........................................................................................................ 22
Fig. 8 The volumetric flow rate in the channel is shown as a function of (a) droplet
radius at a constant voltage of 100 V and (b) voltage for a similar droplet
radius of 0.5 mm. ................................................................................................. 23
Fig. 9 Analytical model physical parameters defined on (a) side view of the
micropump and (b) top view of the micropump. ................................................... 26
Fig. 10 Surface tension force exerted at the meniscus WL on the channel side wall
(a) top view of the channel with the width of w. Differential length of the WL
on the side wall is dL (b) side view of the channel with a height of h. .................. 27
Fig. 11 The outputs of MATLAB code showing the micropump pressure as a function
of voltage and droplet radius in a three dimensional representation. ................... 29
Fig. 12 (a) Voltage effect highlighted for RD= 5, 0.7 and 0.2 mm and demonstration of
switch in EWOD microvalve (b) droplet radius effect highlighted for V=0, 70
and 120V and presentation of on-demand pumping. ........................................... 31
Fig. 13 Droplet pumping phases in which RD is surface radius of curvature and aD is
droplet wetting radius (a) Stable droplet on top of the PDMS channel with an
initial contact angle, θD, of 86º prior to applying voltage (b) phase I: aD is
constant while θD decreases. (c) phase II: both aD and θD decrease. .................. 33
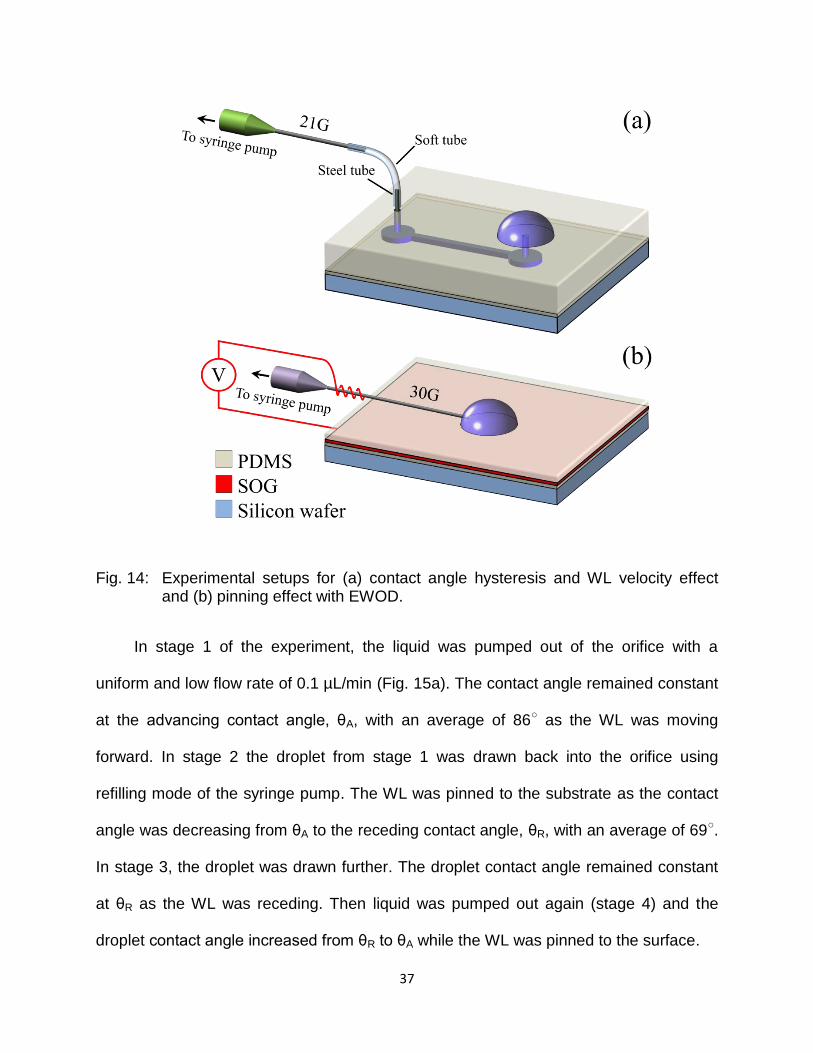
Fig. 14: Experimental setups for (a) contact angle hysteresis and WL velocity effect
and (b) pinning effect with EWOD. ....................................................................... 37
Fig. 15: Contact angle hysteresis and the mode switch (a) A droplet (on top of an
orifice formed in PDMS) with advancing (stage 1), receding (stage 3), and
pinned (stages 2 and 4) WLs when no voltage is applied. Droplet contact
angle, θD, decreases in stage 2 and increases in stage 4 due to pinning (b)
xii
Droplet contact angle versus its WL position, measured from the center of the
droplet. Contact angle hysteresis loops for 0V and 100V. ................................... 38
Fig. 16: WL velocity effect on the contact angle (a) A droplet is pumped out (stage A)
and drawn into (stages B and C) an orifice on PDMS surface. (b) Droplet’s
dynamic contact angle versus its WL velocity. The values of the droplet and
channel contact angles (for a pinned WL in Stage B), θD and θCh respectively,
are estimated and labeled.................................................................................... 41
Fig. 17 Dynamic contact angle in the channel, θCh, versus meniscus velocity. ................ 43
Fig. 18: WLE effect competing with EWOD (a) Droplet’s advancing and receding
contact angles decrease by increasing the voltage from 0V to 120V. Also the
difference between advancing and receding contact angles decreases at
higher voltages. (b) Advancing and receding contact angles at different
voltages (EW numbers). ...................................................................................... 45
Fig. 19 (a- d) Time lapse sequences of the micropump in action. (e) Micropump flow
rate for different droplet volumes. The phase I and phase II domains are
shown as highlighted grey and white regions. ..................................................... 48
Fig. 20 Micropump operation: (a) the droplet is stable on top of the channel with the
initial contact angle, θDI, of 86º. (b and c) By applying a constant voltage of
100V, the droplet is driven into the channel in phase I and phase II. (d)
Droplet contact angle, θD, vs. its WL velocity, U. ................................................. 50
Fig. 21 EWOD voltage effect on flow rate (a) Top view pictures of the micropump’s
channel taken in every second show the advancing meniscus at 100V. (b)
The micropump’s meniscus position versus time for different voltages. .............. 54
Fig. 22 Model 1 WLE and WLV numerical values for (a) Droplet’s θD, aD, and RD
versus time. Measurement data for θD and aD are plotted. (b) PD and PM vs.
time. (c) Meniscus position versus time. Circles are the data and solid line is
the best fit to the data. Dashed line and dot-dashed line show the effect of a
small change in θEW (±1○) on the convergence of the fit. ..................................... 61
Fig. 23 Model 1 WLE and WLV predicting the meniscus position versus time for
different diameter of the droplet wetted area, 2aD. Markers are measurement
data and solid lines are the best fits to the data. .................................................. 63
Fig. 24 Model 1 WLE and WLV predicting meniscus position versus time for different
voltages. Markers are measured data and solid lines are the best fits to data..... 64

xiii
Fig. 25 Numerical values for θEW versus EWOD voltage, calculated by model 1 WLE
& WLV. ................................................................................................................ 65
Fig. 26 Meniscus position versus time for (a) Model 2 (Young-Tadmor) and (b) Model
3 (Young). Circles are measurement data and solid lines are the best fits to
the data. Dashed lines and dot-dashed lines show the effect of a small
change in θEW on the convergence of the fit. ....................................................... 67
Fig. 27 Stable configurations of aqueous droplets at oil-air interface: (a) NC droplet
resting on a stretched and deformed free surface (b) C/B droplet with TCL (c,
d) the effect of the droplet size on the deformation of the free surfaces. ............. 70
Fig. 28 The probability of formation of NC droplets versus Weber number obtained
for different droplet’s radii, RD. ............................................................................. 72
Fig. 29 Physical and geometrical parameters used in energy analysis of (a) NC
droplet and (b) C/B droplet configurations. .......................................................... 75
Fig. 30 The calculated oil’s free surface profiles and the boundary conditions used in
h estimation in (a) NC droplet configuration and (b) C/B droplet configuration. ... 78
Fig. 31 Energy analysis simulation of both equilibrium states: (a) NC droplet and (b)
C/B droplet (c, d) the effect of droplet size on the deformation of the free
surface (e) φD for NC droplets and φcap for C/B droplets versus droplet radius. ... 80
Fig. 32 The free body diagrams of (a) NC droplet and (b) C/B droplet. Arrows show
the surface tension force, FS, the buoyancy force, FB and the droplet’s weight,
FW. ....................................................................................................................... 82
Fig. 33 Enet and Fnet for a droplet with RD of 1mm plotted for (a) φD for NC droplet and
(b) φcap for C/B droplet. ........................................................................................ 83
Fig. 34 The transition between the floating droplet’s stable equilibrium states with a
RD of 1mm (a) Enet divided by wD versus hc (b) NC droplet in states I to III (c)
C/B droplet in states IV to VI. ............................................................................... 85
Fig. 35 Highest release height to form NC droplets with a probability of 100%, HR,1,
for different droplet’s radius, RD. .......................................................................... 86
Fig. 36 Enet versus RD and (a) φD for a NC droplet and (b) φcap for a C/B droplet. The
dot-dash lines show the minimum Enet decreases by increasing RD. ................... 87

xiv
Fig. 37 Oil’s free surface deformation factor, hc/RD, versus the non-dimensional
parameters of Bo-1 and ρo/ρw obtained from the force balance and energy
equations. ............................................................................................................ 88

xv
LIST OF TABLES
Table 1 Dynamics of three-phase interfaces and related physical phenamena ........... 7
Table 2 Experimental assumptions and dynamic contact angles for models ............. 66

xvi
LIST OF ACRONYMS
EW Electrowetting
EWOD Electrowetting on dielectric
PDMS Polydimethylsiloxane
SOG Spin-on glass
WL Wetting line
WLE Wetting line energy
WLV Wetting line velocity

1
CHAPTER 1: INTRODUCTION
Micropumps and microvalves are the key components in handling small amount of
aqueous samples [1-3]. Their importance is recognized, especially, in the field of
analytical chemistry, biology and medicine in which massive and parallel screening of
aliquots with the limited amount of usable samples is to be performed or a limited
amount of dose needs to be supplied with good accuracy. In such applications, small
amounts of biological samples or chemical reagents are introduced and transferred by
means of micropumps and microvalves, followed by chemical reactions and biochemical
processes such as immobilization, labeling and detection [4, 5]. Micropumps have been
categorized by means of actuation methods applied to drive the flow rate. The
electrostatic, piezoelectric, bimetallic, electroosmotic and electrowetting (EW) actuation
methods have been reported [6].
The performance characteristics of micropumps for biological and chemical
applications depend on critical parameters such as power consumption, flow rate,
biocompatibility, disposability and durability of mechanical moving parts. Micropumps
consisting of moving parts such as mechanical valves and membranes for controlling or
actuating the liquid may be prone to mechanical failure, and their complicated structure
often results in prohibitive fabrication cost [7]. Micropumps with low fabrication cost and
minimal mechanical complexity are highly desirable for designing disposable biochips
which could be easily replaced once the sample analysis is completed [8]. Therefore
design and fabrication methods of micropumps with no moving parts are one of the
central points of research in the field.

2
Among various actuation techniques, the surface tension-driven method was
shown to be well suited for droplet based transport devices due to its favorable scaling
effect [8-10]. The surface tension force is linearly proportional to the length of the
interfacial line between the liquid, air and the solid (WL) in which a droplet forms the
boundaries of the wetting area on the solid surface. By scaling down the size of the
system homogenously, the surface to volume ratio of the system increases and the
surface forces which are negligible on macroscale become dominant on the microscale.
Although passive surface tension based micropumps are shown to be suitable for
many applications [8, 9], the ability to control the surface wettability to induce and stop
the flow on demand would be highly desirable. The control of surface tension, by a
temperature gradient in thermocapillary and by an electric potential gradient in
electrocapillary, is implemented for micropumping [2, 3]. However, electrocapillary in the
forms of EW and EWOD are considered more power efficient than the thermocapillary
[4]. EWOD is the most promising method due to the electrochemical inertness of the
substrate and the ability to work with the non-electrolyte aqueous solutions. In EWOD
phenomenon, the wetting properties of a hydrophobic surface could be modified by
applying an electric field without changing the chemical composition of the surface.
The simplest EWOD comprises a water droplet resting on a conducting layer
covered with an dielectric layer (Fig. 1). A water droplet resting on a solid surface has a
contact angle, θD which is defined clockwise, inside the liquid phase, from the solid
surface to the tangent line to the liquid at the point of the contact with solid. θD depends
on the surface tensions of the three phases of liquid, air, and solid and is equal to
Young’s equilibrium contact angle. By applying the voltage between the liquid and the
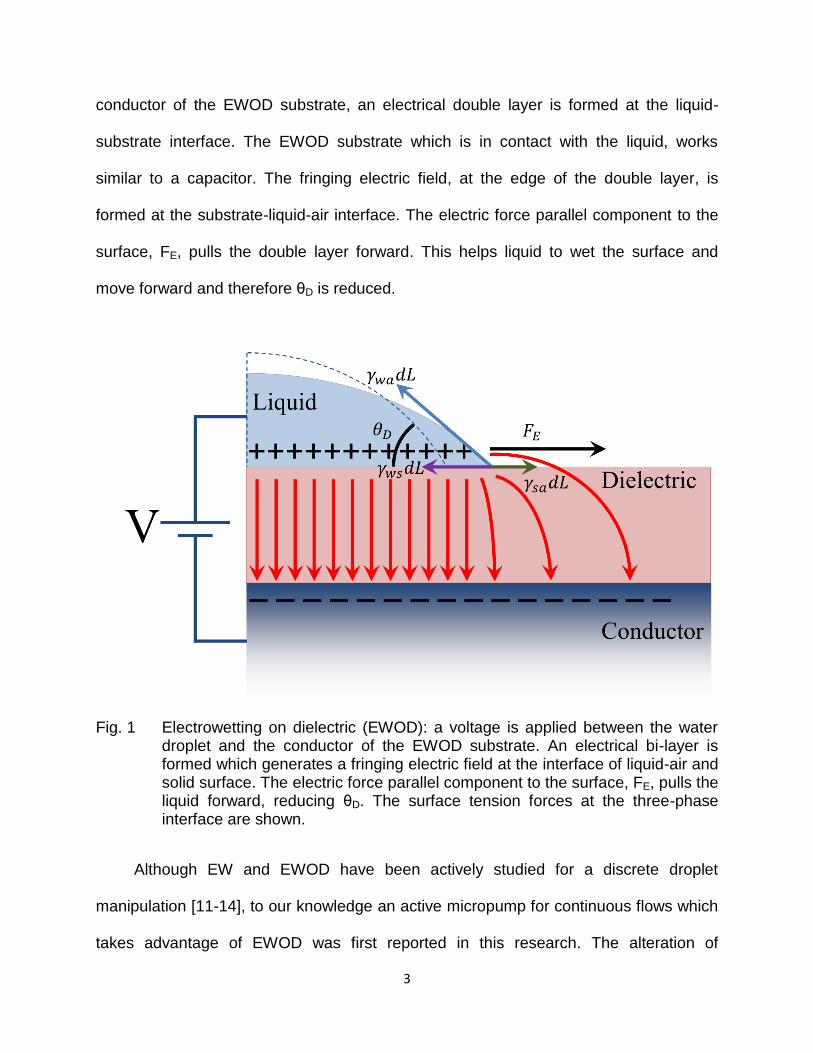
3
conductor of the EWOD substrate, an electrical double layer is formed at the liquid-
substrate interface. The EWOD substrate which is in contact with the liquid, works
similar to a capacitor. The fringing electric field, at the edge of the double layer, is
formed at the substrate-liquid-air interface. The electric force parallel component to the
surface, FE, pulls the double layer forward. This helps liquid to wet the surface and
move forward and therefore θD is reduced.
Fig. 1 Electrowetting on dielectric (EWOD): a voltage is applied between the water droplet and the conductor of the EWOD substrate. An electrical bi-layer is formed which generates a fringing electric field at the interface of liquid-air and solid surface. The electric force parallel component to the surface, FE, pulls the liquid forward, reducing θD. The surface tension forces at the three-phase interface are shown.
Although EW and EWOD have been actively studied for a discrete droplet
manipulation [11-14], to our knowledge an active micropump for continuous flows which
takes advantage of EWOD was first reported in this research. The alteration of
4
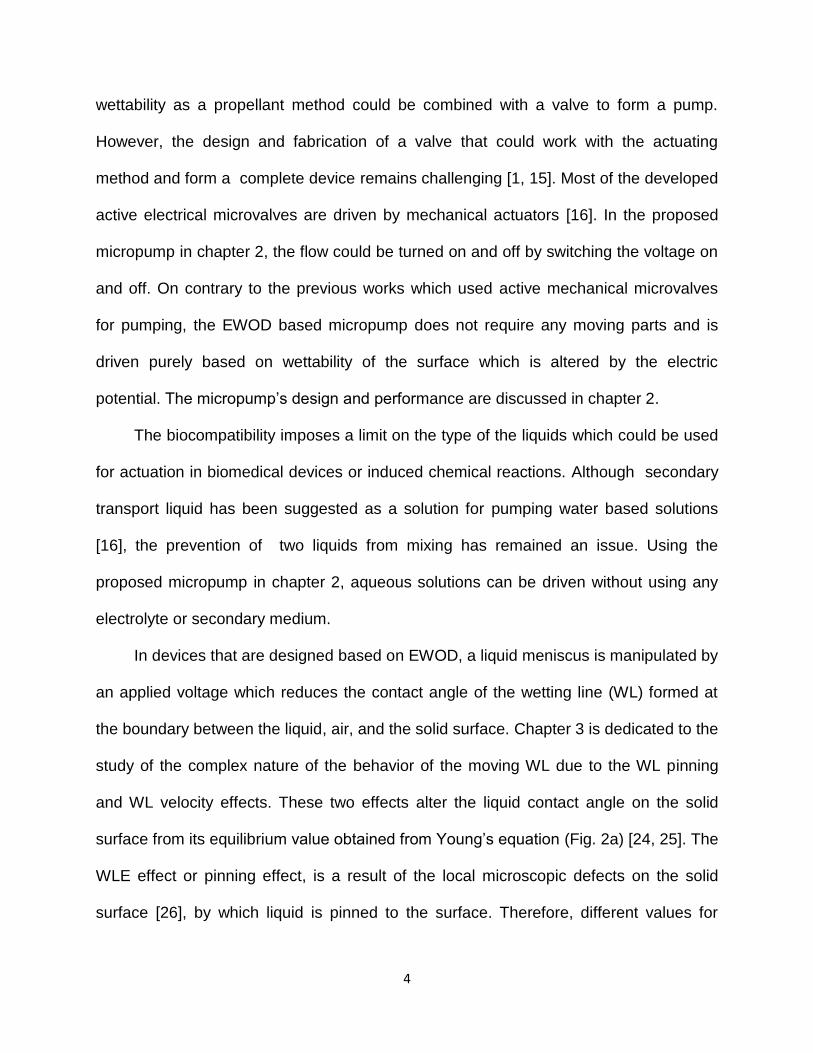
wettability as a propellant method could be combined with a valve to form a pump.
However, the design and fabrication of a valve that could work with the actuating
method and form a complete device remains challenging [1, 15]. Most of the developed
active electrical microvalves are driven by mechanical actuators [16]. In the proposed
micropump in chapter 2, the flow could be turned on and off by switching the voltage on
and off. On contrary to the previous works which used active mechanical microvalves
for pumping, the EWOD based micropump does not require any moving parts and is
driven purely based on wettability of the surface which is altered by the electric
potential. The micropump’s design and performance are discussed in chapter 2.
The biocompatibility imposes a limit on the type of the liquids which could be used
for actuation in biomedical devices or induced chemical reactions. Although secondary
transport liquid has been suggested as a solution for pumping water based solutions
[16], the prevention of two liquids from mixing has remained an issue. Using the
proposed micropump in chapter 2, aqueous solutions can be driven without using any
electrolyte or secondary medium.
In devices that are designed based on EWOD, a liquid meniscus is manipulated by
an applied voltage which reduces the contact angle of the wetting line (WL) formed at
the boundary between the liquid, air, and the solid surface. Chapter 3 is dedicated to the
study of the complex nature of the behavior of the moving WL due to the WL pinning
and WL velocity effects. These two effects alter the liquid contact angle on the solid
surface from its equilibrium value obtained from Young’s equation (Fig. 2a) [24, 25]. The
WLE effect or pinning effect, is a result of the local microscopic defects on the solid
surface [26], by which liquid is pinned to the surface. Therefore, different values for
5
contact angle are expected depending on whether the WL is in advancing or receding
modes (Fig. 2b). This effect could be shown on a slightly tilted surface. The WL on the
lower side of the droplet is forced to advance, but the droplet adjusts its contact angles
to the advancing contact angle, θA, to resist motion. However the WL on the upper side
of the droplet is forced to recede, but θD is reduced to a receding contact angle θR
before the WL start to move. The droplet WL remains pinned to the substrate. This is in
agreement with our daily observations of rain droplets on a tilted surface such as the car
windshield. The contact angle is also changed when the WL is moving, depending on
the magnitude and direction of the WL velocity (Fig. 2c) [27, 28]. The droplet will
eventually slide down the surface, if the surface is further tilted. θA is further increased
and θR is more decreased as the magnitude of the WL velocity, U, increases. Further
the EWOD voltage effect on the WL pinning and the contact angle hysteresis is studied.
Fig. 2 WLE and WLV effects on Young’s equilibrium droplet contact angle (a) A droplet resting on a horizontal surface has a static θD (b) Droplet adjusts its contact angles depending on the advancing or receding modes of WLs, θA and θR respectively, as the surface is slightly tilted. Droplet resists motion and its WL is pinned to the substrate (c) Droplet WL starts to move on the surface as it is further tilted. θA and θR are further changed as a function of droplet WL velocity, U.
Walker et al. reported that considering the effect of the WLE on contact angle is
crucial to predicting the time scale of the liquid motion; otherwise the calculated flow

6
rate will be much higher than the experiments [29]. Dussan V. reported the relationship
between dynamic contact angle and WL velocity in a forced wetting [27]. In chapter 4,
the WLE effect on static contact angle and the WL velocity effect on dynamic contact
angle in two different phases of the micropump operation are demonstrated for the first
time.
In devices that are designed based on EWOD, a liquid meniscus is manipulated
by an applied voltage which reduces the contact angle of the WL formed at the
boundary between the liquid, air, and the solid surface. Theoretical and numerical
models have been developed to describe the moving WL [30-33]. In devices based on
EWOD the problem is more complicated due to the saturation of contact angle at higher
voltages [34, 35]. The study of the moving WL in EW based devices, for discrete droplet
manipulation, has also been the focus of many studies [12, 29, 36-46]. It has been
shown that consideration of the pinning effect is essential to predict the accurate time
scale of the droplet motion [29, 39]. The dynamics of the WL was also investigated to
model the droplet motion on the electrodes [12, 42-44, 47, 48].
In chapter 5, a combined theoretical/experimental approach based on continuity
and energy equations is developed to study a continuous flow induced by manipulating
a meniscus on an EWOD substrate at the bottom of a microchannel. The WL pinning
and the WL velocity effects need to be taken into account to describe the dynamic
contact angles at the WLs: (i) the droplet’s receding WL, (ii) the advancing WLs of the
liquid meniscus on the upper and side walls of the channel, and (iii) the advancing WL
at the bottom of the channel with a reduced contact angle due to EWOD. These two
effects are crucial to developing a physically-relevant model for the flow rate analysis.

7
This is due to the fact that the accurate estimation of the contact angles is necessary to
calculate the induced droplet/meniscus pressure gradient [37], and subsequently the
micropump’s flow rate.
The last chapter of this dissertation (chapter 6) investigates the important physical
phenomena at the interface between three fluids. The similarities and the differences
between the two setups used in the previous chapters and chapter 6 are tabulated in
Table 1.
Table 1 Dynamics of three-phase interfaces and related physical phenomena
In chapters 3 to 5, the important wetting phenomena at a droplet moving WL on
solid surface and a meniscus in a microchannel were investigated (Fig. 1 a, b). In
chapter 6 two different interfaces between three fluids are studied and the relevant
physical phenomena are described (Fig. 1 c, d). Further the stable equilibrium states of
the floating droplets at the oil-air interface were predicted using energy analysis.
Phases Air, Water, Solid Air, Water, oil
3-phase Interface Wetting line (WL) Triple contact line (TCL)
Studied phenomena Wetting line energy (pinning),
Wetting line velocity effect
Air film lubrication effect,
Free surface deformation
Actuation method Electrocapillary (EWOD) Thermocapillary convection
Substrate phase properties Insulating, Hydrophobic Low surface tension, High density
8
Fig. 3 Interfaces between three phases: (a, b) WLs formed between a solid and two fluids: a water droplet on PDMS surface and a meniscus in a microchannel. (c, d) floating water droplets on oil: Non-coalescent droplet and cap/bead droplet with a triple contact line (TCL).
The formation of floating aqueous droplets on the free surface of immiscible liquids
has application in digital microfluidic devices [49], as well as material transportation and
mixing in lab on a chip [50, 51]. The floating aqueous droplets serve as containers for
encapsulating reagents in biochemical reactions [52]. They allow low consumption of
the analytes and give direct access to reaction products [52]. The direct contact with the
ambient air could be a benefit in sensor applications [53]. Moreover no material transfer
between them and the liquid platform [54], results in reduced contamination compared
to the solid counterparts. The sample evaporation could be reduced by encapsulating
the device as well [53]. In such devices, thermocapillary was used for manipulating the
floating droplets [50]. The floating non-coalescent (NC) water droplets were first
9
observed by Reynolds on the water’s free surface [55]. Mahajan investigated the effect
of the surrounding medium on the life of the floating droplets [56]. The droplet’s non-
coalescence caused by a surface tension gradient due to a temperature difference
between the droplet and the pool liquid [51], a vertical oscillation of base liquid [57], and
the non-wetting liquid droplet coated with a hydrophobic powder [58], has been
reported. NC droplets formation on a liquid interface in isothermal condition has also
been reported [59]. Although describing the floating droplets has been the interest of
several studies, to our knowledge a general solution has not been provided for the dual
equilibrium states [51, 59, 60]. Further, while the non-coalescence of a droplet on the
free surface of the same liquid is widely investigated, the studies using immiscible
liquids are scarce.
10
CHAPTER 2: EWOD BASED MICROPUMP
Some of the materials used in this chapter have been previously published by
Elsevier and Springer: R. Shabani and H.J. Cho, “Active surface tension driven
micropump using droplet/meniscus pressure gradient”, Sensors and Actuators B:
Chemical, 180, 114–121, 2013.
R. Shabani and H. J. Cho, “Flow rate analysis of an EWOD based device: how
important are wetting line pinning and velocity effects?”, Microfluidics and Nanofluidics,
2013, DOI: 10.1007/s10404-013-1184-y.
2.1 Introduction
Micropumps are the essential components for many integrated microfluidic
systems [2, 3]. Micropumps have been used in biochemical analysis chips and micro
chemical reactors [61]. Various methods have been reported for driving micropumps [3,
62]. A passive pumping method previously reported, which takes advantage of the
droplet’s surface tension, shows that the Laplace pressure gradient obtained from a
difference in surface curvatures is well suited for the microfluidic devices [9]. EWOD is a
well-known method for altering the wettability of the surfaces by changing the electric
potential [14, 35, 63]. In this chapter an on-demand micropump based on EWOD is
proposed which utilizes a Laplace pressure gradient between a droplet and a liquid
meniscus as a propellant source, and an alteration of the surface wettability as a valving
method without using any moving parts. In contrast to the passive pumping methods in
which a non-stopping flow is induced once initiated, in EWOD micropump the induced
flow rate is controlled and could be stopped at any time by regulating the voltage. Using

11
the proposed micropump, aqueous solutions can be driven directly contrary to the
micropump driven by continuous EW actuation [16]. The key concept in our device is
the linkage of this wettability control and the droplet/meniscus pressure gradient as a
propellant method for driving a liquid in a microchannel. The power consumption is
expected to be very small due to a very small current (< 0.01mA) associated with
EWOD.
2.2 Materials, design and fabrication
The idea of the micropump was developed by direct observation of alteration of a
water droplet contact angle on hydrophilic surfaces, such as glass or a silicon wafer with
a native oxide layer, and hydrophobic surfaces such as a bare silicon wafer, fluorinated
surfaces, or Polydimethylsiloxane (PDMS) layers. The droplets with different contact
angles would have different Laplace pressures due to the difference in their surface
curvatures. A pressure gradient could be induced by altering the liquid contact angle on
solid surface. As a low power consumption method for controlling the hydrophobicity of
the solids and therefore inducing a pressure gradient, EWOD was employed. The
EWOD-based micropump could be turned on and off on demand without any
mechanical part and could work with non-electrolyte aqueous solutions.
In designing the micropump, it is assumed that the liquid of interest is applied in
the form of a droplet using pipettes and syringes, which is a common protocol in
chemistry. The size of the micropump is designed to work best with sample volumes on
the microliter scale. The micropump chambers and channels are cast in biocompatible
PDMS layer with low cost and simple fabrication process for disposability. PDMS is
widely used in biological diagnosis lab on a chip in which transparency is required for
12
optical measurement [64]. A single PDMS film is used both as bonding layer to the
PDMS layer with a microchannel and the hydrophobic layer of the EWOD substrate.
There are also other novelties in the fabrication process such as using spin-on glass
(SOG) as the insulating layer that could be applied in a very short time compared to
normally used dielectric layers in EWOD devices such as silicon dioxide. The EWOD
micropump was fabricated in a class 1000 cleanroom.
2.2.1 EWOD substrate
The EWOD substrate of the micropump consists of a conductive layer which is
used as the bottom electrode and a dielectric layer which insulates the liquid from the
bottom electrode. A hydrophobic layer is formed on top of the insulating layer to put the
meniscus in a non-wetting state before applying the voltage. A silicon wafer was used
as the conductive layer. Other conductive substrates such as indium tin oxide (ITO)
coated glass slides may also be used as the bottom electrode when a direct optical
observation through the substrates is needed.
The electrical insulation was tested with both non-electrolyte and electrolyte
aqueous solutions. The PDMS layer alone could not completely insulate the electrolyte
solutions from the bottom electrode but it could be used to form a defect free under
layer for SOG film which could be used as a main electrical insulator. For instance,
when a droplet of 1% KCl solution was used (instead of DI water), the generation of
bubbles and the leaky current were observed on the single layer of PDMS or SOG,
while those were not observed on the SOG/PDMS layer.
13
Prior to the deposition of the insulating layer the substrate was cleaned via AMD
(acetone, methanol and DI water) or RCA cleaning step. In order to maximize the
efficiency of the EWOD the insulating layer must be kept thin while maintaining the
function of electrical insulator. The PDMS (monomer mixed with curing agent with a
weight ratio of 10 to 1) was diluted in toluene (volume ratio of 1 to 3) and spin-coated at
6000 RPM for 10 minutes to suppress the effect of residual surface defects [65]. Then
SOG was coated at 3000 RPM for 40 sec to form a leak-free electrical insulating layer
which could withstand relatively high EWOD voltages (Fig. 4a). Direct EWOD in which
the voltage is directly applied to a droplet on the substrate was used to test the
insulating layer.

14
Fig. 4 Fabrication steps for the micropump: (a) Silicon wafer was used as the bottom electrode. Diluted PDMS was spin-coated to mask the defects. A SOG film was formed as an insulating layer (b) Diluted PDMS was spin-coated again to form a thin hydrophobic film (c) A SU-8 mold was fabricated on a separate silicon wafer using photolithography (d) A PDMS block was cast using the SU-8 mold to form microchannels (e) PDMS slab was peeled off the mold and liquid inlet, the air outlet and the drop formation hole were punched (f) PDMS slab with microchannels was bonded to the PDMS film (g) Microfluidic interconnection and the electrical contacts were made.
An ohmic resistor of 1MΩ was connected in series with the EWOD substrate. The
large resistor protects the system against any short circuit and at the same time could

15
be used to measure the current. Since the resistance is large, any small leakage current
due to the defects in the insulating layer will result in a large voltage drop in the resistor
and could be easily detected.
The hydrophobic layer on top of the insulating layer increases the contact angle
and therefore increases the pressure inside the liquid due to the increased liquid-air
surface curvature. This is one of the major design considerations in our device in which
the accessible range of contact angle is enhanced before applying the electric potential
[34]. The hydrophobic layer from this point of view puts the meniscus in a non-wetting
state ready to be relaxed and actuated by applying the voltage. In order to reduce the
total material cost and simplify the fabrication steps, instead of commonly used
hydrophobic materials in EWOD such as CYTOP (Asahi Glass Co.), or Teflon AF
(DuPont), a second PDMS film was formed as both the hydrophobic and the bonding
layer in our device (Fig. 4b).
2.2.2 Soft lithography and bonding
Su-8 photoresist was used to make a mold on a different silicon substrate using
photolithography (Fig. 4c). A separate PDMS block was cast using the SU-8 mold to
form a replica of the mold in PDMS (Fig. 4d). The PDMS slab was peeled off the mold
and the silicon wafer (Fig. 4e). In addition to an inlet and an outlet (an escape route for
air), an orifice for droplet formation was punched into the PDMS block before bonding.
This slab was bonded to the EWOD substrate to form a closed microchannel (Fig. 4f).
The fully cured PDMS thin film which was formed as the hydrophobic layer in previous
step (Fig. 4b) was used as the bonding layer as well. A corona discharge method [66],

16
was used at room temperature and atmospheric pressure. A leak free bonding for fluids
between the PDMS film and the microchannel block was ensured before testing.
This method is different from the other methods using partially cured or uncured
PDMS adhesive or a variation of cross linker for bonding. This provides the uniformity of
surface characteristic to all of the channel walls. It is worth mentioning that the PDMS
thin film, initially becomes hydrophilic temporarily, due to the corona discharge process,
but it eventually reverts to the original hydrophobic state [67, 68].
2.2.3 Microfluidic interconnections and electrical contacts
A metallic tube with a diameter of slightly larger than the size of the punched holes
in the PDMS block was inserted into the liquid inlet. The PDMS is elastic and could
easily hold the inserted tube in its place and make a leak free connection for fluid. A
flexible polymer tube was connected to the steel tube (Fig. 4g). A stainless steel tube
inserted in the inlet was used as the upper electrode (Fig. 4g). This ensures that
electrical contact to the liquid is always maintained. The upper electrode was grounded
and the voltage was applied to the conductive layer in the EWOD substrate.
2.3 Micropump operation
2.3.1 Characterization of EWOD substrate
The EWOD substrate was characterized by studying the effect of the electric
potential on the droplet contact angle. The applied voltage to the liquid was varied from
0V to 120V and the droplet contact angle on the substrate was measured (Fig. 5). For
voltages less than 34V the contact angle is at its highest value, θmax, and remains

17
constant with an average value of 86º. As the voltage increases from 34V the contact
angle decreases. Finally for voltages above 90V the contact angle saturates to its
lowest value, θmin, with an average value of 57º. In terms of operation, any applied
voltage above 90V only increases the risk of dielectric break-down.
Fig. 5 Droplet contact angle on EWOD substrate vs. voltage: the dash line is the theoretical fit to the data. The hysteresis contact angle is shown as θmax, the saturation contact angle is shown as θmin, and the onset voltage is shown as Vonset. In the equation: A is a constant, c is the capacitance of the EWOD substrate.
A voltage of 100 Volts was selected (above 90V and below 120V) for the
micropump operation to make sure that the device is working in the saturation region of
the contact angle (Fig. 5). In other words increasing the voltage further will not improve
the pump operation since the contact angle will not be reduced further. A working

18
voltage in the saturation region will guarantee that the contact angle is not sensitive to
small voltage fluctuations of the device.
The observed plateau at higher voltages is associated with the saturation of the
contact angle which prevents the full wetting (zero contact angle) and limits the variation
of the surface tension force. The theoretical explanations behind this saturation are still
under debate and not conclusive yet. Various explanations have been given, which try
to find this phenomenon’s origination from trapping of electric charge, ionization of gas
close to the liquid-solid WL, WL instability, zero interfacial tension criterion and the
droplet resistance [34, 69].
The constant value of the contact angle at lower voltages ( < 34V in Fig. 5) is
related to the hysteresis of the contact angle or the pinning effect [46, 69]. The pinning
effect is the tendency of the liquid to preserve its wetting or non-wetting states on the
solid surface. This effect plays an important role at lower voltages in which EWOD is
not strong enough to force the liquid to wet the hydrophobic surface.
The pinning effect tends to pin the WL to the surface. When an external force (e.g.
due to a pressure gradient) is exerted on a WL, the pinning effect makes the WL on the
surface stationary and as a result the contact angle is increased or reduced without the
movement of the WL depending on the direction of the external force [26]. The EWOD
effect tends to increase the wetted area (the contact area between the droplet and the
surface) and therefore tends to reduce the contact angle. The droplet volume is
constant so an increase in the wetted area means a decrease in contact angle (Eq. (3)).
However, the EWOD is too weak at lower voltages and it could not move the WL due to
the pinning effect and therefore the contact angle does not change.

19
The application of silicone oil to the solid surface has proved to be effective in
reducing the contact angle hysteresis and improving the liquid’s reaction to the change
in electric potential in EWOD setup. However such surface treatment is often not
desirable due to the oil residues and non-uniformity of its effect.
It is apparent that there is an onset voltage, Vonset, in which the contact angle starts
a transition from a higher constant value to a lower constant value. The transition region
could be understood using the Young-Lippmann’s equation [24, 70], which states that
the contact angle is a function of the applied voltage and the surface tensions in an EW
setup:
((
⁄ ) ⁄ ) (1)
, where θ is water contact angle on the substrate, γsa, γws and γwa are the
substrate-air, water-substrate and water-air surface tensions respectively in the
absence of electric potential, V is the voltage and c is the capacitance (µF/m2) of the
EWOD substrate. Since the surface tensions are constant in this experiment, and c is
constant for a specific setup, we could simplify the Young-Lippmann’s equation to:
( ) ( ) (2)
, where A and B are two constants. Equation (2) could be fitted to the experimental
data using A and B as fitting parameters (dash line shown in Fig. 5). A good agreement
was found between the EW experimental data and the theoretical Eq. (2) for voltages
above 30V and less than 90V. The values obtained for A and B for the best fit are -
1.8×10⁻² and 7.2×10⁻⁵ (1/V2) respectively. Using γwa of 72 mN/m, the capacitance of the
micropump EWOD substrate, c, is obtained to be 10±0.6 µF/m2.

20
The capacitance, c, and the thickness of the insulation layer, t, are related as
( ) ⁄ , where ε0 is the vacuum permittivity and εr is the relative permittivity of the
insulating layer. The dielectric layer in the fabricated micropump consists of a thin SOG
layer and two PDMS films. The thickness of the SOG formed at 3000 RPM for 40
seconds is 0.2 µm. Considering the known values of relative permittivity, εr, of SOG and
PDMS (3.9 and 2.65) and the thickness of PDMS film (1.1 µm) [65], the capacitance is
calculated to be 10 µF/m2 which is in excellent agreement with the result obtained from
the Young-Lippmann’s equation.
The Young-Lippmann’s fit to the contact angle vs. voltage could be utilized to
demonstrate the efficiency of EWOD setup and used as comparative measure for
evaluating the strength of EWOD in one device with that in other fabricated devices. For
this purpose four parameters associated with Fig. 5 are utilized: the saturation contact
angle, θmin, the hysteresis contact angle, θmax, the capacitance of the substrate, c, and
the onset voltage, Vonset. EWOD setup, with a larger difference between the hysteresis
contact angle and the saturation contact angle, is more efficient and for a higher
capacitance, c, the switching from θmax to θmin occurs sharply and for less change in the
applied voltage (Eqs. (1) and (2)). In addition, a lower onset voltage means a lower
working voltage for the device. This gives an insight into the design guideline for
energy-efficient EWOD devices.
2.3.2 Working principle
For priming, water was supplied in the channel to make contact with the
hydrophobic surface of the EWOD substrate at the bottom of the channel and to form a
21
droplet as a positive pressure source on top of the channel (Fig. 6). A liquid meniscus is
also formed inside the channel. The droplet and the meniscus contact angles are in a
non-wetting state on the hydrophobic PDMS surface.
Fig. 6 EWOD based micropump: a microchannel cast in PDMS slab is bonded to the EWOD substrate (PDMS/SOG/PDMS/Si). An input droplet is driven into the channel and a continuous constant flow is induced upon turning on the voltage.
Prior to applying the voltage the droplet was stable and the liquid inside the
channel was in the non-wetting state (Fig. 7a, b). Only, after applying the voltage
(V=100V), the droplet starts flowing into the channel (Fig. 7c, d). The EWOD substrate
which is in contact with the liquid, works similar to a capacitor. A fringing electric field,
which is formed at the substrate-liquid-air interface, helps the liquid to wet the surface
and move forward in the channel. In other words the decrease in the contact angle at
the bottom of the channel reduces the liquid meniscus curvature inside the channel and

22
produces a positive pumping pressure. The droplet/meniscus pressure gradient is
activated and the droplet is pumped into the channel with a uniform flow rate.
Fig. 7 The micropump in operation at 100 V (a) a slanted view of the input droplet and the meniscus before applying voltage, (b) a magnification of the same meniscus in a, observed from top, (c) a slanted view of the reduced input droplet and the advanced meniscus in the channel after applying voltage (d) the same meniscus in c, observed from top which shows the increased wetting area.
The micropump flow rate was measured to be uniform for different sizes of the
droplet for the similar initial liquid length in the channel and a voltage of 100V. Since in
microfluidic devices the flow is laminar, their performance in the laminar regime is
enhanced by maintaining the flow at a constant rate [9]. The result shows that
regardless of reduction in the droplet size during the operation, the flow rate remains

23
constant [71]. Nevertheless the flow rate is strongly dependent on the initial droplet size
(Fig. 8a) and the higher flow rate is obtained from a smaller droplet. A smaller droplet
has a higher Laplace pressure due to higher surface curvature and induces a higher
flow rate inside the channel. Moreover the liquid flow rate in the channel is increased by
increasing the micropump’s working voltage (Fig. 8b). The meniscus contact angle on
the bottom of the channel is reduced by increasing the voltage. The meniscus with
lower contact angle implies a lower pressure in the channel and therefore a higher flow
rate is induced.
Fig. 8 The volumetric flow rate in the channel is shown as a function of (a) droplet radius at a constant voltage of 100 V and (b) voltage for a similar droplet radius of 0.5 mm.
24
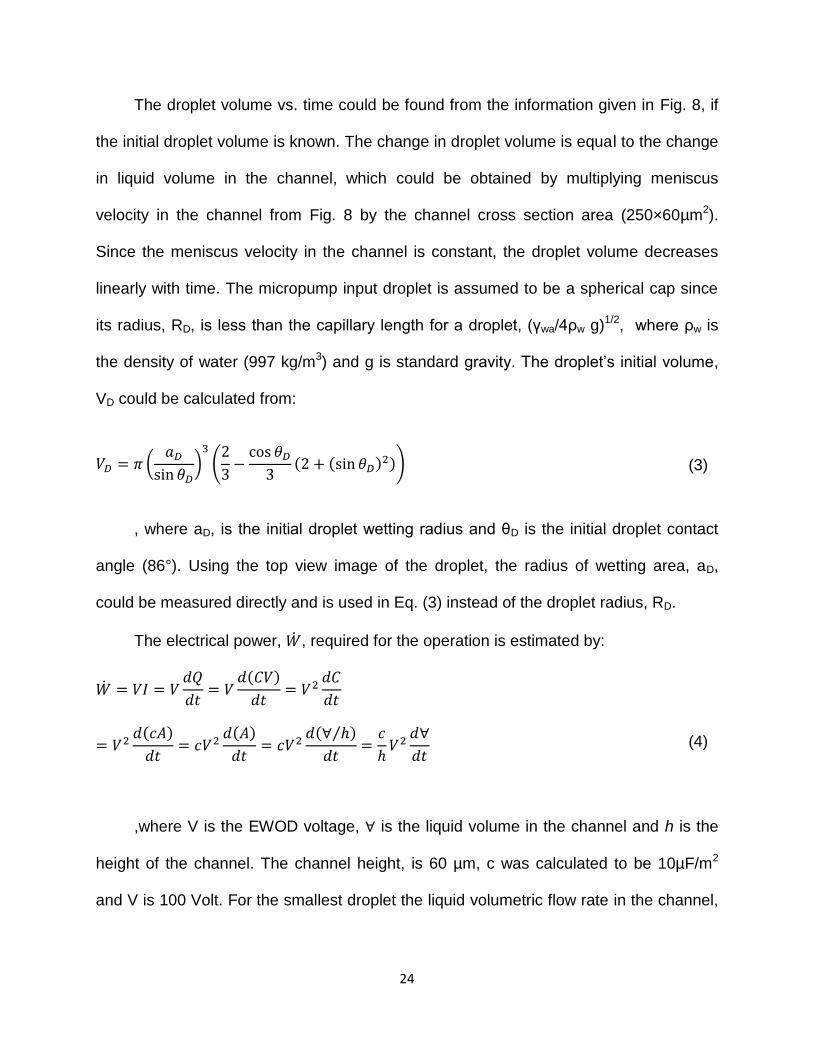
The droplet volume vs. time could be found from the information given in Fig. 8, if
the initial droplet volume is known. The change in droplet volume is equal to the change
in liquid volume in the channel, which could be obtained by multiplying meniscus
velocity in the channel from Fig. 8 by the channel cross section area (250×60µm2).
Since the meniscus velocity in the channel is constant, the droplet volume decreases
linearly with time. The micropump input droplet is assumed to be a spherical cap since
its radius, RD, is less than the capillary length for a droplet, (γwa/4ρw g)1/2, where ρw is
the density of water (997 kg/m3) and g is standard gravity. The droplet’s initial volume,
VD could be calculated from:
(
)
(
( ( ) )) (3)
, where aD, is the initial droplet wetting radius and θD is the initial droplet contact
angle (86°). Using the top view image of the droplet, the radius of wetting area, aD,
could be measured directly and is used in Eq. (3) instead of the droplet radius, RD.
The electrical power, , required for the operation is estimated by:
( )
( )
( )
( ⁄ )
(4)
,where V is the EWOD voltage, is the liquid volume in the channel and h is the
height of the channel. The channel height, is 60 µm, c was calculated to be 10µF/m2
and V is 100 Volt. For the smallest droplet the liquid volumetric flow rate in the channel,

25
is the highest (Fig. 8). Thus, for a flow rate of 0.012 μL/sec, the maximum power
consumption is extremely low, 12 nW.
2.3.3 EWOD microvalve
The key concept in the pump design is the utilization of the pressure gradient
between the droplet and the liquid in the channel as the driving pressure of the
micropump. The pressure gradient is generated by performing EWOD in the channel. A
flow is induced/stopped in the channel by turning on/off the voltage (EWOD microvalve).
A numerical calculation was carried out using MATLAB to predict the switch on
voltage of the EWOD microvalve for different sizes of the droplets. Some of the
parameters used in the analysis are shown in the side and top views of the micropump
schematic (Fig. 9a, and b). The size of the channel is exaggerated as compared to the
orifice size, d, for clarity. The micropump channel has a rectangular cross section with a
height, h, and a width, w (60µm × 250µm). Although the nominal depth of the channel is
supposed to be 100 µm according to the data sheet provided by the SU-8 photoresist
manufacturer (MicroChem Corp.), the channel thickness was measured at several
different points using a surface profiler (Tencor Alpha-Step 200) to be 60µm. The input
droplet has a radius of curvature of RD and a contact angle of θD. The liquid meniscus
contact angles on the channel sides and top, θCh, are similar while the meniscus contact
angle on the bottom of the channel, θEW, is smaller due to EWOD.

26
Fig. 9 Analytical model physical parameters defined on (a) side view of the micropump and (b) top view of the micropump.
Also the forces exerted on the meniscus WLs on the four walls of the channel are
shown in Fig. 10. Unlike the spherical shape of the droplet, the meniscus inside the
channel has a complicated shape since θCh and θEW are not equal. Therefore to obtain
the meniscus pressure, an analysis of the surface tension forces acting on the
advancing WLs in the channel is utilized. The effect of the electrostatic force is taken to
account by considering a reduced θEW at the bottom of the channel due to EWOD.

27
Fig. 10 Surface tension force exerted at the meniscus WL on the channel side wall (a) top view of the channel with the width of w. Differential length of the WL on the side wall is dL (b) side view of the channel with a height of h.
The liquid meniscus in the channel is not spherical, yet due to a uniform Laplace
pressure in the liquid, the sum of the inverse of the two radii of curvatures (1/R1+1/R2)
should be similar at all points on the meniscus. Except for the cases with a high
symmetry, such as a square or rectangular channel with equal contact angles on all the
channel walls [72], and a confined droplet at equilibrium between two plates with equal
contact angles [73], computational methods have been used to find the meniscus
pressure [36]. Nevertheless, it is possible to calculate the pressure of the meniscus
inside a rectangular channel for a general case (different contact angles on the channel
walls) without the need to calculate the surface curvature.
An expression was derived for liquid meniscus pressure, PM, based on the forces
exerted on the meniscus WLs on the four walls of the channel. The parallel component
of the surface tension force exerted on the liquid WL on the channel’s side wall (Fig.

28
10a, b) was found to be . Similarly the parallel components of the surface
tension forces exerted on the wetting lines on the top and bottom walls of the channel
were found to be , and respectively. The meniscus pressure, PM, is
derived by dividing the sum of the surface tension forces parallel to the channel by the
channel area:
The spherical droplet pressure, PD, from Laplace pressure equation is ⁄ .
The micropump driving pressure, PMP, is the difference between PM and PD:
The micropump pressure predicted by Eq. (6) depends on the accurate estimation
of θCh and θEW. When the EWOD valve is switching from off to on, θCh is equal to the
maximum advancing contact angle at zero velocity which was measured to be 100○
[71]. θEW (Fig. 5) was scaled from 86° to 100° at zero voltage to account for the
advancing contact angle. Eq. (6) and the voltage dependence of θEW were utilized to
predict the micropump driving pressure at different voltages and for various droplet
sizes (Fig. 11). The input droplet radius and the voltage are used to plot the driving
pressure of the micropump in a 3D graph (Fig. 11). The constant pressure contours,
including the zero pressure line, are shown on the surface. The EWOD valve will be
opened and a flow will be induced in the channel for a combination of voltage and RD for
which the pressure is positive, (Red region in Fig. 11). The valve remains closed if the
pressure is negative (Blue region in Fig. 11).
( ⁄ )[( ) ] (5)
(
(( ) )
) (6)

29
Fig. 11 The outputs of MATLAB code showing the micropump pressure as a function of voltage and droplet radius in a three dimensional representation.
For a constant RD of 0.7 mm (white dashed line) the pump pressure crosses the
zero value as the working voltage increases (Fig. 12a). It is shown that for a very small
droplet radius, such as 0.2 mm, the pump pressure is always positive and valve is open,
even without applying voltage. In other words the surface curvature of small droplets is
high enough to drive the pump by means of a high Laplace pressure inside the droplet.
Also for a constant voltage (white dot-dashed line), the pump pressure crosses the
zero value as the radius of the input droplet increases (Fig. 12b). For a range of droplet
sizes in region I (Fig. 12b) the valve will be always open without applying voltage. In the

30
region II at zero voltage the valve is closed and by increasing the voltage it will switch to
be open. Therefore region II represents the range of RD for which the droplets are
pumped on-demand. Further increasing the voltage will increase the pressure and
induce a higher flow rate in the channel.

31
Fig. 12 (a) Voltage effect highlighted for RD= 5, 0.7 and 0.2 mm and demonstration of switch in EWOD microvalve (b) droplet radius effect highlighted for V=0, 70 and 120V and presentation of on-demand pumping.

32
The micropump pressure gradient is proportional to the liquid flow rate in the
channel:
(7)
,where K, is a geometrical constant, µw is the water viscosity, Q is the volumetric
flow rate and Leff is the effective liquid length in the channel (the sum of the liquid length
in the channel, LCh, orifice length, and other head losses). Equation (7) shows a direct
relation between the micropump driving pressure, PMP and the flow rate in the channel.
The code outputs for micropump pressure, shown in Fig. 12a and b, strongly correlate
with the flow rate data presented in Fig. 8a and b. The flow rate decreases by
increasing the size of the input droplet and increases by increasing the voltage (Fig. 8).
This observation correlates with the predicted micropump pressure (Eq. (7)), which
shows the same trend by altering the input droplet size and the voltage.
2.3.4 Input droplet wetting modes
After the pump switches on by applying the voltage, droplet shrinks in two phases:
in phase one, the droplet wetting area remains constant as the contact angle is reduced
to 80° (Fig. 13a to b). In phase two, both the droplet wetting area and the contact angle
decrease (Fig. 13b to c). Several models are proposed in the past to describe different
phases of a shrinking droplet [74-77]. However, the comparison of the different models
reveals that a generally accepted model has not been developed yet. In general, the
different observations could be attributed to different experimental conditions.

33
Fig. 13 Droplet pumping phases in which RD is surface radius of curvature and aD is droplet wetting radius (a) Stable droplet on top of the PDMS channel with an initial contact angle, θD, of 86º prior to applying voltage (b) phase I: aD is constant while θD decreases. (c) phase II: both aD and θD decrease.
By observing the gradually evaporating droplets on a solid surface, two modes are
described [74]. In the first mode the contact angle is decreasing with a constant wetting
area (CWA) and in the second mode the wetting area decreases with a constant contact
angle (CCA). Birdi and Vu have described the shrinkage of the water drop as a single
phase phenomenon (attributed to the pinning effect) [75], in which depending on the
initial value of the contact angle, only one of the two modes mentioned above takes
place: CWA for solid surfaces with wetting characteristics, such as glass (θD<90°) and
CCA for surfaces with nonwetting characteristics such as Teflon (θD>90°).
34
McHale et al. suggested a two phases model [76]. The first phase is similar to the
previous model [75], for both hydrophilic and hydrophobic surfaces. However in the
second phase both the contact angle and the wetting area are changing though the
evaporation time scale is dominated by the first phase. This is due to the increasing rate
of reduction of the contact radius and the velocity dependence of the contact angle. Yu
et al. also have reported a two phases model [77]. However their model does not
depend on the initial contact angle. It always starts from CWA and switches to CCA.
This model is identical to the model used to describe the shrinkage of a passively
pumped droplet by a surface tension based pumping method [9].
Our observations are in relatively good agreement with McHale et al. [76],
although due to the micropump’s higher flow rate the second phase is much more
pronounced. This is the major difference between our experiment and evaporating
droplets. The concurrent decrease of the droplet’s contact angle and wetting area is
also observed in the forced wetting [78], in which the droplet wetting area is forced to
move by application of an external effect, such as a pressure gradient in the
micropump. In such case the contact angle depends on the velocity of the WL, and by
changing the velocity the contact angle is changed [71].

35
CHAPTER 3: DROPLETS ON SOLID SURFACES AND WETTING LINE
Some of the materials used in this chapter have been previously published by
Springer: R. Shabani and H. J. Cho, “Flow rate analysis of an EWOD based device:
how important are wetting line pinning and velocity effects?”, Microfluidics and
Nanofluidics, 2013, DOI: 10.1007/s10404-013-1184-y.
3.1 Introduction
In devices that are designed based on EWOD, a liquid meniscus is manipulated by
an applied voltage which reduces the contact angle of the WL formed at the boundary
between the liquid, air, and the solid surface. The behavior of the moving WL has a
complex nature due to the WL pinning and WL velocity effects, which alter the liquid
contact angle on the solid surface from its equilibrium value obtained from Young’s
equation [24, 25]. The WLE effect or pinning effect, is a result of the local microscopic
defects on the solid surface [26], by which liquid is pinned to the surface. Therefore,
different values for contact angle are expected depending on whether the WL is in
advancing or receding modes. The contact angle is also changed when the WL is
moving, depending on the magnitude and direction of the WL velocity [27, 28].
3.2 Contact angle hysteresis
The EWOD substrate of the micropump consists of a silicon wafer, a SOG layer
and a thin PDMS layer. Silicon wafer is a conductive layer and SOG is an insulating
layer with a thickness of 0.2µm and a dielectric constant of 3.9. PDMS is a hydrophobic
layer with a thickness of 1.1µm. The micropump’s input droplet is stable with a contact

36
angle of 86° before applying a DC voltage between the electrodes (Fig. 6). Upon
applying the voltage, the droplet is driven into the channel in two phases, with a
continuous flow. In phase I, the droplet’s wetting area remains constant until droplet’s
contact angle decreases to 80° due to pinning. Such phenomenon has been also
observed for a passive micropump [9].
In contrast, in phase II, both the droplet’s wetting area and contact angle decrease
as the droplet is driven into the channel. The further decrease in droplet’s contact angle
is due to WL velocity effect [71]. The reported variable droplet’s contact angle on
untreated PDMS surface is in agreement with the data reported in literature [9, 71].
These results are later incorporated in the flow rate analysis of the micropump.
In an experiment, this phenomenon was studied for droplets with advancing and
receding WLs by measuring the droplet’s contact angle, θD, with respect to its WL
position. A syringe pump was connected to a microchannel leading to an open orifice
formed in a PDMS layer (Fig. 14a). Pinning without EWOD was observed by injecting
(drawing) liquid at a very low flow rate to form an advancing (receding) droplet on top of
the orifice.
37
Fig. 14: Experimental setups for (a) contact angle hysteresis and WL velocity effect and (b) pinning effect with EWOD.
In stage 1 of the experiment, the liquid was pumped out of the orifice with a
uniform and low flow rate of 0.1 µL/min (Fig. 15a). The contact angle remained constant
at the advancing contact angle, θA, with an average of 86○ as the WL was moving
forward. In stage 2 the droplet from stage 1 was drawn back into the orifice using
refilling mode of the syringe pump. The WL was pinned to the substrate as the contact
angle was decreasing from θA to the receding contact angle, θR, with an average of 69○.
In stage 3, the droplet was drawn further. The droplet contact angle remained constant
at θR as the WL was receding. Then liquid was pumped out again (stage 4) and the
droplet contact angle increased from θR to θA while the WL was pinned to the surface.

38
Fig. 15: Contact angle hysteresis and the mode switch (a) A droplet (on top of an orifice formed in PDMS) with advancing (stage 1), receding (stage 3), and pinned (stages 2 and 4) WLs when no voltage is applied. Droplet contact angle, θD, decreases in stage 2 and increases in stage 4 due to pinning (b) Droplet contact angle versus its WL position, measured from the center of the droplet. Contact angle hysteresis loops for 0V and 100V.

39
The contact angle hysteresis with four stages is shown as a closed loop by plotting
the contact angle versus WL position (Fig. 15b). Droplet’s WL position was measured
from the center of the droplet. Interestingly, when EWOD is performed the droplet
exhibits a similar behavior, only the contact angle hysteresis loop is shifted toward lower
contact angles (Fig. 15b).
A high gauge needle connected to a syringe pump was placed close to EWOD
substrate (Si as lower electrode/ Dielectric SOG/ Hydrophobic PDMS) and used for
injecting (drawing) liquid (Fig. 14b). The needle was also used as the upper electrode. A
power supply was connected between the needle and the silicon substrate. Liquid was
injected (drawn) through the needle at a very low flow rate, to form an advancing
(receding) droplet on EWOD substrate. Contact angle hysteresis is reduced by
increasing the DC voltage, as evidenced by the smaller area occupied by the hysteresis
loop. This is discussed in more details in next section.
3.3 Wetting line velocity effect
The advancing (receding) contact angles are further changed by the direction and
the magnitude of the droplet’s WL velocity [27, 78]. In next experiment this effect was
shown for positive (advancing), zero, and negative (receding) velocities (Fig. 16a, b).
The setup depicted in Fig. 14a, was used to observe the effect of WL velocity on
droplet’s contact angle by increasing the injecting (drawing) flow rate (dynamic contact
angles). The contact angle was measured versus the WL velocity using frame by frame
video analysis.
In stage A, a droplet is pumped out of the orifice (positive WL velocities). For a
constant pumping rate, the droplet’s WL velocity is higher when it is small and becomes

40
lower for larger size of the droplet. A higher value for contact angle is observed for
higher velocities. In stage B, the droplet is drawn back into the orifice without giving time
to the droplet for relaxation. The contact angle is reduced to 80○ while the wetted area
remains constant. The contact angle change at zero velocity (vertical line) represents
the pinning or the hysteresis in contact angle (Fig. 16b, stage B). In stage C, the droplet
is drawn further resulting in negative WL velocity. Here, a smaller contact angle is
observed for higher magnitude of the WL negative velocity.
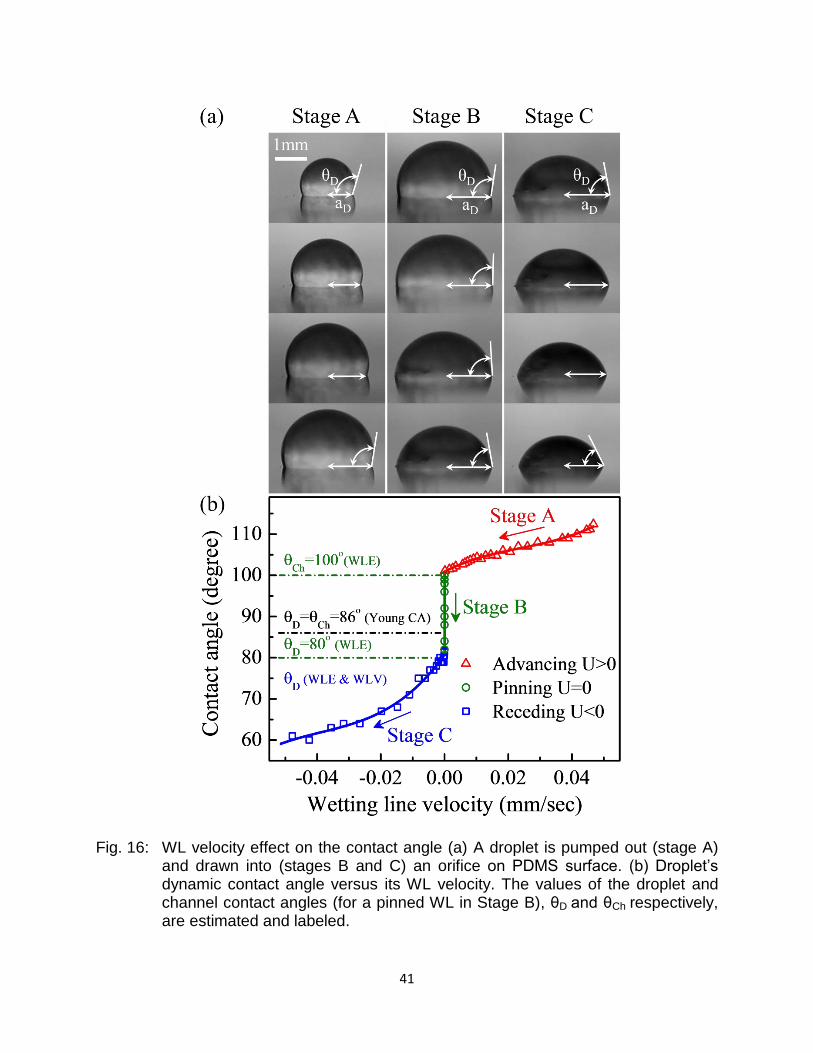
41
Fig. 16: WL velocity effect on the contact angle (a) A droplet is pumped out (stage A) and drawn into (stages B and C) an orifice on PDMS surface. (b) Droplet’s dynamic contact angle versus its WL velocity. The values of the droplet and channel contact angles (for a pinned WL in Stage B), θD and θCh respectively, are estimated and labeled.
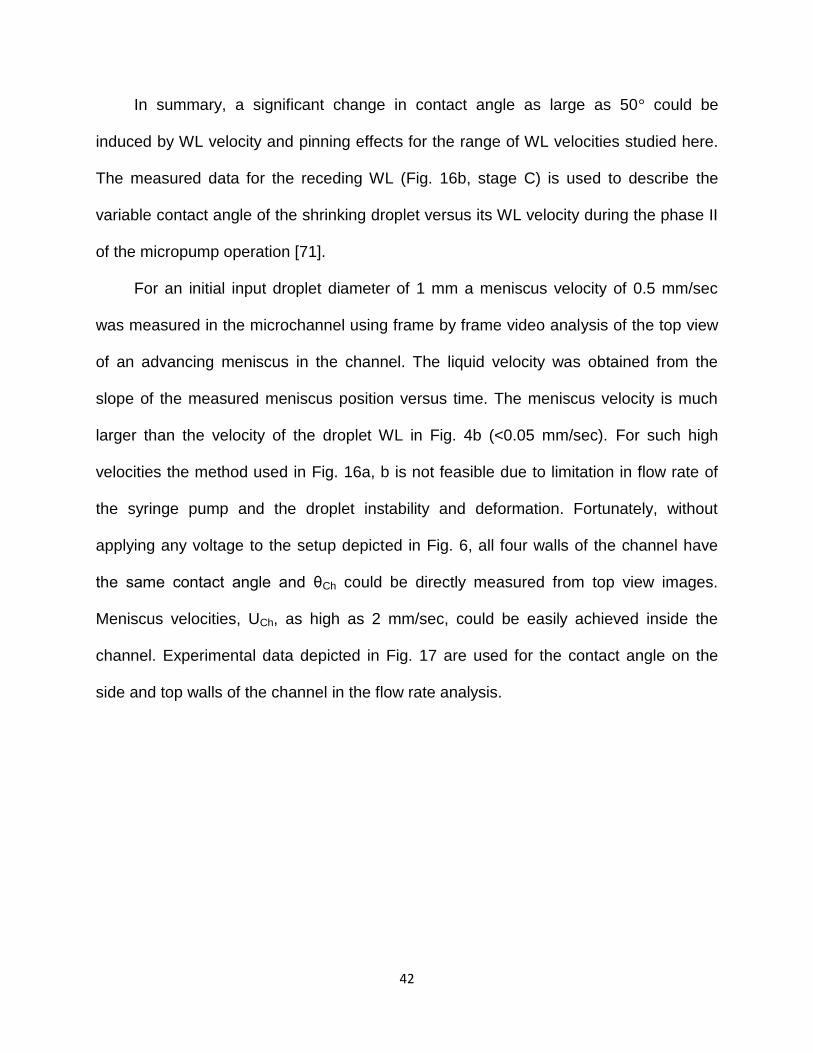
42
In summary, a significant change in contact angle as large as 50° could be
induced by WL velocity and pinning effects for the range of WL velocities studied here.
The measured data for the receding WL (Fig. 16b, stage C) is used to describe the
variable contact angle of the shrinking droplet versus its WL velocity during the phase II
of the micropump operation [71].
For an initial input droplet diameter of 1 mm a meniscus velocity of 0.5 mm/sec
was measured in the microchannel using frame by frame video analysis of the top view
of an advancing meniscus in the channel. The liquid velocity was obtained from the
slope of the measured meniscus position versus time. The meniscus velocity is much
larger than the velocity of the droplet WL in Fig. 4b (<0.05 mm/sec). For such high
velocities the method used in Fig. 16a, b is not feasible due to limitation in flow rate of
the syringe pump and the droplet instability and deformation. Fortunately, without
applying any voltage to the setup depicted in Fig. 6, all four walls of the channel have
the same contact angle and θCh could be directly measured from top view images.
Meniscus velocities, UCh, as high as 2 mm/sec, could be easily achieved inside the
channel. Experimental data depicted in Fig. 17 are used for the contact angle on the
side and top walls of the channel in the flow rate analysis.
43
Fig. 17 Dynamic contact angle in the channel, θCh, versus meniscus velocity.
The last data needed is the liquid contact angle on the bottom of the channel, θEW,
upon applying a DC voltage of 100V. However, the direct observation of θEW from the
side view of the PDMS channel is not feasible unlike the observation of θCh from the top
view. This is due to non-smooth and opaque surfaces when PDMS was cut on the
sides. Moreover the contact angle calculated by Young–Lippmann’s equation for a
voltage of 100V could not be used since the pinning and WL velocity effect are present
at the bottom of the channel (dynamic θEW at the advancing WL in the channel). Instead,
θEW was considered as a fitting parameter and the validity of values obtained for θEW
were justified by comparing with other experimental data, i.e. the contact angle should
be smaller in the presence of EWOD as compared to θCh.
3.4 EWOD effect on wetting line pinning
Micrographs of a droplet with advancing and receding WLs show the EWOD
voltage effect on the WL pinning and the contact angle hysteresis (Fig. 18a). DI water

44
was injected (drawn) through a needle, at a very low flow rate to form a droplet with
advancing (receding) WL. A high gauge needle (30G) was used to minimize the
distortion in the droplet shape. The needle was also used to apply a DC voltage to the
droplet Fig. 14b). To avoid the WL velocity effect, ample time was given to the droplet
for relaxation.
The advancing (receding) θD was measured for different DC voltages between 0V
to 120V (Fig. 18b). For voltages less than 40V the advancing contact angle is not
affected by EWOD (θA ~86 º), while above that, the contact angle is decreased.
However, for voltages above 90V, the contact angle reaches its lowest value and
saturates at θA ~ 56º [69]. A very similar pattern was observed for the receding contact
angle, only with a larger onset voltage for EWOD to affect the contact angle (70V). Such
transition region between the highest and lowest contact angles by increasing the
applied voltage has been also reported previously [46]. Interestingly, the WL pinning
effect (the difference between the advancing and receding contact angles, θA – θR), is
noticeable at voltages below 40V (region I in Fig. 18b), while at voltages above 70V
there is no significant pinning effect (region III in Fig. 18b). There is also a transition
region in which the pinning effect decreases gradually since only θA is affected by
EWOD (region II in Fig. 18b).

45
Fig. 18: WLE effect competing with EWOD (a) Droplet’s advancing and receding contact angles decrease by increasing the voltage from 0V to 120V. Also the difference between advancing and receding contact angles decreases at higher voltages. (b) Advancing and receding contact angles at different voltages (EW numbers).
46
It has been reported that for a DC voltage, the hysteresis is essentially voltage
independent [79], while in this study a decrease in the pinning effect was observed for
voltages above 40V (region II and III in Fig. 18b). This is due to the fact that there are
several major differences between the experimental setups used in these two studies,
such as the working liquid, insulating material and its thickness and also different range
of EW numbers (Fig. 18b).

47
CHAPTER 4: DYNAMIC WETTING LINE EFFECT ON MICROPUMP
Some of the materials used in this chapter have been previously published by The
Royal Society of Chemistry and Springer: R. Shabani and H. J. Cho, “A micropump
controlled by EWOD: wetting line energy and velocity effects”, Lab on a Chip 11 (20),
3401-3403, 2011.
R. Shabani and H. J. Cho, “Flow rate analysis of an EWOD based device: how
important are wetting line pinning and velocity effects?”, Microfluidics and Nanofluidics,
2013, DOI: 10.1007/s10404-013-1184-y.
4.1 Introduction
In this chapter, the WLE effect on static contact angle (Fig. 15), and the WL
velocity effect on dynamic contact angle (Fig. 16 and Fig. 17), investigated in chapter 3,
are investigated as to dominant parameters influencing the operation of the micropump
discussed in chapter 2 (Fig. 6). Walker et al. reported that considering the effect of the
WLE on contact angle is crucial to predict the accurate time scale of the liquid motion;
otherwise the calculated flow rate will be much higher than the experiments [29].
Dussan V. reported the relationship between dynamic contact angle and WL velocity in
a forced wetting [27].
4.2 Micropump switch in operation
The liquid was supplied into the channel to form a droplet above the orifice. Once
voltage is applied, the droplet begins flowing and the liquid moves forward in the
channel (Fig. 19a-d). The meniscus position in the channel was measured versus time

48
for various droplet volumes using the similar initial liquid length in the channel and a
voltage of 100V (Fig. 19e).
Fig. 19 (a- d) Time lapse sequences of the micropump in action. (e) Micropump flow rate for different droplet volumes. The phase I and phase II domains are shown as highlighted grey and white regions.

49
In a schematic of the setup, droplet and channel contact angles are shown as θD
and θCh respectively (Fig. 20a). Before applying the voltage between the electrodes, the
liquid is stable with θD of 86º. The micropump operation can be divided into two phases.
In phase I, the droplet’s wetting diameter, a, remains constant until θD decreases to 80º
(Fig. 20b and phase I in Fig. 20d). In contrast, in phase II, both the wetting diameter and
the θD decrease as the liquid length in the channel, LCh, increases (Fig. 20c and phase II
in Fig. 20d). In phase II the droplet has a θD of less than 80° and a wetting diameter, a,
larger than the orifice size (500µm). Interestingly, the micropump flow rate remains
almost constant despite the transition from phase I to phase II (Fig. 19e). The depicted
transition was calculated from the initial droplet volumes and the transition droplet
contact angle of 80°. The flow stops in the channel when the drop reaches the orifice
edge.

50
Fig. 20 Micropump operation: (a) the droplet is stable on top of the channel with the initial contact angle, θDI, of 86º. (b and c) By applying a constant voltage of 100V, the droplet is driven into the channel in phase I and phase II. (d) Droplet contact angle, θD, vs. its WL velocity, U.

51
The pressure gradient which is developed between the droplet and the liquid in the
channel is utilized for driving the flow. The liquid velocity in the channel V is obtained
from:
V = (PD – PLM) / CµLeff (8)
, where PD and PLM are the Laplace pressures of the droplet and the liquid
meniscus in the channel, respectively, C is a geometrical constant, Leff is the effective
length ( the sum of Lch , orifice length, and other head losses) and µ is the liquid
viscosity. By applying the voltage to the EWOD substrate, an electrical double layer is
formed at the liquid-substrate interface. Similar to a capacitor the fringing electric field at
the edge of the double layer has a component parallel to the substrate which could pull
the double layer forward and therefore reduces θCh and increases the meniscus radius
of curvature. Since the other three channel walls are hydrophobic the decrease in θCh is
not enough to change the meniscus from convex to concave. However the Laplace
pressure in the channel, PLM, will be lower which results in a positive pumping pressure
(Eq. (8)), and the liquid is driven through the microchannel.
The Young-Lippmann’s equation predicts static contact angles of both θCh and θD
[24, 34, 70]. However, a constant value of contact angles θCh and θD results in an
unstable situation in which a slight difference between the channel pressure, PLM, and
the droplet pressure, PD, may drive the droplet into the channel or vice versa (Eq. (8)).
The stable formation of the droplet before applying the voltage in a wide range of
droplet volumes and LCh is not in agreement with the static contact angle predicted in
Young-Lippmann’s equation. The direct observation of contact angles shows that the
contact angle between the liquid, air, and the PDMS surface could change between a

52
highest and a lowest limit (advancing, θA, and receding, θR, contact angles respectively)
due to the surface pinning induced by the defects on the surface [26] (Fig. 20d). In fact,
the contact angle adjusts itself to resist the motion until it reaches either the lower or the
higher limit. The pinning effect could explain the stability of the droplet before actuation.
In order to accommodate this effect to justify the observations, the three-phase WLE
should also be considered in Young-Lippmann’s equation [26].
4.3 Wetting line velocity effect on micropump
In addition to the WLE, which explains the contact angle variation for a constant
wetted area (phase I, Fig. 20b), the contact angle also depends on the velocity of the
WL [27], when the wetted area is changing (phase II, Fig. 20c). The WL velocity is the
rate at which the liquid WL with the substrate (in the case of the droplet, the circular line
of the droplet’s outer edge) moves on the solid surface.
When the drop is formed on top of the orifice its WL is advancing and θD is on the
advancing region of Fig. 20d. As it becomes larger its WL velocity, U, decreases and θD
is reduced to θA, which in this case is 100°. Ample time is given to the droplet for
relaxation before starting the micropump (applying the voltage) during which θD
decreases from 100° to 86°. By applying the voltage, the droplet flows into the channel
and θD decreases from 86 to θR which in this case is 80° (phase I in Fig. 20d).
The pinning effect is also present inside the channel, evident by repeated short
stops of the flow when the voltage is low. However, by increasing the voltage the
pinning effect inside the channel decreases. The pinning effect becomes negligible at a
working voltage of 100V, and the flow rate is stabilized.

53
Phase I ends when θD reaches 80° and for smaller contact angles, the droplet
wetted area starts to shrink. In phase II the droplet wetted area is decreasing and θD is
below θR. The magnitude of U increases as the droplet shrinks and the higher velocity
results in a lower θD (phase II in Fig. 20d).
For a shrinking droplet with a constant θD the radius of curvature, R, is shrinking.
However for a shrinking droplet with a constant wetted diameter, a, and decreasing θD,
R increases. In phase II both the wetted diameter and θD are decreasing which have
opposite effects on R. We have observed that in overall R in phase II is decreasing. The
flow stops at the end of phase II when the droplet reaches the orifice.
4.4 EWOD voltage effect on micropump flow rate
In a second set of experiments, the low pinning regime (region III in Fig. 18b) was
more closely studied by changing the micropump working voltage from 60V to 100V.
The EWOD based micropump depicted in Fig. 6 was used as the test setup. An input
droplet with an initial size of 1 mm was used for the measurements at different voltages.
By applying the voltage the droplet was driven into the channel. The liquid meniscus
position in the channel was measured versus time for each voltage (Fig. 21a, b).
Interestingly, the flow rate at low voltages (60V<V<100V) is completely nonlinear
(Fig. 21b) and it changes drastically at different meniscus position inside the channel.
This behavior is due to surface defects (located randomly inside the channel) which
increase the contact angle and therefore reduce the flow rate. The influence of such
defects seems to be lessened for higher voltages (e.g. at 100V) and hence such
voltages are needed as the working voltage of the micropump, if a constant flow rate is
desired. The meniscus position inside the channel versus time for different voltages are

54
calculated by a model based on WLE and WLV effects. This is discussed in more
details in chapter 5.
Fig. 21 EWOD voltage effect on flow rate (a) Top view pictures of the micropump’s channel taken in every second show the advancing meniscus at 100V. (b) The micropump’s meniscus position versus time for different voltages.

55
CHAPTER 5: MICROPUMP FLOW RATE ANALYSIS
Some of the materials used in this chapter have been previously published by
Springer: R. Shabani and H. J. Cho, “Flow rate analysis of an EWOD based device:
how important are wetting line pinning and velocity effects?”, Microfluidics and
Nanofluidics, 2013, DOI: 10.1007/s10404-013-1184-y.
5.1 Introduction
In this chapter, a combined theoretical/experimental approach based on continuity
and energy equations is developed to study a continuous flow induced by EWOD
micropump demonstrated in chapter 2. An input droplet was used as a positive
pressure source. By applying the voltage the contact angle is reduced at the bottom of
the channel which results in a lower Laplace pressure inside the channel. Therefore, a
positive pressure gradient is produced between the droplet and the meniscus. The
droplet’s WL recedes as it shrinks into an orifice leading to the channel. The WL pinning
and the WL velocity effects, discussed in chapter 3, need to be taken into account to
describe the dynamic contact angles at the WLs: (i) the droplet’s receding WL, (ii) the
advancing WLs of the liquid meniscus on the upper and side walls of the channel, and
(iii) the advancing WL at the bottom of the channel with a reduced contact angle due to
EWOD. These two effects are crucial to developing a physically-relevant model for the
flow rate analysis (for more details see the discussion in chapter 4). This is due to the
fact that the accurate estimation of the contact angles is necessary to calculate the
induced droplet/meniscus pressure gradient [37], and subsequently the micropump’s
flow rate.

56
5.2 Experimental assumptions
The EWOD substrate of the micropump consists of a silicon wafer spin-coated
with a stack of three thin films of (i) polydimethylsiloxane (PDMS), (ii) spin on glass
(SOG) and (iii) a second layer of PDMS, (Fig. 6). Silicon wafer is a conductive layer.
SOG is an insulating layer with a thickness of 0.2µm and a dielectric constant of 3.9 (Pai
1987; Wang et al. 1997). The first PDMS layer (on silicon) was found to improve the
quality of the insulating layer by covering the surface defects. The second PDMS layer
is used as a hydrophobic layer with a thickness of 1.1µm. SU-8 mold on a different
silicon wafer was used to cast a microchannel in a PDMS slab (soft lithography). The
PDMS slab was bonded to the EWOD substrate to form a closed channel. A syringe
pump was connected to the microchannel as shown in Fig. 6. The liquid flowed through
the channel and then through a via-hole which has a bigger cross-section compared to
the channel, forming a droplet on top of the orifice. The micropump’s input droplet is
stable with a contact angle of 86°. Only after applying a DC voltage between the silicon
wafer and the steel pin (electrodes) the liquid will flow through the channel.
The input droplet is driven into the channel in two phases. In phase I, the droplet’s
wetting area remains constant until droplet’s contact angle decreases to 80° due to
pinning. Such phenomenon has been also observed for a passive micropump [9]. In
contrast, in phase II, both the droplet’s wetting area and contact angle decrease as the
droplet is driven into the channel. The further decrease in droplet’s contact angle is due
to WL velocity effect [71]. The reported variable droplet’s contact angle on untreated
PDMS surface in chapter 3 is in agreement with the data reported in literature [9, 71].
These results are incorporated in this chapter for the analysis of the micropump
constant flow rate.

57
The measured data for the receding WL (Stage C in Fig. 16b) is used to describe
the variable contact angle of the shrinking droplet versus its WL velocity during the
phase II of the micropump operation [71]. Also the experimental data depicted in Fig.
16c are used for the contact angle on the side and top walls of the channel, θCh in the
flow rate analysis.
The last data needed is the liquid contact angle on the bottom of the channel, θEW,
upon applying a DC voltage of 100V. However, the direct observation of θEW from the
side view of the PDMS channel is not feasible unlike the observation of θCh from the top
view. This is due to non-smooth and opaque surfaces when PDMS was cut on the
sides. Moreover the contact angle calculated by Young–Lippmann’s equation for a
voltage of 100V could not be used since the pinning and WL velocity effect are present
at the bottom of the channel (dynamic θEW at the advancing WL in the channel). Instead,
θEW was considered as a fitting parameter and the validity of values obtained for θEW
were justified by comparing with other experimental data, i.e. the contact angle should
be smaller in the presence of EWOD as compared to θCh.
5.3 Derivation of governing equations
A novel approach for flow rate analysis is introduced by taking a dynamic contact
angle into account in writing energy equation for the system. This is an improvement
over sophisticated commercial software, limited only to equilibrium Young contact angle
[36], based on Young’s equation.
Here we need to highlight that (a) the flow rate inside the channel is a function of
the meniscus contact angle and (b) the contact angles themselves are a function of the
flow rate. Therefore, a self-consistent solution could be obtained only using implicit

58
computational methods. The algorithm for this approach is developed following the
continuity and energy equations and its physical implications are demonstrated. The
proposed algorithm could be fitted to various microfluidic systems with different
geometries for flow rate estimation. A numerical calculation was carried out using
MATLAB. Some of the parameters used in the analysis are shown in the side and top
views of the micropump schematic (Fig. 9a, and b). The micropump driving pressure,
PMP, derived in chapter 2 (Eq. (6)) is repeated below for the readers:
(
(( ) )
)
The total driving pressure in Eq. (6) should be equal to the viscous pressure loss
in the channel, . The channel head loss, hf, is obtained from the Darcy-Weisbach
equation to be ( ) in which f is the friction factor, Leff is the effective
liquid length in the channel (the sum of LCh, orifice length, and other head losses), UCh is
the liquid velocity in the channel, and DH is the hydrodynamic diameter. The DH of the
rectangular channel with a width, w, and a height, h, is equal to ( )⁄ . The
Reynolds number for the flow in the channel with an order of 1mm/s is calculated to be
~0.1 using DH. Thus assuming a laminar flow in the microchannel, the friction factor will
be ⁄ . The relation between the micropump pressure, PMP, and the liquid velocity
in the channel, UCh, is expressed by:
( ( ⁄ ⁄ ) )⁄ (9)
Bond number measures the relative strength of gravity with respect to surface
tension and is defined as ⁄ , where L is the characteristic length scale e.g. the

59
droplet’s radius or the height of the microchannel. The bond number for the droplet with
an order of size of 1mm is small (~0.1) and hence the gravity is neglected throughout
the rest of the analysis.
The capillary number is the ratio of viscous force to the surface tension force
acting across the WL and is defined as ⁄ , where µw is the liquid’s viscosity,
and UCh is the WL velocity. The capillary number is calculated to be much smaller than
unity (~ 10-5) for water’s viscosity of 1mPa.s and surface tension of 72mN/m and an
order of WL velocity of 1mm/s. Thus the surface tension force dominates the inertial
force.
The dimensionless EW number represents the ratio of the electrostatic energy to
the surface tension and is defined as ⁄ , where c is the capacitance of the
EWOD substrate and is calculated to be 10 µF/m2 [80], and V is the applied DC voltage.
The EW number for the EWOD setup is calculated to be 1 for the applied DC voltage of
120V. Therefore for the range of the applied voltages, a substantial contact angle
decrease could be achieved at the WL in the channel.
5.4 Model 1 based on wetting line energy and velocity effects
Eqs. (6) and (9) were implemented to develop an algorithm for flow rate analysis
based on the WLE and WLV effects (Model 1 WLE & WLV). The continuity equation
implies that the rate of the shrinkage of the input droplet is equal to the liquid flow rate in
the channel. The initial θD for the input droplet was assumed to be equal to the relaxed
advancing contact angle at zero voltage which is 86° (Fig. 15b).
In phase I of the micropump, θD changes from 86° to 80° with a constant droplet
wetted area due to the pinning. In Phase II, in which droplet’s WL is receding, the data

60
from Fig. 16b is used to estimate θD for the receding WL of the droplet. The data in Fig.
17 is used to find θCh, in phases I and II for the advancing WL in the channel. The liquid
contact angle on the bottom of the channel, θEW, was obtained by flow rate analysis.
Since in one hand θCh is a function of UCh (Fig. 17) and in the other hand UCh is a
function of θCh (Eqs. (6) and (9)), an implicit approach was used here to calculate θCh
based on the self-consistency of the results. In each time step a guess value for θCh
was chosen, and then UCh was calculated from Eqs. (6) and (9). However, it should be
noted that the assumed θCh and the value obtained for UCh should be in agreement with
the data shown in Fig. 17. Therefore, the initial value for θCh was modified until the
calculated UCh shows a good agreement with the experimental data.
Fig. 22 shows an excellent agreement between the measurement and numerical
values obtained by model 1 (WLE and WLV), using θEW of 82° for an initial droplet size
(2aD) of 1.06 mm. Fig. 22a shows the experimental and calculated values for the radius
of droplet wetted area, aD and droplet contact angle, θD and also calculated values for
droplet radius of curvature, RD, versus time. The transition from phase I to phase II is
marked with vertical dashed line at 4.8 sec. In Fig. 22b, PD and PM are shown as the
droplet is driven into the channel. The droplet pressure decreases in phase I from 271
Pa to a minimum of 267.3 Pa and increases again in phase II. However, the driving
pressure which is the difference between the PD and PM increases monotonically to
overcome the increasing viscous loss. In Fig. 22c the estimated liquid meniscus position
versus time is compared to the measurement data. The calculated data exhibits the
linear behavior as the experimental data.

61
Fig. 22 Model 1 WLE and WLV numerical values for (a) Droplet’s θD, aD, and RD versus time. Measurement data for θD and aD are plotted. (b) PD and PM vs. time. (c) Meniscus position versus time. Circles are the data and solid line is the best fit to the data. Dashed line and dot-dashed line show the effect of a small change in θEW (±1○) on the convergence of the fit.

62
In phase I of micropump operation, θD is reduced (Fig. 22a), resulting in an
increase in RD and subsequently a decrease in the droplet pressure (Fig. 22b).
However, phase II is more complex since both aD and θD are changing (Fig. 22a).
Therefore the change in PD and PM is non-monotonic in phase II. Interestingly, the
meniscus pressure seems to follow the droplet pressure and therefore the driving
pressure of the pump (the difference between PD and PM) remains small over time (Fig.
22b).
This phenomenon is the underlying reason for the constant flow reported for this
micropump. Since the size of the meniscus in the micro-scale channel is much smaller
than the droplet’s free surface, small changes in θCh (±0.1°) could change PM sufficiently
to compensate for the change in PD (Fig. 22b). Therefore, the variation in micropump’s
pressure induced by the shrinking input droplet would result in small variation of
meniscus contact angle. Since θCh and UCh are linked through WL velocity effect, such
small changes in θCh, also imply negligible changes in the liquid velocity in the channel
which explains why the liquid velocity and therefore the flow rate remain nearly
constant. The dynamic contact angle of the meniscus in the channel is the dominant
factor determining the flow rate according to this analysis.
5.4.1 Droplet size effect
The meniscus velocity in the channel is higher for smaller sizes of the droplet [71].
The numerical values obtained by model 1 WLE and WLV are in good agreement with
the experimental data for the meniscus position in the micropump’s channel for different

63
sizes of the droplet (Fig. 23). The analytical fits to the data follow a similar linear
behavior as the experimental data.
Fig. 23 Model 1 WLE and WLV predicting the meniscus position versus time for different diameter of the droplet wetted area, 2aD. Markers are measurement data and solid lines are the best fits to the data.
5.4.2 EWOD voltage effect
In a second set of experiments, the low pinning regime (region III in Fig. 18b) was
more closely studied by changing the micropump working voltage from 60V to 100V. By
applying the voltage the droplet was driven into the channel. The liquid meniscus

64
position in the channel was measured versus time for each voltage (Fig. 24). Since the
location of surface defects cannot be measured inside the channel, any attempt to
model such a complex system could only aim to obtain the effective average flow rates
but not the local values. Fig. 24 shows the experimental and calculated meniscus
positions versus time at different voltages. A better agreement is obtained between the
calculated and the measured data when the EWOD voltage is high enough to suppress
the effect of local surface defects on dynamic contact angle.
Fig. 24 Model 1 WLE and WLV predicting meniscus position versus time for different voltages. Markers are measured data and solid lines are the best fits to data.
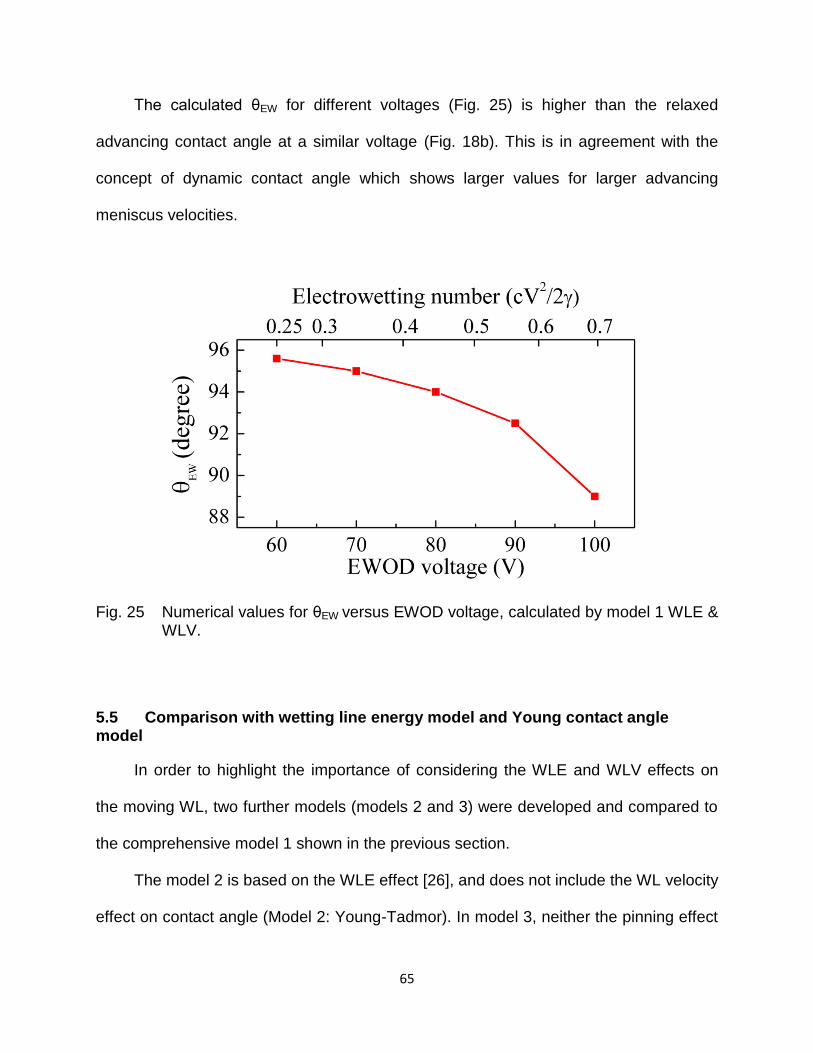
65
The calculated θEW for different voltages (Fig. 25) is higher than the relaxed
advancing contact angle at a similar voltage (Fig. 18b). This is in agreement with the
concept of dynamic contact angle which shows larger values for larger advancing
meniscus velocities.
Fig. 25 Numerical values for θEW versus EWOD voltage, calculated by model 1 WLE & WLV.
5.5 Comparison with wetting line energy model and Young contact angle model
In order to highlight the importance of considering the WLE and WLV effects on
the moving WL, two further models (models 2 and 3) were developed and compared to
the comprehensive model 1 shown in the previous section.
The model 2 is based on the WLE effect [26], and does not include the WL velocity
effect on contact angle (Model 2: Young-Tadmor). In model 3, neither the pinning effect

66
nor the WL velocity effect was considered and the contact angle was assumed to be
equal to the equilibrium Young contact angle (Model 3: Young). The assumptions and
the contact angle values for each model are reported in Table 2 for comparison.
Table 2 Experimental assumptions and dynamic contact angles for models
Assumptions θ
D (Phase I) θ
D (Phase II) θ
Ch θ
EW
Model 1 Comprehensive
(WLE & WLV)
86°→80°
(aD CONST)
Fig. 16b Fig. 17 82°
Model 2 Young-Tadmor
(only WLE)
86°→80°
(aD CONST)
80° 100° 88°
Model 3 Young equation
(Young contact angle)
86° 86° 86° 109°
The numerical values for the liquid meniscus position in the channel for an initial
diameter of the droplet wetted area, 2aD, of 1.06 mm are plotted for model 1(Fig. 22c)
and for models 2 and 3 (Fig. 26a and b respectively). The values obtained for the θEW,
for models 1 to 3, are tabulated in Table 2. In model 3 based on equilibrium Young
contact angle (Fig. 26b), a large gap exists between the measured and the predicted
flow rate [29, 39]. Model 2 provides a better fit to measured data (Fig. 26a) as compared
to the model 3 by taking to account the pinning effect. The predicted flow is significantly
improved by including the WL velocity effect in model 1 (Fig. 22c). The sensitivity of the
calculations to θEW is also investigated. In model 1, if θEW is changed by 1°, the
estimated flow in the channel will slightly vary, while maintaining its linear behavior (Fig.
22c), unlike models 2 and 3 which are very sensitive to small changes in θEW (Fig. 26b,
c). This also shows the accuracy of the estimated θEW by model 1. It is expected that the

67
contact angle is reduced at the bottom of the channel due to EWOD [70]. The value
obtained for θEW (82○) is reasonable since it should be smaller than, θCh, with a value of
104°, due to EWOD.
Fig. 26 Meniscus position versus time for (a) Model 2 (Young-Tadmor) and (b) Model 3 (Young). Circles are measurement data and solid lines are the best fits to the data. Dashed lines and dot-dashed lines show the effect of a small change in θEW on the convergence of the fit.

68
Although the comprehensive model 1 utilizes several nonlinear experimental
equations, its estimation of flow rate provides an excellent agreement with the observed
constant flow rate. Such comparison shows the importance of taking both the WLE and
the WLV effects into account for an accurate and realistic flow rate analysis.

69
CHAPTER 6: DROPLETS ON LIQUID SURFACES AND TRIPLE CONTACT LINE
Some of the materials used in this chapter have been previously published by
American Institute of Physics: R. Shabani, R. Kumar, and H. J. Cho, “Droplets on liquid
surfaces: dual equilibrium states and their energy barrier”, Applied physics Letters, 102,
184101, 20132013.
6.1 Introduction
The formation of floating aqueous droplets on the free surface of immiscible liquids
has application in digital microfluidic devices [49], as well as material transportation and
mixing in lab on a chip [50, 51]. The floating non-coalescent (NC) water droplets were
first observed by Reynolds on the water’s free surface [55]. Although describing the
floating droplet has been of interest, to our knowledge a general solution has not been
provided for the dual equilibrium states [51, 59, 60]. Further, while the non-coalescence
of a droplet on the free surface of the same liquid is widely studied, the studies using
immiscible liquids are scarce.
6.2 Stable configurations of floating droplets
An oil phase (FC-43, 3M) at 25οC with a surface tension, γoa, of 16 mN/m and a
density, ρo, of 1860 kg/m3 was used as a base medium for formation of floating droplets.
A droplet of water at room temperature (25οC) with a density, ρw, of 997 kg/m3 was
released on the free oil surface using a high precision needle connected to a syringe

70
pump. The water droplets are released due to a gravity driven pinch-off from the tip of
the needle [60]. The stable configuration of the droplet at the air-oil interface depends
on the height from which the droplet is released and the surface tension of the three
phases. If the droplet is released from within a range of height, it will not rupture the free
surface as it does not have sufficient momentum. Instead, it will rest on the stretched
free surface which is deformed by the weight of the NC droplet (Fig. 27a, c).
Fig. 27 Stable configurations of aqueous droplets at oil-air interface: (a) NC droplet resting on a stretched and deformed free surface (b) C/B droplet with TCL (c, d) the effect of the droplet size on the deformation of the free surfaces.
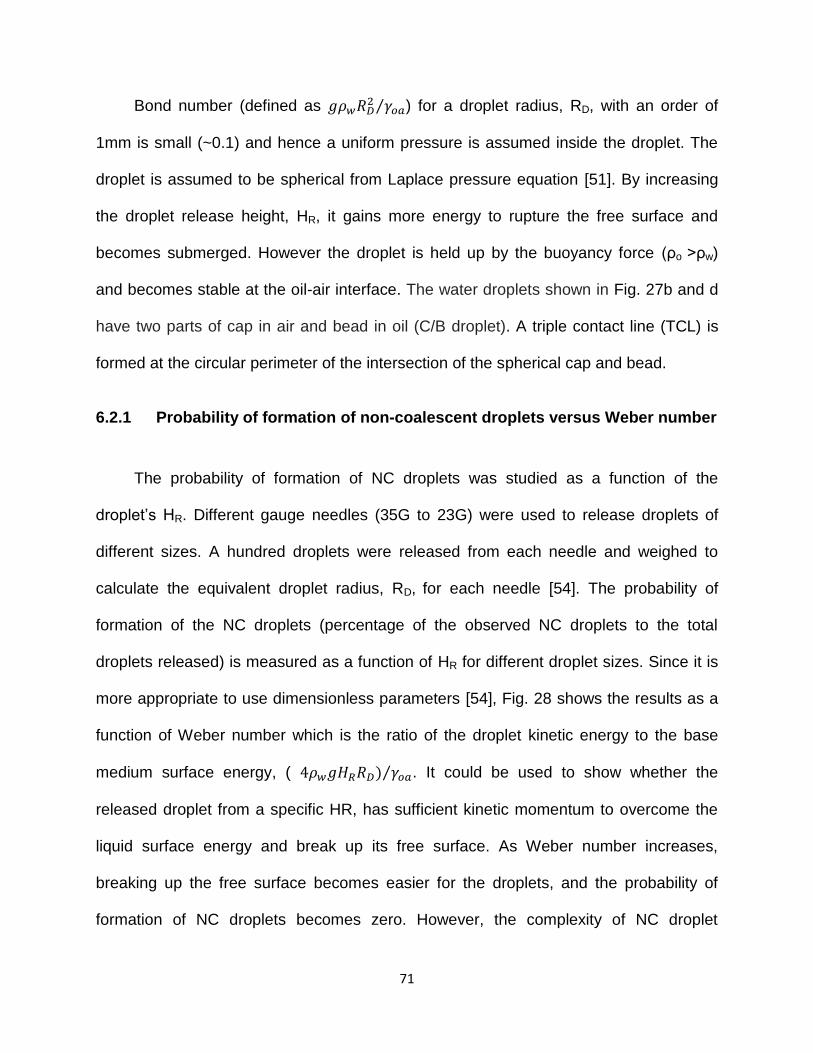
71
Bond number (defined as ⁄ ) for a droplet radius, RD, with an order of
1mm is small (~0.1) and hence a uniform pressure is assumed inside the droplet. The
droplet is assumed to be spherical from Laplace pressure equation [51]. By increasing
the droplet release height, HR, it gains more energy to rupture the free surface and
becomes submerged. However the droplet is held up by the buoyancy force (ρo >ρw)
and becomes stable at the oil-air interface. The water droplets shown in Fig. 27b and d
have two parts of cap in air and bead in oil (C/B droplet). A triple contact line (TCL) is
formed at the circular perimeter of the intersection of the spherical cap and bead.
6.2.1 Probability of formation of non-coalescent droplets versus Weber number
The probability of formation of NC droplets was studied as a function of the
droplet’s HR. Different gauge needles (35G to 23G) were used to release droplets of
different sizes. A hundred droplets were released from each needle and weighed to
calculate the equivalent droplet radius, RD, for each needle [54]. The probability of
formation of the NC droplets (percentage of the observed NC droplets to the total
droplets released) is measured as a function of HR for different droplet sizes. Since it is
more appropriate to use dimensionless parameters [54], Fig. 28 shows the results as a
function of Weber number which is the ratio of the droplet kinetic energy to the base
medium surface energy, ( ) ⁄ . It could be used to show whether the
released droplet from a specific HR, has sufficient kinetic momentum to overcome the
liquid surface energy and break up its free surface. As Weber number increases,
breaking up the free surface becomes easier for the droplets, and the probability of
formation of NC droplets becomes zero. However, the complexity of NC droplet

72
formation could not be captured by We number only. Fig. 2 shows that for a similar
Weber number the probability increases as RD decreases. This is due to the fact that
Weber number compares the droplet kinetic energy with the surface energy of the base
medium, which is not the only obstacle that a falling droplet faces to break the surface.
Other energy terms such as the gravitational potential energy of the displaced base
medium and energy used for wave formation should be taken into account as discussed
in the next section.
Fig. 28 The probability of formation of NC droplets versus Weber number obtained for different droplet’s radii, RD.
For each droplet size there is a transition region, in which the probability of forming
NC droplets changes from 100% to 0% by increasing HR (Fig. 28). This transition region

73
is wider for higher RD and becomes sharper as RD decreases. NC droplet formation in
transition region shows a statistical nature which is more pronounced for larger droplets.
This might be understood in terms of wave energy dissipation and the time required for
damping the initial oscillation of droplet surface upon pinching off from the needle. While
a small droplet quickly attains its stable shape (spherical) the lager droplet may not
have enough time to dissipate the facial waves which may affect the NC to C/B
transition.
Here it should be mentioned that even the droplets that survive the first impact and
stay on the surface (NC droplets), will at some point coalesce with the oil surface and
sink down to C/B configuration [54, 55]. This observation demonstrates that the latter
has a lower energy and thus is more favorable while the NC configuration is metastable.
6.2.2 Non-coalescence of droplets due to thin film of air
Several studies have been focused on the physical origin of NC droplets in
different experimental setups with inclined or horizontal free surfaces of base mediums
and also various surrounding mediums with different surface tensions, densities and
viscosities [51, 54-58, 81]. A thin film of air between the droplet and the free surface is
believed to be responsible for the formation of NC droplets by preventing the two liquids
to wet [54, 81-84].
The existence of such film has been confirmed in literature using different methods
such as the mirror-like reflection, an infinite electrical resistance [85], and no material
transfer between the droplet and the base medium [54]. This is also obvious in the case
of miscible liquids in which the droplet should make contact and mix with the base

74
medium if there was no air gap between them. The air layer thickness was reported to
be about 10μm [51, 85], much larger than the van der Waals attraction range
(10nm)[54]. The air film’s slow drainage postpones droplet coalescence [82], due to the
lift generated by the lubrication effect of the flowing air film [57]. However, the effect of
the air film is merely limited to separating the two surfaces and it does not bring any
external forces into the system. At last the purity of the base liquid’s free surface and
the surrounding medium from dust particles is essential in stability of the NC droplets
[55, 56].
6.3 Energy analysis and prediction of stable equilibrium states
Energy analysis was done separately for two observed configurations, since the
transition from NC to C/B is not continious and the energy is not a well behaved function
during the transition. Therefore, two different sets of parameters were defined to
describe the geometries of the two observed configurations (Fig. 29a, b).

75
Fig. 29 Physical and geometrical parameters used in energy analysis of (a) NC droplet and (b) C/B droplet configurations.
The ratio of the radii of curvature of the cap and bead (Rcap and Rbead respectively)
is proportional to the ratio of surface tension of water in contact with air and oil (γwa and
γwo respectively) due to uniform Laplace pressure in the droplet [49]. γwa and γoa are
known to be 72mN/m and 16mN/m respectively at 25οC. The Interfacial tension
between water and FC-43, γwo was estimated to be ⁄ using a method
shown by Fox [86]. The three surface tension satisfy the Neumann’s inequalities, which
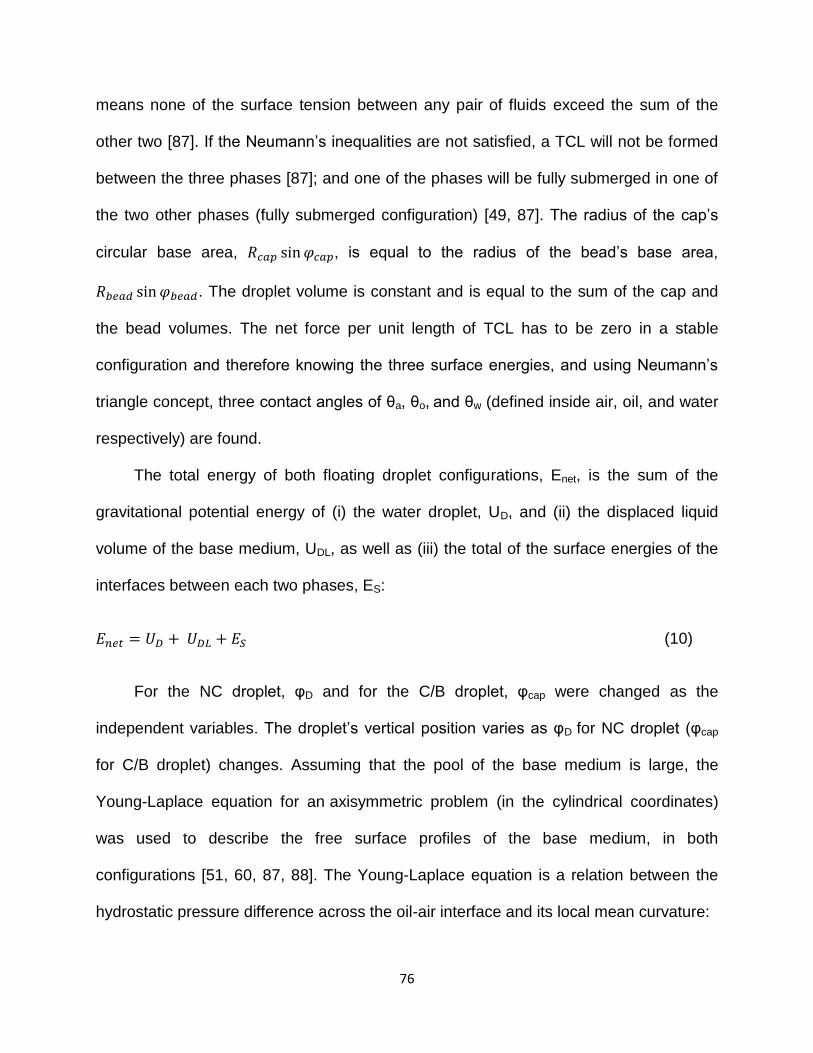
76
means none of the surface tension between any pair of fluids exceed the sum of the
other two [87]. If the Neumann’s inequalities are not satisfied, a TCL will not be formed
between the three phases [87]; and one of the phases will be fully submerged in one of
the two other phases (fully submerged configuration) [49, 87]. The radius of the cap’s
circular base area, , is equal to the radius of the bead’s base area,
. The droplet volume is constant and is equal to the sum of the cap and
the bead volumes. The net force per unit length of TCL has to be zero in a stable
configuration and therefore knowing the three surface energies, and using Neumann’s
triangle concept, three contact angles of θa, θo, and θw (defined inside air, oil, and water
respectively) are found.
The total energy of both floating droplet configurations, Enet, is the sum of the
gravitational potential energy of (i) the water droplet, UD, and (ii) the displaced liquid
volume of the base medium, UDL, as well as (iii) the total of the surface energies of the
interfaces between each two phases, ES:
(10)
For the NC droplet, φD and for the C/B droplet, φcap were changed as the
independent variables. The droplet’s vertical position varies as φD for NC droplet (φcap
for C/B droplet) changes. Assuming that the pool of the base medium is large, the
Young-Laplace equation for an axisymmetric problem (in the cylindrical coordinates)
was used to describe the free surface profiles of the base medium, in both
configurations [51, 60, 87, 88]. The Young-Laplace equation is a relation between the
hydrostatic pressure difference across the oil-air interface and its local mean curvature:

77
[ ⁄
( ( ⁄ ) ) ⁄
⁄
( ( ⁄ ) ) ⁄] (11)
,where y and r are the height and the radial distance of a point on the free surface
profile in cylindrical coordinates (Fig. 29a, b).
6.3.1 Calculation of liquid free surface profile
In the NC droplet configuration, an inflection point on the free surface profile exists
in which its second derivative, , changes its sign from positive to negative as r
increases. Since the lower part of the droplet’s profile with a radius of RD, has a
positive , it starts to loose contact with the free surface’s profile at this point (Fig. 30a).
The droplet’s inflection angle, φD measures the angle between the bottom of the droplet
and the inflection point (Fig. 30a). The depth of the inflection point from the height of the
free surface (far from the droplet) is h. In the C/B droplet configuration, the TCL’s height
from the height of the free surface is h (Fig. 30b). The cap angle, φcap, is the angle
measured from the cap’s top point to TCL. An iterative procedure in a MATLAB code
was utilized to find the key parameter of h for both configurations using Eq. (11) with the
boundary conditions shown in Fig. 30.
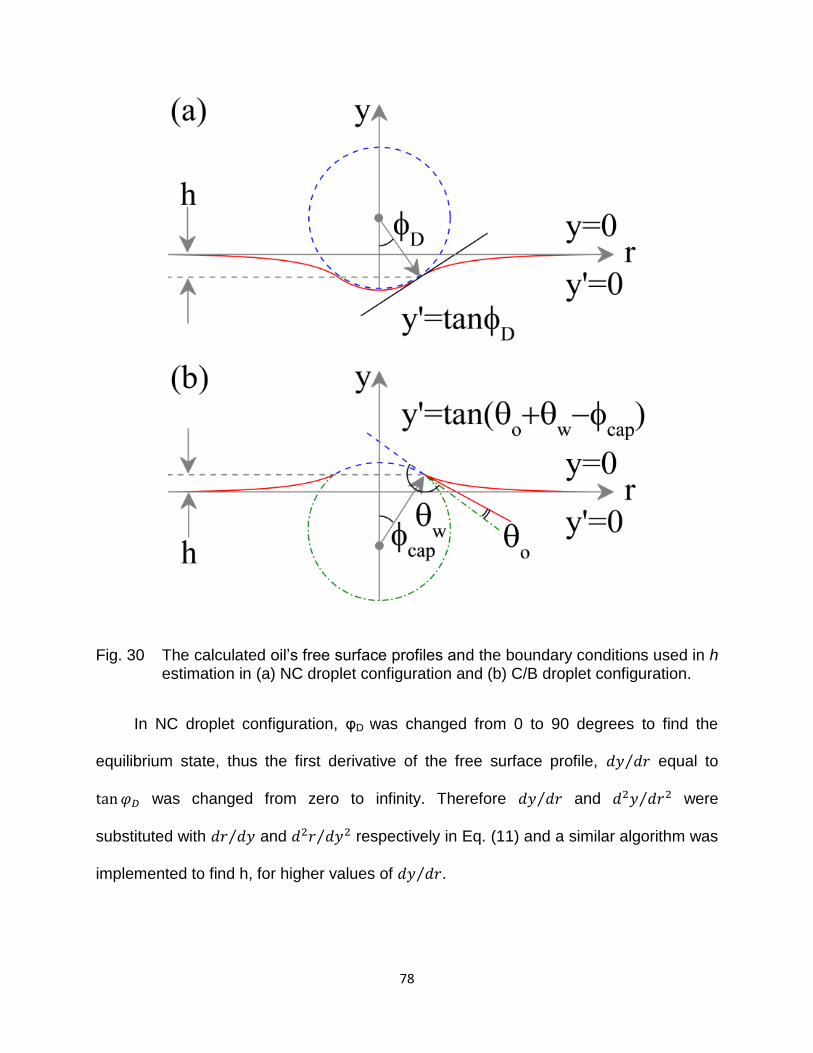
78
Fig. 30 The calculated oil’s free surface profiles and the boundary conditions used in h estimation in (a) NC droplet configuration and (b) C/B droplet configuration.
In NC droplet configuration, φD was changed from 0 to 90 degrees to find the
equilibrium state, thus the first derivative of the free surface profile, ⁄ equal to
was changed from zero to infinity. Therefore ⁄ and ⁄ were
substituted with ⁄ and ⁄ respectively in Eq. (11) and a similar algorithm was
implemented to find h, for higher values of ⁄ .

79
6.3.2 Droplet’s size effect on liquid surface deformation
Using the calculated profile of the free surface, the area of the deformed oil-air
interface and the volume of the displaced base medium and finally Enet are calculated.
As expected, the energy analysis predicted a minimum of Enet (equilibrium state) for
each configuration. The MATLAB code outputs were imported to Pro/E to generate the
three-dimensional images of a floating droplet at the oil-air interface in both equilibrium
configurations. These images depicted in Fig. 31 show good agreement with the
pictures taken from floating droplets with similar sizes, for both configurations in Fig. 27.
As expected, smaller droplets deform the surface to a less extent as compared to larger
ones (Fig. 31c, d). φD for NC droplets and φcap for C/B droplets were measured for RD of
0.9mm to 1.4mm (needle gauges of 35G to 23G). A good agreement between the
experimental data and the values predicted by energy analysis were obtained (Fig.
31e). The gravity contribution as compared to that of the surface tension force becomes
negligible at small droplet size limit (RD 0), due to the scaling effect. Therefore the
energy analysis results in φD=0, for a NC droplet but a non-zero φcap, for a C/B droplet
(π-θa) when RD approaches zero.
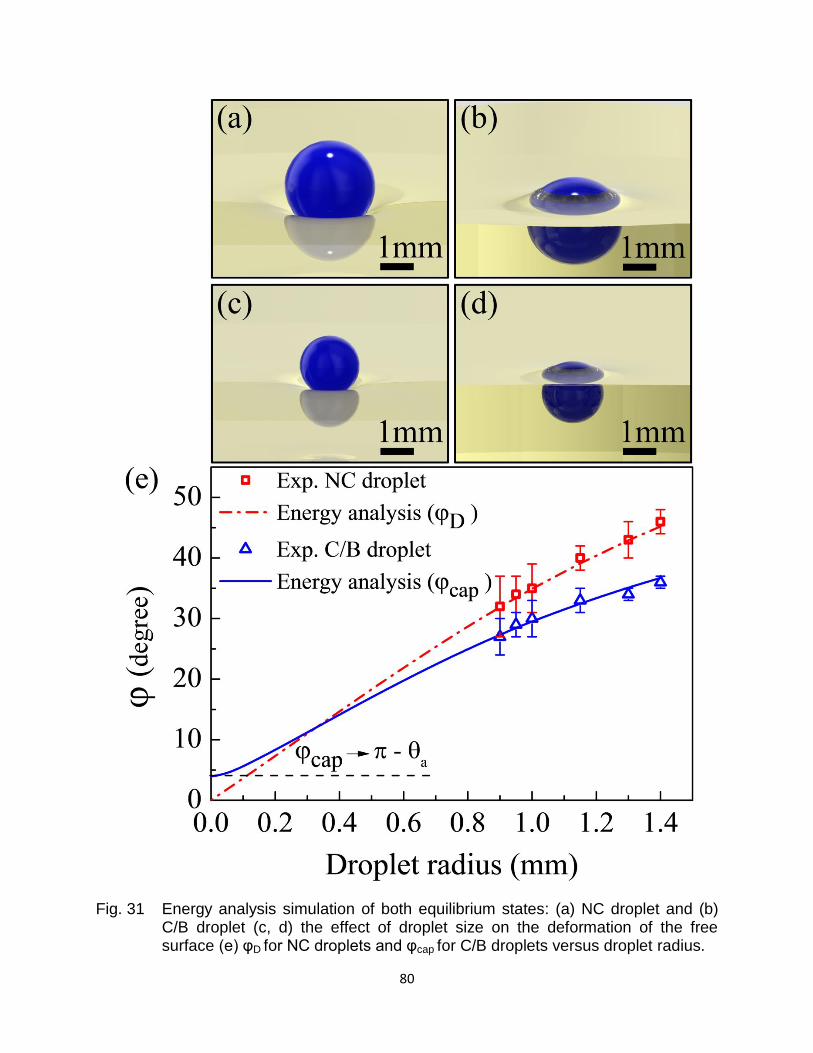
80
Fig. 31 Energy analysis simulation of both equilibrium states: (a) NC droplet and (b) C/B droplet (c, d) the effect of droplet size on the deformation of the free surface (e) φD for NC droplets and φcap for C/B droplets versus droplet radius.

81
6.3.3 Force analysis
To further confirm the results obtained by energy analysis, force analysis was also
conducted [89, 90]. The states of the droplet in different vertical positions are called the
mechanically enforced stationary states and could be achieved by using a hypothetical
external force which could compensate for the net vertical force acting on the droplet
[89, 90]. A mechanically enforced state is an equilibrium state only when the external
force needed to achieve a stationary state is zero. For a floating droplet in a stable
equilibrium state with the minimum Enet, the net force exerted on the droplet, Fnet must
be zero. Fnet consists of the weight of the droplet, FW, the buoyancy force, FB, and the
surface tension force, FS.
(12)
The surface tension force is exerted on a NC droplet from the stretched free
surface along a circular line passing through the inflection point (Fig. 32a). In case of
C/B droplet the surface tension force is exerted on the droplet from the deformed free
surface along the TCL (Fig. 32b). The buoyancy forces for NC and C/B droplets were
obtained by calculating the displaced oil volumes (grey parts of the droplets in Fig. 32a
and b respectively).
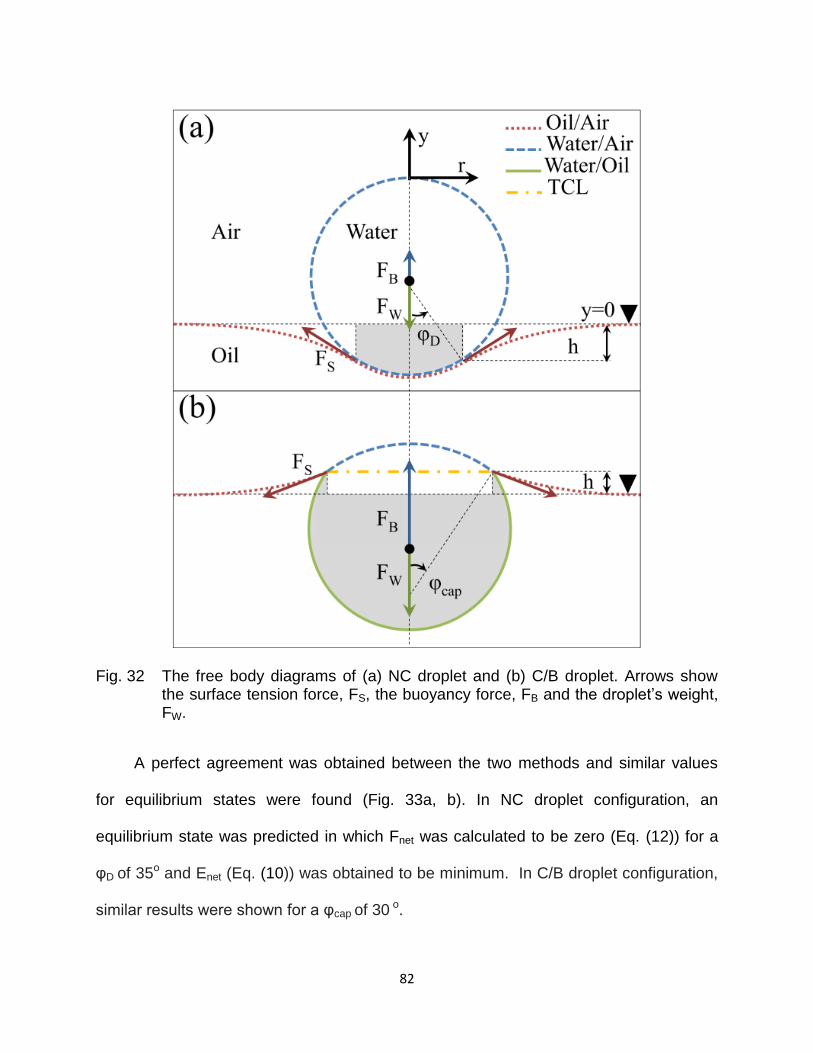
82
Fig. 32 The free body diagrams of (a) NC droplet and (b) C/B droplet. Arrows show the surface tension force, FS, the buoyancy force, FB and the droplet’s weight, FW.
A perfect agreement was obtained between the two methods and similar values
for equilibrium states were found (Fig. 33a, b). In NC droplet configuration, an
equilibrium state was predicted in which Fnet was calculated to be zero (Eq. (12)) for a
φD of 35ο and Enet (Eq. (10)) was obtained to be minimum. In C/B droplet configuration,
similar results were shown for a φcap of 30 ο.

83
Fig. 33 Enet and Fnet for a droplet with RD of 1mm plotted for (a) φD for NC droplet and (b) φcap for C/B droplet.
6.4 Estimation of energy barrier between dual equilibrium states
As it was mentioned before if the droplet’s kinetic energy is not enough to
puncture the oil surface it will form the NC configuration. Interestingly, the energy
analysis could be utilized to estimate the energy barrier that the droplet should

84
overcome to puncture the surface and reach the more stable C/B configuration. Enet
divided by droplet’s weight, wD was plotted versus the height of the center of the mass
of the droplet from the free surface, hc (Fig. 34a). The energy reference point was
chosen as state I in which the droplet is right on top of the free surface without
deforming the oil-air interface. If the droplet has enough kinetic energy it will pass the
first equilibrium point (state II) and reach the largest possible surface deflection (state III
in Fig. 34b) where φD is 90ο (supporting surface tension force, FS, is vertical).
After this point the droplet breaks the oil surface and sinks to state IV in C/B
configuration. Finally by dissipating the extra energy in a damped oscillation between
states IV and VI, it will settle down in the more stable state V (Fig. 34c). Therefore the
energy barrier to achieve C/B configuration is the energy difference between state III
and state I. The highest release height for which the NC droplets are formed with a
probability of 100%, HR,1, should be equal to Enet of state III divided by wD (Fig. 34a).

85
Fig. 34 The transition between the floating droplet’s stable equilibrium states with a RD of 1mm (a) Enet divided by wD versus hc (b) NC droplet in states I to III (c) C/B droplet in states IV to VI.

86
However, by correlating the calculated HR,1 with the measured HR,1 for different RD
(Fig. 35), it was found that consistently a lower value is obtained as compared to the
experiment. Since the calculated value is the theoretical upper limit, the higher value
obtained in experiment shows that other phenomena resulting in energy dissipation
should be considered [84]. The formation of capillary waves at the oil surface, and also
the longitudinal waves inside the base medium created by the droplet impact could
carry away part of the droplet’s kinetic energy [81, 85].
Fig. 35 Highest release height to form NC droplets with a probability of 100%, HR,1, for different droplet’s radius, RD.
Interestingly, it was found that the thickness of the oil base affects HR,1 which not
only confirms the creation of waves but also shows that the reflection from the bottom of
the container may affect HR,1. Therefore in this study a thick layer of oil was used where
the reflected wave has no effect on the stability of the droplets. Further study is required
to investigate the wave reflection phenomena.
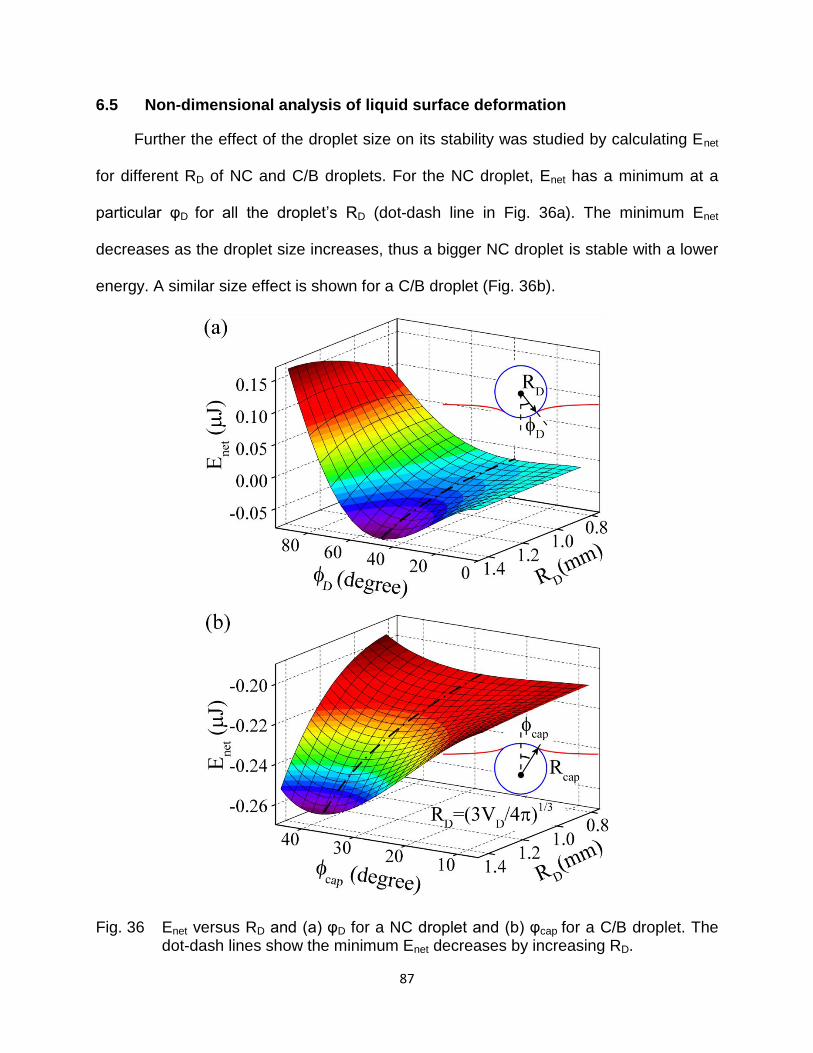
87
6.5 Non-dimensional analysis of liquid surface deformation
Further the effect of the droplet size on its stability was studied by calculating Enet
for different RD of NC and C/B droplets. For the NC droplet, Enet has a minimum at a
particular φD for all the droplet’s RD (dot-dash line in Fig. 36a). The minimum Enet
decreases as the droplet size increases, thus a bigger NC droplet is stable with a lower
energy. A similar size effect is shown for a C/B droplet (Fig. 36b).
Fig. 36 Enet versus RD and (a) φD for a NC droplet and (b) φcap for a C/B droplet. The dot-dash lines show the minimum Enet decreases by increasing RD.

88
Based on the force and the energy equations (Eq. (10) and (12)) two non-
dimensional parameters of ⁄ and the inverse of Bond number, , were
introduced. The non-dimensional ⁄ , is calculated by the energy analysis and
plotted versus the two non-dimensional groups of parameters (Fig. 36c). This parameter
represents the deformation of the free surface, which as expected is less for larger
and ⁄ .
Fig. 37 Oil’s free surface deformation factor, hc/RD, versus the non-dimensional parameters of Bo-1 and ρo/ρw obtained from the force balance and energy equations.

89
CHAPTER 7: CONCLUSIONS
In this dissertation, both experimental and theoretical studies were conducted to
explain physical phenomena observed at an interface formed between two fluids and a
solid phase (wetting line), and an interface between three fluids (triple contact line).
In the first part of this dissertation, the pressure gradient induced between the
droplet and the meniscus in the channel was used to design a micropump with no
moving parts and the fabricated device itself was used as a test platform to study
various interfacial phenomena. Altering the surface tension by changing the electric
potential in EWOD (electrowetting on dielectric) was introduced as an efficient method
for flow regulation, which provides on demand flow on/off capability. The micropump
was made using one mask fabrication process and could be operated at preset
voltages. The EWOD substrate was evaluated using four parameters: capacitance,
hysteresis contact angle, saturation contact angle, and onset voltage. The non-
mechanical valving method based on switching EWOD voltages and the on-demand
pumping method with respect to various droplet sizes were proposed and explained.
The predicted driving pressure from the EWOD valve model was correlated to the
measured data for the liquid flow rate in the channel. The developed micropump is
simple in its design and fabrication and yet provides the on-demand supply function with
much desired features such as short response time, low power consumption, no fluid
leakage, no dead volume, disposability and biocompatibility.
A model based on the forced wetting was developed for explaining the behavior of
the actuated input droplet. In the first phase the droplet wetting area is constant while
contact angle is decreasing and in the second phase the droplet contact angle and the

90
wetting area are decreasing simultaneously. A systematic approach was utilized to
show the importance of taking account of the dynamic contact angle and explain the
behavior of microfluidic devices that involve a moving WL. Dynamic contact angles
observed in both the source droplet and the meniscus inside the microchannel of the
EWOD pump were studied. Further, the WL-related phenomena were comprehensively
studied, since the device performance was strongly affected by contact angle
hysteresis, WLV effect, and EWOD.
Some of the major experimental findings were as follows: (1) a mode switch in
micropump operation originates from the contact angle hysteresis; (2) the dynamic
contact angle based on the magnitude and direction of WLV in a microscale channel is
responsible for constant flow rate; (3) EWOD reduces the contact angle for voltages
larger than an onset voltage and its effect saturates at higher voltages, and (4) EWOD
could reduce the pinning effect using DC voltages.
A flow rate analysis of the EWOD micropump, based on the continuity and energy
equations by implementing the aforementioned experimental observations,
was conducted. The predicted flow rate was in excellent agreement with the measured
constant flow rate of the micropump.
The lower pinning effect at higher working voltages leads to a relatively higher and
constant flow measured in the channel. The effect of EWOD voltage on the flow rate
was modeled, and the numerical values obtained by comprehensive model, based on
WLE and WLV effects, for the dynamic θEW were verified against the relaxed advancing
contact angles at a similar voltage.

91
Simpler models, based on Young’s equation (equilibrium Young contact angle)
and Young–Tadmor equation (incorporating the pinning effect on contact
angle) were developed for comparison. They showed disagreement between
the numerical and measured flow rates, and resulted in an unphysical behavior for the
system. Such examples demonstrate the importance of inclusion of the
aforementioned wetting-line energy and wetting-line velocity effects to
accurately model the flow rate, in particular for the micropump investigated in our study,
and in general for any devices utilizing the Laplace pressure gradient.
In the second part of this dissertation, the interface between three fluids was
studied, by forming floating droplets on liquid free surfaces, and the relevant physical
phenomena are described.
Floating aqueous droplets were formed at oil-air interface and two stable
configurations of (i) non-coalescent droplet and (ii) cap/bead droplet were observed.
General solutions for energy and force analysis were obtained for both configurations,
and were shown to be in good agreements with the experimental observations. The
energy barrier obtained for transition from configuration (i) to (ii) was correlated to the
droplet release height and the probability of non-coalescent droplet formation. It was
shown that energy dissipation through wave phenomena should be taken into account.
Based on the force and the energy equations two non-dimensional parameters of
ρo /ρw and the inverse of Bond number, Bo-1, were introduced. A general solution was
developed for the dual equilibrium states of the floating droplets. Also the transition
region for the probability of formation of non-coalescent droplets as a function of Weber

92
number was shown. A dimensionless parameter was defined to represent the oil free
surface deformation and was calculated by the energy analysis.
The data represented by non-dimensional groups of parameters could be used as
a guideline to design experiments to form various sizes of floating droplets for the
effective droplet manipulation.
Future work
The EWOD micropump devised in this work, could be used as a key component in
handling small amount of aqueous samples. Its ability to work with small input droplets
makes it suitable for application in the field of analytical chemistry, biology and medicine
in which a limited amount of dose needs to be supplied with good accuracy. In some of
the applications, small amounts of biological samples or chemical reagents are
introduced into the chip in the form of an input droplet, for chemical reactions and
biochemical processes such as immobilization, labeling and detection. The features of
the fabricated EWOD based micropump such as low fabrication cost and minimal
mechanical complexity makes it suitable for disposable biochips.
Other techniques for controlling the surface tension could be proposed as a driving
method in droplet based devices for continuous flow in the microchannel due to its
favorable scaling effect. In designing such devices the wetting line phenomena which
were comprehensively studied in this work could work as a guideline to find the
appropriate range of the change in surface tension for inducing the flow. Such methods
for controlling the surface tension include a temperature gradient in thermocapillary and
an electric potential gradient in electrocapillary. The ability to control the surface

93
wettability could be useful to design various types of flow-on-demand devices for
practical applications.
In one application the EWOD micropump, with its simple design, could be used as
a sample loading component in a disposable biochip. For example, it could be used to
substitute syringe pumps for injecting samples into the plasma separators. Syringe
pump is commonly used to fill the plasma separators with a sample [17-23]. Substituting
it with a small scale disposable micropump is especially important when only limited
amount of samples are available. The EWOD micropump could be easily integrated with
the reported blood plasma separators in literature. The separators based on the
Zweifach–Fung effect [17-19], geometric singularities [20], or large output channel [21,
22], indicate the modular integration with the proposed pump is possible.
Thermocapillary is also used for manipulating floating droplets of biochemical
samples on a liquid substrate for chemical reactions. In this way the temperature
gradient induced in the base medium could be used to drive floating aqueous droplets
formed on the free surface of immiscible liquids for application in digital microfluidic
devices[49], as well as material transportation and mixing in lab on a chip [50, 51]. Thus
the floating aqueous droplets studied in this work, could serve as containers for
encapsulating reagents in biochemical reactions [52]. These micro chemical reactors
have the desired features of low consumption of the analytes, direct access to reaction
products [52], and reduced contamination as compared to the droplets on solid
surfaces. The floating droplets could also be used in sensor application due to direct
contact with the ambient air [53].

94
The general solution obtained in this work, by taking advantage of non-dimension
groups of parameters does not depend on the values of the fluids properties such as
density and surface tension or the droplet size and thus could be applied to different
experimental setups. The data could be used as a guideline to select a combination of
three fluids to form different sizes of floating droplets for droplet manipulation.

95
APPENDIX A: EWOD MICROPUMP FABRICATION
This appendix contains the detailed process steps for the fabrication of EWOD-
based micropump. The device was fabricated in a cleanroom class 1000.
EWOD substrate
1. A 3 inch <100> silicon wafer single side polished was cut in four parts using a
diamond cutter on the direction of the crystal.
2. A quarter of the silicon wafer was rinsed with acetone, then methanol, and finally
with isopropyl alcohol.
3. The wafer was dried using a nitrogen gun and examined under the microscope to
make sure the small fragments of silicon that might have been remained on the wafer
after it was cut are removed.
4. Make an uncured polydimethylsiloxane (PDMS) mixture with a weight ratio of
10:1, by mixing 2 grams of SYLGARD® 184 SILICONE ELASTOMER base with 0.2
grams of its curing agent in a petri dish for several minutes to form a uniform mixture.
The curing agent solidifies the PDMS which is a viscous liquid at room temperature.
Special attention should be given to the corners of the petri dish, since they will remain
liquid after PDMS is cured if the base part was not thoroughly mixed with curing agent.
5. Air bubbles are formed in the PDMS mixture while stirring.
6. Toluene which is a good solvent for PDMS is used to dilute PDMS with a
volumetric ratio of 3:1 in a small glass beaker. Later toluene could be used again to
clean the beaker.

96
7. A spin-coater with a maximum spin rate of 6000 RPM was used for spin coating
the diluted PDMS on the quarter wafer. The spin-coater chamber is covered with
aluminum foil to avoid contamination of its wall with PDMS (Cleaning PDMS off the
spin-coater could be cumbersome!)
8. The spin-coater is programmed for 6000RPM for 10 minutes.
9. The optional step of two minutes baking on hot plate at 200οC is used to
completely remove water from the wafer.
10. The quarter wafer is placed on the stage of a spin coater after it is cooled down
and it’s centered on the stage to have a relatively balanced rotation.
11. The vacuum is turned on to hold the quarter wafer in its place.
12. The Diluted PDMS is poured on the wafer and the spin-coating is run.
13. The sample is placed on the hot plate for baking at 90C for 10 minutes.
14. The sample is placed on the spin-coater after it’s cooled down.
15. Spin-on glass (SOG) is coated on the sample at 3000 RPM for 40 seconds.
16. Sample is baked on hotplate at 200οC for 1 minute to remove the solvents from
SOG.
17. Repeat steps 10 to 13 to form a second PDMS thin film.
SU-8 2050 mold fabrication
18. A 3 inch <100> silicon wafer single side polished was rinsed with acetone, then
methanol, and finally with isopropyl alcohol (IPA).
19. The wafer was dried using a nitrogen gun

97
20. Five minutes baking on hot plate at 200οC is used to dehydrate the wafer
surface.
21. Cover the spin-coater chamber with aluminum foil before spin coating.
22. Center the silicon wafer on spin-coater stage and turn on the vacuum.
23. Pure small amount of SU-8 2050 photoresist on the center of the wafer. 1 mL of
resist per inch of wafer diameter.
24. Run a two-step spin-coating:
500RPM for 13 seconds with an 85 rpm/sec ramp (Resist spreading)
1500RPM for 41 seconds with a ramp of 340 rpm/sec (Resist coating)
The resist thickness will be 100μm based on the manufacturer data sheet.
25. Remove the SU_8 resist from the edge of the wafer using a sharp blade (Edge
bead removal).
26. Two step soft baking the resist on hot plate:
T=65οC for 25 minutes
T=95οC for 35 minutes
Cool down 20 minutes.
27. UV exposure for 40 seconds.
28. Post exposure bake:
T=65οC for 1 minutes
T=95οC for 35 minutes
29. Using a Pyrex dish, develop the resist in Propylene Gycol Methylether Acetate,
99%, AIDRICH Co. until all the unexposed area is solved in developer (about 5

98
minutes). Use less agitation and longer developing time, to prevent overdeveloping of
smaller features.
30. Rinse the wafer using IPA. Dry with nitrogen gun.
31. Hard bake the resist after developing:
T=70C for 5 minutes
T=100 for 5min
T=150 for 3min
Use different hot plates for the three-step baking, since hot plates will not reach to
the desired temperature in a few minutes. Leave on hot plate to cool down.
PDMS casting
32. Repeat step 4 but use 20 grams of SYLGARD® 184 SILICONE ELASTOMER
base with 2 grams of the curing agent.
33. Put the SU-8 mold on silicon wafer which was fabricated in steps 18 to 31 in a
petri dish. Pour PDMS from step 32 on it.
34. Leave at room temperature for 30 minutes to remove the air bubbles. Examine
under the microscope to check all the air bubbles have escaped from the uncured resin.
If not, allow more time for air bubble removal before proceeding to next step.
35. Put the petri dish on the hot plate and bake for one hour at 95οC.
36. Cut the PDMS using sharp surgical blade and peel it off the SU_8 mold. Punch
inlets using a blunt needle gauge 21.

99
Bonding, fluidic interconnections and electrical contacts
37. Bond the PDMS slab with microchannel from step 35 to the EWOD substrate
prepared in steps 1 to 17 using corona discharge method. Hold each bonding surfaces
under the corona for 15 seconds. Put the bonding surfaces together and press the top
PDMS layer on the bottom EWOD substrate using tweezers to remove any air bubbles
between them.
38. Use hollow high precision stainless steel tubes and transparent highly flexible
plastic tubes for microfluidic connections. Attach a wire to the steel tube and the silicon
wafer of the EWOD substrate for electrical connections.

100
APPENDIX B: FORCE ANALYSIS EQUATIONS FOR CHAPTER 6
NC droplet configuration
( ( )
(
( )))
C/B droplet configuration
[
]
[
]
[
] ( )
( (
))
( ( ((
(
)) (
)
(
(
))))⁄ )
⁄
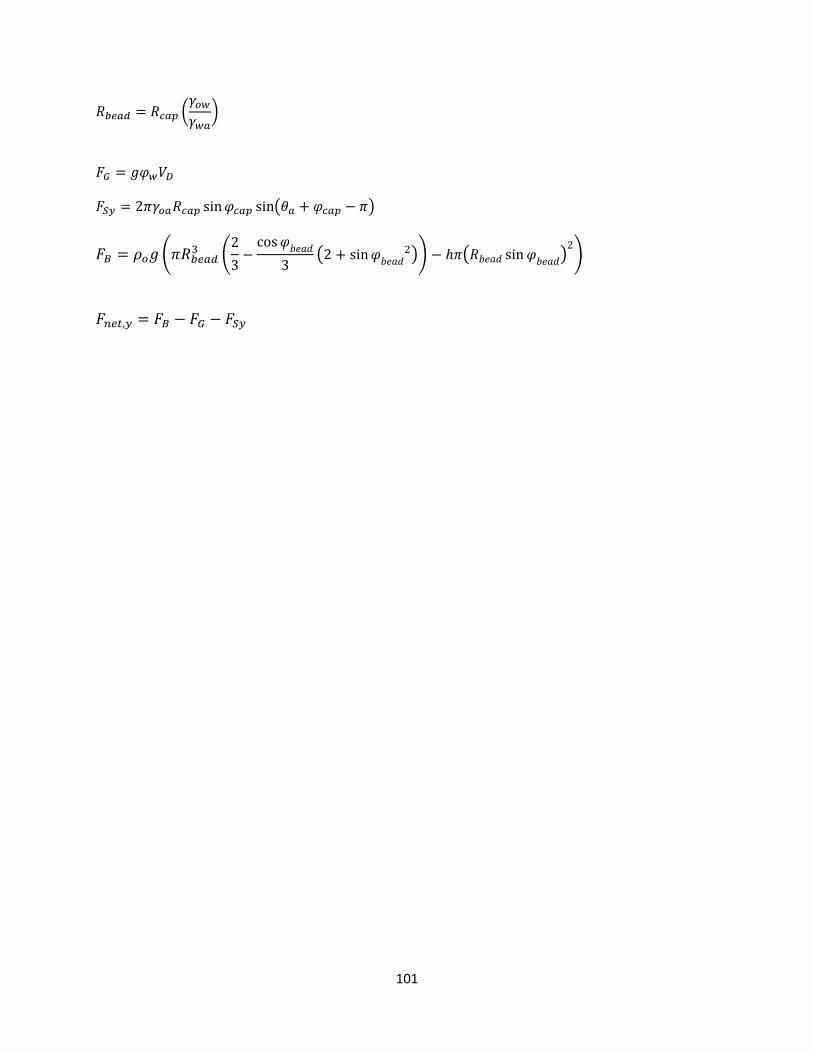
101
(
)
( )
( (
(
)) ( )
)

102
APPENDIX C: ENERGY ANALYSIS EQUATIONS FOR CHAPTER 6
NC droplet configuration
Surface energy:
( )
,where area of the deformed free surface is:
( ) ∑ ∑ ( )
It is assumed for r larger than 15mm the free surface deflection is negligible.
Droplet’s gravitational potential energy:
( )
,where geometric centroid of the water droplet is:
Displaced base medium gravitational potential energy:
,where volume of the displaced base medium is:
( (
)) ∑
And geometric centroid of the displaced base medium is:
Where,

103
( ( )
)
( ) ( )
∑
The net energy of the NC droplet configuration is:
C/B droplet configuration
Surface energy:
( )
,where
∑ ∑ ( )
( ) ⁄
( )
( )

104
Droplet gravitational potential energy:
( ) ( )
,where
( (
))
( ( )
)
( ) ( )
31
4
3
D
D
VR
( (
))
( ( )
)
( ) ( )
Displaced base medium gravitational potential energy:
( )( ( ) ) ( ) ( )
,where the volume of the base liquid below the deformed free surface, is:
( ) ∑
,where is:
( ( ))
is defined from the bottom point of the bead to y=0 and is equal to:
(
)

105
The geometric centroid of the displaced base medium is derived as below:
( ( ) )
∑
( ( )
)
( ) ( )
( )
The net energy of the C/B droplet configuration is :

106
APPENDIX D: COPYRIGHT PERMISSION LETTERS
A micropump controlled by EWOD: wetting line energy and velocity effects
R. Shabani and H. J. Cho, Lab Chip, 2011, 11, 3401
DOI: 10.1039/C1LC20440H
If you are the author of this article you do not need to formally request permission
to reproduce figures, diagrams etc. contained in this article in third party publications or
in a thesis or dissertation provided that the correct acknowledgement is given with the
reproduced material.
Reproduced material should be attributed as follows:
For reproduction of material from NJC:
[Original citation] - Reproduced by permission of The Royal Society of Chemistry (RSC)
on behalf of the Centre National de la Recherche Scientifique (CNRS) and the RSC
For reproduction of material from PCCP:
[Original citation] - Reproduced by permission of the PCCP Owner Societies
For reproduction of material from PPS:
[Original citation] - Reproduced by permission of The Royal Society of Chemistry (RSC)
on behalf of the European Society for Photobiology, the European Photochemistry
Association, and RSC
For reproduction of material from all other RSC journals:
[Original citation] - Reproduced by permission of The Royal Society of Chemistry

107
If you are the author of this article you still need to obtain permission to reproduce
the whole article in a third party publication with the exception of reproduction of the
whole article in a thesis or dissertation.

6/3/13 Rightslink Printable License
https://s100.copyright.com/AppDispatchServlet 1/5
ELSEVIER LICENSETERMS AND CONDITIONS
Jun 03, 2013
This is a License Agreement between Roxana shabani ("You") and Elsevier ("Elsevier") provided
by Copyright Clearance Center ("CCC"). The license consists of your order details, the terms and
conditions provided by Elsevier, and the payment terms and conditions.
All payments must be made in full to CCC. For payment instructions, please seeinformation listed at the bottom of this form.
Supplier Elsevier LimitedThe Boulevard,Langford LaneKidlington,Oxford,OX5 1GB,UK
Registered CompanyNumber
1982084
Customer name Roxana shabani
Customer address Univ. of Central Florida, Dept. of MMAE
Orlando, FL 32816
License number 3161561480239
License date Jun 03, 2013
Licensed content publisher Elsevier
Licensed contentpublication
Sensors and Actuators B: Chemical
Licensed content title Active surface tension driven micropump using droplet/meniscuspressure gradient
Licensed content author Roxana Shabani,Hyoung J. Cho
Licensed content date April 2013
Licensed content volumenumber
180
Licensed content issuenumber
Number of pages 8
Start Page 114
End Page 121
Type of Use reuse in a thesis/dissertation
Portion full article
Format both print and electronic
Are you the author of thisElsevier article?
Yes
Will you be translating? No
Order reference number

6/3/13 Rightslink Printable License
https://s100.copyright.com/AppDispatchServlet 2/5
Title of yourthesis/dissertation
THREE-PHASE CONTACT LINE PHENOMENA IN DROPLETS ONSOLID AND LIQUID SURFACES: ELECTROCAPILLARY, PINNING,WETTING LINE VELOCITY EFFECT, AND FREE LIQUID SURFACEDEFORMATION
Expected completion date Aug 2013
Estimated size (number ofpages)
130
Elsevier VAT number GB 494 6272 12
Permissions price 0.00 USD
VAT/Local Sales Tax 0.0 USD / 0.0 GBP
Total 0.00 USD
Terms and Conditions
INTRODUCTION
1. The publisher for this copyrighted material is Elsevier. By clicking "accept" in connection with
completing this licensing transaction, you agree that the following terms and conditions apply to thistransaction (along with the Billing and Payment terms and conditions established by Copyright
Clearance Center, Inc. ("CCC"), at the time that you opened your Rightslink account and that areavailable at any time at http://myaccount.copyright.com).
GENERAL TERMS
2. Elsevier hereby grants you permission to reproduce the aforementioned material subject to the
terms and conditions indicated.
3. Acknowledgement: If any part of the material to be used (for example, figures) has appeared inour publication with credit or acknowledgement to another source, permission must also be sought
from that source. If such permission is not obtained then that material may not be included in yourpublication/copies. Suitable acknowledgement to the source must be made, either as a footnote orin a reference list at the end of your publication, as follows:
“Reprinted from Publication title, Vol /edition number, Author(s), Title of article / title of chapter,
Pages No., Copyright (Year), with permission from Elsevier [OR APPLICABLE SOCIETYCOPYRIGHT OWNER].” Also Lancet special credit - “Reprinted from The Lancet, Vol. number,
Author(s), Title of article, Pages No., Copyright (Year), with permission from Elsevier.”
4. Reproduction of this material is confined to the purpose and/or media for which permission ishereby given.
5. Altering/Modifying Material: Not Permitted. However figures and illustrations may be
altered/adapted minimally to serve your work. Any other abbreviations, additions, deletions and/orany other alterations shall be made only with prior written authorization of Elsevier Ltd. (Please
contact Elsevier at [email protected])
6. If the permission fee for the requested use of our material is waived in this instance, please beadvised that your future requests for Elsevier materials may attract a fee.

6/3/13 Rightslink Printable License
https://s100.copyright.com/AppDispatchServlet 3/5
7. Reservation of Rights: Publisher reserves all rights not specifically granted in the combination of
(i) the license details provided by you and accepted in the course of this licensing transaction, (ii)these terms and conditions and (iii) CCC's Billing and Payment terms and conditions.
8. License Contingent Upon Payment: While you may exercise the rights licensed immediately upon
issuance of the license at the end of the licensing process for the transaction, provided that you havedisclosed complete and accurate details of your proposed use, no license is finally effective unless
and until full payment is received from you (either by publisher or by CCC) as provided in CCC'sBilling and Payment terms and conditions. If full payment is not received on a timely basis, then any
license preliminarily granted shall be deemed automatically revoked and shall be void as if nevergranted. Further, in the event that you breach any of these terms and conditions or any of CCC's
Billing and Payment terms and conditions, the license is automatically revoked and shall be void asif never granted. Use of materials as described in a revoked license, as well as any use of thematerials beyond the scope of an unrevoked license, may constitute copyright infringement and
publisher reserves the right to take any and all action to protect its copyright in the materials.
9. Warranties: Publisher makes no representations or warranties with respect to the licensedmaterial.
10. Indemnity: You hereby indemnify and agree to hold harmless publisher and CCC, and their
respective officers, directors, employees and agents, from and against any and all claims arising outof your use of the licensed material other than as specifically authorized pursuant to this license.
11. No Transfer of License: This license is personal to you and may not be sublicensed, assigned,
or transferred by you to any other person without publisher's written permission.
12. No Amendment Except in Writing: This license may not be amended except in a writing signedby both parties (or, in the case of publisher, by CCC on publisher's behalf).
13. Objection to Contrary Terms: Publisher hereby objects to any terms contained in any purchase
order, acknowledgment, check endorsement or other writing prepared by you, which terms areinconsistent with these terms and conditions or CCC's Billing and Payment terms and conditions.
These terms and conditions, together with CCC's Billing and Payment terms and conditions (whichare incorporated herein), comprise the entire agreement between you and publisher (and CCC)
concerning this licensing transaction. In the event of any conflict between your obligationsestablished by these terms and conditions and those established by CCC's Billing and Paymentterms and conditions, these terms and conditions shall control.
14. Revocation: Elsevier or Copyright Clearance Center may deny the permissions described in this
License at their sole discretion, for any reason or no reason, with a full refund payable to you.
Notice of such denial will be made using the contact information provided by you. Failure toreceive such notice will not alter or invalidate the denial. In no event will Elsevier or Copyright
Clearance Center be responsible or liable for any costs, expenses or damage incurred by you as a
result of a denial of your permission request, other than a refund of the amount(s) paid by you to
Elsevier and/or Copyright Clearance Center for denied permissions.
LIMITED LICENSE

6/3/13 Rightslink Printable License
https://s100.copyright.com/AppDispatchServlet 4/5
The following terms and conditions apply only to specific license types:
15. Translation: This permission is granted for non-exclusive world English rights only unlessyour license was granted for translation rights. If you licensed translation rights you may only
translate this content into the languages you requested. A professional translator must perform all
translations and reproduce the content word for word preserving the integrity of the article. If this
license is to re-use 1 or 2 figures then permission is granted for non-exclusive world rights in alllanguages.
16. Website: The following terms and conditions apply to electronic reserve and author websites:
Electronic reserve: If licensed material is to be posted to website, the web site is to bepassword-protected and made available only to bona fide students registered on a relevant course
if:
This license was made in connection with a course,This permission is granted for 1 year only. You may obtain a license for future website posting,
All content posted to the web site must maintain the copyright information line on the bottom of
each image,
A hyper-text must be included to the Homepage of the journal from which you are licensing athttp://www.sciencedirect.com/science/journal/xxxxx or the Elsevier homepage for books at
http://www.elsevier.com , and
Central Storage: This license does not include permission for a scanned version of the material to
be stored in a central repository such as that provided by Heron/XanEdu.
17. Author website for journals with the following additional clauses:
All content posted to the web site must maintain the copyright information line on the bottom ofeach image, and the permission granted is limited to the personal version of your paper. You are
not allowed to download and post the published electronic version of your article (whether PDF or
HTML, proof or final version), nor may you scan the printed edition to create an electronic version.A hyper-text must be included to the Homepage of the journal from which you are licensing at
http://www.sciencedirect.com/science/journal/xxxxx . As part of our normal production process,
you will receive an e-mail notice when your article appears on Elsevier’s online service
ScienceDirect (www.sciencedirect.com). That e-mail will include the article’s Digital ObjectIdentifier (DOI). This number provides the electronic link to the published article and should be
included in the posting of your personal version. We ask that you wait until you receive this e-mail
and have the DOI to do any posting.
Central Storage: This license does not include permission for a scanned version of the material to
be stored in a central repository such as that provided by Heron/XanEdu.
18. Author website for books with the following additional clauses: Authors are permitted to place a brief summary of their work online only.
A hyper-text must be included to the Elsevier homepage at http://www.elsevier.com . All content
posted to the web site must maintain the copyright information line on the bottom of each image.You are not allowed to download and post the published electronic version of your chapter, nor
may you scan the printed edition to create an electronic version.

6/3/13 Rightslink Printable License
https://s100.copyright.com/AppDispatchServlet 5/5
Central Storage: This license does not include permission for a scanned version of the material to
be stored in a central repository such as that provided by Heron/XanEdu.
19. Website (regular and for author): A hyper-text must be included to the Homepage of the
journal from which you are licensing at http://www.sciencedirect.com/science/journal/xxxxx. or for
books to the Elsevier homepage at http://www.elsevier.com
20. Thesis/Dissertation: If your license is for use in a thesis/dissertation your thesis may be
submitted to your institution in either print or electronic form. Should your thesis be published
commercially, please reapply for permission. These requirements include permission for the Library
and Archives of Canada to supply single copies, on demand, of the complete thesis and includepermission for UMI to supply single copies, on demand, of the complete thesis. Should your thesis
be published commercially, please reapply for permission.
21. Other Conditions:
v1.6
If you would like to pay for this license now, please remit this license along with yourpayment made payable to "COPYRIGHT CLEARANCE CENTER" otherwise you will beinvoiced within 48 hours of the license date. Payment should be in the form of a check ormoney order referencing your account number and this invoice number RLNK501035136.Once you receive your invoice for this order, you may pay your invoice by credit card.Please follow instructions provided at that time.
Make Payment To:Copyright Clearance CenterDept 001P.O. Box 843006Boston, MA 02284-3006
For suggestions or comments regarding this order, contact RightsLink Customer Support:[email protected] or +1-877-622-5543 (toll free in the US) or +1-978-646-2777.
Gratis licenses (referencing $0 in the Total field) are free. Please retain this printablelicense for your reference. No payment is required.

6/3/13 Rightslink Printable License
https://s100.copyright.com/AppDispatchServlet 1/4
SPRINGER LICENSETERMS AND CONDITIONS
Jun 03, 2013
This is a License Agreement between Roxana shabani ("You") and Springer ("Springer") provided
by Copyright Clearance Center ("CCC"). The license consists of your order details, the terms and
conditions provided by Springer, and the payment terms and conditions.
All payments must be made in full to CCC. For payment instructions, please seeinformation listed at the bottom of this form.
License Number 3161570306758
License date Jun 03, 2013
Licensed content publisher Springer
Licensed contentpublication
Microfluids and Nanofluids
Licensed content title Flow rate analysis of an EWOD-based device: how important arewetting-line pinning and velocity effects?
Licensed content author Roxana Shabani
Licensed content date Jan 1, 2013
Type of Use Thesis/Dissertation
Portion Full text
Number of copies 1
Author of this Springerarticle
Yes and you are the sole author of the new work
Order reference number
Title of your thesis /dissertation
THREE-PHASE CONTACT LINE PHENOMENA IN DROPLETS ONSOLID AND LIQUID SURFACES: ELECTROCAPILLARY, PINNING,WETTING LINE VELOCITY EFFECT, AND FREE LIQUID SURFACEDEFORMATION
Expected completion date Aug 2013
Estimated size(pages) 130
Total 0.00 USD
Terms and Conditions
Introduction
The publisher for this copyrighted material is Springer Science + Business Media. By clicking
"accept" in connection with completing this licensing transaction, you agree that the following terms
and conditions apply to this transaction (along with the Billing and Payment terms and conditions
established by Copyright Clearance Center, Inc. ("CCC"), at the time that you opened your
Rightslink account and that are available at any time at http://myaccount.copyright.com).

6/3/13 Rightslink Printable License
https://s100.copyright.com/AppDispatchServlet 2/4
Limited License
With reference to your request to reprint in your thesis material on which Springer Science and
Business Media control the copyright, permission is granted, free of charge, for the use indicated in
your enquiry.
Licenses are for one-time use only with a maximum distribution equal to the number that you
identified in the licensing process.
This License includes use in an electronic form, provided its password protected or on the
university’s intranet or repository, including UMI (according to the definition at the Sherpa website:
http://www.sherpa.ac.uk/romeo/). For any other electronic use, please contact Springer at([email protected] or [email protected]).
The material can only be used for the purpose of defending your thesis, and with a maximum of 100
extra copies in paper.
Although Springer holds copyright to the material and is entitled to negotiate on rights, this license is
only valid, subject to a courtesy information to the author (address is given with the article/chapter)
and provided it concerns original material which does not carry references to other sources (if
material in question appears with credit to another source, authorization from that source is requiredas well).
Permission free of charge on this occasion does not prejudice any rights we might have to chargefor reproduction of our copyrighted material in the future.
Altering/Modifying Material: Not PermittedYou may not alter or modify the material in any manner. Abbreviations, additions, deletions and/orany other alterations shall be made only with prior written authorization of the author(s) and/or
Springer Science + Business Media. (Please contact Springer at([email protected] or [email protected])
Reservation of Rights
Springer Science + Business Media reserves all rights not specifically granted in the combination of(i) the license details provided by you and accepted in the course of this licensing transaction, (ii)
these terms and conditions and (iii) CCC's Billing and Payment terms and conditions.
Copyright Notice:DisclaimerYou must include the following copyright and permission notice in connection with any reproduction
of the licensed material: "Springer and the original publisher /journal title, volume, year ofpublication, page, chapter/article title, name(s) of author(s), figure number(s), original copyright
notice) is given to the publication in which the material was originally published, by adding; withkind permission from Springer Science and Business Media"
Warranties: None
Example 1: Springer Science + Business Media makes no representations or warranties withrespect to the licensed material.

6/3/13 Rightslink Printable License
https://s100.copyright.com/AppDispatchServlet 3/4
Example 2: Springer Science + Business Media makes no representations or warranties with
respect to the licensed material and adopts on its own behalf the limitations and disclaimersestablished by CCC on its behalf in its Billing and Payment terms and conditions for this licensing
transaction.
IndemnityYou hereby indemnify and agree to hold harmless Springer Science + Business Media and CCC,
and their respective officers, directors, employees and agents, from and against any and all claimsarising out of your use of the licensed material other than as specifically authorized pursuant to this
license.
No Transfer of LicenseThis license is personal to you and may not be sublicensed, assigned, or transferred by you to any
other person without Springer Science + Business Media's written permission.
No Amendment Except in WritingThis license may not be amended except in a writing signed by both parties (or, in the case ofSpringer Science + Business Media, by CCC on Springer Science + Business Media's behalf).
Objection to Contrary Terms
Springer Science + Business Media hereby objects to any terms contained in any purchase order,acknowledgment, check endorsement or other writing prepared by you, which terms are
inconsistent with these terms and conditions or CCC's Billing and Payment terms and conditions.These terms and conditions, together with CCC's Billing and Payment terms and conditions (which
are incorporated herein), comprise the entire agreement between you and Springer Science +Business Media (and CCC) concerning this licensing transaction. In the event of any conflict
between your obligations established by these terms and conditions and those established byCCC's Billing and Payment terms and conditions, these terms and conditions shall control.
Jurisdiction
All disputes that may arise in connection with this present License, or the breach thereof, shall besettled exclusively by arbitration, to be held in The Netherlands, in accordance with Dutch law, andto be conducted under the Rules of the 'Netherlands Arbitrage Instituut' (Netherlands Institute of
Arbitration).OR:
All disputes that may arise in connection with this present License, or the breach thereof,shall be settled exclusively by arbitration, to be held in the Federal Republic of Germany,in accordance with German law.
Other terms and conditions:
v1.3
If you would like to pay for this license now, please remit this license along with yourpayment made payable to "COPYRIGHT CLEARANCE CENTER" otherwise you will beinvoiced within 48 hours of the license date. Payment should be in the form of a check ormoney order referencing your account number and this invoice number RLNK501035141.Once you receive your invoice for this order, you may pay your invoice by credit card.Please follow instructions provided at that time.

6/3/13 Rightslink Printable License
https://s100.copyright.com/AppDispatchServlet 4/4
Make Payment To:Copyright Clearance CenterDept 001P.O. Box 843006Boston, MA 02284-3006
For suggestions or comments regarding this order, contact RightsLink Customer Support:[email protected] or +1-877-622-5543 (toll free in the US) or +1-978-646-2777.
Gratis licenses (referencing $0 in the Total field) are free. Please retain this printablelicense for your reference. No payment is required.

6/3/13 Rightslink Printable License
https://s100.copyright.com/AppDispatchServlet 1/3
AMERICAN INSTITUTE OF PHYSICS LICENSETERMS AND CONDITIONS
Jun 03, 2013
All payments must be made in full to CCC. For payment instructions, please seeinformation listed at the bottom of this form.
License Number 3161570645893
Order Date Jun 03, 2013
Publisher American Institute of Physics
Publication Applied Physics Letters
Article Title Droplets on liquid surfaces: Dual equilibrium states and theirenergy barrier
Author Roxana Shabani, Ranganathan Kumar, Hyoung J. Cho
Online Publication Date May 7, 2013
Volume number 102
Issue number 18
Type of Use Thesis/Dissertation
Requestor type Author (original article)
Format Print and electronic
Portion Excerpt (> 800 words)
Will you be translating? No
Title of your thesis /dissertation
THREE-PHASE CONTACT LINE PHENOMENA IN DROPLETS ONSOLID AND LIQUID SURFACES: ELECTROCAPILLARY, PINNING,WETTING LINE VELOCITY EFFECT, AND FREE LIQUID SURFACEDEFORMATION
Expected completion date Aug 2013
Estimated size (number ofpages)
130
Total 0.00 USD
Terms and Conditions
American Institute of Physics -- Terms and Conditions: Permissions Uses
American Institute of Physics ("AIP") hereby grants to you the non-exclusive right and licenseto use and/or distribute the Material according to the use specified in your order, on a one-time basis, for the specified term, with a maximum distribution equal to the number that youhave ordered. Any links or other content accompanying the Material are not the subject of thislicense.
1. You agree to include the following copyright and permission notice with the reproduction of
the Material: "Reprinted with permission from [FULL CITATION]. Copyright
[PUBLICATION YEAR], American Institute of Physics." For an article, the copyright andpermission notice must be printed on the first page of the article or book chapter. For
photographs, covers, or tables, the copyright and permission notice may appear with the
Material, in a footnote, or in the reference list.
2. If you have licensed reuse of a figure, photograph, cover, or table, it is your responsibility to
ensure that the material is original to AIP and does not contain the copyright of another
entity, and that the copyright notice of the figure, photograph, cover, or table does not

6/3/13 Rightslink Printable License
https://s100.copyright.com/AppDispatchServlet 2/3
indicate that it was reprinted by AIP, with permission, from another source. Under no
circumstances does AIP, purport or intend to grant permission to reuse material to which it
does not hold copyright.
3. You may not alter or modify the Material in any manner. You may translate the Material into
another language only if you have licensed translation rights. You may not use the Material
for promotional purposes. AIP reserves all rights not specifically granted herein.4. The foregoing license shall not take effect unless and until AIP or its agent, Copyright
Clearance Center, receives the Payment in accordance with Copyright Clearance Center
Billing and Payment Terms and Conditions, which are incorporated herein by reference.
5. AIP or the Copyright Clearance Center may, within two business days of granting this
license, revoke the license for any reason whatsoever, with a full refund payable to you.
Should you violate the terms of this license at any time, AIP, American Institute of Physics,
or Copyright Clearance Center may revoke the license with no refund to you. Notice of such
revocation will be made using the contact information provided by you. Failure to receive
such notice will not nullify the revocation.
6. AIP makes no representations or warranties with respect to the Material. You agree to
indemnify and hold harmless AIP, American Institute of Physics, and their officers, directors,employees or agents from and against any and all claims arising out of your use of the
Material other than as specifically authorized herein.7. The permission granted herein is personal to you and is not transferable or assignable without
the prior written permission of AIP. This license may not be amended except in a writingsigned by the party to be charged.
8. If purchase orders, acknowledgments or check endorsements are issued on any forms
containing terms and conditions which are inconsistent with these provisions, suchinconsistent terms and conditions shall be of no force and effect. This document, including
the CCC Billing and Payment Terms and Conditions, shall be the entire agreement betweenthe parties relating to the subject matter hereof.
This Agreement shall be governed by and construed in accordance with the laws of the State of
New York. Both parties hereby submit to the jurisdiction of the courts of New York County forpurposes of resolving any disputes that may arise hereunder.
If you would like to pay for this license now, please remit this license along with yourpayment made payable to "COPYRIGHT CLEARANCE CENTER" otherwise you will beinvoiced within 48 hours of the license date. Payment should be in the form of a check ormoney order referencing your account number and this invoice number RLNK501035144.Once you receive your invoice for this order, you may pay your invoice by credit card.Please follow instructions provided at that time.
Make Payment To:Copyright Clearance CenterDept 001P.O. Box 843006Boston, MA 02284-3006
For suggestions or comments regarding this order, contact RightsLink Customer Support:[email protected] or +1-877-622-5543 (toll free in the US) or +1-978-646-2777.
Gratis licenses (referencing $0 in the Total field) are free. Please retain this printable

6/3/13 Rightslink Printable License
https://s100.copyright.com/AppDispatchServlet 3/3
license for your reference. No payment is required.

108
REFERENCES
[1] K. W. Oh and C. H. Ahn, "A review of microvalves," J. Micromech. Microeng. , vol.
16, pp. R13-R39, 2006.
[2] D. J. Laser and J. G. Santiago, "A review of micropumps," J. Micromech.
Microeng. , vol. 14, pp. R35-R64, 2004.
[3] B. Iverson and S. Garimella, "Recent advances in microscale pumping
technologies: a review and evaluation," Microfluidics and Nanofluidics, vol. 5, pp.
145-174, 2008.
[4] A. Nisar, N. Afzulpurkar, B. Mahaisavariya, and A. Tuantranont, "MEMS-based
micropumps in drug delivery and biomedical applications," Sensors and Actuators
B: Chemical, vol. 130, pp. 917-942, 2008.
[5] F. Amirouche, Y. Zhou, and T. Johnson, "Current micropump technologies and
their biomedical applications," Microsystem Technologies, vol. 15, pp. 647-666,
2009.
[6] N. C. Tsai and C. Y. Sue, "Review of MEMS-based drug delivery and dosing
systems," Sensors and Actuators A: Physical vol. 134, pp. 555-564, Mar 15 2007.
[7] J. K. Luo, Y. Q. Fu, Y. Li, X. Y. Du, A. J. Flewitt, A. J. Walton, et al., "Moving-part-
free microfluidic systems for lab-on-a-chip," JOURNAL OF MICROMECHANICS
AND MICROENGINEERING, vol. 19, p. 054001, 2009.
[8] S. Y. Xing, R. S. Harake, and T. R. Pan, "Droplet-driven transports on
superhydrophobic-patterned surface microfluidics," Lab on a Chip, vol. 11, pp.
3642-3648, 2011.
[9] E. Berthier and D. J. Beebe, "Flow rate analysis of a surface tension driven
passive micropump," Lab on a Chip, vol. 7, pp. 1475-1478, 2007.
[10] J. Lee and C. J. Kim, "Surface-tension-driven microactuation based on
continuous electrowetting," JOURNAL OF MICROELECTROMECHANICAL
SYSTEMS, vol. 9, pp. 171-180, Jun 2000.
[11] S. K. Cho, H. Moon, and C.-J. Kim, "Creating, Transporting, Cutting, and Merging
Liquid Droplets by Electrowetting-Based Actuation for Digital Microfluidic Circuits,"
JOURNAL OF MICROELECTROMECHANICAL SYSTEMS, vol. 12, pp. 70-80,
2003.

109
[12] H. Ren, R. B. Fair, M. G. Pollack, and E. J. Shaughnessy, "Dynamics of electro-
wetting droplet transport," Sensors and Actuators B: Chemical, vol. 87, pp. 201-
206, Nov 15 2002.
[13] H. Ren, R. B. Fair, and M. G. Pollack, "Automated on-chip droplet dispensing with
volume control by electro-wetting actuation and capacitance metering," Sensors
and Actuators B: Chemical, vol. 98, pp. 319-327, Mar 15 2004.
[14] J. Lee, H. Moon, J. Fowler, T. Schoellhammer, and C.-J. Kim, "Electrowetting and
electrowetting-on-dielectric for microscale liquid handling," Sensors and Actuators
A: Physical, vol. 95, pp. 259-268, 2002.
[15] T. Pan, S. J. McDonald, E. M. Kai, and B. Ziaie, "A magnetically driven PDMS
micropump with ball check-valves," J. Micromech. Microeng. , vol. 15, pp. 1021-
1026, 2005.
[16] K.-S. Yun, I.-J. Cho, J.-U. Bu, G.-H. Kim, Y.-S. Jeon, C.-J. Kim, et al., "A
micropump driven by continuous electrowetting actuation for low voltage and low
power operations," in Micro Electro Mechanical Systems, 2001. MEMS 2001. The
14th IEEE International Conference on, 2001, pp. 487-490.
[17] Z. Fekete, P. Nagy, G. Huszka, F. Tolner, A. Pongrácz, and P. Fürjes,
"Performance characterization of micromachined particle separation system
based on Zweifach–Fung effect," Sensors and Actuators B: Chemical, vol. 162,
pp. 89-94, 2012.
[18] M. Kersaudy-Kerhoas, R. Dhariwal, M. P. Y. Desmulliez, and L. Jouvet,
"Hydrodynamic blood plasma separation in microfluidic channels," Microfluidics
and Nanofluidics, vol. 8, pp. 105-114, Jan 2010.
[19] S. Yang, A. Undar, and J. D. Zahn, "A microfluidic device for continuous, real time
blood plasma separation," Lab on a Chip, vol. 6, pp. 871-880, 2006.
[20] E. Sollier, M. Cubizolles, Y. Fouillet, and J. L. Achard, "Fast and continuous
plasma extraction from whole human blood based on expanding cell-free layer
devices," Biomedical Microdevices, vol. 12, pp. 485-497, Jun 2010.
[21] A. I. Rodriguez-Villarreal, M. Arundell, M. Carmona, and J. Samitier, "High flow
rate microfluidic device for blood plasma separation using a range of
temperatures," Lab on a Chip, vol. 10, pp. 211-219, 2010.

110
[22] M. Kersaudy-Kerhoas, D. M. Kavanagh, R. S. Dhariwal, C. J. Campbell, and M.
P. Y. Desmulliez, "Validation of a blood plasma separation system by biomarker
detection," Lab on a Chip, vol. 10, pp. 1587-1595, 2010.
[23] A. Lenshof, A. Ahmad-Tajudin, K. Jaras, A. M. Sward-Nilsson, L. Aberg, G.
Marko-Varga, et al., "Acoustic Whole Blood Plasmapheresis Chip for Prostate
Specific Antigen Microarray Diagnostics," Analytical Chemistry, vol. 81, pp. 6030-
6037, Aug 1 2009.
[24] T. Young, "An Essay on the Cohesion of Fluids," Philosophical Transactions of
the Royal Society of London, vol. 95, pp. 65-87, 1805.
[25] R. Baviere, J. Boutet, and Y. Fouillet, "Dynamics of droplet transport induced by
electrowetting actuation," Microfluidics and Nanofluidics, vol. 4, pp. 287-294, Apr
2008.
[26] R. Tadmor, "Line Energy and the Relation between Advancing, Receding, and
Young Contact Angles," Langmuir, vol. 20, pp. 7659-7664, 2004.
[27] E. B. Dussan V., "On the Spreading of Liquids on Solid Surfaces: Static and
Dynamic Contact Lines," Annual Review of Fluid Mechanics, vol. 11, pp. 371-400,
1979.
[28] W. C. Nelson, P. Sen, and C.-J. C. Kim, "Dynamic Contact Angles and Hysteresis
under Electrowetting-on-Dielectric," Langmuir, vol. 27, pp. 10319-10326, 2011.
[29] S. W. Walker, B. Shapiro, and R. H. Nochetto, "Electrowetting with contact line
pinning: Computational modeling and comparisons with experiments," PHYSICS
OF FLUIDS, vol. 21, p. 102103, 2009.
[30] Y. D. Shikhmurzaev, "Singularities at the moving contact line. Mathematical,
physical and computational aspects," Physica D: Nonlinear Phenomena, vol. 217,
pp. 121-133, 2006.
[31] T. D. Blake and J. De Coninck, "The influence of solid–liquid interactions on
dynamic wetting," Advances in Colloid and Interface Science, vol. 96, pp. 21-36,
2002.
[32] C. Huh and L. E. Scriven, "Hydrodynamic model of steady movement of a
solid/liquid/fluid contact line," Journal of Colloid and Interface Science, vol. 35, pp.
85-101, 1971.
111
[33] L. H. Tanner, "The spreading of silicone oil drops on horizontal surfaces," Journal
of Physics D: Applied Physics, vol. 12, pp. 1473-1484, 1979.
[34] A. Quinn, R. Sedev, and J. Ralston, "Contact Angle Saturation in Electrowetting,"
The Journal of Physical Chemistry B, vol. 109, pp. 6268-6275, 2005.
[35] F. Mugele and J. C. Baret, "Electrowetting: From basics to applications," Journal
of Physics-Condensed Matter, vol. 17, pp. R705-R774, Jul 20 2005.
[36] J. Zeng and T. Korsmeyer, "Principles of droplet electrohydrodynamics for lab-on-
a-chip," Lab an a Chip, vol. 4, pp. 265-277, 2004.
[37] H.-W. Lu, K. Glasner, A. L. Bertozzi, and C.-J. Kim, "A diffuse-interface model for
electrowetting drops in a Hele-Shaw cell," Journal of Fluid Mechanics, vol. 590,
pp. 411-435, Nov 10 2007.
[38] J. Lienemann, A. Greiner, and J. G. Korvink, "Modeling, simulation, and
optimization of electrowetting," IEEE Transactions on Computer-Aided Design of
Integrated Circuits and Systems, vol. 25, pp. 234-247, Feb 2006.
[39] S. W. Walker and B. Shapiro, "Modeling the Fluid Dynamics of Electrowetting on
Dielectric (EWOD)," JOURNAL OF MICROELECTROMECHANICAL SYSTEMS,
vol. 15, pp. 986-1000, 2006.
[40] L.-S. Jang, G.-H. Lin, Y.-L. Lin, C.-Y. Hsu, W.-H. Kan, and C.-H. Chen,
"Simulation and experimentation of a microfluidic device based on electrowetting
on dielectric," Biomedical Microdevices, vol. 9, pp. 777-786, 2007.
[41] A. Ahmadi, J. F. Holzman, H. Najjaran, and M. Hoorfar, "Electrohydrodynamic
modeling of microdroplet transient dynamics in electrocapillary-based digital
microfluidic devices," Microfluidics and Nanofluidics, vol. 10, pp. 1019-1032,
2010.
[42] V. Bahadur and S. V. Garimella, "An energy-based model for electrowetting-
induced droplet actuation," JOURNAL OF MICROMECHANICS AND
MICROENGINEERING, vol. 16, pp. 1494-1503, 2006.
[43] Z. Keshavarz-Motamed, L. Kadem, and A. Dolatabadi, "Effects of dynamic
contact angle on numerical modeling of electrowetting in parallel plate
microchannels," Microfluidics and Nanofluidics, vol. 8, pp. 47-56, 2009.

112
[44] J. H. Chen and W. H. Hsieh, "Electrowetting-induced capillary flow in a parallel-
plate channel," Journal of Colloid and Interface Science, vol. 296, pp. 276-283,
2006.
[45] M. J. Schertzer, S. I. Gubarenko, R. Ben-Mrad, and P. E. Sullivan, "An Empirically
Validated Analytical Model of Droplet Dynamics in Electrowetting on Dielectric
Devices," Langmuir, vol. 26, pp. 19230-19238, Dec 21 2010.
[46] J. Berthier, P. Dubois, P. Clementz, P. Claustre, C. Peponnet, and Y. Fouillet,
"Actuation potentials and capillary forces in electrowetting based microsystems,"
Sensors and Actuators A: Physical vol. 134, pp. 471-479, 2007.
[47] P. Sen and C. J. Kim, "Capillary Spreading Dynamics of Electrowetted Sessile
Droplets in Air," Langmuir, vol. 25, pp. 4302-4305, Apr 21 2009.
[48] S. R. Annapragada, S. Dash, S. V. Garimella, and J. Y. Murthy, "Dynamics of
Droplet Motion under Electrowetting Actuation," Langmuir, vol. 27, pp. 8198-8204,
Jul 5 2011.
[49] E. F. Greco and R. O. Grigoriev, "Thermocapillary migration of interfacial
droplets," Physics of Fluids, vol. 21, Apr 2009.
[50] E. Yakhshi-Tafti, H. J. Cho, and R. Kumar, "Droplet actuation on a liquid layer due
to thermocapillary motion: Shape effect," Applied Physics Letters, vol. 96, Jun 28
2010.
[51] R. Savino, D. Paterna, and M. Lappa, "Marangoni flotation of liquid droplets," J
FLUID MECH, vol. 479, pp. 307-326, 2003.
[52] A. S. Basu and Y. B. Gianchandani, "A Programmable Array for Contact-Free
Manipulation of Floating Droplets on Featureless Substrates by the Modulation of
Surface Tension," Journal of Microelectromechanical Systems, vol. 18, pp. 1163-
1172, Dec 2009.
[53] A. A. Darhuber, J. P. Valentino, S. M. Troian, and S. Wagner, "Thermocapillary
actuation of droplets on chemically patterned surfaces by programmable
microheater arrays," Journal of Microelectromechanical Systems, vol. 12, pp.
873-879, Dec 2003.
[54] M. S. Khan, D. Kannangara, W. Shen, and G. Garnier, "Isothermal
noncoalescence of liquid droplets at the air-liquid interface," Langmuir, vol. 24,
pp. 3199-3204, Apr 1 2008.

113
[55] O. Reynolds, "On drops floating on the surface of water," Chem. News, vol. 44, p.
211, 1881.
[56] L. D. Mahajan, "Liquid Drops on the Same Liquid Surface," Nature, vol. 126, pp.
761-761, 1930.
[57] Y. Couder, E. Fort, C. H. Gautier, and A. Boudaoud, "From bouncing to floating:
Noncoalescence of drops on a fluid bath," Physical Review Letters, vol. 94, May 6
2005.
[58] P. Aussillous and D. Quere, "Properties of liquid marbles," Proceedings of the
Royal Society a-Mathematical Physical and Engineering Sciences, vol. 462, pp.
973-999, Mar 8 2006.
[59] E. Yakhshi-Tafti, H. J. Cho, and R. Kumar, "Impact of drops on the surface of
immiscible liquids," J COLLOID INTERF SCI, vol. 350, pp. 373-376, Oct 1 2010.
[60] A. Elcrat, R. Neel, and D. Siegel, "Equilibrium Configurations for a Floating Drop,"
J MATH FLUID MECH, vol. 6, pp. 405-429, 2004.
[61] T. M. Squires and S. R. Quake, "Microfluidics: Fluid physics at the nanoliter
scale," REVIEWS OF MODERN PHYSICS, vol. 77, p. 977, 2005.
[62] C. T. Leondes, K.-S. Yun, and E. Yoon, "Micropumps for MEMS/NEMS and
Microfluidic Systems," in MEMS/NEMS, ed: Springer US, 2006, pp. 1112-1144.
[63] M. G. Pollack, A. D. Shenderov, and R. B. Fair, "Electrowetting-based actuation
of droplets for integrated microfluidics," Lab on a Chip, vol. 2, pp. 96-101, 2002.
[64] J. S. Go and S. Shoji, "A disposable, dead volume-free and leak-free in-plane
PDMS microvalve," Sensors and Actuators A vol. 114, pp. 438-444, 2004.
[65] J. H. Koschwanez, R. H. Carlson, and D. R. Meldrum, "Thin PDMS Films Using
Long Spin Times or Tert-Butyl Alcohol as a Solvent," PLoS ONE, vol. 4, p. e4572,
2009.
[66] K. Haubert, T. Drier, and D. Beebe, "PDMS bonding by means of a portable, low-
cost corona system," Lab an a Chip, vol. 6, pp. 1548-1549, 2006.
[67] H. Hillborg and U. W. Gedde, "Hydrophobicity recovery of polydimethylsiloxane
after exposure to corona discharges," Polymer, vol. 39, pp. 1991-1998, May
1998.

114
[68] J. Kim and M. K. Chaudhury, "Corona-discharge-induced hydrophobicity loss and
recovery of silicones," in Electrical Insulation and Dielectric Phenomena, 1999
Annual Report Conference on, 1999, pp. 703-706 vol.2.
[69] D. Brassard, L. Malic, F. Normandin, M. Tabrizian, and T. Veres, "Water-oil core-
shell droplets for electrowetting-based digital microfluidic devices," Lab an a Chip,
vol. 8, pp. 1342-1349, 2008.
[70] G. Lippmann, "Relation entre les phenomenes electriques et capillaires," Ann.
Chim. Phys. , vol. 5, pp. 494-549, 1875.
[71] R. Shabani and H. J. Cho, "A micropump controlled by EWOD: wetting line
energy and velocity effects," Lab on a Chip, vol. 11, pp. 3401-3403, 2011.
[72] K. Hosokawa, T. Fujii, and I. Endo, "Droplet-based nano/picoliter mixer using
hydrophobic microcapillary vent," in Micro Electro Mechanical Systems, 1999.
MEMS '99. Twelfth IEEE International Conference on, 1999, pp. 388-393.
[73] M. J. Schertzer, S. I. Gubarenko, R. Ben Mrad, and P. E. Sullivan, "An empirically
validated model of the pressure within a droplet confined between plates at
equilibrium for low Bond numbers," Experiments in Fluids, vol. 48, pp. 851-862,
2009.
[74] R. G. Picknett and R. Bexon, "Evaporation of Sessile or Pendant Drops in Still
Air," Journal of Colloid and Interface Science, vol. 61, pp. 336-350, 1977.
[75] K. S. Birdi and D. T. Vu, "Wettability and the Evaporation Rates of Fluids from
Solid-Surfaces," Journal of Adhesion Science and Technology, vol. 7, pp. 485-
493, 1993.
[76] G. McHale, S. M. Rowan, M. I. Newton, and M. K. Banerjee, "Evaporation and the
Wetting of a Low-Energy Solid Surface," The Journal of Physical Chemistry B,
vol. 102, pp. 1964-1967, 1998.
[77] H.-Z. Yu, D. M. Soolaman, A. W. Rowe, and J. T. Banks, "Evaporation of Water
Microdroplets on Self-Assembled Monolayers: From Pinning to Shrinking,"
ChemPhysChem, vol. 5, pp. 1035-1038, 2004.
[78] T. D. Blake, "The physics of moving wetting lines," Journal of Colloid and
Interface Science, vol. 299, pp. 1-13, 2006.

115
[79] F. Li and F. Mugele, "How to make sticky surfaces slippery: Contact angle
hysteresis in electrowetting with alternating voltage," Applied Physics Letters, vol.
92, Jun 16 2008.
[80] R. Shabani and H. J. Cho, "Active surface tension driven micropump using
droplet/meniscus pressure gradient," Sensors and Actuators B: Chemical, 2012.
[81] G. P. Neitzel and P. Dell'Aversana, "Noncoalescence and nonwetting behavior of
liquids," ANNU REV FLUID MECH, vol. 34, pp. 267-289, 2002.
[82] O. W. Jayaratne and B. J. Mason, "The Coalescence and Bouncing of Water
Drops at an Air/Water Interface," P Roy Soc a-Math Phy, vol. 280, pp. 545-565,
1964.
[83] G. E. Charles and S. G. Mason, "The mechanism of partial coalescence of liquid
drops at liquid/liquid interfaces," J COLL SCI IMP U TOK, vol. 15, pp. 105-122,
1960.
[84] E. Honey and H. Kavehpour, "Astonishing life of a coalescing drop on a free
surface," PHYS REV E, vol. 73, 2006.
[85] K. R. Sreenivas, P. K. De, and J. H. Arakeri, "Levitation of a drop over a film flow,"
J FLUID MECH, vol. 380, pp. 297-307, 1999.
[86] W. Fox, "Contact Angles at Liquid-Liquid-Air Interfaces," J CHEM PHYS, vol. 10,
pp. 623-628, 1942.
[87] J. S. Rowlinson and B. Wisdom, Molecular theory of capillarity: oxford university
press, 1982.
[88] C. Huh and L. E. Scriven, "Shapes of Axisymmetric Fluid Interfaces of
Unbounded Extent," J COLLOID INTERF SCI, vol. 30, pp. 323-&, 1969.
[89] A. V. Rapacchietta and A. W. Neumann, "Force and Free-Energy Analyses of
Small Particles at Fluid Interfaces .2. Spheres," J COLLOID INTERF SCI, vol. 59,
pp. 555-567, 1977.
[90] A. V. Rapacchietta, A. W. Neumann, and S. N. Omenyi, "Force and Free-Energy
Analyses of Small Particles at Fluid Interfaces .1. Cylinders," J COLLOID INTERF
SCI, vol. 59, pp. 541-554, 1977.
116
LIST OF PUBLICATIONS
1- R. Shabani, R. Kumar, and H. J. Cho, “Droplets on liquid surfaces: dual equilibrium
states and their energy barrier”, Applied physics Letters, 102, 184101, 20132013.
2- R. Shabani and H. J. Cho, “Flow rate analysis of an EWOD based device: how
important are wetting line pinning and velocity effects?”, Microfluidics and
Nanofluidics, 2013, DOI: 10.1007/s10404-013-1184-y.
3- R. Shabani and H.J. Cho, “Active surface tension driven micropump using
droplet/meniscus pressure gradient”, Sensors and Actuators B: Chemical, 180,
114–121, 2013.
4- R. Shabani and H. J. Cho, “Nanomaterials in Actuators: A Review”, Reviews in
Nanoscience and Nanotechnology, 1 (2), 85-102, 2012.
5- R. Shabani and H. J. Cho, “A micropump controlled by EWOD: wetting line energy
and velocity effects”, Lab on a Chip 11 (20), 3401-3403, 2011.
6- S.-E. Zhu, R. Shabani, J. Rho, Y. Kim, B. H. Hong, J.-H. Ahn, and H. J. Cho,
“Graphene-based bimorph microactuators”, Nano letters 11 (3), 977, 2011.
7- R. Shabani, L. Massi, L. Zhai, S. Seal, and H. J. Cho, “Classroom modules for
nanotechnology undergraduate education: development, implementation and
evaluation”, European Journal of Engineering Education, 36 (2), 199-210, 2011.