three-year medium-term management plan (fy2006 … medium-term management plan (fy2006 – fy2008)...
TRANSCRIPT

Three-year Medium-term Management Plan (FY2006 – FY2008)
New Stage 2008
Sojitz Corporation
April 28, 2006April 28, 2006

Copyright © Sojitz Corporation 2006 1
Sojitz Group Statement/ Slogan / Management Vision
Sojitz Group Statement
The Sojitz Group produces new sources of wealth by connecting the world’s economies, cultures and people in a spirit of integrity.
Sojitz Group Slogan
Group Management Vision
To establish a multi-faceted business, which has both top-tier competitiveness and strong earning power in specific industries and markets, by continuously pursuing profitability and growth in core business areas
To nurture an innovative trading company, by actively responding to environmental changes and market globalization, and continuously developing new business fields through entrepreneurship
To build a function-oriented trading company, by fully grasping and anticipating various client needs and providing sophisticated, tailor-made services as a client's business partner
To become a flexible company, open to new ideas, where each employee can pursue challenges and explore opportunities to realize his or her own personal goals and ambitions.

Copyright © Sojitz Corporation 2006 2
Contents
Disclaimer
Forward-Looking StatementsThis document contains forward-looking statements regarding the Company’s business plans and initiatives based on information available to management at the time of disclosure. Accordingly, such statements contain inherent risks and uncertainties. Readers are advised that actual results may differ from forward-looking statements due to a wide variety of factors.
I. New Stage 2008 Highlights ・・・ P. 3 - 8
II. Growth Strategies ・・・ P. 9 - 20
III. Capital and Financial Strategies ・・・ P. 21 - 26
IV. Risk Management ・・・ P. 27 - 29
V. Numerical targets ・・・ P. 30 - 32

I. New Stage 2008 Highlights

Copyright © Sojitz Corporation 2006 4
Background to New Stage 2008 Medium-term Management Plan
Recurring profit: ¥75 billion (plan) ¥78.8 billion (result)
Net DER: Approximately 3 times (plan) 2 times (result)
Current Medium-term Management Plan (FY2004 – FY2006)
Financial targets for final year (FY2006, ending March 2007) achieved one year ahead of schedule (FY2005, ended March 2006)
Formulated New Stage 2008: new three-year medium-term management plan starting FY2006

Copyright © Sojitz Corporation 2006 5
New Stage 2008 Highlights
Realization of Group Management Vision
Net income: ¥60 billion(recurring profit: ¥100 billion)
Shareholders’ equity: ¥500 billion
Financial Targets (FY2008)Growth Strategies
Move to a stage of sustained growth by leveraging Company’s strengths to expand functions and business investment
Speed-up reorganization of financial structure by clearing up preferred stock issue, stabilize the funding structure
Risk Management
Capital and Financial Strategies
Manage risk to ensure high-quality portfolio

Copyright © Sojitz Corporation 2006 6
Financial Targets (1) Recurring Profit and Core Earnings
Attain goal of ¥100 billion in recurring profit by steadily strengthening ability to generate earnings
58.1
78.883.0
90.0100.0 100.0
81.089.0
51.4
78.5
0
20
40
60
80
100
120
FY04(Results) FY05(Results) FY06(Plan) FY07(Plan) FY08(Plan)
Recurring Profit Core Earnings
Current plan targets achieved ahead of
schedule
New Stage 2008
Recurring profit growth rate:
27%(FY05 – FY08)
(Billions of yen)
*Core earnings = Operating income (Before allowance for doubtful receivables and write offs) + Interest expenses-net + Dividends received + Equity in earnings of unconsolidated subsidiaries and affiliates

Copyright © Sojitz Corporation 2006 7
Financial Targets (2) – Net Income
Move to a stage of sustained growth
20
40
Net income growth rate: 37%
(FY05 – FY08)
40
20
-412.5
43.749.0
53.060.0
-20
0
60
80
FY04(Results) FY05(Results) FY06(Plan) FY07(Plan) FY08(Plan)
New Stage 2008
Current plan targets achieved ahead of
schedule
80
60
(Billions of yen)

Copyright © Sojitz Corporation 2006 8
Financial Targets (3) – Shareholders’ Equity
Steadily build-up net income to reinforce shareholders’ equity
280.2
427.0 420.0460.0
500.0
0
100
200
300
400
500
600
FY04 (Results) FY05 (Results) FY06 (Plan) FY07 (Plan) FY08 (Plan)
(Billions of yen)New Stage 2008

II. Growth Strategies

Copyright © Sojitz Corporation 2006 10
Growth Strategies (1)
Move to a stage of sustained growth by leveraging Company’s strengths to expand functions and business investment
Expand Functions
New
Investment
and Loans
Growth Strategy Categories
Secure Resources
Value Chain
Core Trading ¥300 billion
Regional StrategyObjective: Prioritize potential growth markets and regions where Sojitz has competitive advantages (human resources, commercial rights, know-how, etc.) in allocation of management resources. Target Countries: China, U.S.A, Vietnam, Thailand, and Russia
Human Resources StrategyHuman resources portfolio: Efficiently hire and assign new graduates, mid-career personnel and specialistsHuman resources development: Training programs for executive candidate selection, special language training, specialized training for each division, etc.
Establish SCVA-based ManagementContinue with selection and focus initiatives using SCVA (Sojitz’s risk/return indicator)Maximize shareholder value and build an efficient and sound portfolio through the pursuit of returns commensurate with risk
* SCVA (Sojitz Corporation Value Added) = Net income – (Risk assets X Capital cost ratio)

Copyright © Sojitz Corporation 2006 11
Growth Strategies (2)New
investment and loans (total for
three years)
(Billions of yen)Recurring profitType of Growth Strategy
Method of Growth
Main Business Activities (examples)
SecureResources
Oil, gas, LNGcoal, ferroalloys, nonferrous metals
Automobiles, fertilizers, chemicals, plastics, apparel, home fashions, woodchips
General machinery, aircraft, ships, nuclear fuel cycle, electric power generation and plants, steel products, condominiums, commercial property development, lumber, textile raw materials, foods, commodities, ICT, content
Raise share of production by increasing investment in commercial rights; boost distribution profit
Value Chain
Strengthen and supplement business functions to expand business reach
Core Trading
To bolster core earnings streams, strengthen information gathering capabilities and alliances with leading business partners and expand transaction volume by leveraging competitive strengths
120.0
50.0
130.0
FY05 (Result)
16.7
22.5
34.6
19.0
34.0
38.0
300.078.8 100.0Total
+2.3
+11.5
+3.4
+21.2
FY08 (Plan) Change
New
Investment and Loans
Expand Functions
Corporate and Others 5.0 9.0 +4.0 -
Copyright © Sojitz Corporation 2006 12
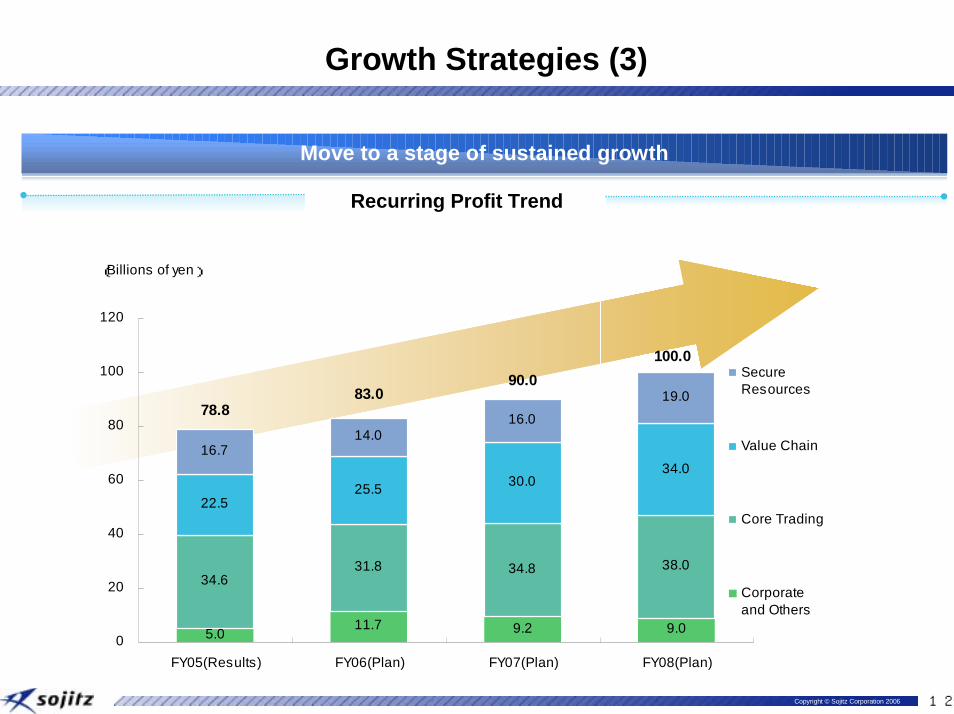
Growth Strategies (3)
Move to a stage of sustained growth
Recurring Profit Trend
5.011.7 9.2 9.0
34.631.8 34.8 38.0
22.525.5 30.0
34.016.7
14.016.0
19.0
100.090.0
83.078.8
0
20
40
60
80
100
120
FY05(Results) FY06(Plan) FY07(Plan) FY08(Plan)
(Billions of yen)
SecureResources
Value Chain
Core Trading
Corporateand Others

Copyright © Sojitz Corporation 2006 13
Growth Strategies (4)
Move to a stage of sustained growth
11.7 9.2 9.00.72.0 4.3 5.9
12.8 14.6 15.35.4
6.9 9.2 10.68.2
7.57.0
9.1
6.7
7.89.1
10.028.122.8
24.926.211.2
11.511.7
5.0
13.5
13.9
100.0
90.083.078.8
0
20
40
60
80
100
120
FY05(Results) FY06(Plan) FY07(Plan) FY08(Plan)
(Billions of yen)
Machinery &Aerospace
Energy & MineralResources
Chemicals &Plastics
Real EstateDevelopment &Forest ProductsConsumerLifestyle Business
OverseasSubsidiaries
New BusinessDevelopmentGroupCorporate andOthers
Recurring Profit by Industry Segment

Copyright © Sojitz Corporation 2006 14
Securing Resources (Example 1) – Oil, Gas and LNG
Utilize Company's information network to build up lucrative upstream interestsand increase share of production and earnings
Amid rising global demand for gas, examine investment in large-scale projects
Sojitz’s major upstream assets New investment and loans: ¥70 billion (planned)Focusing on North Africa, Central and South America and Indonesia, as well as Gulf of Mexico (USA) and the North Sea (Britain)Production target: 40,000 BBL/day*
Indonesia
The North Sea
(Britain)
Gulf of Mexico
Gabon Brazil
Qatar
Oil fields under development Gas fields in operationLNG sites under development
* LNG and gas production: Converted into crude oil equivalent
0
10,000
20,000
30,000
40,000
FY05(Results) FY06(Plan) FY07(Plan) FY08(Plan)
Oil Gas
(BBL/Day)
Share of production
Note:LNG production volume includes gas production volume
Oil fields in operationLNG sites in operation
Gulf of Mexico (USA) upstream pipeline gas interests in 28 concessions

Copyright © Sojitz Corporation 2006 15
Securing Resources (Example 2) –Coal, Ferroalloys and Nonferrous Metals
(1,000 LBS/year)
4,800
4,900
5,000
5,100
5,200
FY05(Results) FY06(Plan) FY07(Plan) FY08(Plan)290
300
310
320
330
FY05(Results) FY06(Plan) FY07(Plan) FY08(Plan)
(1,000 tons/year)
0
2,000
4,000
6,000
8,000
FY05(Results) FY06(Plan) FY07(Plan) FY08(Plan)
Indonesia
Canada
The Philippines
AustraliaRepublic of South Africa New Caledonia
U.S.A
Stable global demand for steel raw materials projected over the medium term
Expand project investment on strength of close relationships with users and ensure stable growth
New investments and loans: ¥50 billion (planned)Planned Project investments
Coal: Australia, Russia and other countries; Molybdenum and vanadium: North America, South America, China and other regions
Major mining rights owned by Sojitz
Share of productionCoal
Coal mines in operation (including equity investment)Steel raw material mines under development
Coal mines under development
Alumina and Nickel Molybdenum and Vanadium
Sojitz is a partner in the Worsley Alumina joint venture
(1,000 tons/year)

Copyright © Sojitz Corporation 2006 16
Value Chain Business (Example 1) – Automobiles
Use investment and loans to strengthen functions and expand business areasto upgrade the automotive value chain
Develop automotive parts business in China and Asia and diversify into assembly and marketing of complete built-up cars in Thailand, Mexico and Ukraine
Design/engineering
Export of KD and complete built-up cars Distributors Dealerships RetailingAssembly and productionMold
buildingMaterial
procurementParts
manufacturing Parts logistics
Upstream business Midstream business Downstream business
China
Thailand
Vietnam
India
Malaysia
The Philippines
IndonesiaNorth and Central
America
South America
Middle East and Africa
Europe CIS
AsiaThe Am
ericas
Subaru cars: Complete built-up cars
Engineering
Robot sales
Engineering
Robot sales
Engineering
Robot sales
Engine, mold design and building
Engineering
Mold building (Miyazu)
Mold design
Bearings
Bearings
Minth (Plastic parts maker)
AAPICO Auto parts manufacturing
MothersonManufacturing plastic parts
Transmission manufacturing
Molds and stamping
Synchronizers
Parts distribution (Autrans)
Parts distribution (Autrans)
Parts distribution (Autrans)
Suzuki cars: KD
Mitsubishi cars: KD
Suzuki cars: KD
Kawasaki motorcycles: KD
Mitsubishi cars: KD
Hyundai and Mitsubishi cars: KD and complete built-up cars
Nissan cars: KD and completebuilt-up cars (Iran)
Suzuki cars: Assembly and wholesaling (Changan Suzuki)
Mitsubishi cars: Assembly and wholesaling(Hunan Changfeng Motor)
Suzuki motorcycles and cars: Assembly and marketing
Assembly and marketing of motorcycles (Modenas)
Mitsubishi cars: Assembly and marketing (MMPC)
MAV (Venezuela) Hyundai and Mitsubishi cars, KD exports, Export and marketing of
complete built-up cars
BMW cars
Used cars
Car navigation systems
Steel and chemicals
Car parts
Subaru (Ukraine)
Mold building
Sintered parts
Plastic parts
Semiconductor substrates
Functional parts
Parts distribution
Parts distribution(Autrans)
Parts distribution (Autrans)
Parts distribution (Autrans)
Passenger cars: KD
Passenger cars: KD
Assembly and marketing of passenger cars
Passenger cars: Assembly and marketing
Isuzu buses and trucks: Assembly and marketing (Ukraine)
Dealers
Dealers
Dealers (Ecuador)
Passenger cars (Iran)
Passenger cars (South Africa)
Steel and chemicals Engines
Accelerator Assembly and marketing of passenger cars and buses
Used cars
Auto financing
Unified sales company in Europe and CIS
Existing functionsNew functions gained through investment and loans (next three years)
Gross trading profit (Billions of yen)
0
10
20
30
FY05
(Results)
FY06 (Plan) FY07 (Plan) FY08 (Plan)
Japan

Copyright © Sojitz Corporation 2006 17
Value Chain Business (Example 2) –Apparel
Integrated supply chain management through to retailing
Established marketing and product planning subsidiary (Sojitz Satellite)
Form alliances with retail chains
Women’s apparel
Planning and marketing company (US)
Marketing and product planning company
Production control
05
101520253035
FY05(Results ) FY06(Plan) FY07(Plan) FY08(Plan)
Gross trading profit (Billions of yen)
Jeans manufacturing(Japan)
Expand presence in retailing
Existing functions
New functions
Forge tie-ups with US apparel firms
Products for SPAretailers
Product planning company (China)
China
Expand manufacturing
facilities in China
Joint venture, alliance factories (China)
Southeast Asia and
otherareas
Establish production bases for export to US (Southeast Asia and other areas)
Production m
anagement com
pany (China)
Production Planning Wholesaling Retailing
Japan Full range of apparel
Japan
China Create SPA jeans retailing chain *SPA: Specialty store retailers
of private label apparel
Establish marketing companies
US

Copyright © Sojitz Corporation 2006 18
Value Chain Business (Example 3) –Chemicals
Deliver sustained sales and profit growth based on solid relationships with leading local and overseas partners
Strategically channel management resources into growth markets: Thailand, Vietnam, China, and India
Use investment to enhance business functions
Organic chemicalsToluene, MEK, DIB, MethanolInorganic chemicals, Industrial mineralsFluorspar, Bauxite, Industrial salts, Caustic soda
Specialty chemicalsBattery materials, semiconductor chemicals, paint raw materials, FPD glass raw materials
Fine chemicalsPharmaceutical and agricultural chemical intermediates, cosmetic raw materials, catalysts
Products handled (roughly 1,400)
Maruzen Petrochemical Co., Ltd.Kyowa Hakko Chemical Co., Ltd.Tokuyama CorporationNippon Shokubai Co., Ltd.Daicel Chemical Industries Ltd.Mitsubishi Chemical Corporation
Suppliers (2,400 companies)
Kansai Paint Co., Ltd.CG Ester Corporation Toli Co., Ltd.Hokuetsu Paper Mills Ltd.Arakawa Chemical Industries Co., Ltd.Dainichiseika Color and Chemicals Mfg. Co., Ltd.Polyplastics Co., Ltd.Toyo Ink Mgf. Co., Ltd.Tokuyama CorporationAsahi Denka Co., Ltd.UMG ABS Ltd.Fuji Photo Film Co., Ltd.Worsley Alumina Pty Ltd.
Customers (2,200)
Mitsubishi Gas Chemical Co., Inc.Tayca Corp.Tosoh Corp.Mitsubishi Rayon Co., Ltd.Asahi Kasei Chemicals Corp.Braskem SAFMC CorporationEastman Chemical CompanyHercules Incorporated
Logistics and warehousing functionsFinancing functionsInformation gathering functions
Growth
Core earnings
Gross trading profit (Billions of yen)
A specialist group capable of anticipating customer needs
0
5
10
15
FY05(Results) FY06(Plan) FY07(Plan) FY08(Plan)
Investing aggressively in all phases of operations, upstream to downstream (manufacturing, production bases, marketing networks)
Organically linking customers, products and markets to extend the value chain

Copyright © Sojitz Corporation 2006 19
Core Trading Business (Example 1) – Commercial Aircraft Business
Backed by superior information gathering and proposal development capabilities, Sojitz Group dominates Japan’s commercial aircraft market
Order backlog for Boeing aircraft sustained at ¥1 trillion level
Sole sales consultant in Japan for Boeing commercial aircraft
Market share in Japan currently exceeds 85%
Introduced over 600 aircraft in Japan in last 50 years
Order backlog of roughly 200 aircraft (¥1.6 trillion) as of March 31, 2006.
Order Backlog Trend (trillions of yen)
Ability to provide added value (information gathering and proposal development) to Boeing and Japan’s airlines, leveraging experience built up over years in aircraft business.
Ability to respond flexibly to new aircraft introduction plans of Japan’s airlines. (2003 – 2005 Sojitz successfully contracted for around 80 next-generation B787 mid-size jets and about 80 state-of-the-art B737NG small jets.)
Sources of Strength
0.0
0.2
0.4
0.6
0.8
1.0
1.2
1.4
1.6
1.8
03/3 04/3 05/3 06/3 07/3 08/3 09/3
*Excluding new orders

Copyright © Sojitz Corporation 2006 20
Core Trading Business (Example 2) – Retail Property Development Business
Sojitz optimally leverages its trading company functions as a leading developer in the retail property development business
Invest roughly ¥20 billion over three years in central Tokyo projects in response to expected tightening of suburban store planning regulations
GOTEMBA PREMIUM OUTLETS
RINKU PREMIUM OUTLETS
Financing
Site selection
We are able to attract and select quality tenants by proactively responding to customer needs.We have developed a
business model that employs sophisticated financing schemes and boasts extremely high investment efficiency.
We select project sites with care, drawing on know-how acquired in previous development projects.
Alongside conventional large-scale suburban retail property development, we are diversifying into local SC and urban retail property development to accumulate know-how that will support expansion of our business portfolio.
Future Focus
13 1314
17
0
10
20
FY05(Results) FY06(Plan) FY07Plan) FY08(Plan)
Number of projects
MALLAGE SAGA
Deliver higher returns
Store planning and management
We secure stable rental revenue from quality tenants.
Tenant selection

III. Capital and Financial Strategies

Copyright © Sojitz Corporation 2006 22
Capital Strategy: Reorganize Capital Structure (Clear up Preferred Stock Issues)
Entered into agreement to repurchase preferred stock totaling ¥560.4 billion (issue price)for ¥342.9 billion - ¥354.1 billion (maximum)
Of outstanding balance of preferred stock (¥576.0 billion as of April 28, 2006), we will repurchase a total of ¥560.4 billion with conversion periods commencing May 2008 or after to accelerate financial restructuring.
By bringing down the significant dilution estimated at this point, total dilution will be dampened, raising the value of Sojitz stock.
We will accumulate shareholders’ equity by reducing the burden of dividends on preferred stock eases.
Procuring funds from external sources through a ¥300 billion convertible bond issue
The expected reduction of shareholders’ equity due to repurchase of preferred stock will be minimized by using funds raised through a CB issue, allowing the Company to further increase shareholders’ equity during the New Stage 2008 Medium-term Management Plan period.

Copyright © Sojitz Corporation 2006 23
Capital Strategy: Speed-up Capital Restructuring (Concrete measures)
In FY05, we repurchased and cancelled ¥40 billion of preferred stock out of a total ¥52.6 billion (issue price)1st Series Class I
2nd Series Class I
3rd Series Class I
4th Series Class I
1st Series Class II
1st Series Class IV
1st Series Class V
2nd Series Class V
Subtotal
Outstanding amount(Billions of yen)
12.6
Conversion price#1(yen)
262
Starting date of conversion period
2006/5/14
Latent stock#2(thousands of shares)
48,092
52.6 262 2008/5/14 200,763
199.5
52.6 262 2010/5/14 200,763
Ratio#3
11.9%
49.7%
49.7%
52.6 262 2012/5/14 200,763 49.7%
52.6 262 2014/5/14 200,763 49.7%
TBD 2024/10/29 286,638 70.9%
130.5 TBD 2019/10/29 187,500 46.4%
20.0 TBD 2015/10/29 28,736 7.1%
560.4 1,305,927 323.2%
April 28, 2006Sojitz enters an agreement with holders of preferred stock to repurchase preferred stock totaling ¥560.4 billion by paying ¥342.9 billion to ¥ 354.1 billion (maximum). Decided to submit proposal for reduction of capital and capital reserve to the Annual General Meeting of Shareholders.Approved resolution to issue convertible bonds (¥300 billion) through private placement
Outstanding Preferred Stock (as of March 31, 2006) Measures for Preferred Stock
#1: Based on maximum conversion price of ¥262 for 1st Series Class I, 2nd Series Class I, 3rd Series Class I, 4th Series Class I, 1st Series Class II and a conversion price of ¥503 for 1st Series Class III preferred shares.
#2: Based on estimates for conversion of latent stock from 1st Series Class IV, 1st Series Class V, 2nd Series Class V at ¥696, the closing price on March 31, 2006.
#3: Latent stock as a percentage of total outstanding common shares of 404,208 thousand (as of March 31, 2006). (Latent stock/Outstanding sharesX100)
Total preferred stock outstanding 576.0 1,359,983 336.5%
1st Series Class III 3.0 503 2004/5/14 5,964 1.5%

Copyright © Sojitz Corporation 2006 24
Capital Strategy: Speed-up Capital Restructuring(Dampening the effect of dilution)
Number of Company’s outstanding common shares shall increase to 1,305,927 thousand shares (323% of the common shares outstanding as of March 31, 2006) assuming that all preferred shares with conversion periods commencing May 2008 and after are converted.
Compared with current estimates, total dilution can be held down by reducing the significant dilution resulting from conversion of CB. This can be achieved by repurchasing preferred stock with funds raised through convertible bonds.
(Thousands of shares)
0
200,000
400,000
600,000
800,000
1,000,000
1,200,000
1,400,000
Conversion of preferred stock
Conversion of CBs: Case 1
Case 3 Case 4
1st Series Class IV
~2nd Series
Class V
2nd Series Class I
~1st Series
Class II
Dampening effect
Case 2
Estimated Increase in Common Shares
Conversion of all preferred shares:Increase in the number of shares under the following conditions:
2nd Series Class I –1st Series Class II: ¥2621st Series Class IV – 2nd Series Class V: ¥696 (Based on closing price on March 31, 2006)
CB conversionIssue ¥300 billion of convertible bonds and repurchase and cancel preferred stock. (Assuming the following conversion prices)① Increase in the number of common shares at the conversion price of ¥300 (minimum conversion price)②Increase in the number of common shares at the conversion price of ¥348 (50% of the closing price of the Company’s common stock
on March 31, 2006: ¥696)③Increase in the number of common shares at the conversion price of ¥626.4 (90% of the closing price of the Company’s common stock
on March 31, 2006: ¥696)④Increase in the number of common shares at the conversion price of ¥1,392 (Double the closing price of the Company’s common stock
on March 31, 2006: ¥696)

Copyright © Sojitz Corporation 2006 25
Capital Strategy: Summary of Agreement for Repurchase of Preferred Stock
Repurchase schedule: March 31, 2007, a day to determined by the Company between April 1, 2007 and the day prior to the June 2007 Annual General Meeting of Shareholders, September 30, 2007 and March 31, 2008.Total repurchase amount on each of the scheduled repurchase dates: To be determined by the Company based on the conversion amount of CBs in the period from the preceding repurchase date (if first repurchase, from the date of issue of convertible bonds) to the current repurchase date.
Repurchase order : 2nd Series Class I; 3rd Series Class I, 4th Series Class I; 1st Series Class II, 2nd Series Class V; 1st Series Class IV; 1st Series Class VMethod of repurchase :Class I and Class II preferred shares: Based on Annual General Meeting of Shareholders approval for acquisition of treasury stock.
Class IV and Class V preferred shares: Purchase clause added to the Articles of Incorporation.
37.09.03.6
2.01.0
Bank of Tokyo-Mitsubishi UFJMizuho Corporate Bank
Bank of Tokyo-Mitsubishi UFJ
Bank of Tokyo-Mitsubishi UFJ
Bank of Tokyo-Mitsubishi UFJ Mizuho Corporate BankResona BankMitsubishi UFJ Trust and Banking CorporationNorinchukin Bank
Seller and number of shares held
102%
104%
106%
108%
Repurchase price(% of outstanding
amount)
53.6
54.7
55.8
56.8
52.6
52.6
52.6
52.6
Outstanding amount issued
(Billions of yen)
26,300
26,300
26,300
26,300第2回Ⅰ種
Number of shares to be repurchased
(Thousands of shares)
Stock to be repurchased
※The repurchase price shall be raised uniformly by 2% for all preferred shares outstanding and repurchased after October 2007, pushing up the total repurchase amount to a maximum ¥354.1 billion.
(Same coupon for all series and classes of preferred stock)2nd Series Class I
3rd Series Class I
4th Series Class I
1st Series Class II
1st Series Class IV
1st Series Class V
2nd Series Class V
Subtotal
(Billions of yen/per coupon)
Total repurchase amount
(Billions of yen)
45.9199.5 23% 19,950 199.5
56.1130.5 43% 10,875 130.5
10.010.020.020.0 100% 2,000
342.9560.4
# The above agreement is subject to issue of CBs and approval of the following proposals at the Annual General Meeting of Shareholders scheduled for June 27, 2006. •“Increase in the Company’s Authorized Common Shares”•“Addition of a Clause Regarding Terms of Repurchase for Class IV/V Preferred Stock” (The above require Amendments to the Articles of Incorporation)•“Acquisition of Treasury Stock” and “Reduction of Capital and Capital Reserve.”

Copyright © Sojitz Corporation 2006 26
Financial Strategy: Improve Stability of Funding Structure
Measures to improve funding structure• Diversify funding
methods
• Improve long/short debt ratio
FY05 Achievements• Straight bonds ¥95
billion• Syndicated loan
contracts (term loans) ¥148.1 billion
• Long-term debt ¥310 billion
FY08 Targets• Current ratio 120%
or above• Long-term debt ratio
Approximately 70%
New Stage 2008Further improve credit rating (BBB or above) and:
• Continue to issue straight bonds• Shift to long-term debt• Line up additional syndicated loans
New Stage 2008 PlanNew Stage 2008 Plan
864.4 1,040.0
Cash and deposits
435.7
100.1
141.2
Long-term debt430.6
Gross interest-bearing debt1,992.8
426.1
139.2
296.9
1,428.4
521.9
108.4
473.1
1,386.3
775.6933.1
29.2
350.0
250.0
750.0
1,390.0
390.0
Net interest-bearing debt
1,557.1 1,002.3
Approx. 70%
120% or above
Short-term debt
1,320.9
59.2
Straight bonds Commercial paper
78%
81%
25%22%
107%
41%
FY03 (Results) FY04 (Results) FY05(Results) FY08(Plan)
Cash and deposits Current ratioLong-term debt Short-term debt
Long-term debt ratio

IV. Risk Management

Copyright © Sojitz Corporation 2006 28
Strengthen and Enhance Risk Management
Strengthen and enhance comprehensive risk management to improve the portfolio structure
Credit control standards :Use unified internal rating system for domestic and overseas business partners as central plank in Groupwide risk management
Country risk management standards :Limit country exposure based on country ratings and control and manage credit
Business investment standards :
Follow-up management :Periodic follow up + Strict compliance and implementation of exit rules
Hurdle RateInvestee
IRR*<
* IRR=Internal Rate of Return
Risk management Raise on-site risk management awareness
Capital costRisk premium
Country risk+ Partner risk Risk unique to business, etc.
Risk asset control Manage risk assets so they do not exceed shareholders’ equity(Aim to hold to around 0.8 times shareholders’ equity)
(Billions of yen) (Times)Shareholders’ Equity and Risk Assets
0
100
200
300
400
500
600
2005/3 2005/9 2006/3 2009/30.00
0.20
0.40
0.60
0.80
1.00
1.20Risk assets Shareholders' equity Multiple

Copyright © Sojitz Corporation 2006 29
Robust Risk Management and Social Responsibility Initiatives
Strengthen corporate governanceClarify management responsibility and accountability for all stakeholdersEstablish highly transparent management organization
Establish internal control systemsReview and establish internal control systems on a consolidated Group basis (Internal Control Committee)Carry out ongoing system reviews and business process control
Promote complianceComply with rules and regulations and social norms (Compliance Committee)Promote Group Compliance Code of Conduct across the Group
Approach to CSR
Address issues such as environmental protection and compliance (CSR Committee)Aim to become a company trusted by society
Bolster management control system to ensure sustained growth of Group

V. Numerical Targets

Copyright © Sojitz Corporation 2006 31
Consolidated Statements of Operations (Forecast)Billions of yen
FY05 (Results) FY06 (Plan) FY07 (Plan) FY08 (Plan)
Net sales 4,972.1 5,200.0 5,680.0 6,100.0Gross trading profit 242.2 253.0 270.0 300.0
(Gross trading profit ratio) (4.9%) (4.9%) (4.8%) (4.9%)SG&A expenses △ 166.0 △ 172.0 △ 182.5 △ 200.0Operating income 76.2 81.0 87.5 100.0
(Operating income ratio) (1.5%) (1.6%) (1.5%) (1.6%)Other income/expenses 2.6 2.0 2.5 0.0Recurring profit 78.8 83.0 90.0 100.0
(Recurring profit ratio) (1.6%) (1.6%) (1.6%) (1.6%)
Extraordinary gains andlosses △ 9.4 △ 10.0 △ 10.0 △ 10.0
Income before incometaxes and minorityinterests
69.4 73.0 80.0 90.0
Net income 43.7 49.0 53.0 60.0
Core earnings 78.5 81.0 89.0 100.0
ROA 1.8% 2.0% 2.1% 2.3%ROE 12.4% 11.6% 12.0% 12.5%

Copyright © Sojitz Corporation 2006 32
Consolidated Balance Sheets
Billions of yen
FY05 (Results) FY06 (Plan) FY07 (Plan) FY08 (Plan)
Cash and deposits 521.9 350.0 350.0 350.0Operating assets 937.8 990.0 1,050.0 1,090.0
Investment and long-term receivables 604.5 720.0 750.0 800.0
Property and equipment 457.5 440.0 450.0 430.0Total assets 2,521.7 2,500.0 2,600.0 2,670.0
Operating liabilities 708.4 690.0 750.0 780.0Interest-bearing debt 1,386.3 1,390.0 1,390.0 1,390.0Total liabilities 2,094.7 2,080.0 2,140.0 2,170.0
Shareholders’ equity 427.0 420.0 460.0 500.0
Net interest-bearing debt 864.4 1,040.0 1,040.0 1,040.0Net DER (times) 2.0 2.5 2.3 2.1

Summary of Consolidated Financial Results April 28, 2006
Sojitz Corporation (Former Sojitz Holdings Corporation)(URL http ://www.sojitz.com )Listed stock exchange : The first sections of Tokyo and Osaka
Tokyo
Akio Dobashi, President & CEOTakashi Inada, GM, Public Relations Dept. TEL +81-3-5520-3404
Date of Director Meeting for FY2005 Finacial Results : April 28, 2006Adopting of US GAAP : No
1. Consolidated Financial Results for the Years Ended March 31, 2006 and 2005(1)Operating Results (Consolidated) (Rounded down to millions of Japanese Yen)
Notes:1. Equity in Earnings of Unconsolidated subsidiaries and affiliate during the period: (Millions of Yen)
Current fiscal year : 19,149 Last fiscal year : 10,7412. Average number of outstanding shares during the period:
Current fiscal year : 346,172,113 Last fiscal year : 219,825,7983. Changes in accounting policies during the period: Yes
(2)Financial Position (Consolidated)
Notes:1. Number of outstanding shares at the end of the period (Common Stock):
Current fiscal year : 403,985,111 Last fiscal year : 240,066,6942. Number of outstanding shares at the end of the period (Preferred Stock):
Current fiscal year : 145,825,000 Last fiscal year : 166,825,0003. Number of treasury shares at the end of the period:
Current fiscal year : 223,777 Last fiscal year : 179,560
(3) Consolidated Statements of Cash Flows
(4) Consolidated subsidiaries : 321Unconsolidated subsidiaries (accounted for by the equity method) : 12Unconsolidated affiliates (accounted for by the equity method) : 180
(5) Consolidated subsidiaries : (Increase) 24 companies (Decrease) 32 companies(Decrease) 28 companies
2. Consolidated Earnings Forecast for the Year Ending March 2007 (April 1, 2006~March 31, 2007):
Reference: EPS (projection): JPY 121.29
16.9As of
March 31, 2006Millions of Yen
426,949
Operating IncomeMillions of Yen %
4,675,903
Headquarters :
Contact Information :
Securities Code : Company Representative :
For the years ended
5,200,000
Millions of Yen
Net Sales
For the year ending March31, 2007Interim
Full year2,500,000
83,000 49,000
Recurring Profit
Millions of Yen Millions of Yen
Net Income
38,000 24,000
Net Sales
March 31, 2006Millions of Yen %
65,521March 31, 2005 58,088
Recurring ProfitMillions of Yen %
Net Income(Loss)Millions of Yen %
-19.87 (412,475) -
for the Year Ended March 31, 2006
2768
43,7064,972,059 6.33 78,773 35.6176,202 16.30(20.23) 9.30
409,266
(1,440.26)
%
Total Assets Shareholders' Equity Shareholders' Equity Ratio
March 31, 2005 (19,774) 241,109March 31, 2006 43,155 99,155
(212,264)
Millions of Yen
(55,805) 506,254
11.4
Millions of Yen Millions of Yen Millions of Yen
March 31, 2005 2,448,478
For the years ended
For the years endedMarch 31, 2006March 31, 2005
(368.95)
EPS
Yen126.21
(1876.48)
Millions of Yen2,521,679
ROE ROA Recurring profitratio
Adjusted EPS
Yen99.55
-
%
Operating Activities Investing Activities Financing Activities Cash & Cash Equivalentsat the end of the Period
BPS
280,241
Yen
4. Percentage indicate changes in net sales, operating income, recurring profit and net income are compared with precedingperiod.
Affiliated companies accounted for by the equity method : (Increase) 32 companies
%12.4
(138.3)
3.22.1
1.61.2
%
Sojitz Corporation
Group Management Policy
1. Fundamental policy
Sojitz recently formulated New Stage 2008, a new three-year medium-term management plan
starting in fiscal 2006, with the overarching goal of achieving sustained growth for the Group.
Because the main financial targets for the final year (fiscal 2006) of the previous three-year
medium-term management plan were achieved one year early, Sojitz decided to drastically
review the plan. This culminated in the adoption of a fundamental policy for New Stage 2008:
further raise corporate value by enhancing growth strategies, speeding up capital and financial
strategies and enhancing risk management.
Guided by the Sojitz Group Statement, the Company will implement New Stage 2008 to realize
the aims and tenets described in the Group Management Vision.
Sojitz Group Statement
The Sojitz Group produces new sources of wealth by connecting the world’s economies, cultures
and people in a spirit of integrity.
Sojitz Group Slogan
New way, new value
Group Management Vision
・ To establish a multi-faceted business, which has both top-tier competitiveness and strong
earning power in specific industries and markets, by continuously pursuing profitability and
growth in core business areas
・ To nurture an innovative trading company, by actively responding to environmental changes
and market globalization, and continuously developing new business fields through
entrepreneurship
・ To build a function-oriented trading company, by fully grasping and anticipating various
client needs and providing sophisticated, tailor-made services as a client's business partner

・ To become a flexible company, open to new ideas, where each employee can pursue
challenges and explore opportunities to realize his or her own personal goals and ambitions
2. Basic policy on dividends
Sojitz has positioned the stable payment of dividends to shareholders, together with a steady
increase in shareholder value and competitiveness supported by adequate retained earnings, as
key issues for management. Accordingly, the Sojitz Group is committed to the payment of an
appropriate level of dividends after considering such factors as the Company's financial structure
and shareholders’ equity, and funding requirements for investments to boost earnings.
While working to ensure an appropriate level of retained earnings to improve the financial
framework of the entire Group, further enhance growth strategies and accelerate capital and
financial strategies, Sojitz will aim to build up accumulated earnings to pay dividends for fiscal
2006.
3. Summary of previous medium-term management plan
(1) Fundamental policy and financial targets of previous medium-term management plan
The fundamental policy of the previous medium-term management plan was to radically
strengthen the Company's financial framework and implement reforms to achieve a quality
earnings structure, aiming to improve corporate value.
The plan’s consolidated financial targets:
Recurring profit: ¥65.0 billion for the second year of the plan (fiscal 2005)
¥75.0 billion for the final year of the plan (fiscal 2006)
Net DER: Approximately 3 times (net interest-bearing debt: ¥1 trillion level)
Rating: BBB or above
(2) Plan progress and summary
(i) Dramatic strengthening of financial framework
As a result of advancing asset soundness and accumulating a higher level of earnings than
planned, net DER improved dramatically to approximately two times. This improvement, together
with such actions as the issue of straight bonds totaling ¥95.0 billion and the conclusion of
syndicated loan contracts amounting to ¥148.1 billion in fiscal 2005, helped the Company to
enhance the stability of funding and further strengthen its financial framework.

Of preferred stock issued by Sojitz, the Company repurchased and cancelled ¥40.0 billion (issue
price) of 1st Series Class I Preferred Stock totaling ¥44.0 billion yen on January 13, 2006. This
repurchase was funded through capital raised from the conversion of ¥60.0 billion in 2nd Series
Convertible Bonds with acquisition rights, which were issued on June 3, 2005.
(ii) Reforms to build a quality earnings structure
The Company introduced its own risk/return indicator SCVA (Sojitz Corporation Value Added)
and used it as a common company-wide benchmark to review all its businesses, providing the
basis for further selection and focus initiatives. This enabled the Company to rationalize
businesses not generating economic value, invest capital and management resources to expand
existing businesses, reallocate funds for new investments and active M&As, and further raise
value in growth fields. Looking ahead, the Company will implement three processes to improve
SCVA: 1) invest resources in growth fields, 2) withdraw from selected businesses and
low-margin businesses and, 3) conduct continuous business portfolio management and risk
management improvements. In this way, Sojitz will continuously review its business portfolio to
improve SCVA, and implement reforms to achieve a quality earnings structure.
(iii) Plan progress and summary
As shown below, results for fiscal 2005, the second year of the previous medium-term
management plan, exceeded the financial targets for the plan’s final year.
(Billions of yen) FY05
(Plan)
FY05
(Plan –
revised)
FY06
(Plan)
FY05
(Results)
Results vs.
original plan
Results vs.
revised plan
Recurring income 65.0 77.0 75.0 78.8 121.2% 102.3%
Net interest-bearing
debt
1,075.0 940.0 1,050.0 864.4
Net DER (times) 3.3 2.4 2.9 2.0
4. Overview of New Stage 2008
Fundamental policy of New Stage 2008

The fundamental policy of New Stage 2008, the new medium-term management plan, is to
deliver sustained growth through specific strategies aimed at boosting Sojitz’s corporate value:
1) further enhancing growth strategies, 2) accelerating capital and financial strategies, and 3)
upgrading risk management.
(1) Further enhancing growth strategies
To deepen the manner of growth of each business, the Company will further strengthen the
framework needed to support this growth. At the same time, the Company will continue to
implement its selection and focus initiative and further leverage SCVA business management as
a framework to manage growth.
(2) Accelerating capital and financial strategies
To resolve problems related to outstanding preferred stock described below, the Company will
speed up the reorganization of its financial structure and further stabilize the funding structure,
aiming to achieve its current ratio and long-term debt ratio targets.
(3) Upgrading risk management
The Company will upgrade risk management by ensuring greater risk awareness across the
entire Group and building a comprehensive risk management system. This will help Sojitz to
manage risk better and maintain a high-quality portfolio.
5. Restructuring the Company's financial structure by clearing up the preferred stock
issue
Of the outstanding balance of preferred stock (¥576.0 billion as of April 28, 2006), the Company
has entered into an agreement with all holders of preferred stock in question to repurchase a
total of ¥560.4 billion for a purchase price of ¥342.920 billion (up to a maximum of ¥354.128
billion, depending on the time of purchase). This step will accelerate financial restructuring by
completing the repurchase of all outstanding preferred stock, with the exception of the 1st Series
Class III Preferred Stock (outstanding amount ¥3.0 billion), which is already valid for conversion,
and 1st Series Class I Preferred Stock (outstanding amount ¥12.6 billion), convertible since May
14, 2006.
In parallel, Sojitz will submit the following proposals to the Annual General Meeting of
Shareholders scheduled for June 27, 2006:
(1) Approval for acquisition of treasury stock related to 2nd Series through 4th Series Class I

Preferred Stock and 1st Series Class II Preferred Stock.
(2) Amendment to the Articles of Incorporation to add a clause regarding terms of repurchase
for 1st Series Class IV/Class V Preferred Stock and 2nd Series Class V Preferred Stock.
(3) Reduction of capital and capital reserve to ensure funding sources for the above
purchases.
The Company also approved a resolution to issue a 3rd Series and 4th Series of Convertible
Bonds with stock acquisition rights (henceforth, “convertible bonds”) totaling ¥300.0 billion
through a private placement. In line with its policy for the Group, Sojitz decided that this was the
best means of procuring capital while minimizing impact on the stock price due to the carrying
out of multiple conversions during a certain period.
The purpose of this issue of convertible bonds is to minimize the effect of dilution by
repurchasing preferred stock. Moreover, to avoid applying excessive selling pressure on the
market associated with the large size of the issue, Sojitz intends to enter into an agreement with
a bond underwriter to set a combined monthly maximum conversion amount of ¥30.0 billion for
the 3rd Series and 4th Series of Convertible Bonds.
The starting date for the conversion of the 4th Series of Convertible Bonds has been set for July 1,
2006, after the Annual General Meeting of Shareholders. However, this is subject to approval by
the Annual General Meeting of Shareholders for an amendment to the Articles of Incorporation to
permit an increase in the number of authorized common shares.
To fully clear up the preferred stock issue, the Company will repurchase preferred stock in
proportion to the amount of capital procured from the conversion of the convertible bonds,
thereby minimizing the projected reduction in shareholders' equity and allowing the Company to
further reinforce its capital base. To minimize overall the dilution arising from the future
conversion of preferred stock to common shares, the Company is seeking to boost the value of
Sojitz stock and at the same time, reduce the burden of dividend payments to preferred
stockholders and avoid the risk of future increases in the cost of repurchasing preferred stock.
This will significantly help Sojitz to increase shareholders' equity during the course of New Stage
2008.
This repurchase of preferred stock based on the Agreement for Repurchase of Preferred Stock is
subject to the issue of convertible bonds and approval of all the following proposals by the
Annual General Meeting of Shareholders:

•
•
•
•
Amendment to the Articles of Incorporation to permit an increase in the Company’s
authorized common shares
Acquisition of treasury stock
Amendment to the Articles of Incorporation to add a clause regarding terms of repurchase of
preferred stock
Reduction in capital and capital reserve
6. New Stage 2008 financial targets
New Stage 2008 consolidated financial targets:
Net income
Year ending March 31, 2007 Year ending March 31, 2008 Year ending March 31, 2009
¥49.0 billion ¥53.0 billion ¥60.0 billion
Recurring profit
Year ending March 31, 2007 Year ending March 31, 2008 Year ending March 31, 2009
¥83.0 billion ¥90.0 billion ¥100.0 billion
Shareholders' equity
¥500.0 billion (Year ending March 31, 2009)
Financial indicators
Current ratio 120% or above (Year ending March 31, 2009)
Long-term debt ratio Approx. 70% (Year ending March 31, 2009)
7. Future actions
One of the most important issues Sojitz currently faces is ensuring the three initiatives in New
Stage 2008 are implemented according to plan: further enhance growth strategies, accelerate
capital and financial strategies, and upgrade risk management.
To realize the first initiative, the Company will distill into a three-year plan the growth strategies
for each business based on enhancing functions and expanding business investments. Sojitz will
then build a follow-up organization to execute these growth strategies.
With the second initiative, Sojitz will engage in a dialog with the markets to reorganize its
financial structure and improve the stability of its funding structure. To reorganize its financial

structure, Sojitz will repurchase and cancel preferred stock, as previously described, to dampen
potential share value dilution. The Company will also procure capital from external sources to
minimize the projected reduction in shareholders' equity, and improve the financial structure.
Thirdly, Sojitz will upgrade risk management by extending the following fundamental measures
taken in fiscal 2005 across the Group: reforms of the risk operation system, risk-consultation
system and after-the-fact control system, establishment of an internal control system and a
compliance system, and portfolio management reform.
Sojitz will also firmly establish the SCVA risk/return indicator in portfolio management, withdraw
from low-margin businesses and consistently focus on highly competitive businesses. These
measures will enable us to reform the earnings structure and improve the business portfolio.

Sojitz Corporation
(Former Sojitz Holdings Corporation)
Business Results and Financial Position
1. Business Results
(1) Overview of Fiscal 2005
Fiscal 2005, the year ended March 31, 2006, came to a close with lingering feelings of insecurity
in international affairs, reflecting the growing threat of possible terrorist acts by Islamic extremists,
the problem of Iran’s nuclear development program, and widespread suffering and damage
caused by natural disasters such as the hurricane that struck the southern U.S. and a major
earthquake in Pakistan.
During the period, crude oil prices climbed to unprecedented highs, with the WTI reaching
US$70.85 at one point at the end of August 2005. Although there were concerns that this would
impact negatively on many areas, international trade continued to expand and the global
economy sustained its strength from the previous year.
In the U.S., the business environment was firm due mainly to a recovering employment market
and rising incomes, a housing boom that generated new wealth and brisk capital investment.
These factors accommodated downside risks such as the twin issues of deficits and rising crude
oil prices.
Even the undeniably slow-developing European region witnessed a recovery in exports against a
background of strong overseas demand, and driven by the corporate sector, the economy
steadily improved.
Asia maintained its growth rate of nearly 10% despite China’s policy of fiscal restraint. Moreover,
the NIEs and ASEAN countries overcame inventory adjustments in the IT and digital sectors to
continue their export-led economic expansion. The Indian economy also grew powerfully.
The Japanese economy continued to recover, led by private-sector demand generated by capital
investment and personal consumption. External demand was also strong, with firm exports
mainly to the U.S., China and other Asian countries. Given that financial anxieties had receded
and the economy was expected to overcome its period of deflation, the Bank of Japan decided to
end its policy of quantitative fiscal easing in March 2006. Meanwhile, other signs such as an

increase in the Nikkei Stock Average of nearly 50% in just one year showed that the Japanese
economy was steadily moving out of its long period of stagnation.
On October 1, 2005, Sojitz Holdings Corporation merged with its wholly owned subsidiary, Sojitz
Corporation. Sojitz Corporation’s business operations were transferred to the successor
company, Sojitz Holdings Corporation, which subsequently changed its name to Sojitz
Corporation.
This merger had no impact on the business conditions of the corporate group because the
former Sojitz Corporation had been a consolidated subsidiary of Sojitz Holdings Corporation.
Business results for the Sojitz Group for fiscal 2005, the year ended March 31, 2006, are
presented as follows.
In the fiscal year under review, consolidated net sales (total trading transactions) amounted to
¥4,972,059 million, an increase of 6.3% compared with the previous fiscal year.
By type of trade, export sales in the Machinery & Aerospace, Chemicals & Plastics and other
divisions fell 0.7% year on year. However, import sales in the Machinery & Aerospace, Energy &
Mineral Resources and other divisions rose 7.2%. Domestic sales in the Consumer Lifestyle
Business, Chemicals & Plastics, Energy & Mineral Resources and other divisions increased
7.9%, and offshore sales rose 7.9% in the Overseas Subsidiaries, Machinery & Aerospace,
Consumer Lifestyle Business and other divisions.
By business segment, net sales in the Energy & Mineral Resources Division increased 12.0%
compared with the previous fiscal year, partially affected by surging prices for resources. Other
divisions also posted increases in net sales, including the Consumer Lifestyle Business Division,
10.6%, Machinery & Aerospace Division, 10.2%, and Chemicals & Plastics Division, 6.2%. Net
sales at Overseas Subsidiaries also increased, rising 3.4% compared to a year earlier. On the
other hand, sales in the Real Estate Development & Forest Products Division were down 13.3%,
partially reflecting a slump in the forest products market. Net sales in Others fell 2.2%.
On the earnings front, gross trading profit was ¥242,166 million, a slight decline of 0.9%
compared with the previous fiscal year. Positive contributions, including a strong performance
from the Energy & Mineral Resources Division and a recovery by Overseas Subsidiaries, were
offset by a drop in gross trading profit from the Consumer Lifestyle Business Division, owing to
the sale of Nakau Co., Ltd. Operating income rose 16.3% year on year, to ¥76,202 million. This

was mainly attributable to a marked improvement in selling, general and administrative (SG&A)
expenses of ¥12,761 million due to the sale of Nakau Co., Ltd., the benefits of rationalization,
and a decrease in depreciation and amortization expenses through the disposal of fixed assets.
Supported by the increase in operating income, recurring profit jumped 35.6% to ¥78,773 million,
reflecting improved interest expense-net due to a reduction in interest-bearing debt and
increased contributions from equity in earnings of unconsolidated subsidiaries and affiliates, in
particular Metal One Corporation. For fiscal 2005, the Company recorded a net extraordinary
loss of ¥9,358 million. This mainly comprised extraordinary gains of ¥20,025 million, including
gain on sales of investment securities totaling ¥9,522 million and reversal of allowance for
doubtful accounts totaling ¥5,797 million, outweighed by extraordinary losses of ¥29,384 million.
Principal components of extraordinary losses were loss, and provision for loss, on dissolution of
subsidiaries and affiliates amounting to ¥11,645 million, following ongoing reviews of low-profit
businesses, including overseas investments and loans, consistent with the selection and focus
initiatives announced in Sojitz’s current medium-term management plan; restructuring losses of
¥5,482 million, loss on sales of investment securities totaling ¥3,367 million; dilution loss from
changes in equity interest amounting to ¥2,954 million; and impairment losses on fixed assets
totaling ¥2,022 million resulting from the application of the accounting standard for impairment of
fixed assets from the year under review. As a result of these and other factors, income before
income taxes and minority interests for the fiscal year was ¥69,414 million. After accounting for
income taxes of ¥16,484 million, deferred income taxes of ¥5,840 million and minority interests in
consolidated subsidiaries totaling ¥3,383 million, Sojitz Corporation recorded net income for
fiscal 2005 of ¥43,706 million.
(2) Consolidated Industry Segment Results
Machinery & Aerospace
Net sales in this segment totaled ¥958,343 million, an increase of 10.2% compared with the
previous fiscal year, reflecting a rise in the Company’s aircraft-related transactions. Operating
income was ¥16,040 million, up 30.0%, due mainly to higher gross trading profit resulting from a
strong performance by automotive-related subsidiaries.
Energy & Mineral Resources
Net sales in this segment rose 12.0% to ¥1,207,031 million due to surging resource prices and
increased output. Operating income climbed 69.6% to ¥18,017 million, reflecting increased gross
trading profit.
Chemicals & Plastics

Net sales in this segment increased 6.2% to ¥632,861 million, reflecting rises in prices for base
raw materials and products. Operating income was ¥16,556 million, up 5.8%, due to favorable
performances in base raw materials for chemicals and reductions in SG&A expenses.
Real Estate Development & Forest Products
Net sales in this segment fell 13.3% compared with the previous fiscal year to ¥419,746 million
owing to the Company's withdrawal from unprofitable businesses in forest products, despite
increased condominium sales. Operating income declined 11.4% year on year to ¥9,606 million
due to a slump in the forest products market, outweighing a favorable performance by the
condominium business.
Consumer Lifestyle Business
Net sales in the Consumer Lifestyle Business increased 10.6% to ¥868,055 million, partially
reflecting the full-year contribution of a textile sector subsidiary that was newly consolidated in
the second half of the previous fiscal year. However, operating income fell 29.8% to ¥7,973
million due to a downturn in certain areas of the clothing sector and higher SG&A expenses.
Overseas Subsidiaries
Net sales recorded by Overseas Subsidiaries totaled ¥768,547 million, an increase of 3.4%
compared with a year earlier, reflecting strong performances by companies in China and other
parts of Asia. Operating income also rose, increasing 10.6% to ¥4,646 million.
Others
Net sales in Others declined 2.2% to ¥117,474 million, mainly due to decreased lease income
resulting from the disposal of fixed assets for leasing in the previous fiscal year. Operating
income fell 34.7% to ¥2,568 million.

2. Outlook for Fiscal Year 2006
The following shows the performance outlook for the full fiscal year
(Consolidated) (Billions of yen)
Net sales 5,200
Recurring profit 83
Net income 49
(Non-consolidated) (Billions of yen)
Net sales 2,600
Recurring profit 32
Net income 26
The above outlook assumes an exchange rate of ¥110/US$ and a crude oil price of US$50/BBL
(Brent).
The outlook also assumes that Sojitz will merge on schedule with three Sojitz subsidiaries: Sojitz
Urban Development Corporation (scheduled for August 1, 2006), Global Chemical Holdings, Inc.
(scheduled for October 1, 2006) and Sojitz Chemical Corporation (scheduled for October 1,
2006).
Forward-looking Statements
The information on future performance (forward-looking statements) is based on information
available to management at the time of disclosure. Accordingly, readers are advised that actual
results may differ materially from forward-looking statements due to a wide variety of factors
including, but not limited to, economic conditions in the Company’s principal overseas and
domestic markets, and changes in foreign currency exchange markets. The Company will
provide timely disclosure of any material changes or related issues.
3. Financial Position
(1) Consolidated Balance Sheets
Aiming to realize the shift to a quality earnings structure in the second year of the New Business
Plan (the current medium-term management plan), the Company advanced its selection and
focus initiatives to enhance its business portfolio strategy, and invested business resources in
growth domains with the aim of raising SCVA, the Company's own risk/return indicator. Sojitz
also worked to improve its debt structure. Specific steps included procuring new long-term loans
such as large-scale syndicated loan contracts, and improving the stability of the funding structure

by diversifying fund procurement through the issue of straight bonds and other means, ultimately
aiming to improve the current ratio and long-term debt ratio. These efforts paid off with an
improvement in the current ratio to approximately 107%. The Company is also taking steps to
improve its capital structure, aiming to drive a steady improvement in its share value by
dampening the dilutive effect of the conversion of preferred stock. Specifically, the Company
issued ¥60.0 billion in convertible bonds with acquisition rights in June 2005. The entire amount
was converted to common stock by September 2005. Using the funds from this issue, the
Company then repurchased ¥40.0 billion (issue price) of the ¥52.6 billion 1st Series Class I
Preferred Stock for ¥44.0 billion, and cancelled the stock in January 2006.
(2) Cash Flows
In the fiscal year under review, net cash provided by operating activities and investing activities
was ¥43,155 million and ¥99,155 million, respectively. Net cash used in financing activities
totaled ¥55,805 million. After accounting for the effect of exchange rate changes on cash and
cash equivalents and the effect of change in the scope of consolidation, cash and cash
equivalents as of the end of the fiscal year stood at ¥506,254 million.
Cash flows from operating activities
In fiscal 2005, net cash provided by operating activities amounted to ¥43,155 million, a
turnaround from the ¥19,774 million of net cash used by operating activities in the previous fiscal
year. This primarily reflected the 16.3% year-on-year increase in operating income and efforts to
recover trade receivables.
Cash flows from investing activities
Net cash provided by investing activities amounted to ¥99,155 million, a decrease of ¥141,954
million compared with the previous fiscal year. Major cash inflows included the recovery of
long-term receivables and proceeds from sale of investment securities. However, temporary
factors were primarily responsible for the large decrease in net cash, mainly the sale of property
and equipment in line with the implementation of the current medium-term management plan in
the previous fiscal year.
Cash flows from financing activities
Net cash used in financing activities was ¥55,805 million, an improvement of ¥156,459 million
compared to a year earlier. In the process of working to improve its debt structure by improving
its current ratio and long-term debt ratio, Sojitz reduced interest-bearing debt by repaying
short-term debt, and in parallel, sourced funds through new long-term debt and the issue of

straight bonds, thereby laying the foundations for a stable and efficient funding structure.
4. Business and Other Risks
The Sojitz Group is engaged in a wide and diverse range of activities including general trading;
the purchase, sale and trade of goods and commodities; and the manufacture and sale of a wide
variety of products in Japan and overseas. The Sojitz Group also provides comprehensive
services to a variety of industries on a global scale. In addition, it is engaged in planning and
arranging projects, and investing in a variety of business fields and financial activities.
In light of these activities, the Sojitz Group is confronted by numerous risks. These risks include:
market risk relating to movements in foreign exchange rates, interest rates, commodity market
conditions, and stock prices; credit risk relating to non-payment and collection; investment risk;
country risk; and other risks. These risks are to a certain degree unpredictable, and as they
cannot be accurately ascertained, can impact the performance and financial situation of the
Group. Although risk can not be entirely mitigated, the Group is reinforcing and enhancing risk
management to address wide-ranging business risks where possible. Sojitz recognizes that a
unified and integrated approach across the Group is critical to comprehensive risk management.
This also entails quantifying and monitoring risk on an ongoing basis as a vital element of
operations. Additionally, in October 2005, the Company established the Internal Control
Administration Office to build internal control systems, reinforce the compliance structure and
strengthen the management of risk that can not be quantified.
The Sojitz Group is confronted by the following risks in the execution of its daily business
activities:
(1) Market Risk
The Sojitz Group is engaged in global business development and trade and is accordingly
subject to a variety of market risks. Certain transactions are denominated in foreign currencies
and as such are subject to exchange rate risks. The Group is also susceptible to movements in
interest rates in connection with funds procurement and its investment activities. In its daily
operating activities, the Group enters into purchase agreements, maintains inventories, and is
exposed to commodity price risk. In addition, the Group is exposed to stock price risk due to its
holdings of marketable and other securities. As a result, the Group is subject to a variety of
market risks, and transactions susceptible to market risk are not limited to those identified above.
The Sojitz Group works to avoid market risk-related losses by maintaining limits on the position

(short/long) a business unit may assume and by setting loss-cut points. As well as managing
these positions and any related losses, the Group strictly adheres to the loss-cut rule: if a loss
greater than the loss-cut point occurs, the position is immediately dissolved and new
transactions are prohibited during the applicable fiscal year. In order to offset market risks related
to its general marketing and finance activities, the Group matches buying and selling
transactions for commodities, adopts a matching principle for its assets and liabilities, and
applies derivative financial instruments including forward foreign currency contracts, commodity
futures and interest rate swaps.
(2) Credit Risk
In the course of its business, the Sojitz Group extends credit facilities to a large number of
customers in Japan and overseas, which in turn exposes the Group to credit risk. As part of
efforts to manage and control this risk, the Sojitz Group has established an 11-tier credit
assessment system. In each instance, the Group objectively determines a credit rating for each
customer, and based on this rating, sets the level of credit for the individual transaction. In
addition, the Group strives to implement strict security and other collateral requirements in line
with the credit rating for each customer. Furthermore, the Group undertakes periodic assessment
of credit risk related to deferred payment, finance and guarantee procedures based on risk/return
considerations. When the risk/return is considered insufficient, steps are taken to improve
returns and reduce risks.
(3) Investment Risk
One of the major business activities of the Sojitz Group is investing in a variety of business fields,
which are subject to changes in investment values and other risks. The Company has
established a screening system to ascertain the merits and risks of each investment proposal,
and a management system to follow-up investments. Clearly defined standards have also been
formulated with regard to withdrawal from an investment. Through these initiatives, the Group is
working to prevent and reduce loss.
The Company has established a system to adequately screen and select new business
investment opportunities. On evaluating each proposal, the relevant business plan, including
cash flow projections, is comprehensively examined. Profitability is also strictly assessed by
setting a hurdle rate based on the internal rate of return (IRR).
Proposals that have been approved and implemented are subject to periodic review to ensure
the early detection of issues and problems. In the event an issue or problem arises, steps are

taken to ensure minimum loss. In addition, in order to ensure early detection and in an effort to
avoid issues and problems, guidelines are established at the early stages to define acceptable
risk and return, and to identify conditions for withdrawal and loss write-off.
(4) Country Risk
The Sojitz Group is subject to country risk in its trading operations and activities. In order to
minimize country risk, the Company avoids excessive investment exposure to any one country or
region. To this end, the Company evaluates each country and region and assigns a risk rating for
each. For countries and regions with a high country risk rating, the Company sets maximum net
exposure limits in proportion to the country rating and size, within which the Company operates.
In addition, for countries allocated a high country risk rating, country risk avoidance measures
such as trade insurance are implemented for each proposal.

Consolidated Statements of Incomefor the year ended March 31, 2006
Millions of yen
Amount Percentage
Net sales 4,972,059 100.00 4,675,903 100.00 296,156 6.33
Cost of sales (4,729,892) ( 95.13 ) (4,431,656) ( 94.78 ) (298,236) 6.73
Gross trading profit 242,166 4.87 244,247 5.22 (2,081) (0.85)
Selling, general and administrativeexpenses (165,964) ( 3.34 ) (178,725) ( 3.82 ) 12,761 (7.14)
Operating income 76,202 1.53 65,521 1.40 10,681 16.30
Interest income 13,213 0.27 18,431 0.39 (5,218) (28.31)
Dividends 6,816 0.14 3,653 0.08 3,163 86.59
Equity in earnings of unconsolidatedsubsidiaries and affiliates 19,149 0.39 10,741 0.23 8,408 78.28
Gain on sale of securities 2,042 0.04 2,382 0.05 (340) (14.27)
Other income 18,496 0.37 16,439 0.35 2,057 12.51
Non-operating income 59,718 1.20 51,648 1.10 8,070 15.63
Interest expense (38,571) ( 0.78 ) (45,833) ( 0.98 ) 7,262 (15.84)
Interest expense on commercialpapers (1,572) ( 0.03 ) (2,920) ( 0.06 ) 1,348 (46.16)
Other expenses (17,003) ( 0.34 ) (10,328) ( 0.22 ) (6,675) 64.63
Non-operating expense (57,147) ( 1.15 ) (59,082) ( 1.26 ) 1,935 (3.28)
Recurring profit 78,773 1.58 58,088 1.24 20,685 35.61
Extraordinary loss-net (9,358) ( 0.19 ) (438,167) ( 9.37 ) 428,809 (97.86)
Income before income taxes andminority interests 69,414 1.40 (380,079) ( 8.13 ) 449,493 -
Income taxes; Current (16,484) ( 0.33 ) (11,331) ( 0.24 ) (5,153) 45.48
Deferred (5,840) ( 0.12 ) (18,287) ( 0.39 ) 12,447 68.06
Minority interests in consolidatedsubsidiaries (3,383) ( 0.07 ) (2,778) ( 0.06 ) (605) 21.78
Net Income (Loss) 43,706 0.88 (412,475) ( 8.82 ) 456,181 -
Percentage ofNet sales (%) FY2005 Results FY2004 Results Percentage of
Net sales (%)Change

Extraordinary Income and Lossfor the year ended March 31, 2006
Millions of yen
Extraordinary Income;Gain on sale of property & equipment 3,962 2,617 1,345
Gain on sale of investment securities 9,522 8,772 750
Reversal of allowance for doubtful accounts 12 - 12
Dilution gain from changes in equity interest - 1,043 (1,043)
Gain on change in equity method 5,797 - 5,797
Reversal of allowance for retirement benefits - 2,868 (2,868)
Gain on sale of bad debt recovered 617 - 617
Gain on bad debt written-off 112 - 112
Total extraordinary income 20,025 15,301 4,724
Extraordinary Loss;Loss on sale of property & equipment (1,723) (98,113) 96,390
Revaluation loss on property & equipment - (24,650) (24,650)
Impairment losses on fixed assets (2,022) - (2,022)
Loss on sale of investment securities (3,367) (12,916) 9,549
Loss on sale of investment in partnerships (1,238) - (1,238)
Evaluation loss on investment securities (950) (13,415) 12,465
Dilution loss from changes in equity interest (2,954) - (2,954)
Loss, and provision for loss, on dissolution of subsidiaries and affiliates (11,645) (62,265) 50,620
Restructuring loss (5,482) (224,119) 218,637
Loss on liquidation of future transactions - (17,986) 17,986
Total extraordinary loss (29,384) (453,468) 424,084
Extraordinary income/loss, net (9,358) (438,167) 428,809
Reference: the following accounts are not included in the above extraordinary items.
Provision for doubtful receivables (3,224) (1,837) (1,387)
(Included in Selling, general & administrative expenses)
FY2004 Results Change FY2005 Results
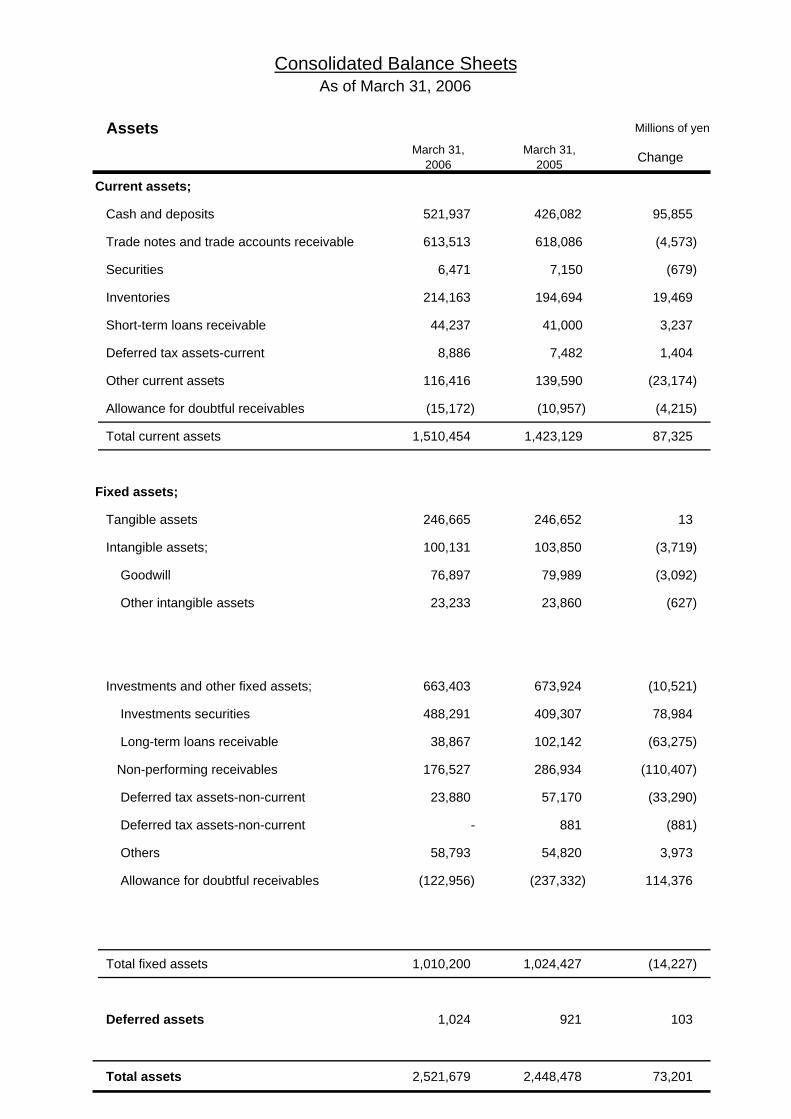
Consolidated Balance SheetsAs of March 31, 2006
Assets Millions of yen
March 31,2006
March 31,2005 Change
Current assets;
Cash and deposits 521,937 426,082 95,855
Trade notes and trade accounts receivable 613,513 618,086 (4,573)
Securities 6,471 7,150 (679)
Inventories 214,163 194,694 19,469
Short-term loans receivable 44,237 41,000 3,237
Deferred tax assets-current 8,886 7,482 1,404
Other current assets 116,416 139,590 (23,174)
Allowance for doubtful receivables (15,172) (10,957) (4,215)
Total current assets 1,510,454 1,423,129 87,325
Fixed assets;
Tangible assets 246,665 246,652 13
Intangible assets; 100,131 103,850 (3,719)
Goodwill 76,897 79,989 (3,092)
Other intangible assets 23,233 23,860 (627)
Investments and other fixed assets; 663,403 673,924 (10,521)
Investments securities 488,291 409,307 78,984
Long-term loans receivable 38,867 102,142 (63,275)
Non-performing receivables 176,527 286,934 (110,407)
Deferred tax assets-non-current 23,880 57,170 (33,290)
Deferred tax assets-non-current - 881 (881)
Others 58,793 54,820 3,973
Allowance for doubtful receivables (122,956) (237,332) 114,376
Total fixed assets 1,010,200 1,024,427 (14,227)
Deferred assets 1,024 921 103
Total assets 2,521,679 2,448,478 73,201
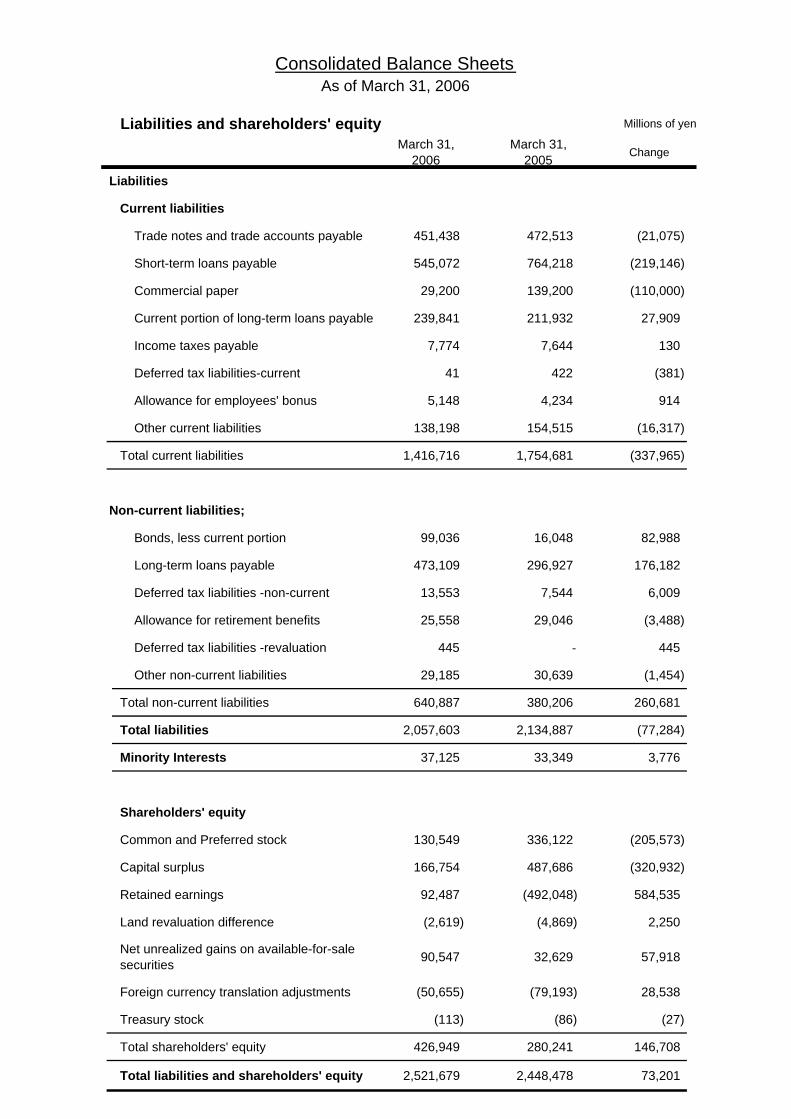
Consolidated Balance SheetsAs of March 31, 2006
Liabilities and shareholders' equity Millions of yen
March 31,2006
March 31,2005 Change
Liabilities
Current liabilities
Trade notes and trade accounts payable 451,438 472,513 (21,075)
Short-term loans payable 545,072 764,218 (219,146)
Commercial paper 29,200 139,200 (110,000)
Current portion of long-term loans payable 239,841 211,932 27,909
Income taxes payable 7,774 7,644 130
Deferred tax liabilities-current 41 422 (381)
Allowance for employees' bonus 5,148 4,234 914
Other current liabilities 138,198 154,515 (16,317)
Total current liabilities 1,416,716 1,754,681 (337,965)
Non-current liabilities;
Bonds, less current portion 99,036 16,048 82,988
Long-term loans payable 473,109 296,927 176,182
Deferred tax liabilities -non-current 13,553 7,544 6,009
Allowance for retirement benefits 25,558 29,046 (3,488)
Deferred tax liabilities -revaluation 445 - 445
Other non-current liabilities 29,185 30,639 (1,454)
Total non-current liabilities 640,887 380,206 260,681
Total liabilities 2,057,603 2,134,887 (77,284)
Minority Interests 37,125 33,349 3,776
Shareholders' equity
Common and Preferred stock 130,549 336,122 (205,573)
Capital surplus 166,754 487,686 (320,932)
Retained earnings 92,487 (492,048) 584,535
Land revaluation difference (2,619) (4,869) 2,250
Net unrealized gains on available-for-salesecurities 90,547 32,629 57,918
Foreign currency translation adjustments (50,655) (79,193) 28,538
Treasury stock (113) (86) (27)
Total shareholders' equity 426,949 280,241 146,708
Total liabilities and shareholders' equity 2,521,679 2,448,478 73,201

Consolidated Statements of Cash Flowsfor the year ended March 31, 2006
Operating activities;Income (loss) before income taxes and minority interests 69,414 (380,079) 449,493Depreciation and amortization 25,958 24,784 1,174Loss on revaluation of securities 950 13,415 (12,465)Decrease (increase) in allowance for doubtful receivables (110,810) 64,121 (174,931)Interest and dividend income (20,030) (22,084) 2,054Interest expense 40,143 48,754 (8,611)Equity in earnings of unconsolidated subsidiaries and affiliates (19,149) (10,741) (8,408)Gain (loss) on sale of securities (4,025) 360 (4,385)Gain (loss) on sale and disposal of property & equipment (2,238) 95,495 (97,733)Losses on revaluation of fixed assets 2,022 24,650 (22,628)Decrease in trade receivables 26,492 7,171 19,321Increase (decrease) in inventories (8,492) 45,102 (53,594)Decrease in trade payables (34,978) (15,770) (19,208)Other, net 77,899 85,043 (7,144)Net cash provided by operating activities 43,155 (19,774) 62,929
Investing ActivitiesIncrease in time deposit, net 2,541 9,832 (7,291)Decrease in marketable securities, net (1,151) 18,111 (19,262)Payments for property & equipment (25,518) (8,358) (17,160)Proceeds from sale of property & equipment 16,462 77,419 (60,957)Payments for purchase of investment securities (24,380) (17,936) (6,444)Proceeds from sale of investment securities 59,272 80,361 (21,089)Decrease in short - term loans receivable, net 27,022 58,176 (31,154)Increase of long - term loans receivable (9,717) (8,180) (1,537)Collection of long-term loans receivable 37,546 26,810 10,736Other, net 17,077 4,872 12,205Net cash provided by investing activities 99,155 241,109 (141,954)
Financing activitiesIncrease in short-term debt, net (233,618) 85,255 (318,873)Decrease in commercial paper, net (110,000) (2,000) (108,000)Proceeds from long-term debt 487,025 203,706 283,319Repayments of long-term debt (262,600) (487,734) 225,134Proceeds from issuance of bonds 154,872 9,998 144,874Redemption of bonds (46,030) (40,088) (5,942)Proceeds from issuance of common / preferred stock - 19,389 (19,389)Purchase of treasury stock (44,000) - (44,000)Other, net (1,453) (790) (663)Net cash used in financing activities (55,805) (212,264) 156,459
Effect of Exchange Rate Changes on Cash & Cash Equivalents 11,921 (882) 12,803Net Decrease in Cash & Cash Equivalents 98,426 8,188 90,238Cash & cash Equivalents at the Beginning of the Period 409,266 401,240 8,026Effect of Change in Scope of Consolidation (1,438) (162) (1,276)Cash & Cash Equivalents at the End of the Period 506,254 409,266 96,988
Millions of yen
FY2004 Results ChangeFY2005 Results

Segment Informationfor the year ended March 31, 2006
Industry Segments
The business segment information for the year ended March 31, 2006 and 2005 are as follows:
Year ended March 31, 2006 Millions of yen
Machinery &Aerospace
Energy &Mineral
Resources
Chemicals &Plastics
Real EstateDevelopment &Forest Products
ConsumerLifestyleBusiness
Net sales
Outside customers 958,343 1,207,031 632,861 419,746 868,055
Inter-segment 12,434 10,279 46,354 3,105 14,015
Total 970,778 1,217,310 679,216 422,851 882,070
Operating expense 954,737 1,199,293 662,659 413,244 874,096
Operating income 16,040 18,017 16,556 9,606 7,973
Total assets 325,062 462,958 360,939 232,052 292,281
OverseasSubsidiaries Other Total Elimination and
Unallocated Consolidated
Net sales
Outside customers 768,547 117,474 4,972,059 - 4,972,059
Inter-segment 318,325 20,792 425,306 (425,306) -
Total 1,086,872 138,266 5,397,366 (425,306) 4,972,059
Operating expense 1,082,226 135,698 5,321,956 (426,098) 4,895,857
Operating income 4,646 2,568 75,409 792 76,202
Total assets 441,054 176,164 2,290,514 231,165 2,521,679
Notes:
2. Company assets included in “Elimination and Unallocated” totaled 447,487 millions of yen and comprised mainly managed surplus (cash and deposits and bonds, andinvestment securities) of the Company.
1. Unallocated costs and expenses included in “Elimination and Unallocated” totaled 3,770 millions of yen and comprised mainly administrative group expenses applicableto the Company and former Sojitz Corporation.
3. Comments relating to changes in the classification of and principal products of industry segments are provided as follows.
In accordance with efforts to streamline the Group’s management structure and to better achieve the objectives identified in the current Medium-term Management Plan(FY2004-FY2006) through an accelerated decision-making process, the Company has reclassified its industry segments from the fiscal year under review as follows.Segment information for the previous fiscal year has been restated in accordance with the revised segment classification for comparative purposes.
- The previous independent industry segments of Construction & Urban Development and Forest Products & Building Materials have been integrated to form the RealEstate Development & Forest Products segment.- The previous independent industry segments of Textiles, Foods, and General Commodities & Consumer Business have been integrated to form the Consumer LifestyleBusiness segment.- Certain steel-related operations previously included in the Other segment have been included in the Energy & Mineral Resources segment.

Segment Informationfor the year ended March 31, 2006
Industry Segments (Continued)
(Ref.) Year ended March 31, 2005 Millions of yen
Machinery &Aerospace
Energy &Mineral
Resources
Chemicals &Plastics
Real EstateDevelopment &Forest Products
ConsumerLifestyleBusiness
Net sales
Outside customers 869,771 1,077,758 596,144 484,403 784,550
Inter-segment 16,845 34,200 29,809 4,564 18,157
Total 886,616 1,111,958 625,953 488,967 802,708
Operating expense 874,279 1,101,335 610,307 478,130 791,347
Operating income 12,336 10,622 15,646 10,836 11,361
Total assets 326,470 428,164 355,287 276,409 279,226
OverseasSubsidiaries Other Total Elimination and
Unallocated Consolidated
Net sales
Outside customers 743,118 120,156 4,675,903 - 4,675,903
Inter-segment 290,456 16,031 410,063 (410,063) -
Total 1,033,574 136,188 5,085,967 (410,063) 4,675,903
Operating expense 1,029,374 132,258 5,017,033 (406,651) 4,610,381
Operating income 4,199 3,930 68,934 (3,412) 65,521
Total assets 474,874 165,939 2,306,373 142,104 2,448,478
Notes:
2. Company assets included in “Elimination and Unallocated” totaled 433,492 millions of yen and comprised mainly managed surplus (cash and deposits and bonds, andinvestment securities) of the Company and former Sojitz Corporation.
1. Unallocated costs and expenses included in “Elimination and Unallocated” totaled 8,260 millions of yen and comprised mainly administrative group expenses applicable tothe Company and former Sojitz Corporation.

Segment Informationfor the year ended March 31, 2006
Geographic Segments
The geographic segment information for the year ended March 31, 2006 and 2005 are as follows:
Year ended March 31, 2006 Millions of yen
Japan North America Europe Asia & Oceania Other TotalElimination
andUnallocated
Consolidated
Net sales
Outside customers 3,796,590 361,726 186,529 580,645 46,567 4,972,059 - 4,972,059
Inter-area 276,221 122,563 43,019 199,905 261 641,972 ( 641,972 ) -
Total 4,072,812 484,289 229,549 780,551 46,829 5,614,031 ( 641,972 ) 4,972,059
Operating expense 4,033,019 475,152 223,514 766,946 39,259 5,537,893 ( 642,035 ) 4,895,857
Operating income 39,792 9,136 6,034 13,604 7,569 76,138 63 76,202
Total assets 1,884,885 199,846 176,432 272,107 47,265 2,580,538 ( 58,859 ) 2,521,679
Notes: 1. Countries and regions are categorized by geographical classification. 2. The principal regions and countries included in each geographic segments are as follows:
North America: United States and CanadaEurope: UK and GermanyAsia & Oceania: Singapore and ChinaOther: South America and Africa
(Ref.) Year ended March 31, 2005 Millions of yen
Japan North America Europe Asia & Oceania Other TotalElimination
andUnallocated
Cosolidated
Net sales
Outside customers 3,542,471 350,122 142,877 598,290 42,142 4,675,903 ( - ) 4,675,903
Inter-area 249,905 112,244 37,929 210,403 345 610,828 ( 610,828 ) -
Total 3,792,377 462,366 180,806 808,694 42,487 5,286,731 ( 610,828 ) 4,675,903
Operating expense 3,749,990 457,867 177,112 795,050 37,152 5,217,174 ( 606,792 ) 4,610,381
Operating income 42,386 4,499 3,693 13,643 5,334 69,557 ( 4,035 ) 65,521
Total assets 1,917,528 193,591 234,599 272,002 48,843 2,666,565 ( 218,087 ) 2,448,478
Notes: 1. Countries and regions are categorized by geographical classification. 2. The principal regions and countries included in each geographic segments are as follows:
North America: United States and CanadaEurope: UK and GermanyAsia & Oceania: Singapore and China Other: South America and Africa
4. Company assets included in “Elimination and Unallocated” totaled 447,487 millions of yen and comprised mainly managed surplus (cash and deposits and bonds, and investmentsecurities) of the Company.
4. Company assets included in “Elimination and Unallocated” totaled 433,492 millions of yen and comprised mainly managed surplus (cash and deposits and bonds, and investmentsecurities) of the Company and former Sojitz Corporation.
3. Unallocated costs and expenses included in “Elimination and Unallocated” totaled 3,770 millions of yen and comprised mainly administrative group expenses applicable to the Companyand former Sojitz Corporation.
3. Unallocated costs and expenses included in “Elimination and Unallocated” totaled 8,260 millions of yen and comprised mainly administrative group expenses applicable to the Companyand former Sojitz Corporation.