threshold? - university of colorado boulderpsych.colorado.edu/~lharvey/p5665 prosem/p5665_2016/class...
TRANSCRIPT
standing of fracture phenomena, re-cently reviewed (6), goes back toinvestigations by Griffith in 1920-21(7). Our understanding of deformationcharacteristics is based on our knowl-edge of imperfections in crystals,called dislocations. Phenomena relatingto dislocations have been intensivelystudied in recent years, but the essen-
tial idea was introduced by Orowan,Taylor, and others in the 1930's. Onthe basis of data on the mechanicalbehavior of pure ice and our currentlevel of understanding of the mechan-ical properties of materials, it has beenpossible to predict the general behavior
of potential ice-alloy systems and toconcentrate research activity in areassuggested by our understanding. ofphenomena rather than by intuitiveinventiveness.
Application of materials science andtechnology to a new system such as
ice emphasizes the disparity betweenconcepts limited by discipline (glaciol-ogy, metallurgy, ceramics, and so on)and those in which there are no arti-ficial, disciplinary barriers. This is a
case where exchange of informationbetween different scientific disciplineshas proved to be useful and effective(9).
References and Notes
1. E. Moser (Naval Civil Engineering Labora-tory), private communication.
2. W. D. Kingery, J. Glaciol. 3, 577 (1960).3. M. F. Perutz, ibid. 1, 95 (1948).4. A. H. Cottrell, Dislocations and Plastic Flow
in Crystals (Clarendon, Oxford, England,1953).
5. W. T. Read, Jr., Dislocations in Crystals(McGraw-Hill, New York, 1953).
6. B. L. Averbach, D. K. Felbeck, G. T. Hahn,D. A. Thomas, Eds., Fracture (TechnologyPress of Massachusetts, Cambridge; Wiley,New York; 1960).
7. A. A. Griffith, Phil. Trans. Roy. Soc. Lon-don A221, 163 (1920-21).
8. M. L. Kronberg, Acta Met. 5, 507 (1957).9. This study was carried out as part of a
program at the Massachusetts Institute ofTechnology sponsored by the TerrestrialSciences Laboratory, Geophysics ResearchDirectorate, Air Force Cambridge ResearchLaboratory, under contract No. AF 19(604)-5994.
Is There a Sensory
Threshold?
When the effects of the observer's response criterionare isolated, a sensory limitation is not evident.
John A. Swets
One hundred years ago, at the incep-tion of an experimental psychology ofthe senses, G. T. Fechner focused at-tention on the concept of a sensory
threshold, a limit on sensitivity. His Ele-mente der Psychophysik described threemethods-the methods of adjustment,of limits, and of constants-for esti-mating the threshold value of a stimulus(1). The concept and the methods havebeen in active service since. Students ofsensory processes have continued tomeasure the energy required for a stim-ulus to be just detectable, or the differ-ence between two stimuli necessary forthe two to be just noticeably different.Very recently there has arisen reason-
able doubt that sensory thresholds exist.The threshold thought to be charac-
teristic of sensory systems has beenregarded in the root sense of that wordas a barrier that must be overcome. Itis analogous to the threshold discoveredby physiologists in single neurons. Justas a nervous impulse either occurs or
does not occur, so it has been thoughtthat when a weak stimulus is presented
168
we either detect it or we do not, withno shades in between. The analogy withthe neuron's all-or-none action, ofcourse, was never meant to be com-
plete; it was plain that at some pointabove the threshold sensations come invarious sizes.
From the start the triggering mecha-nism of the sensory systems was re-
garded as inherently unstable. The firstexperiments disclosed that a given stim-ulus did not produce a consistent "yes"("I detect it") response or a consistent"no" ("I do not detect it") response.
Plots of the "psychometric function"-the proportion of "yes" responses as
a function of the stimulus energy-werein the form of ogives, which suggestedan underlying bell-shaped distributionof threshold levels. Abundant evidencefor continuous physiological change inlarge numbers of receptive and nervous
elements in the various sensory systemsmade this picture eminently reasonable.Thus, the threshold value of a stimulushad to be specified in statistical terms.Fechner's experimental methods were
designed to obtain good estimates of themean and the variance of the thresholddistribution.
It was also assumed from the begin-ning that the observer's attitude affectsthe threshold estimate. The use of as-cending and descending series of stim-ulus energies in the method of limits,to take one example, is intended tocounterbalance the errors of "habitua-tion" and "anticipation"-errors towhich the observer is subject for extra-sensory reasons. Typically, investigatorshave not been satisfied with experimen-tal observers who were merely well mo-tivated; they have felt the need for eliteobservers. They have attempted, by se-lection or training, to obtain observerswho could maintain a reasonably con-stant criterion for a "yes" response.The classical methods for measuring
the threshold, however, do not providea measure of the observer's responsecriterion that is independent of thethreshold measure. As an example, wemay note that a difference between twothreshold estimates obtained with themethod of limits can be attributed to acriterion change only if it is assumedthat sensitivity has remained constant,or to a sensitivity change only if it isassumed that the criterion has remainedconstant. So, although the observer'sresponse criterion affects the estimateof the threshold, the classical proce-dures do not permit calibration of theobserver with respect to his responsecriterion.
Within the past ten years methods
The author is associate professor of psychologyand a staff member of the Research Laboratoryof Electronics, Massachusetts Institute of Tech-nology, Cambridge. This article is adapted froman address delivered at a centennial symposiumhonoring Fechner, sponsored by the AmericanPsychological Association and the PsychometricSociety, held in Chicago in September 1960.
SCIENCE, VOL. 134
on
Janu
ary
11, 2
015
ww
w.s
cien
cem
ag.o
rgD
ownl
oade
d fro
m
on
Janu
ary
11, 2
015
ww
w.s
cien
cem
ag.o
rgD
ownl
oade
d fro
m
on
Janu
ary
11, 2
015
ww
w.s
cien
cem
ag.o
rgD
ownl
oade
d fro
m
on
Janu
ary
11, 2
015
ww
w.s
cien
cem
ag.o
rgD
ownl
oade
d fro
m
on
Janu
ary
11, 2
015
ww
w.s
cien
cem
ag.o
rgD
ownl
oade
d fro
m
on
Janu
ary
11, 2
015
ww
w.s
cien
cem
ag.o
rgD
ownl
oade
d fro
m
on
Janu
ary
11, 2
015
ww
w.s
cien
cem
ag.o
rgD
ownl
oade
d fro
m
on
Janu
ary
11, 2
015
ww
w.s
cien
cem
ag.o
rgD
ownl
oade
d fro
m
on
Janu
ary
11, 2
015
ww
w.s
cien
cem
ag.o
rgD
ownl
oade
d fro
m
on
Janu
ary
11, 2
015
ww
w.s
cien
cem
ag.o
rgD
ownl
oade
d fro
m
have become available that provide areliable, quantitative specification of theresponse criterion. These methods per-mit isolation of the effects of the crite-rion, so that a relatively pure measureof sensitivity remains. Interestingly, thedata collected with these methods giveus good reason to question the existenceof sensory thresholds, to wonder wheth-er anything more than a response cri-terion is involved in the dichotomy ofG'yes" and "no" responses. There is nowreason to believe that sensory excitationvaries continuously and that an ap-parent threshold cut in the continuumresults simply from restricting the ob-server to two categories of response.The methods that permit separating
the criterion and sensitivity measures,and a psychophysical theory that incor-porates the results obtained with thesemethods, stem directly from the mod-ern approach taken by engineers to thegeneral problem of signal detection. Thepsychophysical "detection theory," likethe more general theory, has two parts.One part is a literal translation of thetheory of testing statistical hypotheses,or statistical decision theory: It is thispart of the theory that provides a solu-tion to the criterion estimation prob-lem and deals with sensitivity as a con-tinuous variable. The second part is atheory of ideal observers. It specifiesthe mathematically ideal detection per-formance-the upper limit on detectionperformance that is imposed by the en-vironment-in terms of measurable pa-rameters of the signal and of the mask-ing noise (2).We shall turn in a moment to a de-
scription of the theory and to samplesof the supporting data. Before proceed-ing any further, however, we must notethat, although Fechner started the studyof sensory functions along lines we arenow questioning, he also anticipatedthe present line of attack in both of itsmajor aspects. For one thing, he re-garded Bernoulli's ideas on statisticaldecision as highly relevant to psycho-physical theory (3). More important,while advancing the concept of a thresh-old, he spoke also of what he called"negative sensations"-that is, of agrading of sensory excitation below thethreshold. That subsequent workers inthe field of psychophysics have shownlittle interest in negative sensations isapparent from the fact that, 75 yearsafter Fechner's work, Boring couldwrite: "So also a sensation either occursfrom stimulation or it does not. If itdoes not, it has no demonstrable inten-sity. Fechner talked about negative21 JULY 1961
(subliminal) degrees of intensity, butthat is not good psychology today.Above the limen we can sense degreesof intensity, but introspection cannotdirectly measure these degrees. We areforced to comparison, and there againwe meet an all-or-none principle. Eitherwe can observe a difference or wecannot. Introspection as to the amountof difference is not quantitativelyreliable" (4).
Decision Aspects ofSignal Detection
How detection theory succeeds inestimating the response criterion maybe described in terms of "the funda-mental detection problem." The experi-menter defines an interval of time forthe observer, and the observer mustdecide whether or not a signal is pres-ent during the interval. It is assumedthat every interval contains some ran-dom interference, or noise-noise thatis inherent in the environment, or isproduced inadvertently by the experi-menter's equipment for generating sig-nals, or is deliberately introduced bythe experimenter, or is simply a proper-ty of the sensory system. Some intervalscontain a specified signal in addition tothe background of noise. The observer'sreport is limited to these two classes ofstimulus events-he says either "yes"(a signal was present) or "no" (onlynoise was present). Note that he doesnot say whether or not he saw (orheard) the signal; he says whether,under the particular circumstances, heprefers the decision that it was presentor the decision that it was absent.
There is presumably, coinciding withthe observation interval, some neuralactivity in the relevant sensory system.This activity forms the sensory basis-a part of the total' basis-for the ob-server's report. This "sensory excita-tion," as we shall call it, may be infact either simple or complex; it mayhave many dimensions or few; it maybe qualitative or quantitative; it may beanything. The exact, or even the gen-eral, nature of the actual sensory exci-tation is of no concern to the applica-tion of the theory.
Only two assumptions are madeabout the sensory excitation. One isthat it is continually varying; becauseof the ever-present noise, it varies overtime in the absence of any signal, aswell as from one presentation to thenext of what is nominally the samesignal. The other is that the sensory
excitation, insofar as it affects the ob-server's report, may be represented asa unidimensional variable. In theory,the observer is aware of the probabilitythat each possible excitatory state will-occur during an observation intervalcontaining noise alone and also duringan observation interval containing asignal in addition to the noise, and hebases his report on the ratio of thesetwo quantities, the likelihood ratio. Thelikelihood ratio derived from any ob-servation interval is a real, nonzeronumber and hence may be representedalong a single dimension.
The likelihood-ratio criterion. Theobserver's report after an observationinterval is supposed to depend uponwhether or not the likelihood ratiomeasured in that interval exceeds somecritical value of the likelihood ratio, aresponse criterion. The criterion is pre-sumed to be established by the observerin accordance with his detection goaland the relevant situational parameters.If he wishes to maximize the numberof correct responses, his criterion willdepend upon the a priori probabilitythat a signal will occur in a given in-terval. If he chooses to maximize thetotal payoff, his criterion will dependon this probability and also on thevalues and costs associated with thefour possible outcomes of a decision.Several other detection goals can bedefined; the way in which each of themdetermines the criterion has been de-scribed elsewhere (5). In any case, thecriterion employed by the observer canbe expressed as a value of the likeli-hood ratio. Thus, the observer's deci-sion about an interval is based not onlyon the sensory information he obtainsin that interval but also upon advanceinformation of various kinds and uponhis motivation.
Next, consider a probability definedon the variable likelihood ratio-in par-ticular, the probability that each valueof likelihood ratio will occur with eachof the classes of possible stimulusevents: noise alone and signal plusnoise. There are, then, two probabilitydistributions. The one associated withsignal plus noise will have a greatermean (indeed, its mean is assumed toincrease monotonically with increasesin the signal strength, but for the mo-ment we are considering a particularsignal). Now, if the observer followsthe procedure we have described-thatis, if he reports that the signal is pres-ent whenever the likelihood ratio ex-ceeds a certain criterion and that noisealone is present whenever the likelihood
169
0.90
0.80
0.10
p0
O 0.10 0.20 0.30 0.40 0.50 0.60 0.70 0.80 0.90PO
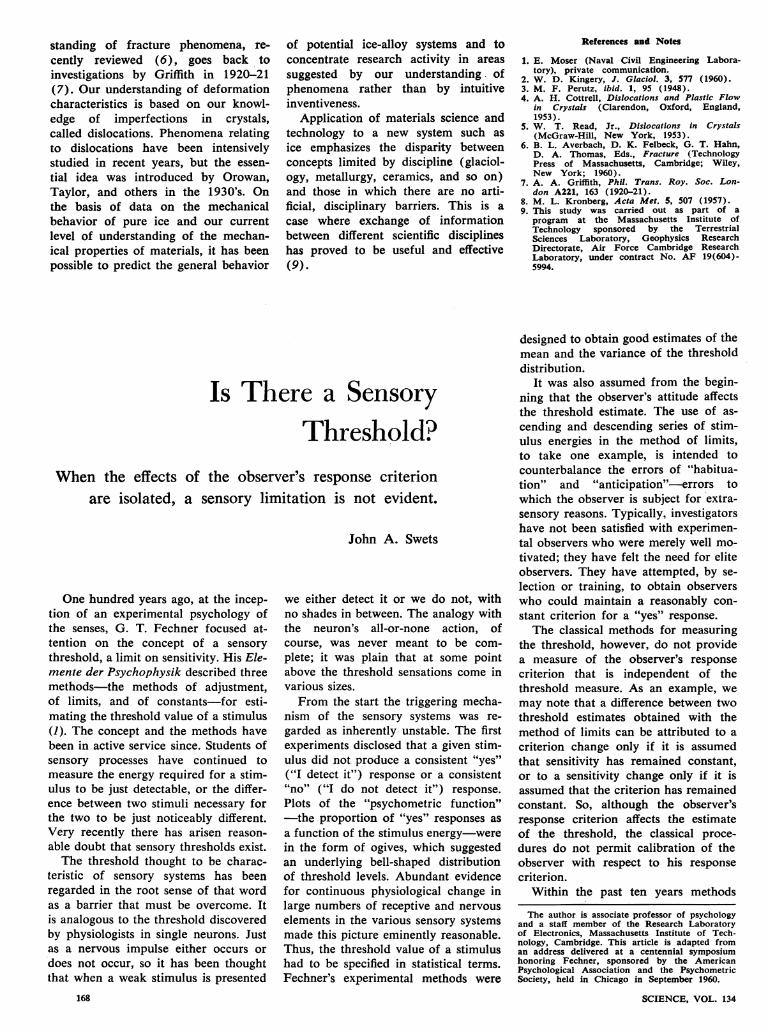
Fig. 1. Two theoretical operating-characteristic curves, with data from a yes-no experiment.
ratio is less than this criterion-then,from the fourfold stimulus-responsematrix that results, one can extract twoindependent measures: a measure ofthe observer's response criterion and a
measure of his sensitivity.The operating characteristic. The ex-
traction of these two measures dependsupon an analysis in terms of the op-erating characteristic. If we induce theobserver to change his criterion fromone set of trials to another, and if, foreach criterion, we plot the proportionof "yes" reports made when the signalis present (the proportion of hits, or
pi) against the proportion of "yes" re-ports made when noise alone is present(the proportion of false alarms, or po),then, as the criterion varies, a singlecurve is traced (running from 0 to 1.0on both coordinates) that shows theproportion of hits to be a nondecreas-ing function of the proportion of falsealarms. This operating-characteristiccurve describes completely the succes-sive stimulus-response matrices that are
obtained, since the complements ofthese two proportions are the propor-tions that belong in the other two cellsof the matrix. The particular curve gen-erated in this way depends upon thesignal and noise parameters and uponthe observer's sensitivity; the point onthis curve that corresponds to any givenstimulus-response matrix represents thecriterion employed by the observer inproducing that matrix.
It has been found that, to a good ap-proximation, the operating-characteristic
170
curves produced by human observerscorrespond to theoretical curves basedon normal probability distributions.These curves can be characterized by asingle parameter: the difference be-tween the means of the signal-plus-noise and noise-alone distributions di-vided by the standard deviation of thenoise distribution. This parameter hasbeen called d'. Moreover, the slope of
0
a.
the curve at any point is equal to thevalue of the likelihood-ratio criterionthat produces that point.
The yes-no experiment. The proce-dure employed in the fundamental de-tection problem is often referred to asthe "yes-no procedure," and we shalladopt this terminology. Two operating-characteristic curves resulting from thisprocedure are shown in Fig. 1. The
6d
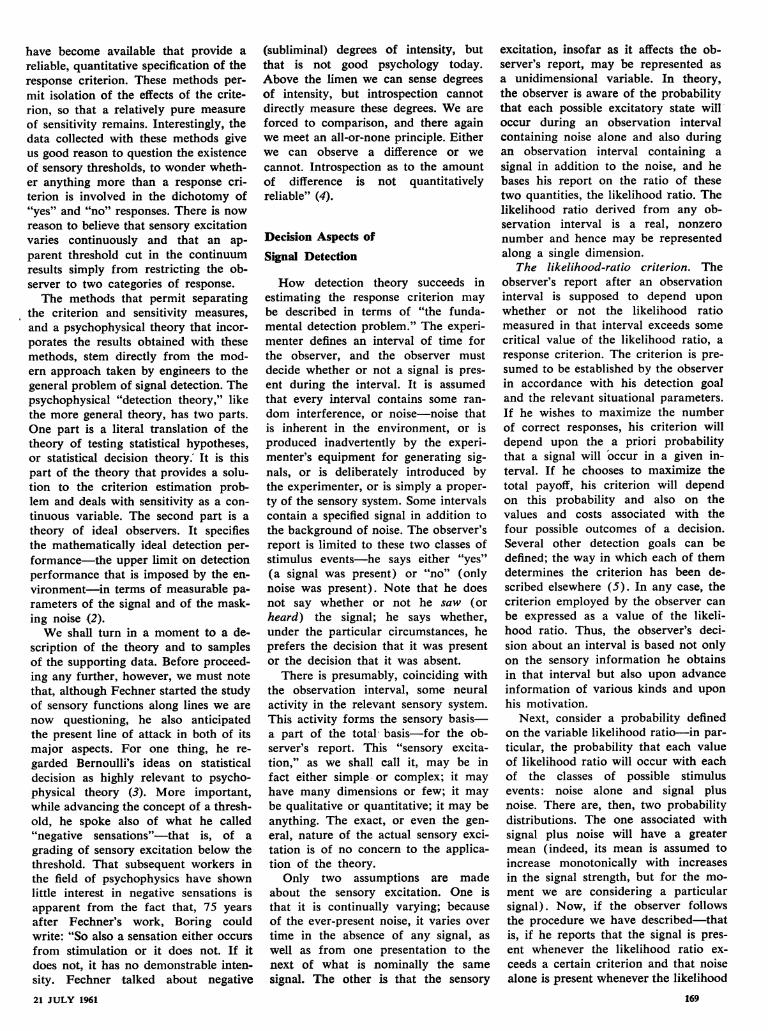
Fig. 2. The results obtained in a second-choice experiment, shown with the predictionfrom detection theory. [Data from J. A. Swets, W. P. Tanner, Jr., T. G. Birdsall (S)]
SCIENCE, VOL. 134
~ ~~~~~~~~~~~~~~~~~~~~~~~~~~~~~~~~ 0
_ d s1.40/ < /~~~~~~.4
/~~~~~~~~~~ I
1.00
a nrs1-00 r
() wAl
0.70
o.60o
Q- 0.50
0.40
0.30
0.201

data points were obtained in an auditoryexperiment in which the observers at-tempted to detect a tone burst in abackground of white noise. The curvesare the theoretical curves that fit thedata best. The inserts at lower right inthe two graphs show the normalprobability distributions underlying thecurves, and the five criteria correspond-ing to the data points. In this particularexperiment the observers changed theircriteria from one set of trials to anotheras the experimenter changed the a prioriprobability of the occurrence of thesignal. The distance between the meansof the two distributions is shown as0.85 for observer No. 1 and as 1.40for observer No. 2; this distance isequal to d' under the convention thatthe standard deviation of the noise dis-tribution is unity.We may note that the curve fitted to
the data of the first observer is sym-metrical about the negative diagonal,and that the curve fitted to the data ofthe second observer is not. Both typesof curves are seen frequently; the sec-ond curve is especially characteristic ofdata collected in visual experiments.Theoretically, the curve shown in thegraph at left will result if the observerknows the signal exactly-that is, if heknows its frequency, amplitude, startingtime, duration, and phase. A theoreticalcurve like the one shown in the graphat right results if the observer has in-adequate information about frequencyand phase, or, as is the case when thesignal is a white light, if there is nofrequency and phase information. Theprobability distributions that are shownin the inserts reflect this differencebetween the operating-characteristiccurves.
Both of the curves shown are basedon the assumption that sensory excita-tion is continuous, that the observercan order values of sensory excitationthroughout its range. Two other experi-ments have been employed to test thevalidity of this assumption: one involvesa variant of the forced-choice proce-dure; the other involves a rating pro-cedure. We shall consider these experi-ments in turn.
The second-choice experiment. Inthe forced-choice procedure, four tem-poral intervals were defined on eachtrial, exactly one of which containedthe signal. The signal was a small spotof light projected briefly on a large,uniformly illuminated background. Or-dinarily, the observer simply choosesthe interval he believes most likely to21 JULY 1961
C()z0
co
I-
wU)CD0
0z0I--
00~0.
-J
zCD
(9)
5i:4
0IL
M-
O
I
Lii
z
i-
1 2 3 4 50.0-0.04 0.20-0.39 0.60-0.79
0.05- 0.19 0.40-0.59 0.80-1.00
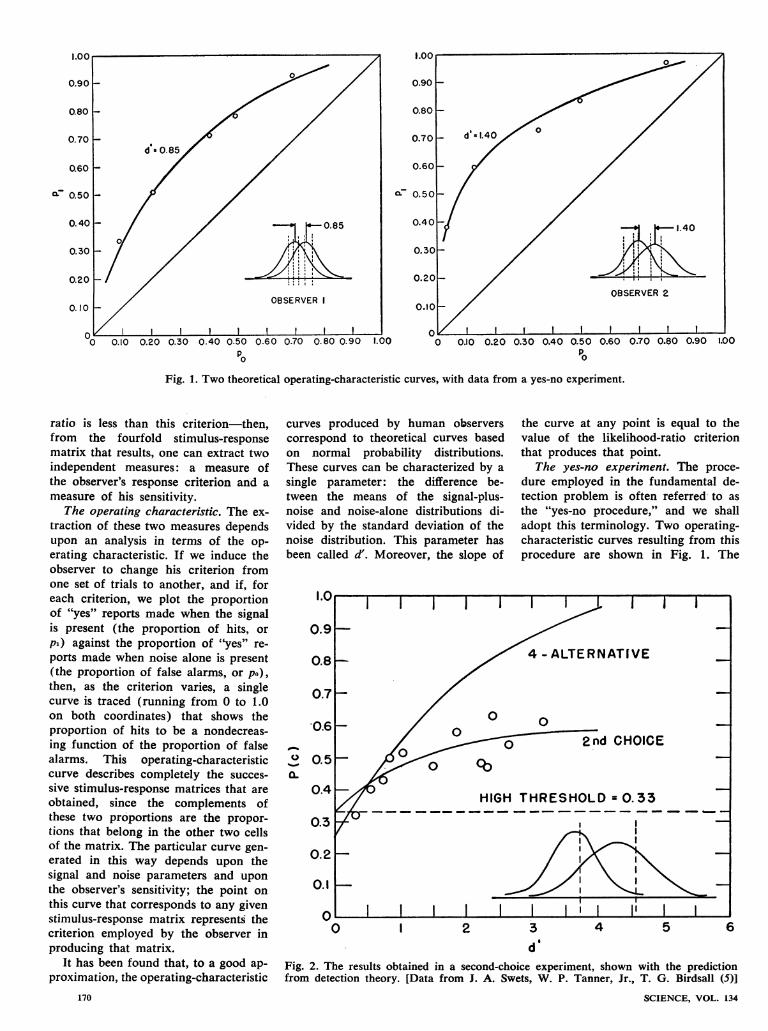
CATEGORIES OF A POSTERIORI PROBABILITYFig. 3. The results of a rating experiment.T. G. Birdsall (5)]
have contained the signal. In this ex-periment the observer made a secondchoice as well as a first.The results are shown in Fig. 2. The
top curve is the theoretical functionrelating the proportion of correct firstchoices to d'; the lower curve is thetheoretical relation of the proportionof correct second choices to d'. Thepoints on the graph represent the pro-portions of correct second choices ob-tained by experiment. They are plottedat the value of d' corresponding to theobserved proportion of correct firstchoices.
It may be seen that the data pointsare fitted well by the theoretical curve.The rather considerable variability canbe attributed to the fact that each pointis based on less than 100 observations.In spite of the variability, it is clearthat the points deviate significantlyfrom the horizontal dashed line. Thedashed line may be taken as a baseline;it assumes a sensory threshold such thatit is exceeded on only a negligible pro-portion of the trials when noise aloneis presented. Should such a thresholdexist, the second choice would be cor-rect only by chance. The data indicatethat the observer is capable of orderingvalues of sensory excitation well below
[Data from J. A. Swets, W. P. Tanner, Jr.,
this point. Two sensory thresholds areshown in the insert at lower right inFig. 2. The threshold on the right, atthree standard deviations from the meanof the noise distribution, correspondsto the horizontal dashed line in theupper part of the figure. The data in-dicate that, were a threshold to exist, itwould have to be at least as low as theleft-hand threshold, at approximatelythe mean of the noise distribution.
The rating experiment. In the ratingprocedure, as in the yes-no procedure,a signal is either presented or not pre-sented in a single observation interval.The observer's task is to reflect grada-tions in the sensory excitation by assign-ing each observation to one of severalcategories of likelihood of occurrenceof a signal in the interval.The results of a visual experiment
are displayed in Fig. 3. The abscissarepresents a six-point scale of certaintyconcerning the occurrence of a signal.The six categories were also defined interms of the a posteriori probability ofoccurrence, but, for our purpose, onlythe property of order need be assumed.The ordinate shows the proportion, ofthe observations placed in each cate-gory, that resulted from the presenta-tion of the signal.
171
Five curves are shown in Fig. 3.Four of them correspond to the fourobservers; the fifth, marked by X's,represents the average. It may be seenthat the curves for three of the fourobservers increase monotonically, whilethat for the fourth has a single reversal.The implication is that the human ob-server can distinguish at least six cate-gories of sensory excitation.
It is possible to compute operating-characteristic curves from these data,by regarding the category boundariessuccessively as criteria. The curves (notshown here) are very similar in appear-ance to those obtained with the yes-noprocedure (5). By way of illustration,the five criteria used by one of the ob-servers (the one represented by solidcircles) are shown in the insert at lowerright in Fig, 3.
The experimental invariance of d'.It has been found experimentally, invision (5) and in audition (6), that thesensitivity measure d' remains relativelyconstant with changes in the responsecriterion. Thus, detection theory pro-vides a measure of sensitivity that ispractically uncontaminated by the fac-tors that might be expected to affectthe observer's attitude.
It has also been found that the meas-ure d' remains relatively invariant withdifferent experimental procedures. Forvision (7) and audition (8) the esti-mates of d' from the yes-no procedureand from the four-interval, forced-choice procedure are very nearly thesame. Again, consistent estimates areobtained from forced-choice pro-cedures with 2, 3, 4, 6, and 8 intervals(8). Finally, the rating procedure yieldsestimates of d' indistinguishable fromthose obtained with the yes-no proce-dure (9).
Thus, the psychophysical detectiontheory has passed some rather severetests-the quantity that is supposed toremain invariant does remain invariant.This finding may be contrasted with thewell-known fact that estimates of thethreshold depend heavily on the par-ticular procedure used.
Theory of Ideal Observers
Detection theory states, for severaltypes of signal and noise, the maxi-mum possible detectability as a func-tion of the parameters of the signal andthe noise. Given certain assumptions,this relationship can be stated very pre-cisely. The case of the "signal specified
172
exactly" (in which everything about thesignal is known, including its frequen-cy, phase, starting time, duration, andamplitude) appears to be a usefulstandard in audition experiments. Inthis case, the maximum d' is equal tothe quantity (2E/No)l, in which E isthe signal energy and No is the noisepower in a one-cycle band. An idealobserver for visual signals has alsobeen defined (10).
It can be argued that a theory ofideal performance is a good startingpoint in working toward a descriptivetheory. Ideal theories involve few vari-ables, and these are simply described.Experiments can be used to uncoverwhatever additional variables may beneeded to describe the performance ofreal observers. Alternatively, experi-ments can be used to indicate how theideal theory may be degraded-that is,to identify those functions of which theideal detection device must be deprived-in order to accurately describe realbehavior.
Given a normative theory, it is pos-sible to describe the real observer's ef-ficiency. In the present instance, theefficiency measure 7 has been definedas the ratio of the observed to the ideal(d')'. It seems likely that substantiveproblems will be illuminated by thecomputation of - for different types ofsignals and for different parameters ofa given type of signal. The observedvariation of this measure should behelpful in determining the range overwhich the human observer can adjustthe parameters of his sensory system tomatch different signal parameters (heis, after all, quite proficient in detectinga surprisingly large number of differentsignals), and in determining whichparameters of a signal the observer isnot using, or not using precisely, in hisdetection process (11).The human observer, of course, per-
forms less well than does the ideal ob-server in the great -majority of detectiontasks, if not in all. te interesting ques-tion concerns not the amount but thenature of the discrepancy that is ob-served.The human observer performs less
well than the ideal observer defined forthe case of the "signal specified exact-ly." That is to say, the human observer'spsychometric function is shifted to theright. More important, the slope of thehuman observer's function is greaterthan that of the ideal function for thisparticular case-a result sometimes re-ferred to as "low-signal suppression."
Let us consider three possible reasonsfor these discrepancies.
First, the human observer may wellhave a noisy decision process, whereasthe ideal decision process is noiseless.For example, the human observer's re-sponse criterion may be unstable. If hevacillates between two criteria, the re-
sulting point on his operating-character-istic curve will be on a straight lineconnecting the points corresponding tothe two criteria; this average point fallsbelow the curve (a curve with smoothlydecreasing slope) on which the twocriteria are located. Again, the ob-server's decision axis may not be con-tinuous. It may be, as far as we know,divided into a relatively small numberof categories-say, into seven.A second likely cause of deviation
from the ideal is the noise inherent inthe human sensory systems. Consistentresults are obtained from estimatingthe amQunt of "internal noise" (that is,noise in the decision process and noisein the sensory system) in two ways: byexamining the decisions of an observerover several presentations of the samesignal and noise (on tape) and by ex-amining the correlation among the re-sponses of several observers to a singlepresentation (12).A third, and favored, possibility is
faulty memory. This explanation isfavored because it accounts not onlyfor the shift of the human observer'spsychometric function but also for thegreater slope of his function. The rea-soning proceeds as follows: If the de-tection process involves some sort oftuning of the receptive apparatus, andif the observer's memory of the charac-teristics of the incoming signal is faul-ty, then the observer is essentially con-fronted with a signal not specifiedexactly but specified only statistically.He has some uncertainty about theincoming signal.
If uncertainty is introduced into thecalculations of the psychometric func-tion of the ideal detector, it- is foundthat performance falls off as uncertain-ty increases, and that this decline inperformance is greater for weaksignals than for strong ones (13). Thatis, a family of theoretical uncertaintycurves shows progressively steeperslopes coinciding with progressive shiftsto the right. This is what one wouldexpect; the accuracy of knowledgeabout signal characteristics is less criti-cal for strong signals, since strong sig-nals carry with them more informationabout these characteristics.
SCIENCE, VOL. 134

It has been observed that visual data(10) and auditory data (14) are fittedwell, with respect to slope, by the theo-retical curve that corresponds to un-certainty among approximately 100orthogonal signal alternatives. It is notdifficult to imagine that the product ofthe uncertainties about the time, loca-tion, and frequency of the signals usedin these experiments could be as highas 100.
It is possible to obtain empirical cor-roboration of this theoretical analysis ofuncertainty in terms of faulty memory.This is achieved by providing variousaids to memory within the experimen-tal procedure. In such experiments,memory for frequency is made un-necessary by introducing a continuoustone or light (a "carrier") of the samefrequency as the signal, so that the sig-nal to be detected is an increment inthe carrier. This procedure also elimi-nates the need for phase memory inaudition and location memory in vision.In further experiments a pulsed carrieris used in order to make unnecessarymemory for starting time and for dura-tion. In all of these experiments aforced-choice procedure is used, so thatmemory for amplitude beyond a singletrial can also be considered irrelevant.In this way, all of the informationthought to be relevant may be con-tained in the immediate situation. Ex-perimentally, we find that the humanobserver's psychometric functions showprogressively flatter slopes as more andmore memory aids are introduced. Infact, when all of the aids mentionedabove are used, the observer's slopeparallels that for the ideal observerwithout uncertainty, and it deviates aslittle as 3 decibels from the ideal curvein absolute value (14).
Relationship of the Data toVarious Threshold Theories
Although there is a lir.it on detectionperformance, even ideally, and althoughthe human observer falls short of thelimit, these facts do not imply a sensorythreshold. We have just seen that thehuman observer's performance can beanalyzed in terms of memory, and,conceivably, additional memory aidscould bring his performance closer tothe ideal. Moreover, consideration ofideal observers concerns an upper ratherthan a lower limit. The human observer,while falling short of the ideal, can stilldetect signals at a high rate. Ideally,21 JULY 1961
any displacement of the signal-plus-noise distribution from the noise-alonedistribution will lead to a detection rategreater than chance. Although it isdifficult to obtain data near the chancepoint, the theoretical curves that fit theplots of d' against signal energy forhuman observers go through zero onthe energy scale.
This last-mentioned result, of course,based as it is on extrapolation, cannotstand by itself as conclusive argumentagainst the existence of a threshold.The result also depends on a measureof performance that is specific to detec-tion theory. So we shall not be con-cerned with it further. It is possible,however, to relate the various thresholdtheories that have been proposed to theexperimental results discussed earlier-results obtained with the yes-no, sec-ond-choice, and rating procedures, asshown in Figs. 1, 2, and 3. We shallexamine these results in relation tothreshold theories proposed by Black-well (15), Luce (16), Green (17),Swets, Tanner, and Birdsall (5), andStevens (18).
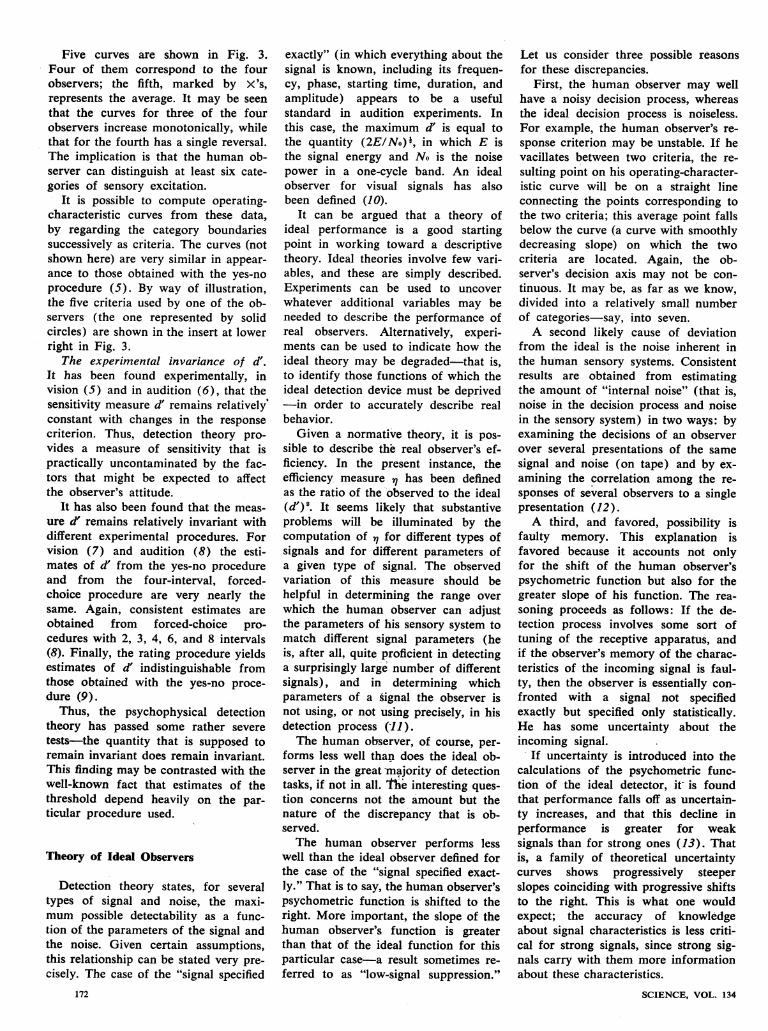
Blackwell's high-threshold theory.Blackwell's theory assumes that, whereasthe observer may be led to say "yes"when noise alone is presented, onlyvery infrequently is his threshold ex-ceeded by the sensory excitation arisingfrom noise-so infrequently, in fact,that these instances can be ignored.There is a "true" value of po-call it po'-that for all practical purposes is equalto zero. Corresponding to po', there issome true pi', the value of which de-pends on the signal strength. Since theobserver is unable to order values ofsensory excitation below p.' 0, if hesays "yes" in response to such a valuehe is merely guessing and will be cor-rect on a chance basis. The operating-characteristic curve (for a given signalstrength) that results from this theoryis that of Fig. 4. It is a straight linefrom (po', pi') through (p. = 1.00,pi = 1.00). The insert at lower rightshows the location of the threshold. Thedata of observer 1 shown in Fig. 1 arereproduced for comparison.
This theoretical curve is described bythe equation
pi =pi' + po(l-pi') (1>The observed proportion of "yes" re-sponses to a signal (pi) equals theproportion of true "yes" responses(pi') plus a guessing factor (po) modi-fied by the opportunity for guessing( -pi'). The beauty of this high-
threshold theory is that, if it is correct,the influence of spurious "yes" re-sponses can be eliminated, the pro-portion of true "yes" responses beingleft. The familiar correction for chancesuccess
Pi=pi -pO1 - Po
(2)
is a rearrangement of Eq. 1. The cor-rection serves to normalize the psycho-metric function so that, whatever theobserver's tendency to guess, the stimu-lus threshold can be taken as the signalenergy corresponding to pi' = 0.50.
However, the theory does not agreewith the data. The empirical curveshown in Fig. 4, like the great majorityof operating-characteristic curves thathave been obtained, is not adequatelyfitted by a straight line. The horizontalline in Fig. 2, which follows from thistheory, does not fit the second-choicedata shown there. The rating data ofFig. 3 also indicate ordering of valuesof sensory excitation below a po ofapproximately zero. Further, yes-noand forced-choice thresholds calculatedfrom this theory are not consistent witheach other (15).
Luce's low-threshold theory. Lucehas suggested that a sensory thresholdmay exist at a somewhat lower levelrelative to the distribution of noise-that is, that po' may be substantial.Apart from this, the low-thresholdtheory is like the high-threshold theory,only twice so. Whereas Blackwell'stheory permits the observer to say"yes" without discrimination when thesensory excitation fails to exceed thethreshold, Luce's theory also permitsthe observer to say "no" without dis-crimination when the sensory excitationdoes exceed the threshold. Thus theoperating-characteristic curve of thistheory contains two linear segments, asshown in Fig. 5. Again, the data forobserver 1 in Fig. 1 are shown for com-parison. The location of the thresholdindicated by these data is shown in theinsert at lower right.
It may be seen that the two-linecurve fits the yes-no data reasonablywell, perhaps as well as the nonlinearcurve of detection theory. Although thecalculations have not been performed,it seems probable that this theory willalso be in fairly good agreement with thesecond-choice data of Fig. 2. It pro-vides for two categories of sensoryexcitation, and two categories wouldseem sufficient to produce a proportionof correct second choices significantly
173

0.101
0 0.10 0.20 0.30 0.40 0.50p0
0.60 0.70 0.80 0.90 1.00
Fig. 4. The results of a yes-no experiment, and a theoretical function from Blackwell'shigh-threshold theory.
1.00
0.90
0.80
0.70
0.60
0.50
0.40
0.30
0.201
0.10
u0 0.10 0.20 0.30 0.40 0.50
POFig. 5. The results of a yes-no experiment, andlow-threshold theory.
174
0.60 0.70 0.80 0.90 1.00
a theoretical function from Luce's
above the chance proportion. However,on the face of it, a two-categor1 theoryis inconsistent with the six categories ofsensory excitation indicated by the rat-ing data of Fig. 3. (We may note inpassing that the theory raises the inter-esting question of how another thresh-old, the one above which a more com-plete ordering exists, might be meas-ured.)
Green's two-threshold theory. Greenhas observed that operating-character-istic data, perhaps adequately fitted byLuce's curve of two segments, are cer-
tainly better fitted by a curve with threelinear segments. This curve, shown inFig. 6, corresponds to a theory that in-cludes a range of uncertainty betweena lower threshold, below which liestrue rejection, and an upper threshold,above which lies true detection. Theinsert at lower right shows the locationof the two thresholds.As is evident from Fig. 6, the curve
of three line segments fits the yes-nodata at least as well as the nonlinearcurve of detection theory. Again, thecalculations have not been performed,but it seems very likely that a three-category theory can account for thesecond-choice data. Even a three-category theory, however, is inconsist-ent with the six categories of sensoryexcitation indicated by the rating data.
There is, of course, no need to stopat two thresholds and three categories.A five-threshold theory, with a curve ofsix line segments, would fit any opera-ting-characteristic data very well in-deed and would also be entirely con-sistent with the second-choice andrating results. However, such a theoryis irrelevant to the question under con-sideration. It is hardly a thresholdtheory in any important sense. It maybe recalled that we considered it earlieras a variant of detection theory.
Swets, Tanner, and Birdsall's low-threshold theory. Tanner, Birdsall, andI proposed a threshold theory that maybe described as combining some of thefeatures of Blackwell's and Luce'stheories. This theory permits orderingof values of sensory excitation abovethe threshold but locates the thresholdwell within the noise distribution.The corresponding operating-character-istic curve is composed of a linear seg-ment above some substantial value of po(say, 0.30 to 0.50) and a curvilinearsegment below this value. Inspection ofFig. 1 shows that such a curve fits yes-no data rather well. It is evident thatthe second-choice data, and rating data
SCIENCE, VOL. 134
IA0).
0.901
0.80
0.70
0.60
0.40
0.30
0~~~
/ I I I1
I /
X//I)
V~~~~~~~~~~~~~~~ l l
I
no
a 0
c7 0.50
0.20[
r
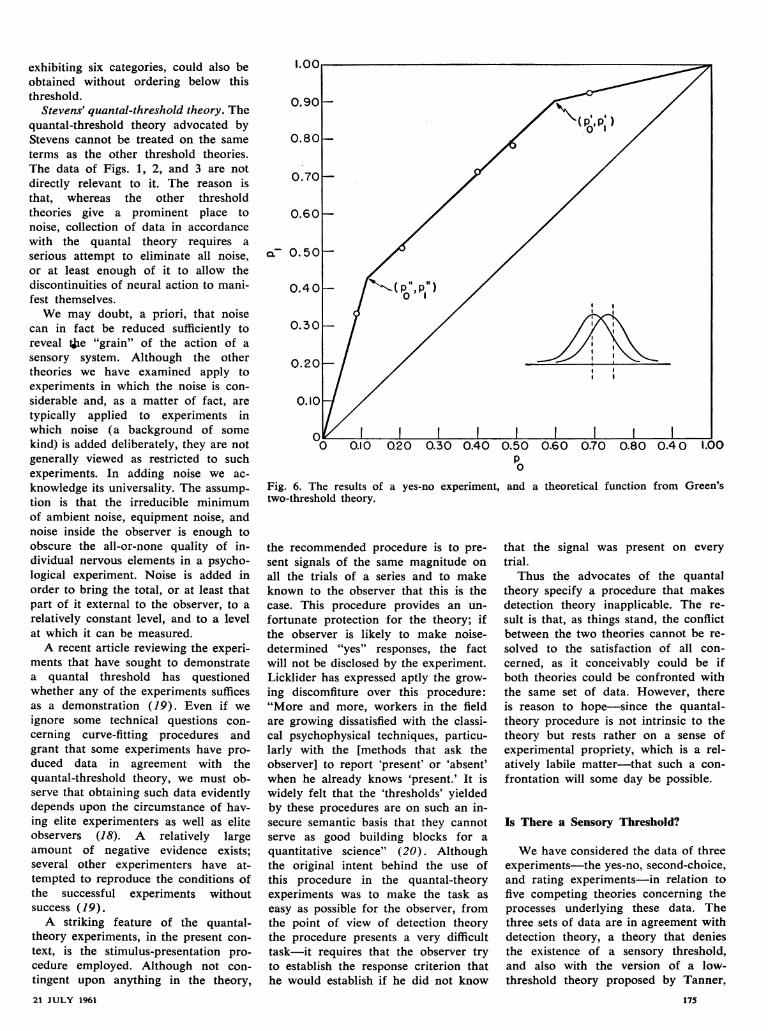
exhibiting six categories, could also beobtained without ordering below thisthreshold.
Stevens' quantal-threshold theory. Thequantal-threshold theory advocated byStevens cannot be treated on the sameterms as the other threshold theories.The data of Figs. 1, 2, and 3 are notdirectly relevant to it. The reason isthat, whereas the other thresholdtheories give a prominent place tonoise, collection of data in accordancewith the quantal theory requires aserious attempt to eliminate all noise,or at least enough of it to allow thediscontinuities of neural action to mani-fest themselves.We may doubt, a priori, that noise
can in fact be reduced sufficiently toreveal the "grain" of the action of asensory system. Although the othertheories we have examined apply toexperiments in which the noise is con-siderable and, as a matter of fact, aretypically applied to experiments inwhich noise (a background of somekind) is added deliberately, they are notgenerally viewed as restricted to suchexperiments. In adding noise we ac-knowledge its universality. The assump-tion is that the irreducible minimumof ambient noise, equipment noise, andnoise inside the observer is enough toobscure the all-or-none quality of in-dividual nervous elements in a psycho-logical experiment. Noise is added inorder to bring the total, or at least thatpart of it external to the observer, to arelatively constant level, and to a levelat which it can be measured.A recent article reviewing the experi-
ments that have sought to demonstratea quantal threshold has questionedwhether any of the experiments sufficesas a demonstration (19). Even if weignore some technical questions con-cerning curve-fitting procedures andgrant that some experiments have pro-duced data in agreement with thequantal-threshold theory, we must ob-serve that obtaining such data evidentlydepends upon the circumstance of hav-ing elite experimenters as well as eliteobservers (18). A relatively largeamount of negative evidence exists;several other experimenters have at-tempted to reproduce the conditions ofthe successful experiments withoutsuccess (19).A striking feature of the quantal-
theory experiments, in the present con-text, is the stimulus-presentation pro-cedure employed. Although not con-tingent upon anything in the theory,21 JULY 1961
I.UU.
0.901
0.801
0.701
0.60oo
Q- 0.50[
0.40
0.30
0.20
0.10
0 0.10 0.20 0.30 0.40 0.50 0.60 0.70 0.80 0.40p
Fig. 6. The results of a yes-no experiment,two-threshold theory.
the recommended procedure is to pre-sent signals of the same magnitude on
all the trials of a series and to makeknown to the observer that this is thecase. This procedure provides an un-
fortunate protection for the theory; ifthe observer is likely to make noise-determined "yes" responses, the factwill not be disclosed by the experiment.Licklider has expressed aptly the grow-ing discomfiture over this procedure:"More and more, workers in the fieldare growing dissatisfied with the classi-cal psychophysical techniques, particu-larly with the [methods that ask theobserver] to report 'present' or 'absent'when he already knows 'present.' It iswidely felt that the 'thresholds' yieldedby these procedures are on such an in-secure semantic basis that they cannotserve as good building blocks for a
quantitative science" (20). Althoughthe original intent behind the use ofthis procedure in the quantal-theoryexperiments was to make the task aseasy as possible for the observer, fromthe point of view of detection theorythe procedure presents a very difficulttask-it requires that the observer tryto establish the response criterion thathe would establish if he did not know
1.00
and a theoretical function from Green's
that the signal was present on everytrial.
Thus the advocates of the quantaltheory specify a procedure that makesdetection theory inapplicable. The re-
sult is that, as things stand, the conflictbetween the two theories cannot be re-solved to the satisfaction of all con-
cerned, as it conceivably could be ifboth theories could be confronted withthe same set of data. However, thereis reason to hope-since the quantal-theory procedure is not intrinsic to thetheory but rests rather on a sense ofexperimental propriety, which is a rel-atively labile matter-that such a con-
frontation will some day be possible.
Is There a Sensory Threshold?
We have considered the data of threeexperiments-the yes-no, second-choice,and rating experiments-in relation tofive competing theories concerning theprocesses underlying these data. Thethree sets of data are in agreement withdetection theory, a theory that deniesthe existence of a sensory threshold,and also with the version of a low-threshold theory proposed by Tanner,
175
-1X ~~~~~~~~~~V I I I I I I I I IVi-
a ^^
Birdsall, and me. Blackwell's high-threshold theory is inconsistent with allthree sets of results. Luce's low-thresh-old theory is consistent with the first,perhaps consistent with the second, andinconsistent with the third. Green's two-threshold theory fits the first two setsof results but not the last. We also con-sidered the only other explicit thresholdtheory available-the quantal theory,to which the three experiments are notdirectly relevant.The outcome is that, as far as we
know, there may be a sensory thresh-old. The possibility of a quantal thresh-old cannot be discounted, and cer-tainly not on the basis of data at hand.On another level of analysis, there maybe what we have termed a low thresh-old, somewhere in the vicinity of themean of the noise distribution. Thelow-threshold theory proposed by Tan-ner, Birdsall, and me fits all of the datawe examined. If the rating experimentcan be dismissed (there is now no ap-parent reason for giving it less than fullstatus), then Luce's and Green'stheories, which involve a low threshold,fit the remaining data.On the other hand, the existence of
a sensory threshold has not beendemonstrated. Data consistent with thequantal theory are, at best, here todayand gone tomorrow, and the theory hasyet to be tested through an objectiveprocedure. With respect to a low thresh-old, we may ask whether demonstra-tion of such a threshold is even con-ceivable.
It is apparent that it will be difficultto measure a low threshold. Considerthe low-threshold theory that permitscomplete ordering above the thresholdin connection with the forced-choice ex-periment. The observer conveys lessinformation about his ordering than heis capable of conveying if only a firstchoice is required. We saw in the pre-ceding discussion that the second choiceconveys a significant amount of infor-mation. Another experiment, in whichthe observer tried to be incorrect, in-dicated that he can order four choices(6). Thus it is difficult to determinewhen enough information has been ex-tracted to yield a valid estimate of alow threshold.
Again, it is difficult to imagine howone might determine the signal energycorresponding to the thresholds ofLuce's and Green's theories. The deter-mination is made especially difficult bythe fact that, in general, empiricaloperating-characteristic curves for var-
176
ious signal energies are fitted well bythe theoretical curves of detectiontheory. Consequently, the line-segmentcurves that best fit the data have linesintersecting at a value of po that de-pends upon the signal energy. The im-plication is that the location of thethreshold depends on the signal energythat is being presented.
Implications for Practice
We have, then, the possibility of athreshold, but it is no more than apossibility, and we must observe thatsince it is practically unmeasurable itwill not be a very useful concept inexperimental practice. Moreover, evenif the low threshold proposed by Tan-ner, Birdsall, and me did exist, andwere measurable, it would not restrictthe application of detection theory. Wemay note that yes-no data resultingfrom a suprathreshold criterion dependupon the criterion but are completelyindependent of the threshold value. Thesame limitation applies to the quantalthreshold. It appears that a compellingdemonstration of this concept will bedifficult to achieve, so that in practicea theory and a method that deal withnoise will be required.
Accordingly, with any attempt tomeasure sensitivity by means of "yes"and "no" responses, a measure of theobserver's response criterion should beobtained. The only way known to ob-tain this measure is to use catch trials-randomly chosen trials that do notcontain a signal. The methods of ad-justment, limits, and constants in theirusual forms, in which the observerknows that the signal is present onevery trial, are inappropriate.A large number of catch trials should
be presented. It is not sufficient to em-ploy a few catch trials, enough tomonitor the observer, and then to re-mind him to avoid "false-positive" re-sponses each time he makes one. Thisprocedure merely forces the criterionup to a point where it cannot be meas-ured, and it can be shown that thecalculated threshold varies by as muchas 6 decibels as the criterion varies inthis unmeasurable range (5). Precisionis also sacrificed when, because highlytrained observers are employed, theuntestable assumption is made that theydo maintain a constant high criterion.Even if all laboratories should befortunate enough to have such observ-ers, we would have to expect a range
of variation of 6 decibels among "con-stant criterion" observers in differentlaboratories. To be sure, for some prob-lems, this amount of variability is notbothersome; for others it is.The presentation of a large number
of catch trials-enough to provide agood estimate of the probability of a"yes" response on such a trial-is stillinadequate if this estimate is then usedto correct the proportion of "yes" re-sponses to the signal for chance suc-cess. The validity of the correction forchance depends upon the existence of ahigh threshold that is inconsistent withall of the data that we examined. Itshould be noted that the common pro-cedure of taking the proportion of cor-rect responses that is halfway betweenchance and perfect performance as cor-responding to the threshold falue ofthe signal is entirely equivalent to usingthe chance correction.
In summary, in measuring sensitivityit is desirable to manipulate the re-sponse criterion so that it lies in arange where it can be measured, to in-clude enough catch trials to obtain agood estimate of this response criterion,and to use a method of analysis thatyields independent measures of sensi-tivity and the response criterion. Onequalification should be added: We canforego estimating the response criterionin a forced-choice experiment. Underthe forced-choice procedure, few observ-ers show a bias in their responses largeenough to affect the sensitivity indexd' appreciably. Those who do showsuch a bias initially can overcome itwith little difficulty. As a result, theobserver can be viewed as choosing theinterval most likely to contain a signal,without regard to any criterion. Forthis reason, the forced-choice proceduremay be used to advantage in studieshaving an emphasis on sensory, ratherthan on motivational or response,processes (21).
.References and Notes
1. G. T. Fechner, Elemente der Psychophysik(1860).
2. The general theory of signal detectability ispresented in W. W. Peterson, T. G. Birdsall,W. C. Fox, IRE Trans. Profess. Group onInformation Theory PGIT-4, 171 (1954).Psychophysical theories similar to it havebeen suggested by M. Smith and Edna A.Wilson, Psychol. Monographs 67, No. 9,Whole No. 359 (1953), and W. N. Munsonand J. E. Karlin, J. Acoust. Soc. Am. 26,542 (1956). The first application of detec-tion theory in psychophysics is described inW. P. Tanner, Jr., and J. A. Swets, Psychol.Rev. 61, 401 (1954).
3. E. G. Boring, A History of ExperimentalPsychology (Appleton-Century-Crofts, NewYork, ed. 2, 1950), p. 284.
4. E. G. Boring, The Physical Dimensions ofConsciousness (Century, New York, 1933).
SCIENCE, VOL. 134

5. J. A. Swets, W. P. Tanner, Jr., T. G. Bird-sall, "The evidence for a decision-makingtheory of visual detection," Electronic De-fense Group, Univ. Michigan, Tech. Rept.No. 40 (1955). This material will appear as"Decision processes in perception," Psychol.Rev.
6. W. P. Tanner, Jr., J. A. Swets, D. M.Green, "Some general properties of the hear-ing mechanism," Electronic Defense Group,Univ. Michigan, Tech. Rept. No. 30 (1956).
7. W. P. Tanner, Jr., and J. A. Swets, Psy-chol. Rev. 61, 401 (1954).
8. J. A. Swets, J. Acoust. Soc. Am. 31, 511(1959).
9. J. P. Egan, A. I. Schulman, G. Z. Green-berg, ibid. 31, 768 (1959).
10. W. P. Tanner, Jr., and R. C. Jones, "Theideal sensor system as approached throughstatistical decision theory and the theory ofsignal detectability," proceedings - of theArmed Forces-NRC Vision Committee meet-ing, Washington, D.C., Nov. 1959.
11. W. P. Tanner, Jr., and T. G. Birdsall,J. Acoust. Soc. Am. 30, 922 (1958).
12. J. A. Swets, E. F. Shipley, M. J. McKey,D. M. Green, ibid. 31, 514 (1959).
13. W W. Peterson, T. G. Birdsall, W. C. Fox,IRE Trans. Profess. Group on InformationTheory PGIT-4, 171 (1954).
14. D. M. Green, J. Acoust. Soc. Am. 32, 1189(1960).
15. H. R. Blackwell, "Threshold psychophysicalmeasurements," unpublished. Also, Univ.
Mich. Eng. Research Inst. Bull. No. 36(1953).
16. R. D. Luce, Science 132, 1495 (1960).17. D. M. Green, personal communication.18. S. S. Stevens, in Sensory Communication,
W. A. Rosenblith, Ed. (Technology Pressand Wiley, New York, in press);Science 133, 80 (1961).
19. J. F. Corso, Psychol. Bull. 53, 371 (1956).20. J. C. R. Licklider, in Psychology: A Study
of Science, S. Koch, Ed. (McGraw-Hill,New York, 1959), vol. 1.
21. The preparation of this paper (technical re-port No. AFCCDD TR 61-10) was sup-ported by the U.S. Army Signal Corps, theAir Force (Office of Scientific Research andOperational Applications Laboratory), andthe Office of Naval Research.
Science arld the News
Hanford and Stanford: The Issue IsClear but the Politics Are ComplexThe complicated politicking that has
linked a $95 million proposal to addpower generating facilities to the new
Hanford, Washington, plutonium reac-
tor and the $114 million proposal tobuild a giant electron accelerator atStanford University grew even more
complicated last week when the Houseof Representatives knocked the Han-ford proposal out of the Atomic EnergyCommission authorization bill. TheHouse defeat set in motion an elab-orate stratagem by supporters of Han-ford to save the project, and thestratagem, until nearly the last minute,involved a threat to kill the Stanfordaccelerator, although this move was
finally abandoned.The Hanford proposal involves
building a generating plant to use thesteam produced by the cooling systemof the plutonium reactor. If built, itwould produce 700,000 kilowatts ofpower, and would be the largest atomicpower plant in the world. Heavy op-
position developed from the privatepower industry, which was immenselydispleased at the idea of the gov-
ernment's going into the productionof atomic power, and from the coalindustry and coal-producing areas
generally, which felt that if the Han-ford plant were not converted to
21 JULY 1961
power production, new coal-fired gen-erating plants would be built to pro-vide for the Northwest's power needs.One West Virginia Democrat from a
coal-mining area who had a nearlyperfect record of support for the Ad-ministration took the floor to dis-sociate himself from the argumentsof the opponents of public power. Hesaid his vote would simply reflectthe fact that he was representing WestVirginia, not the whole United States,and that he could not vote for a pro-posal that would, he feared, just putmore West Virginians on the dole.
In the Pacific Northwest, on theother hand, conservative Republicansjoined the Democrats in supportingthe proposal, and. the strongly con-servative Portland Oregonian, afterthe House vote, published a bittereditorial railing at the "incrediblepiece of Congressional stupidity" basedon "arguments as phony as a leadwedding ring."
The debate, then, was essentiallyover the issue of an expansion ofpublic power, but with many depar-tures from normal voting patterns,based on sectional interests.
Democrats on the Atomic EnergyCommittee hoped to save the pro-
posal after the House defeat by re-
storing the Hanford authorization inconference, with the chance that theconference report might be pushed
through the House. This was the tacticthat enabled the Administration to getthrough its minimum wage bill aftera preliminary defeat in the House.A conference report is supposed to
represent a compromise between rivalHouse and Senate bills. To create atleast an illusion of something thatcould be compromised between theHouse and Senate, the Democratstalked of knocking some provision outof the bill in the Senate. The con-ference committee, controlled by sup-porters of Hanford, could then ar-range a "compromise" in which theHouse would give in on Hanford andthe Senate would graciously restorewhatever it had knocked out. Sincethe Stanford accelerator was the onlyproject in the bill even remotely com-parable in importance to Hanford, theDemocrats planned to try to kill Stan-ford in the Senate.
This was a peculiarly transparentscheme since the same Democratic Sen-ators who as members of the JointAtomic Energy Committee had unani-mously voted in favor of Stanford wouldnow have to take the floor of the Sen-ate to argue that it should be killed.But it was seriously talked about, pri-vately of course, by leading membersof the Joint Committee up until theday before the Senate vote last Tuesday,and apparently finally abandoned onlywhen it became clear that there was noway to get a majority of the Senate togo along with it.
Last Tuesday, opponents of Hanfordin the Senate, led by Hickenlooper ofIowa, fought hard to kill the Hanfordproject then and there by knocking itout of the Senate version, thus leavingno chance for it to be restored in con-ference. But after 3 hours of debatesupporters of the project carried thevote by 54 to 36. This left Hanford inin the Senate version, out in the House,and with a majority in the conference
177