through collaborative factory-to-shelf … · net result: ahold gain market share . 8 ... online...
TRANSCRIPT
1
THROUGH COLLABORATIVE FACTORY-TO-SHELF MANAGEMENT
2
The environment
Retailer initiatives
Manufacturer initiatives
Q&A Session
Close
AGENDA
3
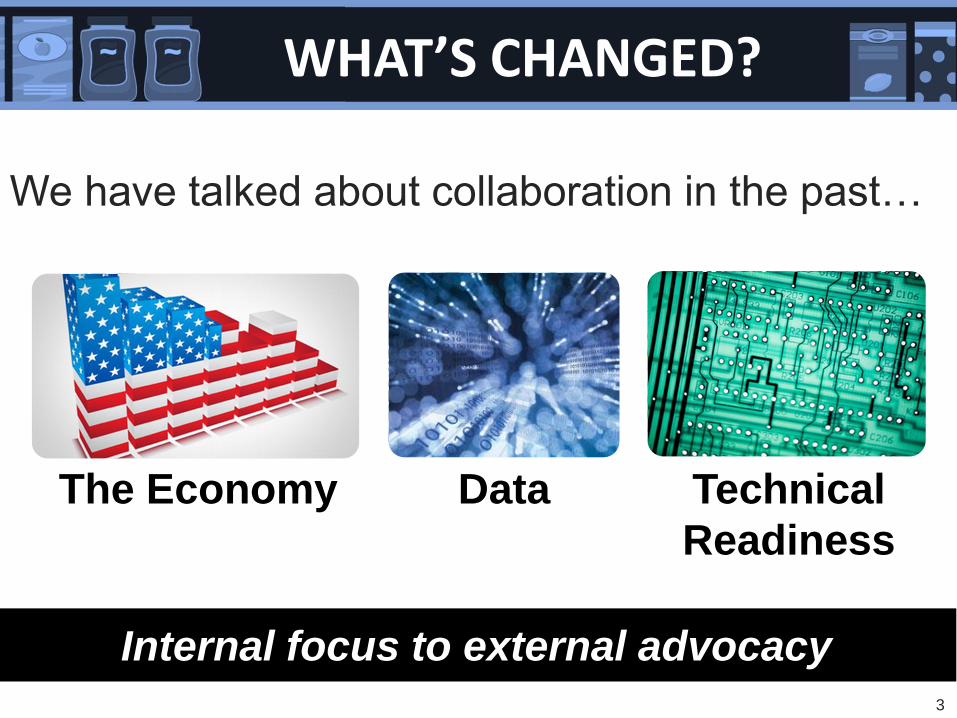
We have talked about collaboration in the past…
WHAT’S CHANGED?
Internal focus to external advocacy
The Economy Data Technical
Readiness
4
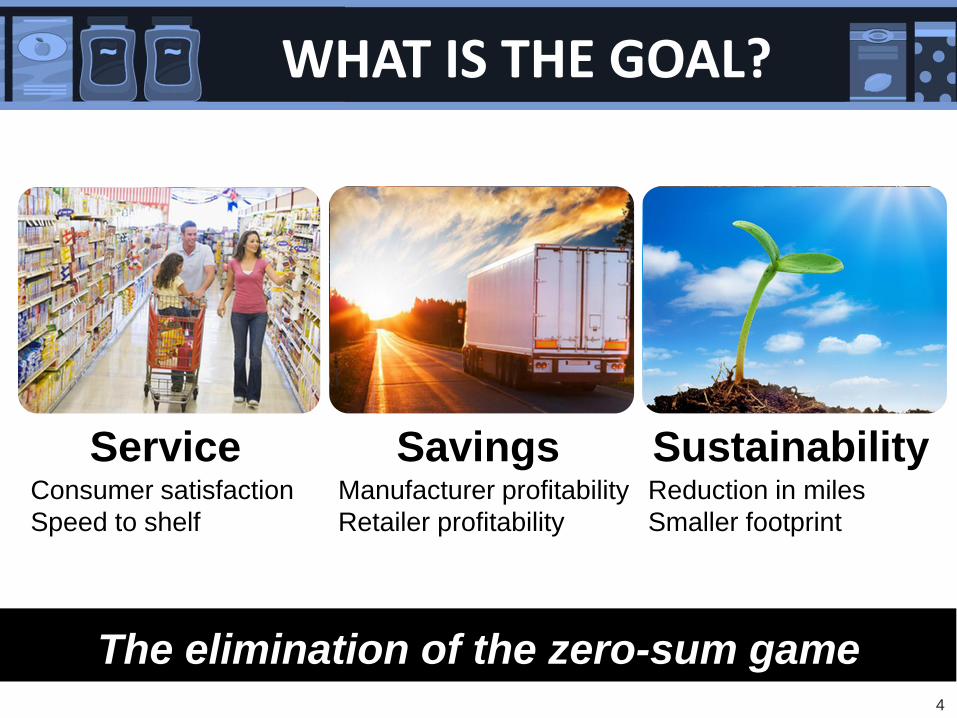
WHAT IS THE GOAL?
The elimination of the zero-sum game
Service Savings Sustainability Consumer satisfaction
Speed to shelf
Manufacturer profitability
Retailer profitability
Reduction in miles
Smaller footprint
5
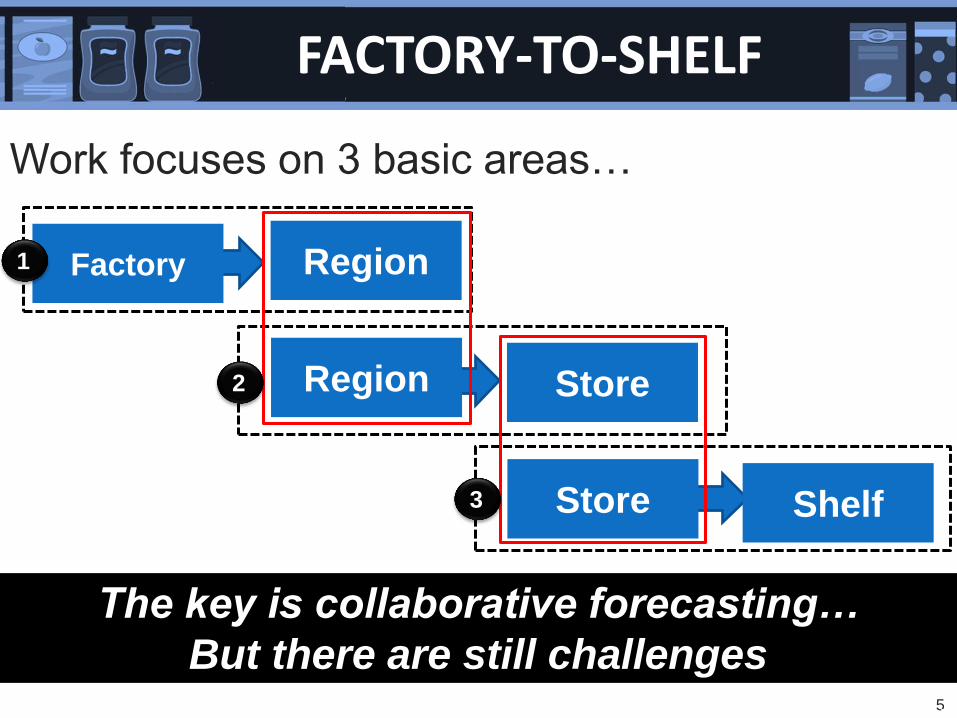
FACTORY-TO-SHELF
Factory
Region Store
Region
Store Shelf
The key is collaborative forecasting…
But there are still challenges
1
2
3
Work focuses on 3 basic areas…
6
CHALLENGES
We addressed the following:
POS data interpretation
Holistic data analysis
Communication: factory to shelf
Account vs region performances
7
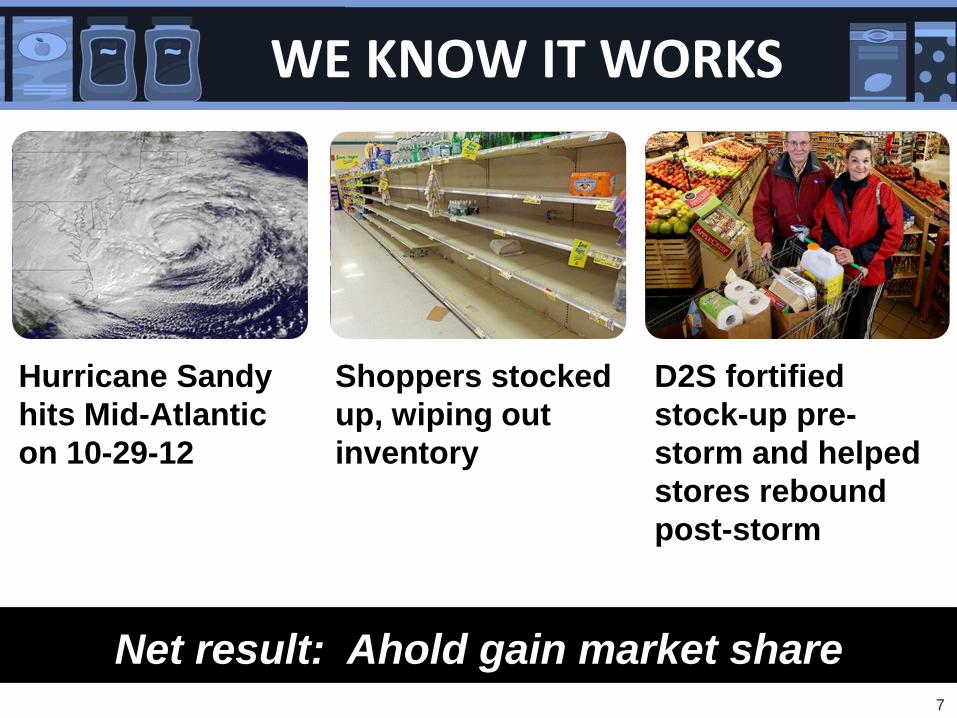
WE KNOW IT WORKS
Hurricane Sandy
hits Mid-Atlantic
on 10-29-12
Shoppers stocked
up, wiping out
inventory
D2S fortified
stock-up pre-
storm and helped
stores rebound
post-storm
Net result: Ahold gain market share
8
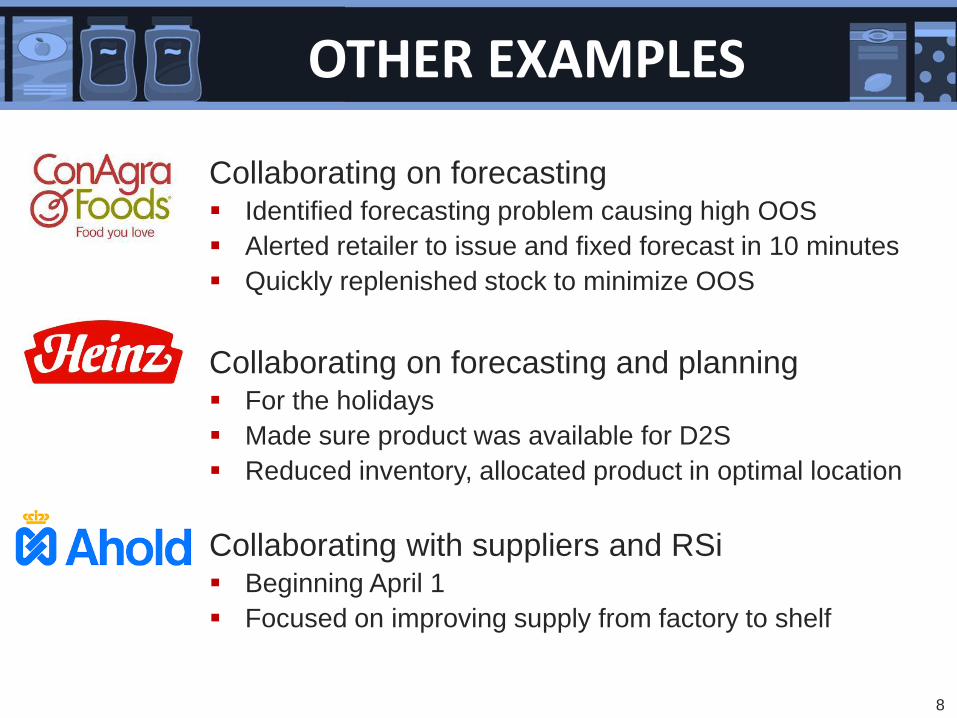
Collaborating on forecasting Identified forecasting problem causing high OOS
Alerted retailer to issue and fixed forecast in 10 minutes
Quickly replenished stock to minimize OOS
Collaborating on forecasting and planning For the holidays
Made sure product was available for D2S
Reduced inventory, allocated product in optimal location
Collaborating with suppliers and RSi Beginning April 1
Focused on improving supply from factory to shelf
OTHER EXAMPLES
9
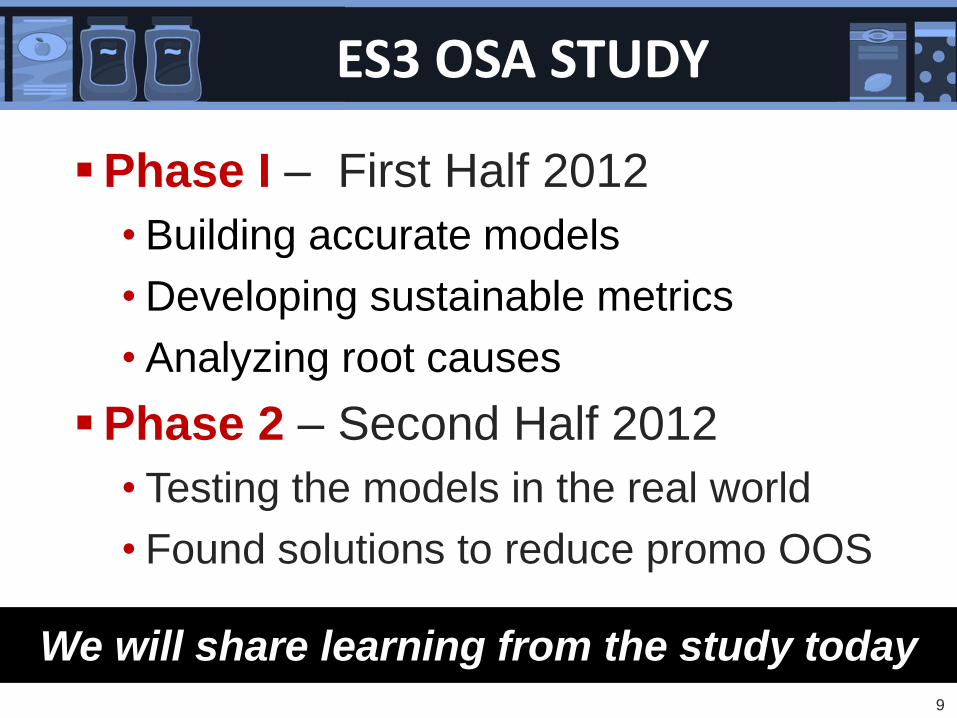
Phase I – First Half 2012
• Building accurate models
• Developing sustainable metrics
• Analyzing root causes
Phase 2 – Second Half 2012
• Testing the models in the real world
• Found solutions to reduce promo OOS
ES3 OSA STUDY
We will share learning from the study today
10
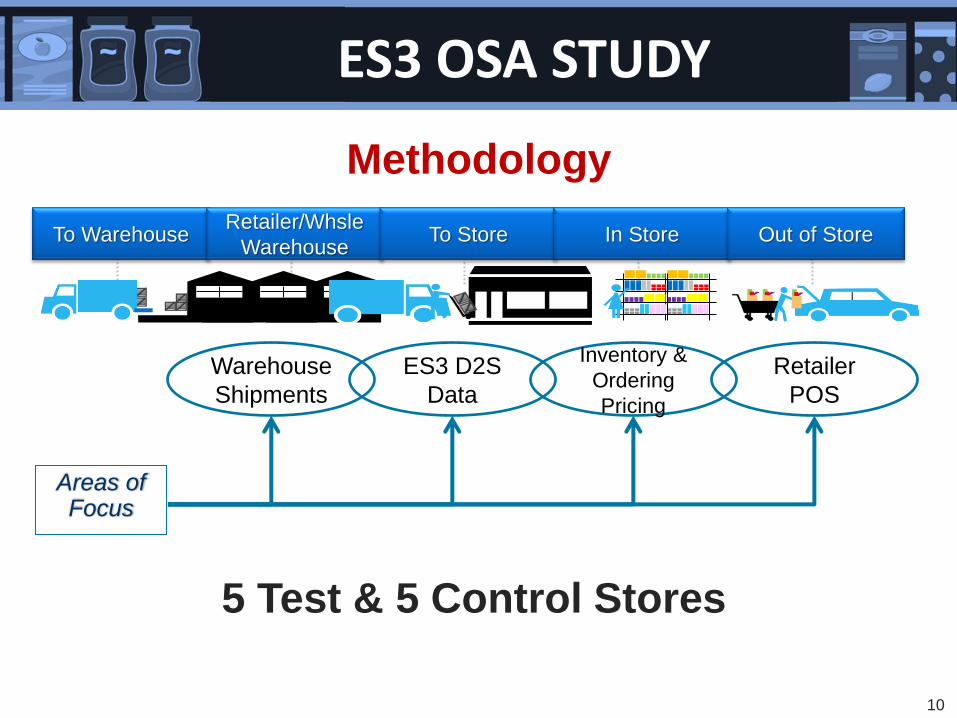
Methodology
ES3 OSA STUDY
To Warehouse Retailer/Whsle
Warehouse To Store In Store Out of Store
Warehouse
Shipments
ES3 D2S
Data
Inventory &
Ordering
Pricing
Retailer
POS
Areas of Focus
5 Test & 5 Control Stores
11
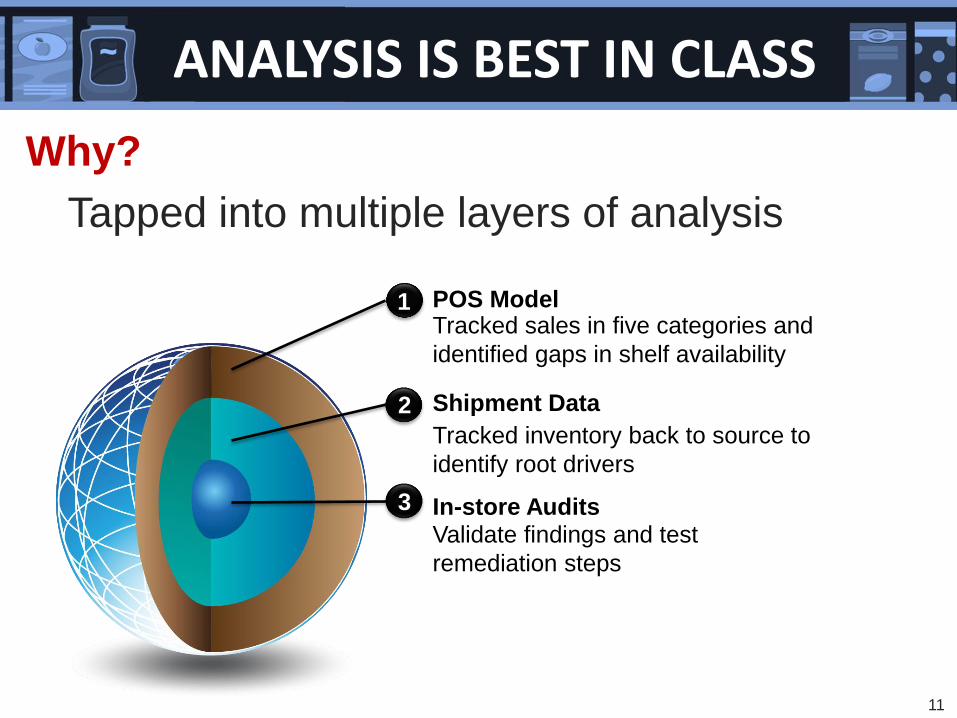
Why?
Tapped into multiple layers of analysis
ANALYSIS IS BEST IN CLASS
POS Model
In-store Audits
Shipment Data
1
2
3
Tracked sales in five categories and
identified gaps in shelf availability
Validate findings and test
remediation steps
Tracked inventory back to source to
identify root drivers
12
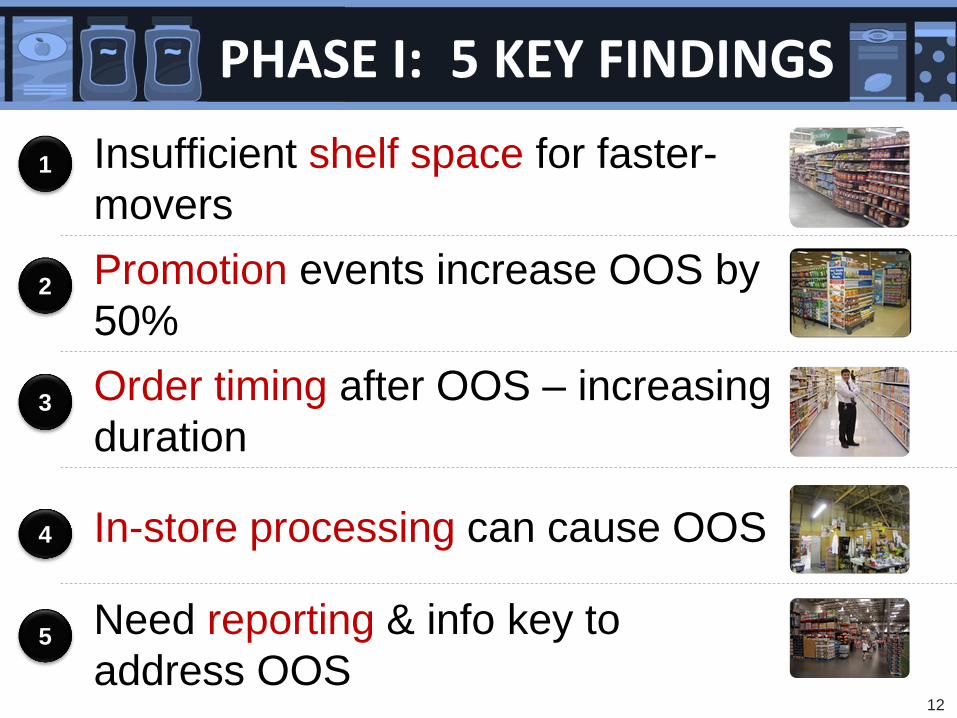
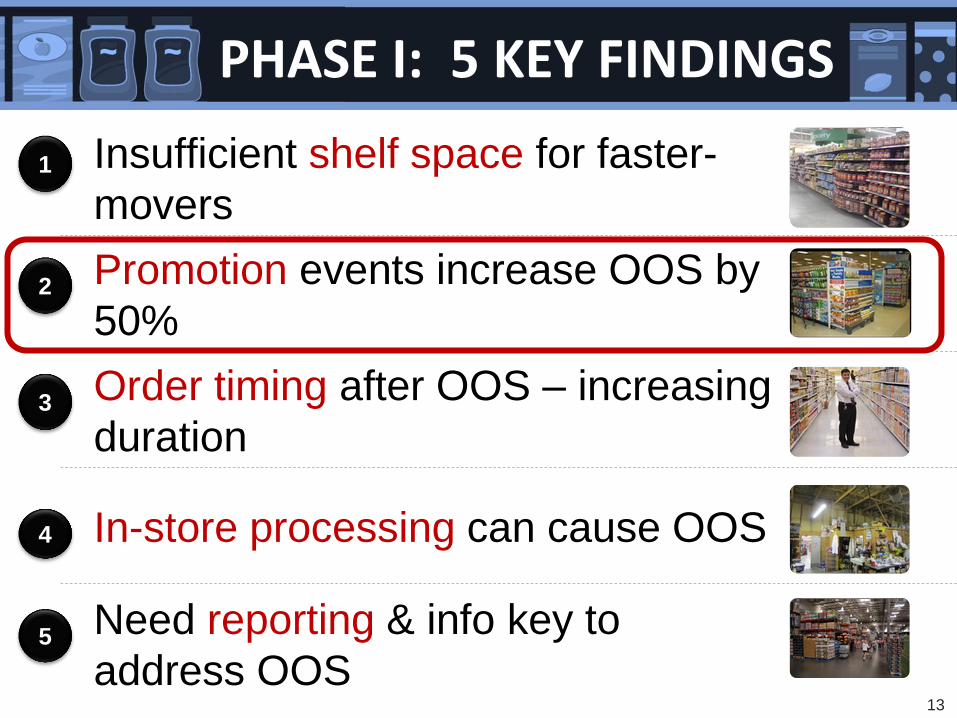
PHASE I: 5 KEY FINDINGS
Insufficient shelf space for faster-
movers
Promotion events increase OOS by
50%
Order timing after OOS – increasing
duration
In-store processing can cause OOS
Need reporting & info key to
address OOS
1
2
3
4
5
13
PHASE I: 5 KEY FINDINGS
Insufficient shelf space for faster-
movers
Promotion events increase OOS by
50%
Order timing after OOS – increasing
duration
In-store processing can cause OOS
Need reporting & info key to
address OOS
1
2
3
4
5
14
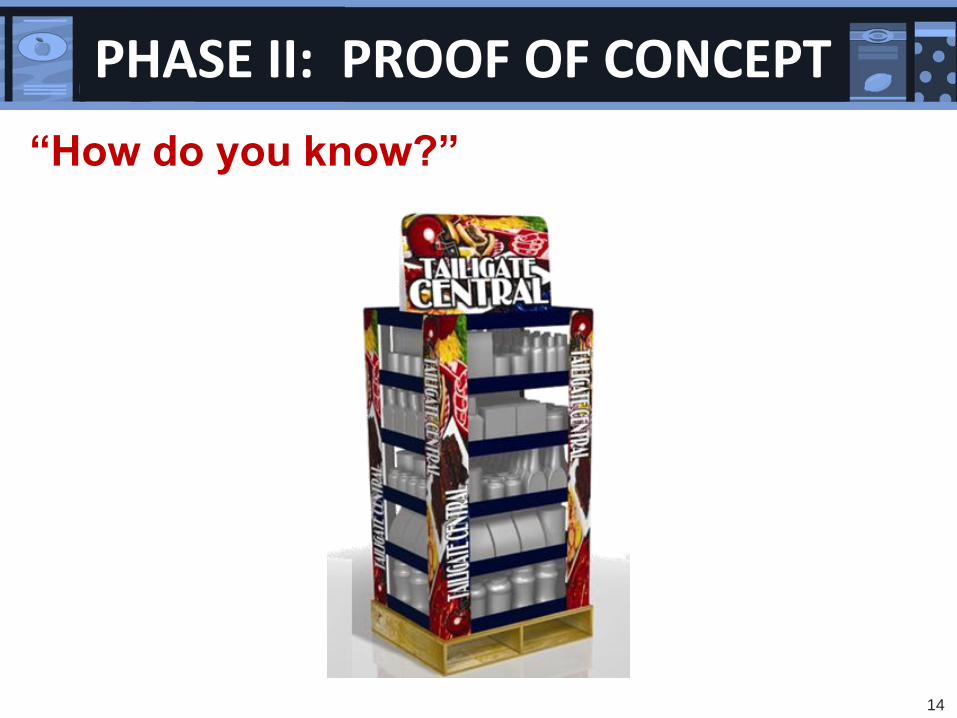
“How do you know?”
PHASE II: PROOF OF CONCEPT
15
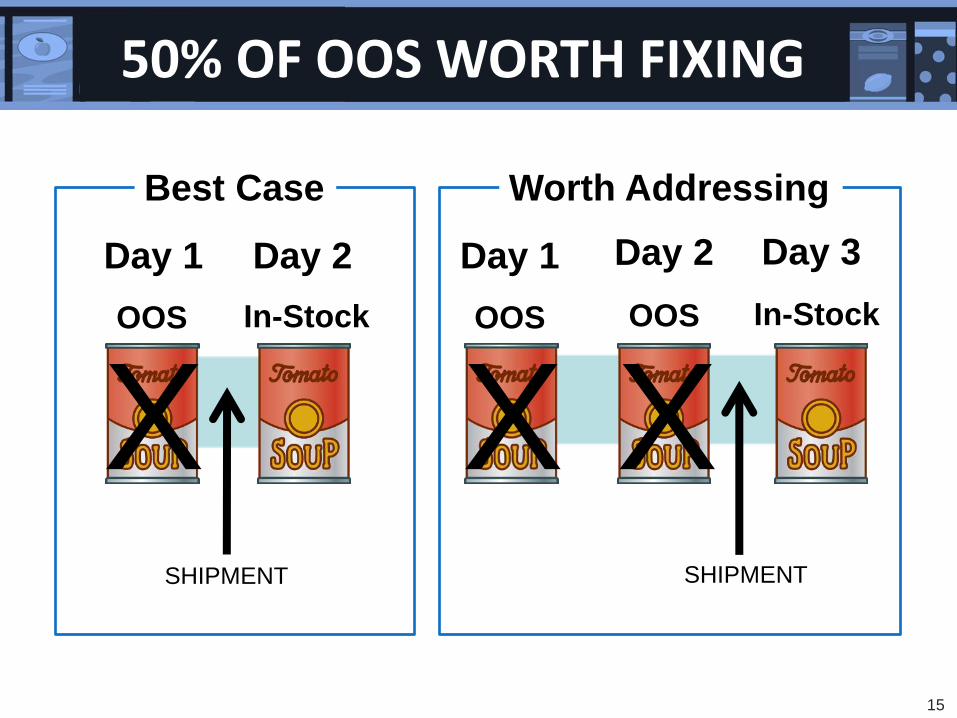
50% OF OOS WORTH FIXING
Day 1 Day 2 Day 3
SHIPMENT
OOS OOS In-Stock OOS In-Stock
Day 1 Day 2
SHIPMENT
Best Case Worth Addressing
X X X
16
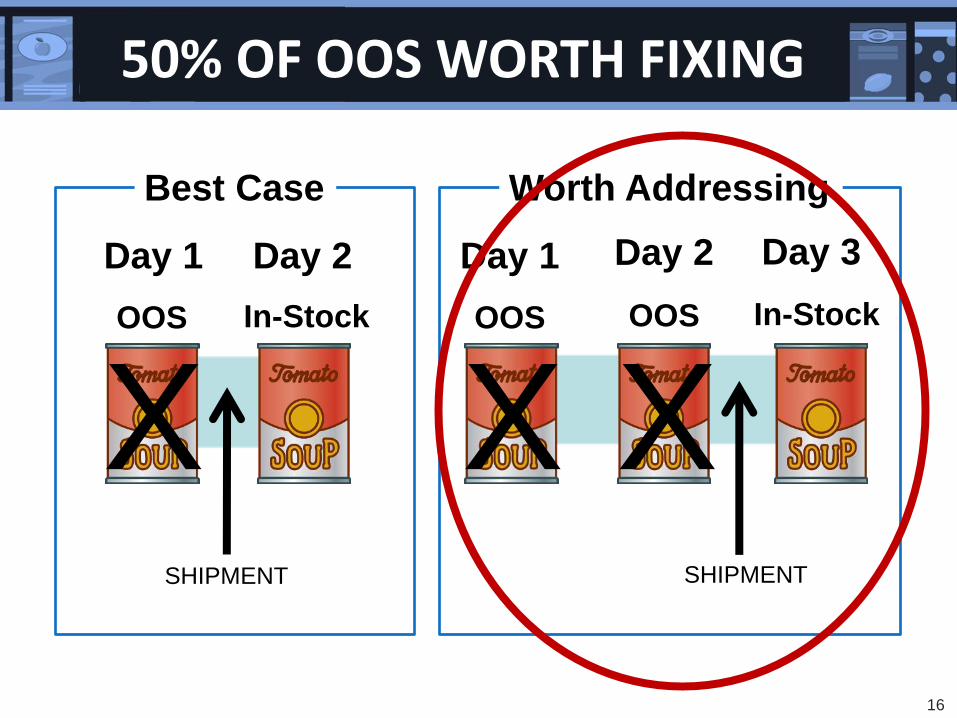
50% OF OOS WORTH FIXING
Day 1 Day 2 Day 3
SHIPMENT
OOS OOS In-Stock OOS In-Stock
Day 1 Day 2
SHIPMENT
Best Case Worth Addressing
X X X
17
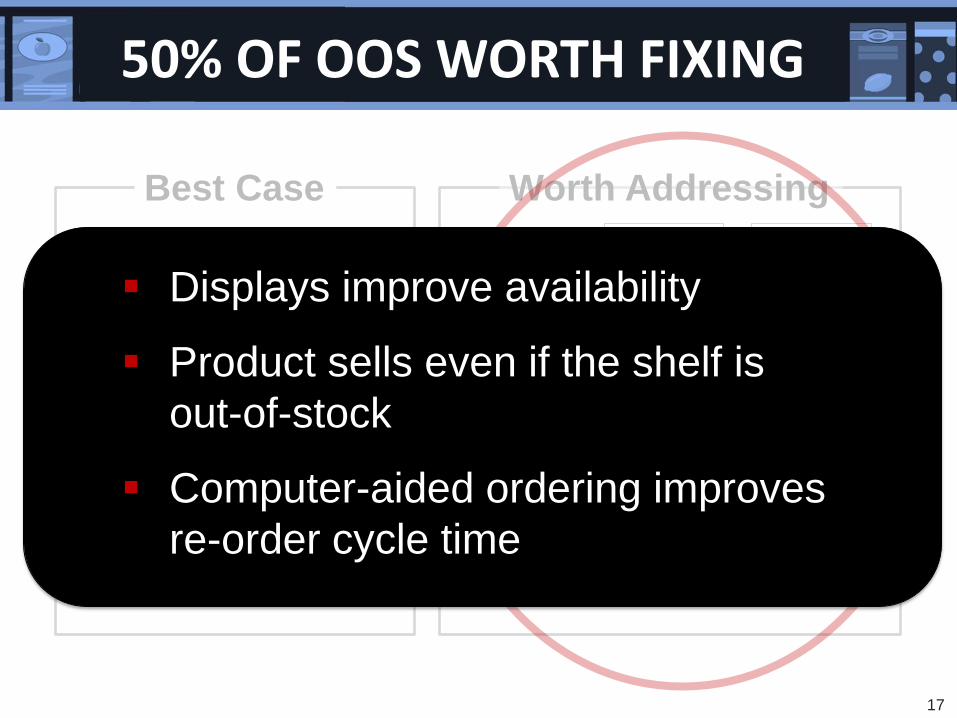
50% OF OOS WORTH FIXING
Day 1 Day 2 Day 3
SHIPMENT
OOS OOS In-Stock
X X OOS In-Stock
Day 1 Day 2
SHIPMENT
Best Case Worth Addressing
Displays improve availability
Product sells even if the shelf is
out-of-stock
Computer-aided ordering improves
re-order cycle time
18
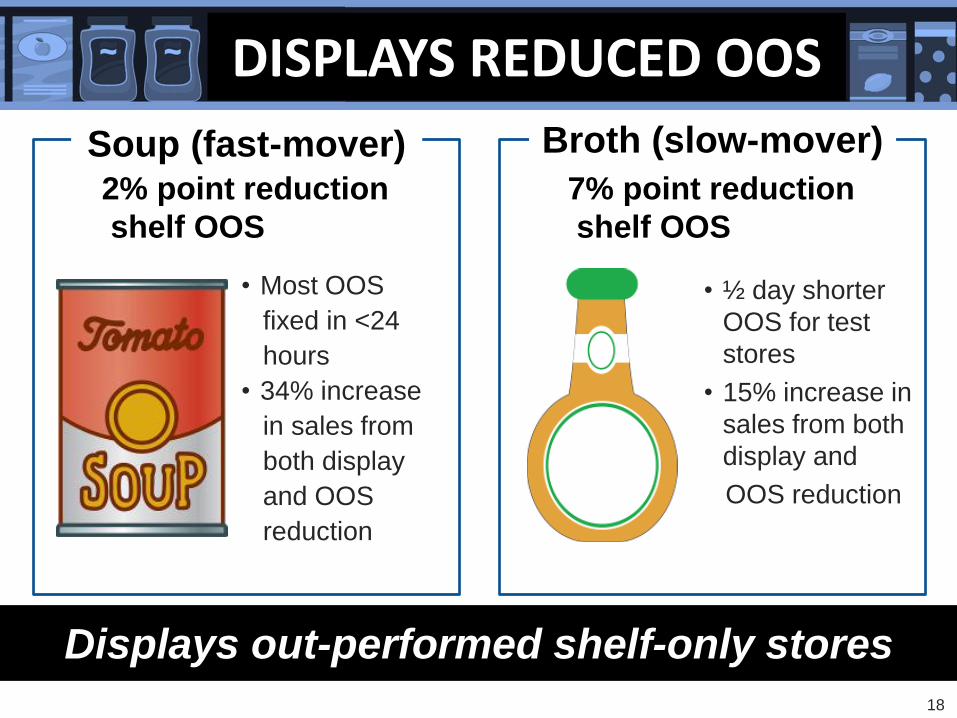
DISPLAYS REDUCED OOS
Soup (fast-mover)
• ½ day shorter
OOS for test
stores
• 15% increase in
sales from both
display and
OOS reduction
• Most OOS
fixed in <24
hours
• 34% increase
in sales from
both display
and OOS
reduction
2% point reduction
shelf OOS
7% point reduction
shelf OOS
Broth (slow-mover)
Displays out-performed shelf-only stores
19
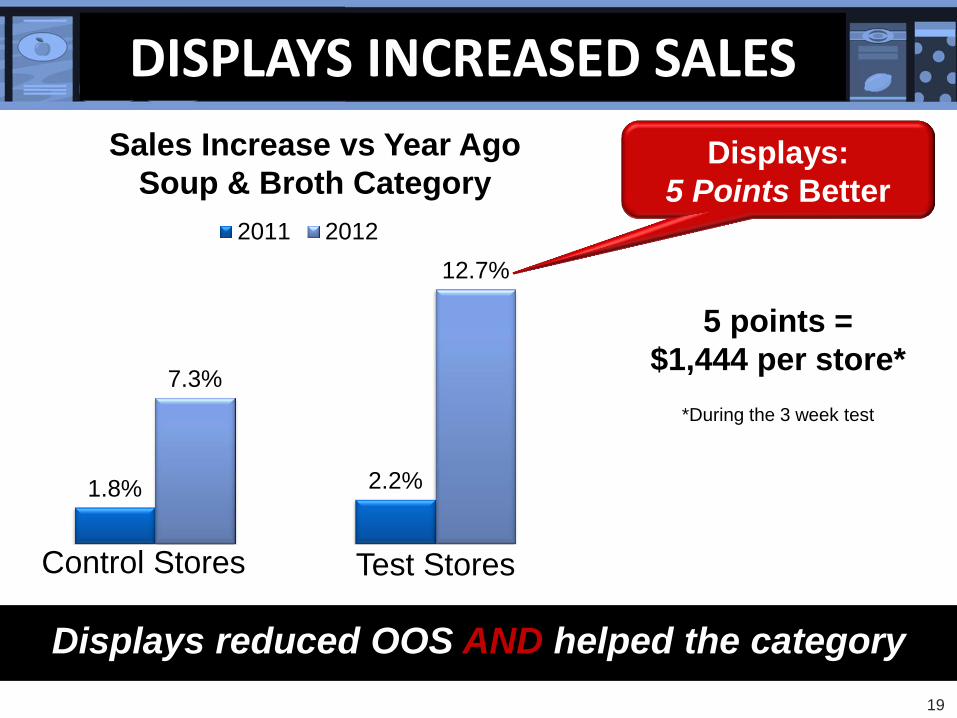
DISPLAYS INCREASED SALES
1.8% 2.2%
7.3%
12.7%
2011 2012
5 points =
$1,444 per store*
Control Stores
Sales Increase vs Year Ago
Soup & Broth Category
*During the 3 week test
Test Stores
Displays:
5 Points Better
Displays reduced OOS AND helped the category
20
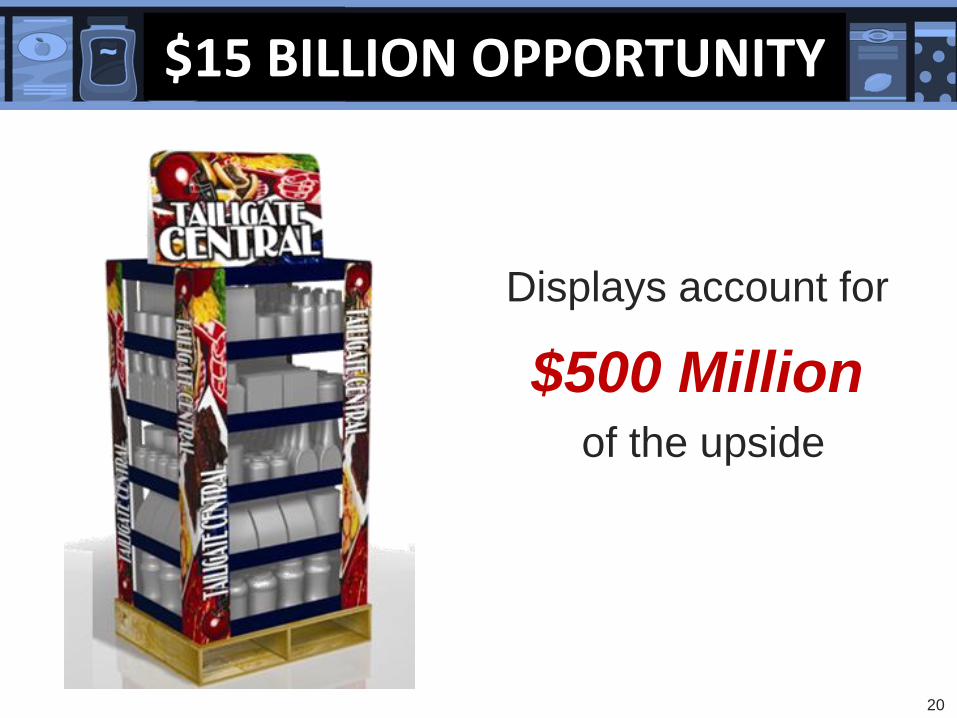
$15 BILLION OPPORTUNITY
Displays account for
$500 Million of the upside
21
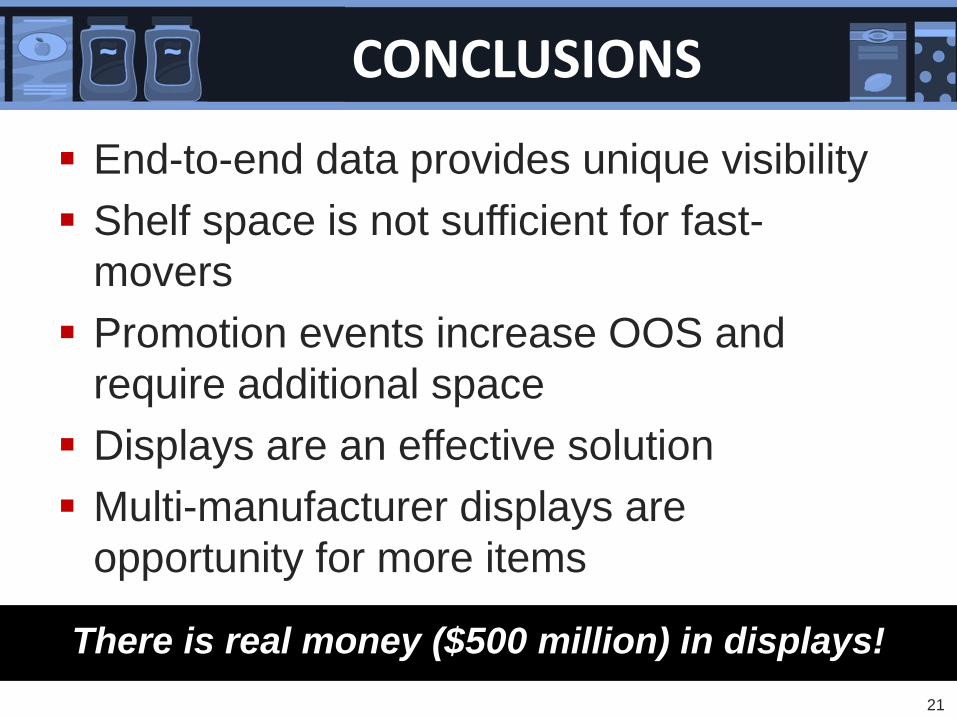
End-to-end data provides unique visibility
Shelf space is not sufficient for fast-
movers
Promotion events increase OOS and
require additional space
Displays are an effective solution
Multi-manufacturer displays are
opportunity for more items
CONCLUSIONS
There is real money ($500 million) in displays!
22
Tim Rohrbaugh Senior Director,
Non Perishables
Replenishment
Bob Masching Senior Vice President,
Supply Chain
Scott Steeves Director
Sales & Operations Planning &
Customer Supply Chain
PANEL DISCUSSION
23
Vendor Collaboration - DSR
24
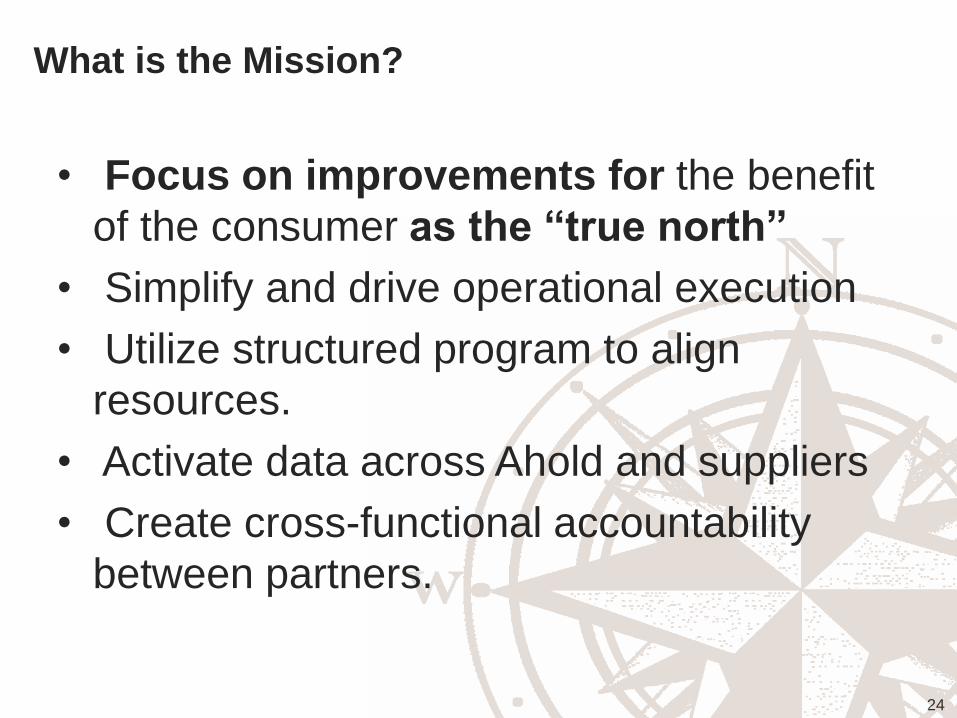
What is the Mission?
• Focus on improvements for the benefit
of the consumer as the “true north”
• Simplify and drive operational execution
• Utilize structured program to align
resources.
• Activate data across Ahold and suppliers
• Create cross-functional accountability
between partners.
25
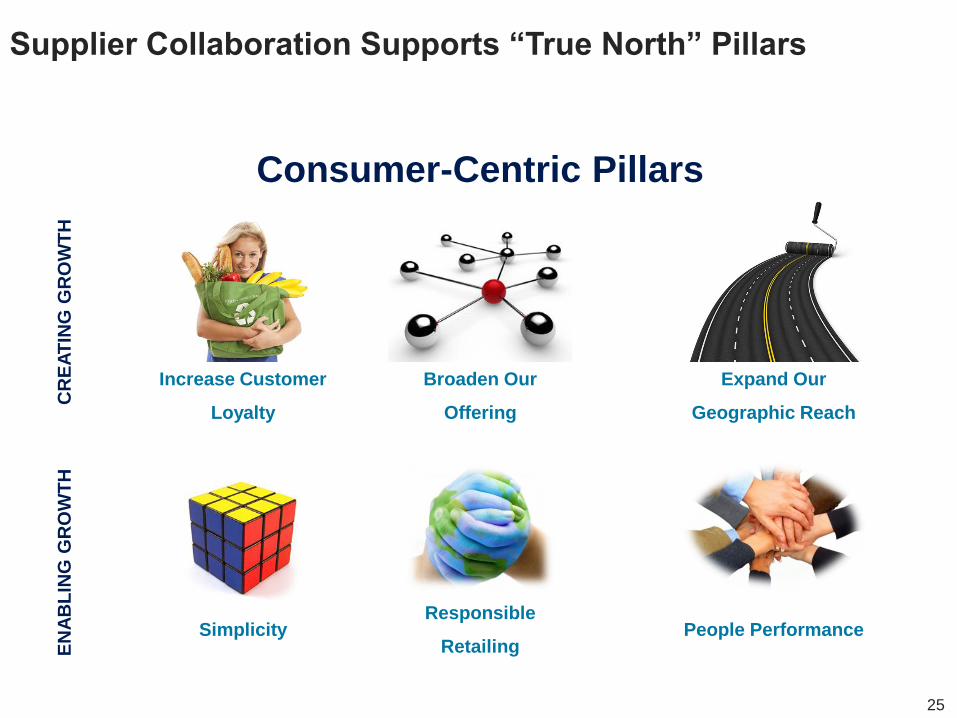
Consumer-Centric Pillars
Supplier Collaboration Supports “True North” Pillars C
RE
AT
ING
GR
OW
TH
E
NA
BL
ING
GR
OW
TH
Increase Customer
Loyalty
Broaden Our
Offering
Expand Our
Geographic Reach
Simplicity Responsible
Retailing People Performance
26
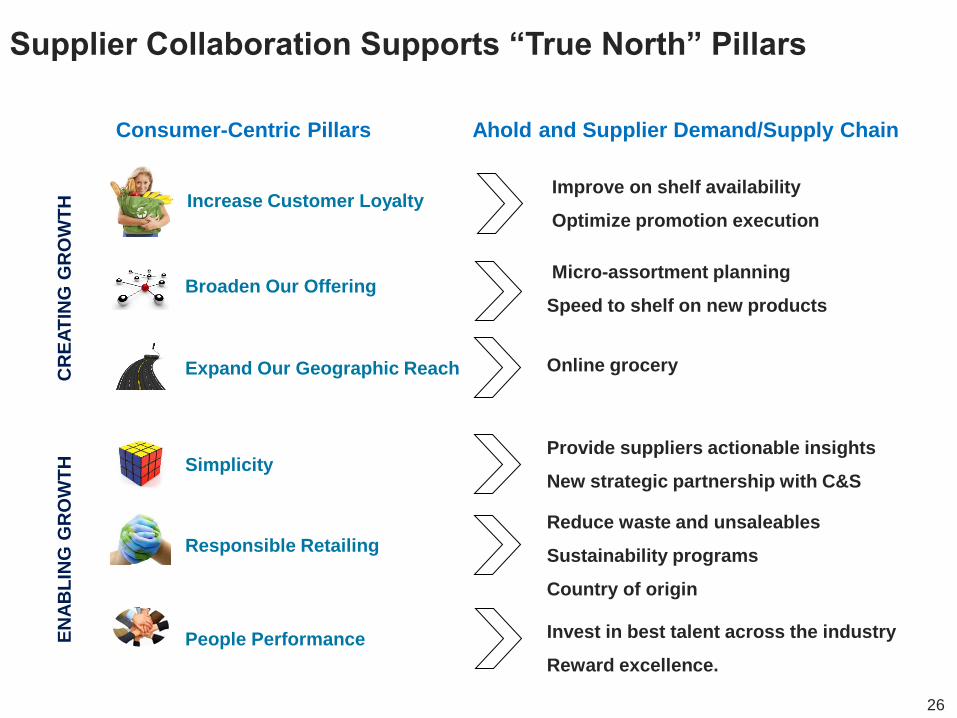
Supplier Collaboration Supports “True North” Pillars
Consumer-Centric Pillars
CR
EA
TIN
G G
RO
WT
H
EN
AB
LIN
G G
RO
WT
H
Increase Customer Loyalty
Broaden Our Offering
Expand Our Geographic Reach
Simplicity
Responsible Retailing
People Performance
Ahold and Supplier Demand/Supply Chain
Improve on shelf availability
Optimize promotion execution
Micro-assortment planning
Speed to shelf on new products
Online grocery
Provide suppliers actionable insights
New strategic partnership with C&S
Reduce waste and unsaleables
Sustainability programs
Country of origin
Invest in best talent across the industry
Reward excellence.
27
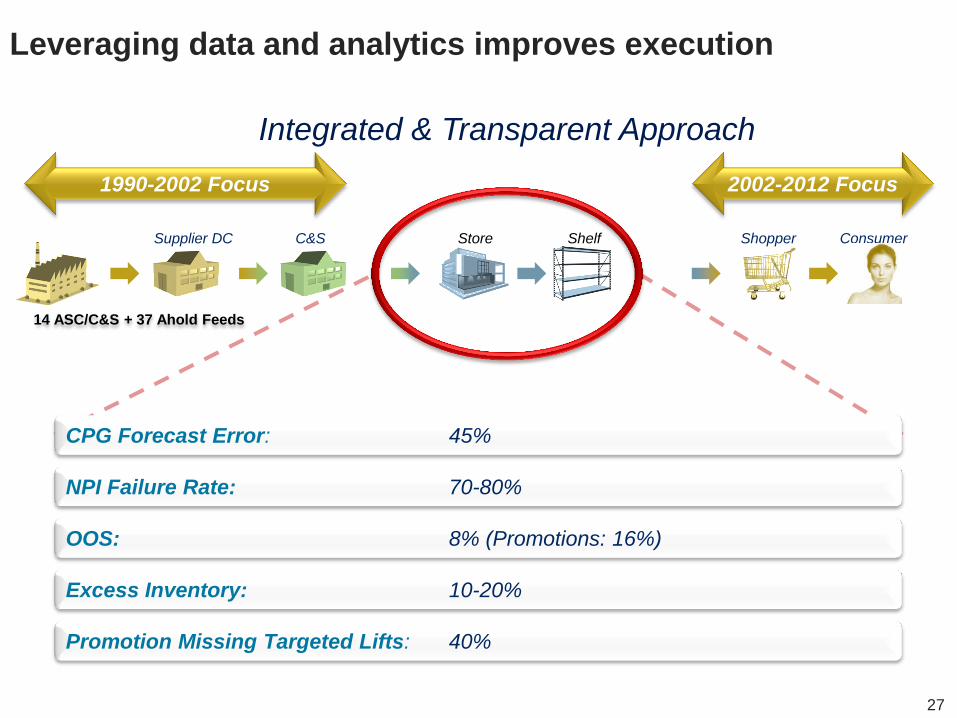
Supplier DC C&S Shopper
1990-2002 Focus
Excess Inventory: 10-20%
CPG Forecast Error: 45%
NPI Failure Rate: 70-80%
Promotion Missing Targeted Lifts: 40%
OOS: 8% (Promotions: 16%)
Store Shelf Consumer
2002-2012 Focus
14 ASC/C&S + 37 Ahold Feeds
Leveraging data and analytics improves execution
Integrated & Transparent Approach
28
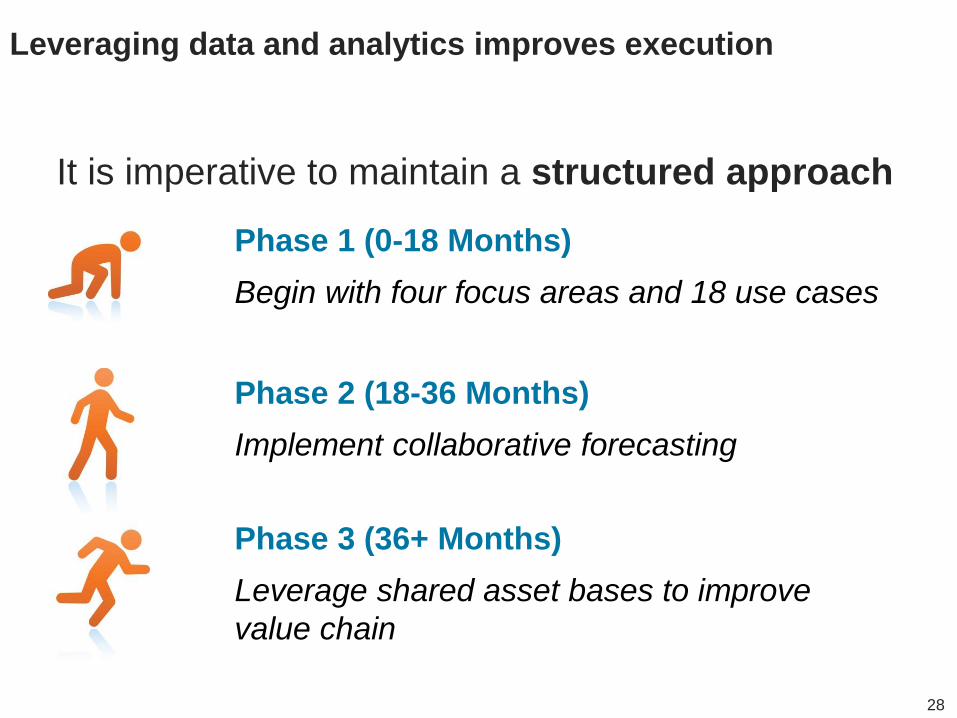
Leveraging data and analytics improves execution
It is imperative to maintain a structured approach
Phase 1 (0-18 Months)
Begin with four focus areas and 18 use cases
Phase 3 (36+ Months)
Leverage shared asset bases to improve
value chain
Phase 2 (18-36 Months)
Implement collaborative forecasting
29
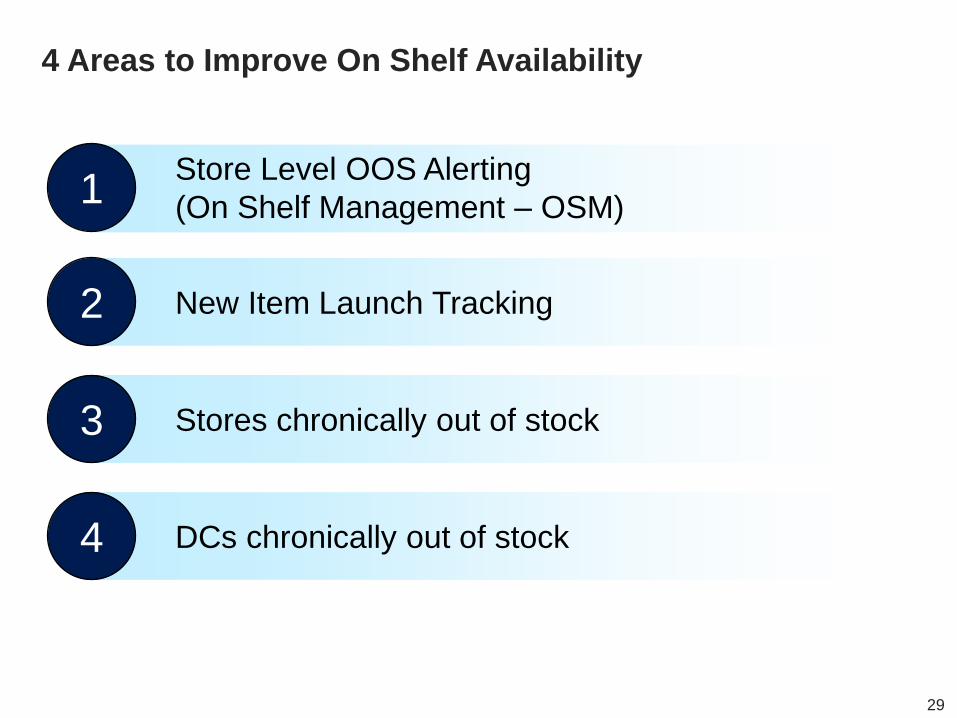
4 Areas to Improve On Shelf Availability
1
2
3
4
Store Level OOS Alerting
(On Shelf Management – OSM)
New Item Launch Tracking
Stores chronically out of stock
DCs chronically out of stock
30
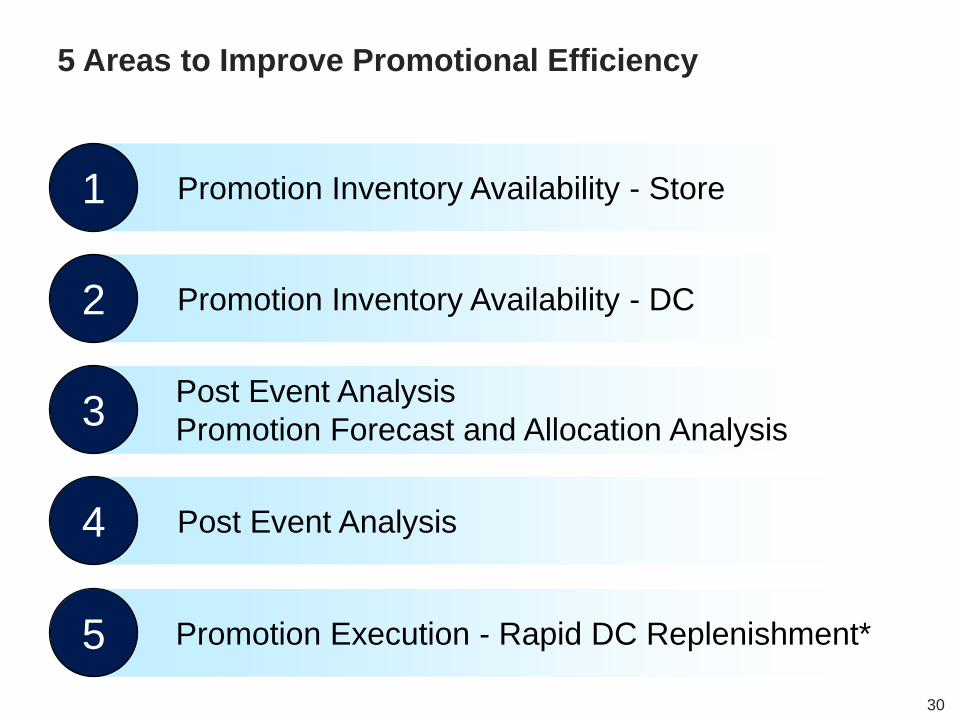
5 Areas to Improve Promotional Efficiency
1
2
3
4
Promotion Inventory Availability - Store
Promotion Inventory Availability - DC
Post Event Analysis
Promotion Forecast and Allocation Analysis
Post Event Analysis
5 Promotion Execution - Rapid DC Replenishment*
31
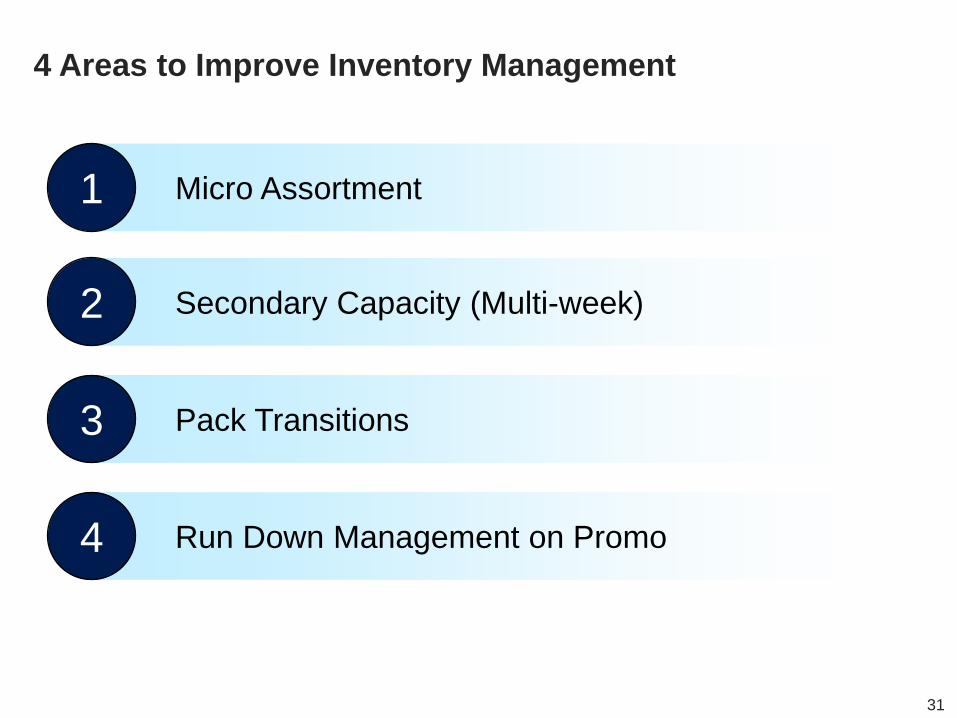
4 Areas to Improve Inventory Management
1
2
3
4
Micro Assortment
Secondary Capacity (Multi-week)
Pack Transitions
Run Down Management on Promo
32
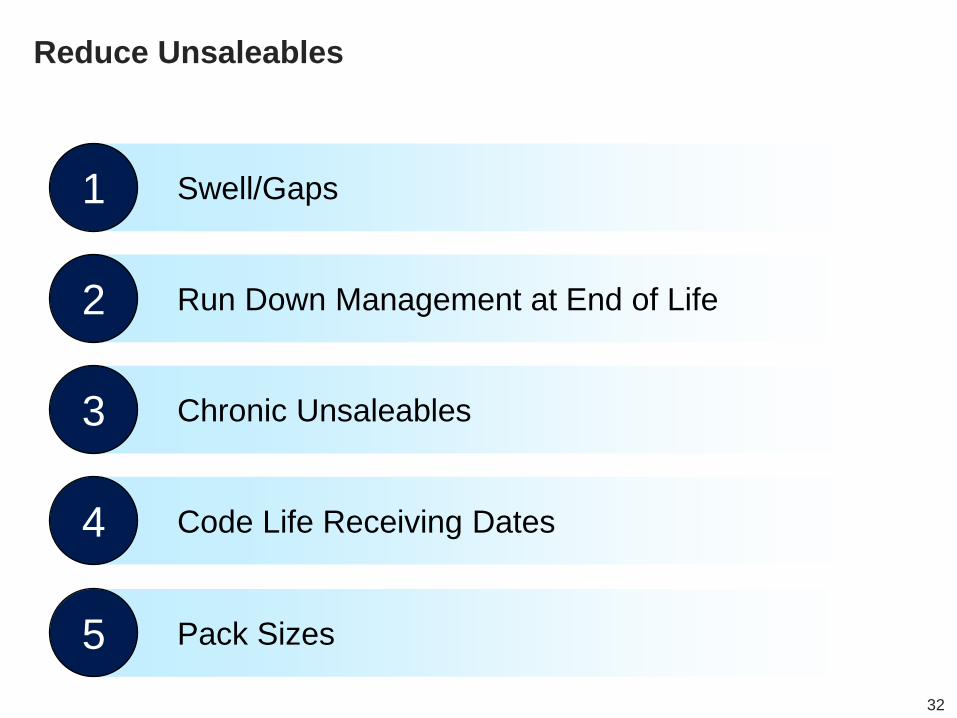
Reduce Unsaleables
1
2
3
4
Swell/Gaps
Run Down Management at End of Life
Chronic Unsaleables
Code Life Receiving Dates
5 Pack Sizes
33
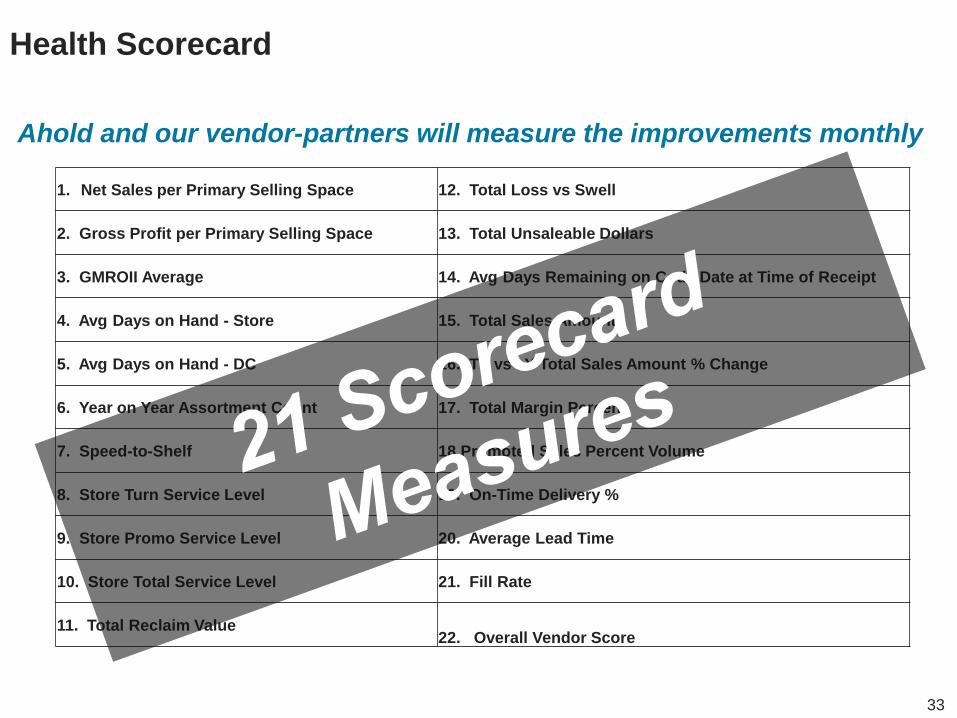
1. Net Sales per Primary Selling Space 12. Total Loss vs Swell
2. Gross Profit per Primary Selling Space 13. Total Unsaleable Dollars
3. GMROII Average 14. Avg Days Remaining on Code Date at Time of Receipt
4. Avg Days on Hand - Store 15. Total Sales Amount
5. Avg Days on Hand - DC 16. TY vs LY Total Sales Amount % Change
6. Year on Year Assortment Count 17. Total Margin Percent
7. Speed-to-Shelf 18.Promoted Sales Percent Volume
8. Store Turn Service Level 19. On-Time Delivery %
9. Store Promo Service Level 20. Average Lead Time
10. Store Total Service Level 21. Fill Rate
11. Total Reclaim Value 22. Overall Vendor Score
Ahold and our vendor-partners will measure the improvements monthly
Health Scorecard
34
ConAgra Foods
Retailer
Collaboration
Bob Masching SVP
Supply Chain
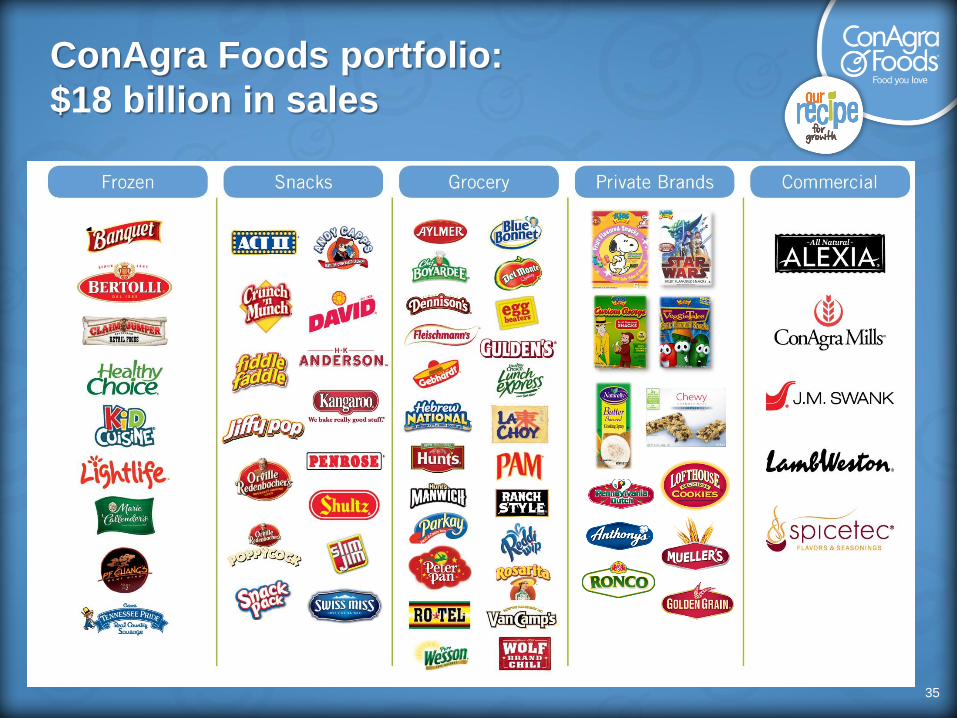
ConAgra Foods portfolio:
$18 billion in sales
35

36
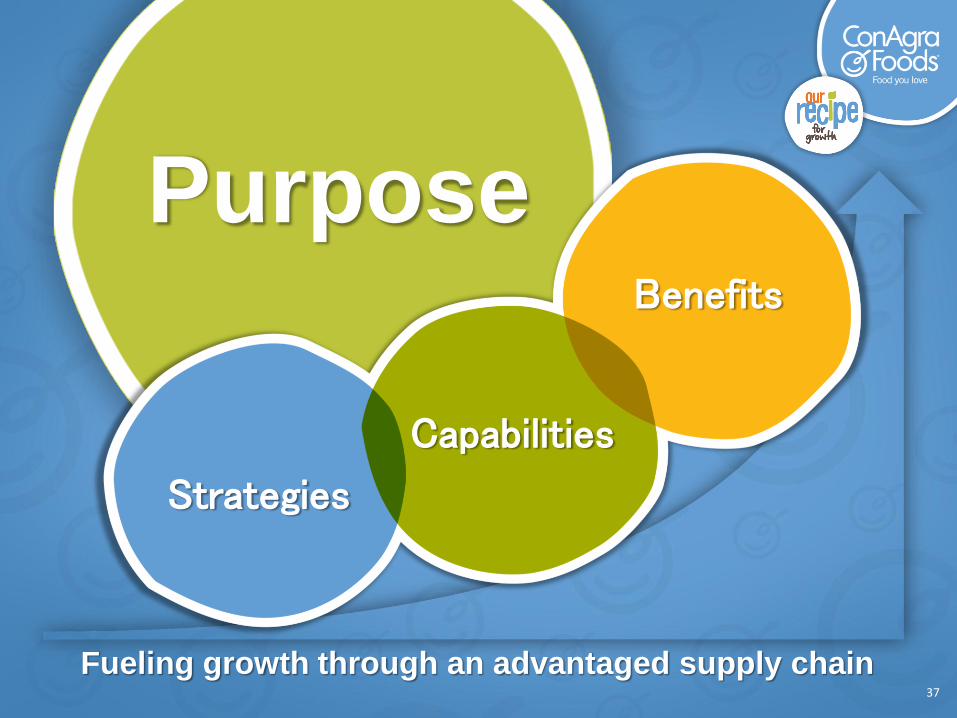
37
Strategies
Capabilities
Benefits
Fueling growth through an advantaged supply chain
Purpose
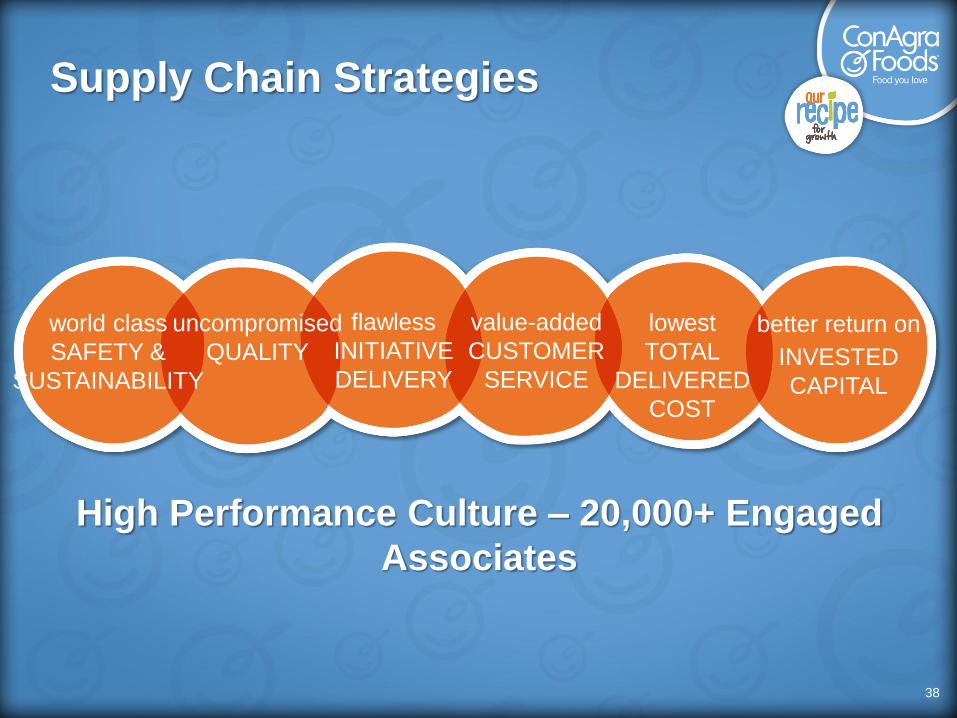
Supply Chain Strategies
38
uncompromised
QUALITY
flawless
INITIATIVE
DELIVERY
value-added
CUSTOMER
SERVICE
lowest
TOTAL
DELIVERED
COST
better return on INVESTED
CAPITAL
world class
SAFETY &
SUSTAINABILITY
High Performance Culture – 20,000+ Engaged
Associates
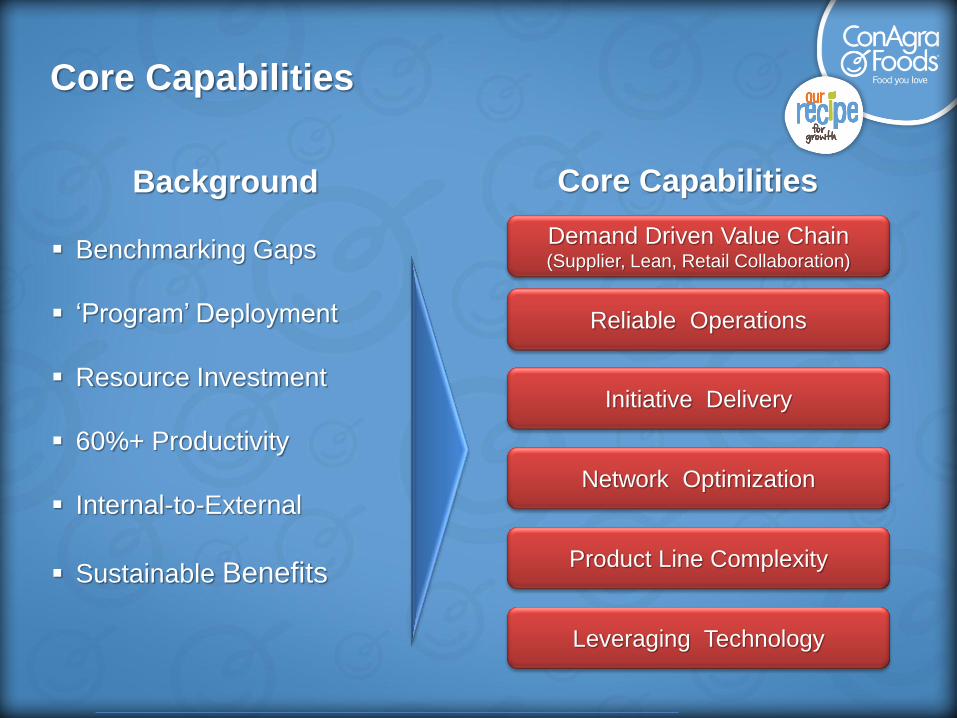
Core Capabilities
Core Capabilities Background
Benchmarking Gaps
‘Program’ Deployment
Resource Investment
60%+ Productivity
Internal-to-External
Sustainable Benefits
Reliable Operations
Initiative Delivery
Product Line Complexity
Network Optimization
Leveraging Technology
Demand Driven Value Chain (Supplier, Lean, Retail Collaboration)
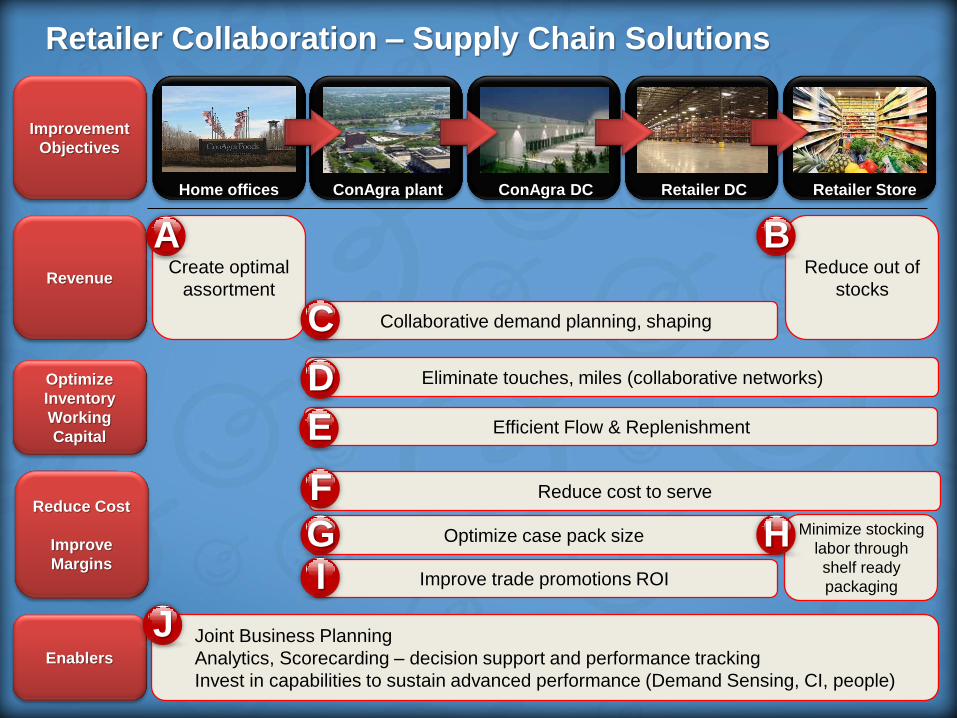
Revenue
Optimize
Inventory
Working
Capital
Grow
Margins
Create optimal
assortment
Reduce out of
stocks
Minimize stocking
labor through
shelf ready
packaging
Collaborative demand planning, shaping
Eliminate touches, miles (collaborative networks)
Reduce cost to serve
Optimize case pack size
Improve trade promotions ROI
Reduce Cost
Improve
Margins
Enablers
Joint Business Planning
Analytics, Scorecarding – decision support and performance tracking
Invest in capabilities to sustain advanced performance (Demand Sensing, CI, people)
Home offices ConAgra plant ConAgra DC Retailer DC Retailer Store
Improvement
Objectives
Retailer Collaboration – Supply Chain Solutions
A B
C
D
F
G H I
J
Efficient Flow & Replenishment E
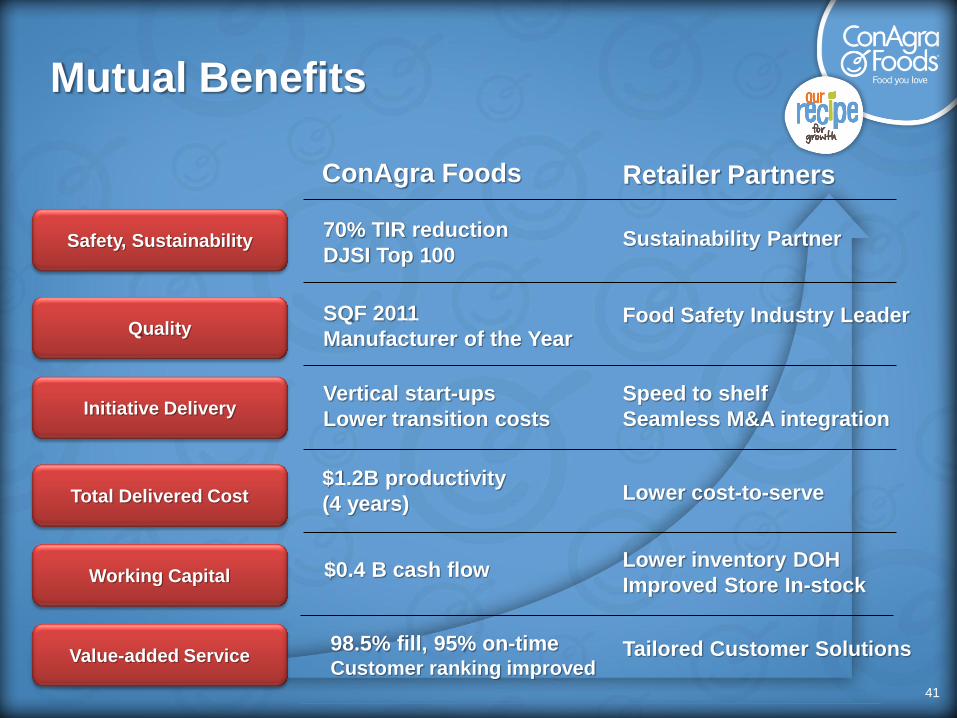
Mutual Benefits
41
Safety, Sustainability
Quality
Initiative Delivery
Total Delivered Cost
Working Capital
Value-added Service
Retailer Partners ConAgra Foods
Sustainability Partner
Food Safety Industry Leader
Speed to shelf
Seamless M&A integration
Lower cost-to-serve
Lower inventory DOH
Improved Store In-stock
70% TIR reduction
DJSI Top 100
SQF 2011
Manufacturer of the Year
Vertical start-ups
Lower transition costs
$1.2B productivity
(4 years)
$0.4 B cash flow
Tailored Customer Solutions 98.5% fill, 95% on-time Customer ranking improved
Heinz at a Glance
Founded in Sharpsburg (a suburb of Pittsburgh), Pennsylvania, in 1869 by entrepreneur
Henry John Heinz Began with horseradish followed by pickles, sauerkraut and vinegar
Ketchup added to the portfolio in 1876
Heinz is a $11.6 billion global company Enjoy #1 or #2 market share in more than 50 countries
Sell 650 million bottles of our iconic Ketchup every year
Top 15 power brands account for more than two-thirds of its annual sales
Employ approximately 32,000 people around the globe
Heinz North America accounts for roughly 40% of overall sales ($4.66 billion) Consumer Products = $3.24 billion
Foodservice = $1.42 billion
"To do a common thing uncommonly well brings success." - Founder Henry John Heinz
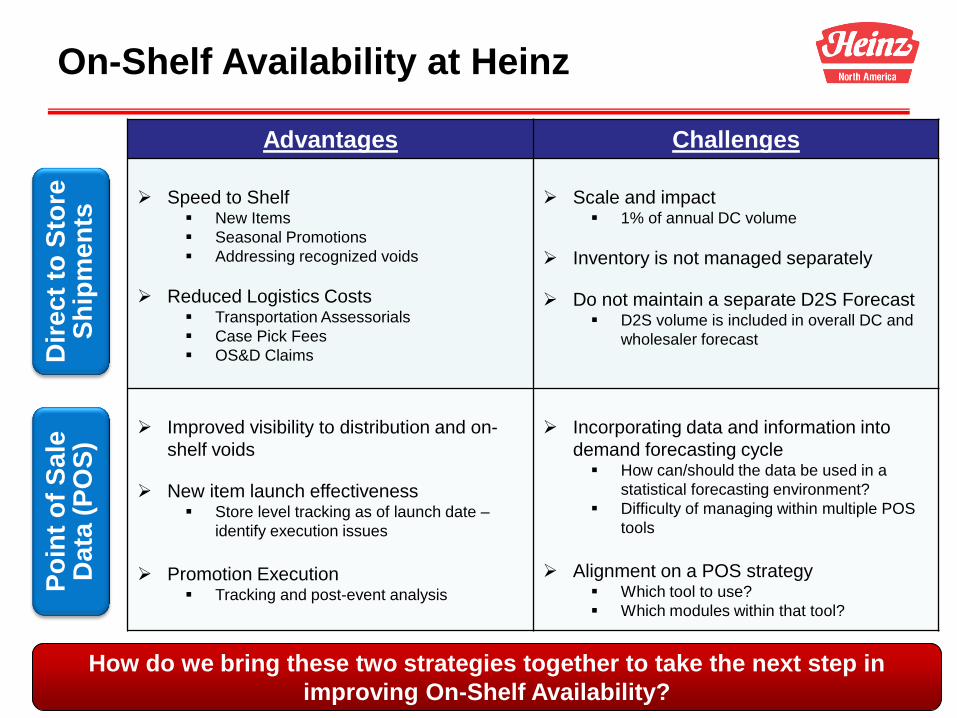
On-Shelf Availability at Heinz
How do we bring these two strategies together to take the next step in
improving On-Shelf Availability?
Dir
ec
t to
Sto
re
Sh
ipm
en
ts
Po
int
of
Sa
le
Data
(P
OS
)
Advantages Challenges
Speed to Shelf New Items
Seasonal Promotions
Addressing recognized voids
Reduced Logistics Costs Transportation Assessorials
Case Pick Fees
OS&D Claims
Scale and impact 1% of annual DC volume
Inventory is not managed separately
Do not maintain a separate D2S Forecast D2S volume is included in overall DC and
wholesaler forecast
Improved visibility to distribution and on-
shelf voids
New item launch effectiveness Store level tracking as of launch date –
identify execution issues
Promotion Execution Tracking and post-event analysis
Incorporating data and information into
demand forecasting cycle How can/should the data be used in a
statistical forecasting environment?
Difficulty of managing within multiple POS
tools
Alignment on a POS strategy Which tool to use?
Which modules within that tool?