through global scale
TRANSCRIPT

Modernisation
through global scale
Ruza Sabanovic, Group CTO
1

2
Nordics
Emerging Asia
Developed Asia
No of Subscribers: 10.0m Data Traffic: 1.7m (TB/year) No of Sites: 32k No of Technical Data Centers (DCs): 13 No of IT Applications (Apps): 1,364
No of Subs: 144.1m Data Traffic: 1.9m No of Sites: 37k No of DCs: 17 No of IT Apps: 248
No of Subs: 31.9m Data Traffic: 3.2m No of Sites: 36k No of DCs: 11 No of IT Apps: 207
Connecting you to what matters most.Empowering societies
* Subscribers, traffic & sites for mobile

During the next 30 minutes…
52,000,000 voice minutes,
7,000,000 SMS,
395 TB mobile data, and
656 TB fixed data
…will be consumed by our 186 (+4*) million subscribers.
87% of the mobile traffic delivered through our Telenor Hybrid Cloud
and accessed through our ~110,000 physical sites.
* Fixed3

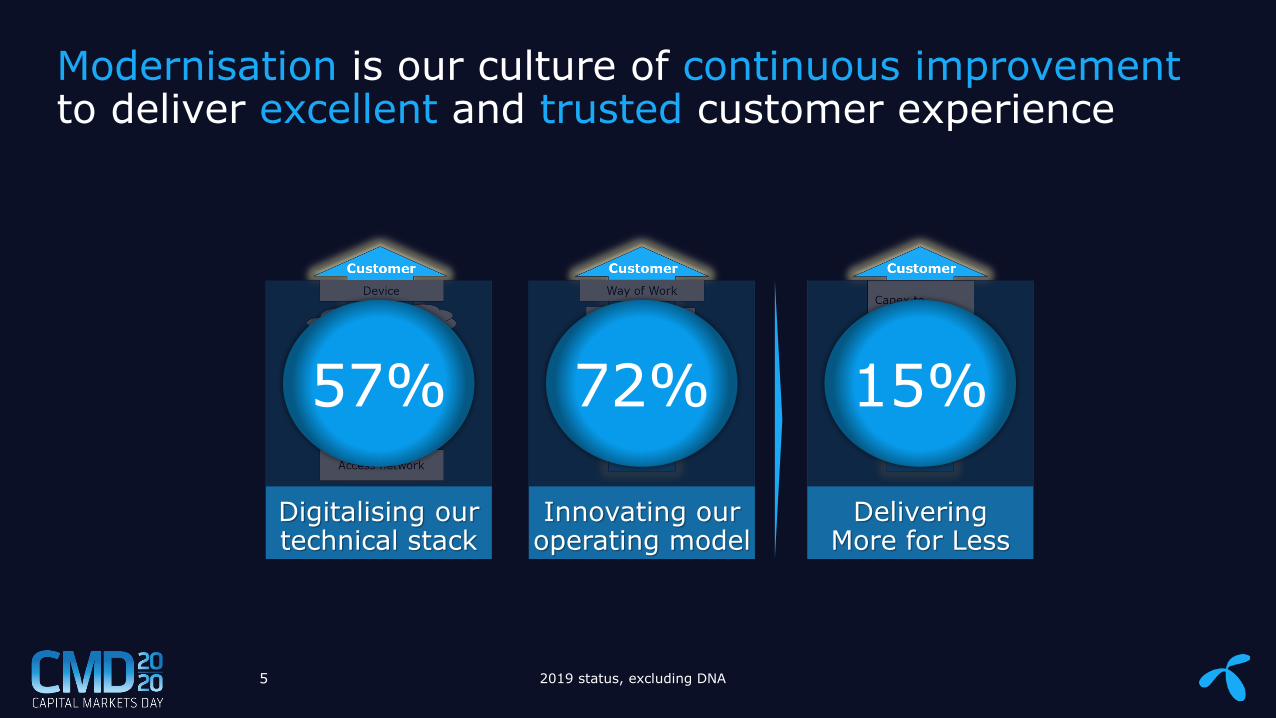
Delivering More for Less
Innovating our operating model
Digitalising our technical stack
Modernisation is our culture of continuous improvement to deliver excellent and trusted customer experience
4
› “Everything as a Service”
› 5G readiness and legacy sunset
› Towards “Touch-Free” operations
› Global way of work with partners and selective centralisation
› Stable capex to sales
› Improved customer experience
Delivering More for Less
Innovating our operating model
Digitalising our technical stack
5 2019 status, excluding DNA
15%57% 72%
Modernisation is our culture of continuous improvement to deliver excellent and trusted customer experience
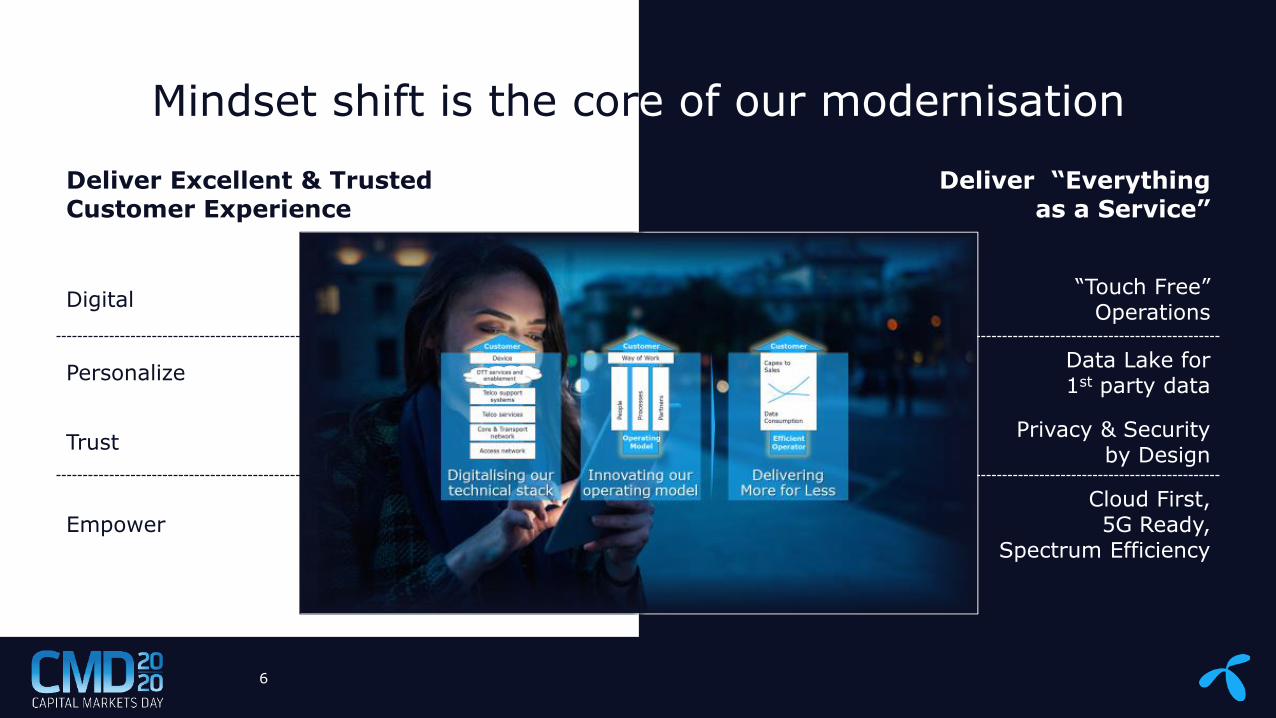
Deliver Excellent & TrustedCustomer Experience
Deliver “Everything as a Service”
Digital“Touch Free”
Operations
PersonalizeData Lake for 1st party data
TrustPrivacy & Security
by Design
EmpowerCloud First, 5G Ready,
Spectrum Efficiency
Mindset shift is the core of our modernisation
6

Our relentless focus on results drives modernisation impact
7
2017 2019 2020e 2023e
Excellent & TrustedCustomer Experience
Network Net Promoter Score (NPS) Journey starts 19.4 20.1 Enable invest.
We are security - maturity level Journey starts 2.5 >3 >4
Digitalisingour technical
stack
5G enabled radio 1 0% 8% ~27% ~48%
Cloud: Data Traffic | IT applications Journey starts 83% | 16% 90% | 38% 100% | 80%
Network Energy Reduction: SCN | Asia Continuous improvement Flat | -4% Leading
Innovatingour operating
model
Global Operating Model 45% 72% 81% 90%
NW & IT CDC Capabilities Journey starts 79% | 33% 80% | 50% 90% | 90%
Centralized Procurement Spend 25% 63% 70% 75%
Delivering More for Less
Telenor Capex to Sales 15.4% 15% ~15% ~15%
Average Cost per GB, in NOK 8 4 3 Reduce
4G/5G Spectrum Share 1 59% 72% 84% >90%
1 2019 onwards DNA included
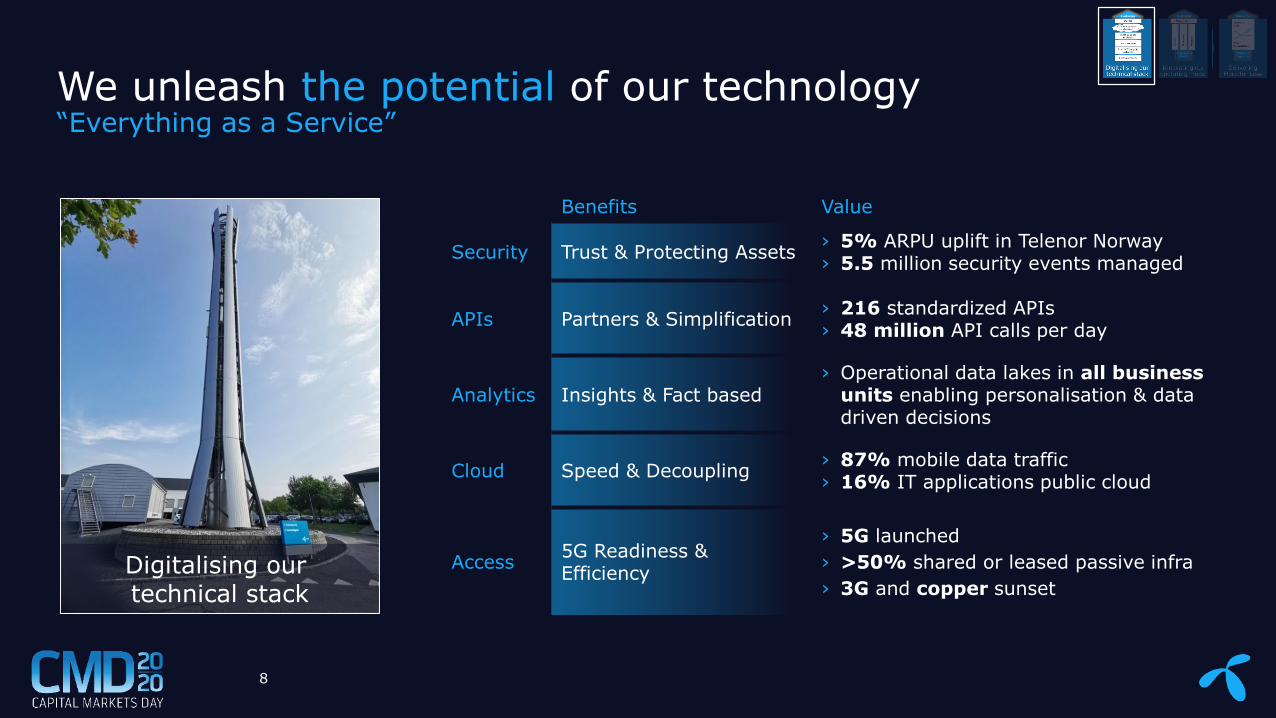
We unleash the potential of our technology“Everything as a Service”
8
Benefits Value
Security Trust & Protecting Assets› 5% ARPU uplift in Telenor Norway› 5.5 million security events managed
APIs Partners & Simplification› 216 standardized APIs› 48 million API calls per day
Analytics Insights & Fact based› Operational data lakes in all business
units enabling personalisation & data driven decisions
Cloud Speed & Decoupling› 87% mobile data traffic› 16% IT applications public cloud
Access5G Readiness & Efficiency
› 5G launched
› >50% shared or leased passive infra
› 3G and copper sunsetDigitalising our technical stack
45% 48% 51%
0
50
100
0%
20%
40%
60%
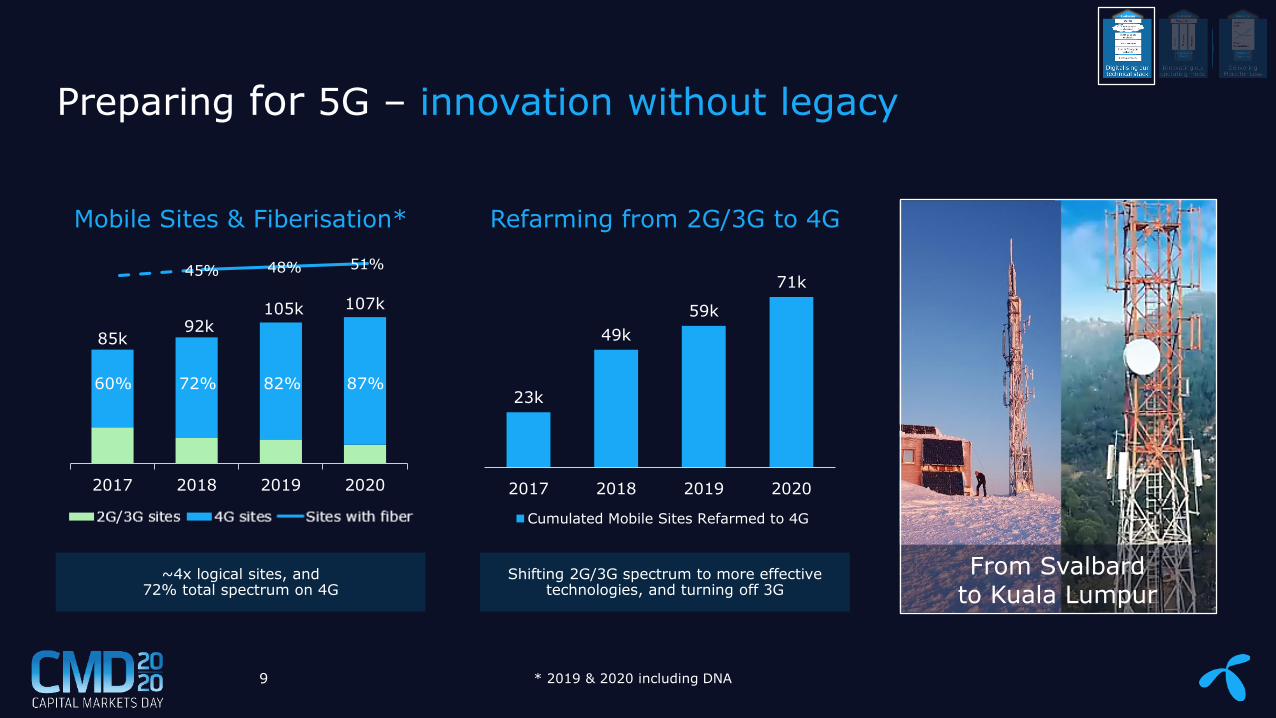
Preparing for 5G – innovation without legacy
9
Mobile Sites & Fiberisation* Refarming from 2G/3G to 4G
Shifting 2G/3G spectrum to more effective technologies, and turning off 3G
~4x logical sites, and72% total spectrum on 4G
2017 2018 2019 2020
0
20
40
60
80
100
120
23k
49k
59k
71k
2017 2018 2019 2020
Cumulated Mobile Sites Refarmed to 4G
60% 72% 82% 87%
85k92k
105k 107k
* 2019 & 2020 including DNA
From Svalbardto Kuala Lumpur
10
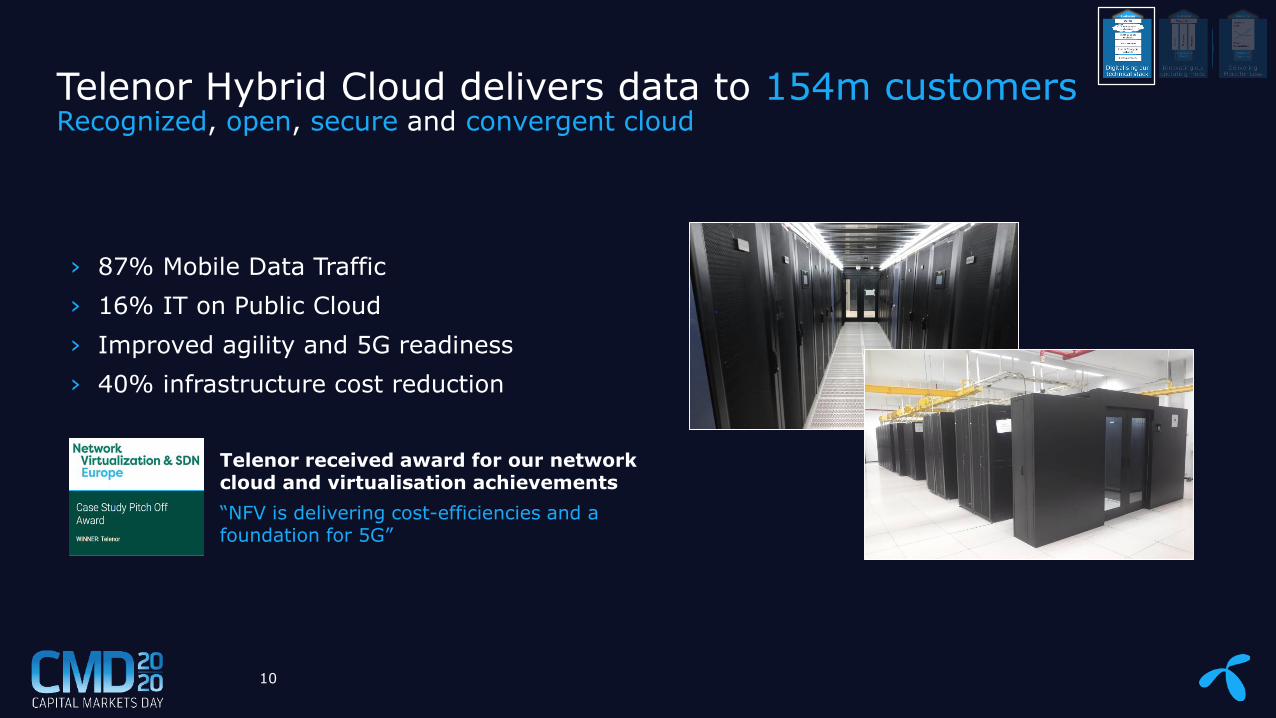
Telenor received award for our network cloud and virtualisation achievements
“NFV is delivering cost-efficiencies and a foundation for 5G”
› 87% Mobile Data Traffic
› 16% IT on Public Cloud
› Improved agility and 5G readiness
› 40% infrastructure cost reduction
Telenor Hybrid Cloud delivers data to 154m customers Recognized, open, secure and convergent cloud

Touch Free Operations
• Fully automated and predictivecustomer centric operations
Automation 1st principle drives our touch free operations ambition
11
Common DeliveryCenter (CDC)
• CDC implemented in 5 Business Units
• Delivering 30% efficiency
• Close to 600 automation use-cases live
Cognitive
• Up to 27% energy efficiency
• Predictive improvement of Network NPS
• Dynamic & demand driven license allocation
2023
Telenor MyanmarIT & Network Operations
› 100% Real time AI based customer problem diagnosis in Network
› 98% Automatic incident detection
› 96% Automatic ticket dispatching & resolution verification
› 71% Real time automatic root-cause analysis
› 38% Reduction of manual resolution
79%Touch Free

The global way of work is our strength
12
Benefits Value
People Competence uplift › 1,300 resources
Processes Effectiveness› 6.8 BNOK TPC savings› ~600 automation use-cases
PartnersCommon Delivery Centers
› 79% Network› 33% IT
Way of Work
Global capacity › 25 Global TeamsInnovating our operating model

Low High
We Create Together and Always Explore
13
Technology Resources Global Teams Granular Way of Work>1/3 FTEs upskilled Group has an extended arm through Global Teams Create Together
Value Creation through Customer Centricity
More than 20% of our technology resourcesare engaged in Global Teams
Actively upskilling and leveraging partners’ scale
Site Profitability
Hands-on, closer
to the Customer
Low High
People and our way of work
17
Technology Personnel Global Teams Granular Way of Work1/3 FTEs upskilled Group has an extended arm through Global Teams Create together
Value Creation through Customer Centricity
767 resources, 83% from BUs, are engaged in Global Teams
77% of FTE reduction is transferred to our partners
92.5%
Site Profitability
Innovating Alt 1
50314732
4000 39683542
2016 2017 2018 2019 Mar'20
2016 to be quality assured ref. TOP
Hands-on, closer
to the Customer
2017 2018 2019 Mar'20
4700 4000 3900 3500
Global Architecture
Security
Sourcing
Demand Management
Network sharing
Performance Management
Operational efficiency
2
131 25Global teams
1
3 2
1
2
CDC
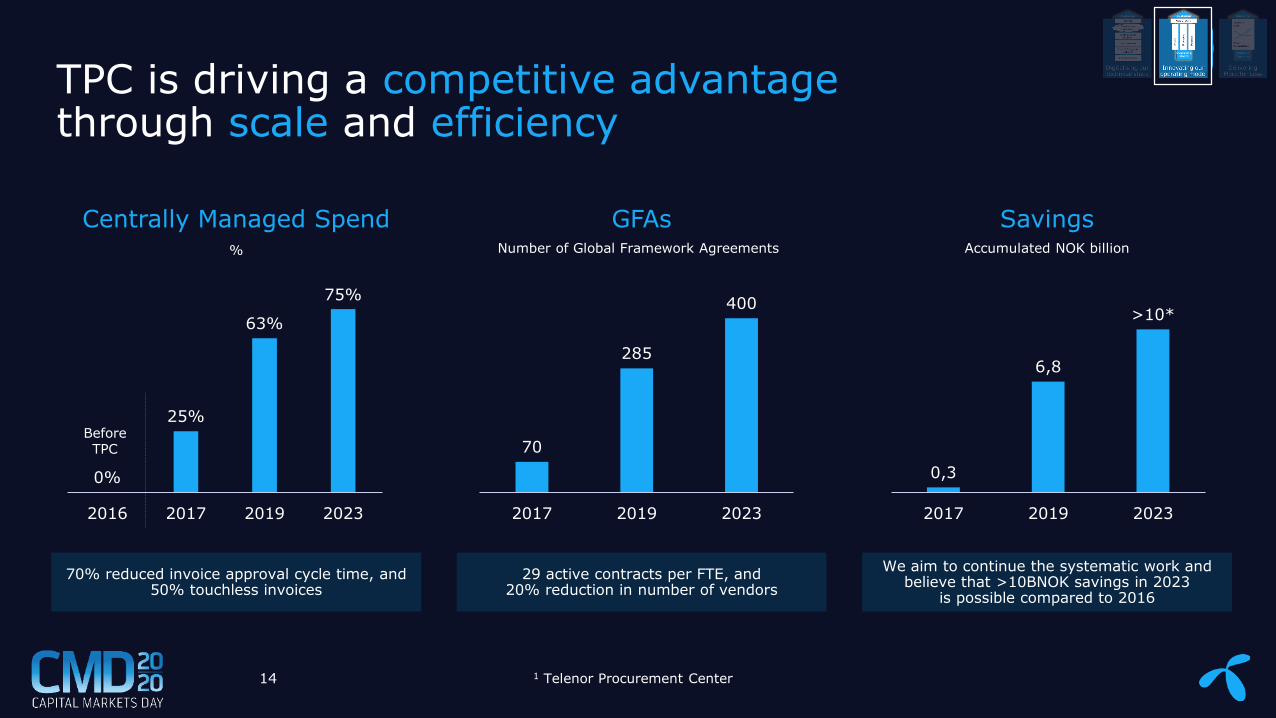
TPC is driving a competitive advantage through scale and efficiency
14
Centrally Managed Spend GFAs Savings% Number of Global Framework Agreements Accumulated NOK billion
0,3
6,8
>10*
2017 2019 2023
70
285
400
2017 2019 2023
0%
25%
63%
75%
2016 2017 2019 2023
BeforeTPC
We aim to continue the systematic work and believe that >10BNOK savings in 2023
is possible compared to 2016
29 active contracts per FTE, and20% reduction in number of vendors
70% reduced invoice approval cycle time, and 50% touchless invoices
1 Telenor Procurement Center
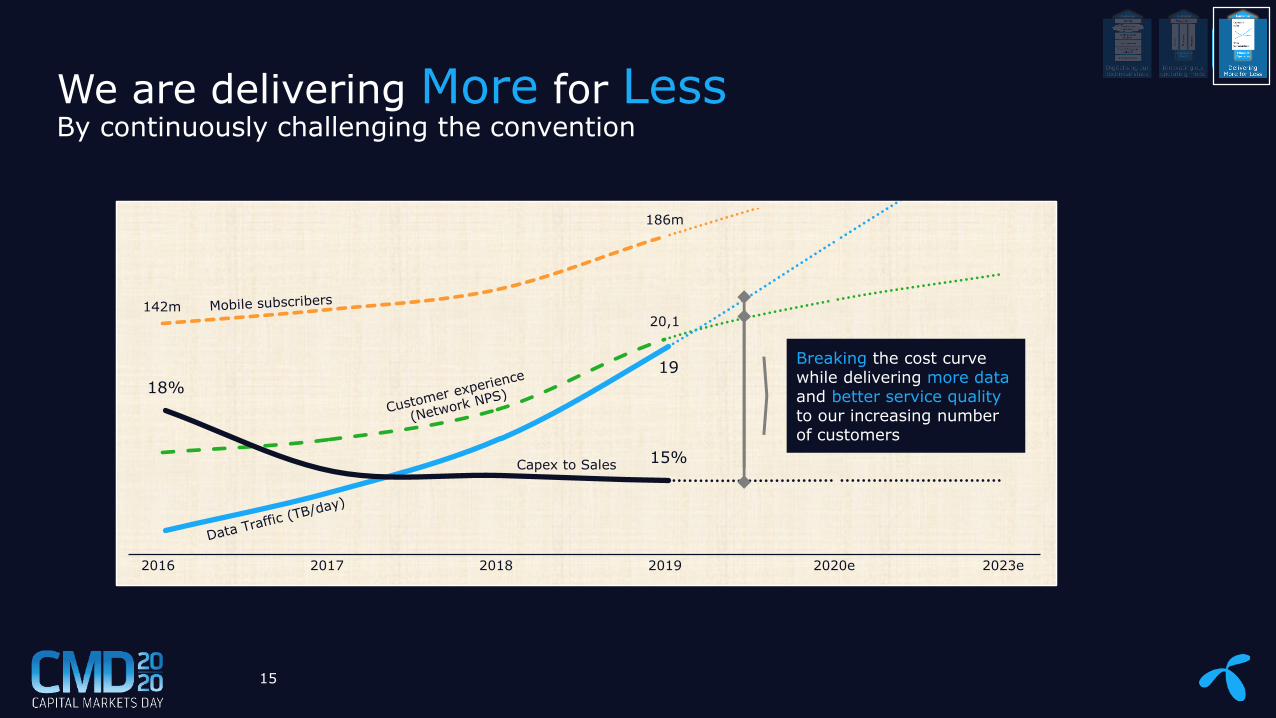
142m
186m
20,1
0
5
10
15
20
25
30
0
20
40
60
80
100
120
140
160
180
200
19
18%
15%
10%
12%
14%
16%
18%
20%
22%
24%
26%
0
5
10
15
20
25
30
2023e2016 2018 2020e20192017
15
We are delivering More for LessBy continuously challenging the convention
Breaking the cost curve while delivering more dataand better service qualityto our increasing number of customers
Capex to Sales

Our relentless focus on results drives modernisation impact
16
2017 2019 2020e 2023e
Excellent & TrustedCustomer Experience
Network Net Promoter Score (NPS) Journey starts 19.4 20.1 Enable invest.
We are security - maturity level Journey starts 2.5 >3 >4
Digitalisingour technical
stack
5G enabled radio 1 0% 8% ~27% ~48%
Cloud: Data Traffic | IT applications Journey starts 83% | 16% 90% | 38% 100% | 80%
Network Energy Reduction: SCN | Asia Continuous improvement Flat | -4% Leading
Innovatingour operating
model
Global Operating Model 45% 72% 81% 90%
NW & IT CDC Capabilities Journey starts 79% | 33% 80% | 50% 90% | 90%
Centralized Procurement Spend 25% 63% 70% 75%
Delivering More for Less
Telenor Capex to Sales 15.4% 15% ~15% ~15%
Average Cost per GB, in NOK 8 4 3 Reduce
4G/5G Spectrum Share 1 59% 72% 84% >90%
1 2019 onwards DNA included

We are Telenor
17
Digitalising our technical stack
Innovating our operating model
Deliveringmore for less
96% 90% ~15%
2023 ambitions