throughput time reduction at saint-gobain abrasives · a major qualifying project report submitted...
TRANSCRIPT

Throughput Time Reduction at Saint-Gobain Abrasives
A Major Qualifying Project Report submitted to the Faculty of
WORCESTER POLYTECHNIC INSTITUTE
in partial fulfilment of the requirements for the Degree of Bachelor of Science
Submitted by:
Allison Holmes
Katherine LaPierre
Celeste Nicoletti
Ashley White
Chelsea White
Project Advisors:
Professor Walter Towner Jr., PhD
Professor Helen Vassallo, PhD
Professor Sara Saberi, PhD
Sponsor Liaison:
Nicole Zea, Saint-Gobain Abrasives, Plant Manager
This report represents the work of five WPI undergraduate students submitted to the faculty as evidence of completion of a degree requirement. WPI routinely publishes these reports on its web site without editorial or peer review. The original document contains trade secrets and proprietary information that have been removed from the permanent
copy on file at the WPI library at the request of the project sponsor.

1
Table of Contents Table of Figures 4
Table of Tables 6
Table of Equations 7
Authorship 8
Acknowledgments 9
Abstract 10
Chapter 1: Introduction 12
1.1 Introduction to Saint-Gobain 12
1.2 Problem Statement 13
1.3 Project Goals and Objectives 13
1.4 Scope and Deliverables 14
1.5 Project Timeline 14
Chapter 2: Background 16
2.1 Superabrasive Grinding Wheels 16
2.2 Grinding Wheels Process 17
2.3 Lean Tools 18
2.3.1 The Seven Wastes 18
2.3.2 Value Stream Mapping 19
2.3.3 Axiomatic Design 20
Chapter 3: Methodology 23
3.1 Design of Methods 23
3.2 Problem Decomposition 24
3.3 Root Cause Analysis 28
3.3.1 Interviews 29
Chapter 4: Results and Discussion 31
4.1 Observations and Constraints 31

2
4.2 Interview Responses 32
4.3 Fishbone Diagram 34
4.4 Discussion of Production Data 37
4.4.1 Late Start Log in the Diamond Room 37
4.4.2 Routing Sheet Historical Data 38
4.4.3 Distance Between Operations 42
4.5 Current State Value Stream Map 45
4.6 Future State Value Stream Map 48
4.7 Backwards Scheduling 51
4.8 Arena® Model 53
4.9 Financial Analysis 59
Chapter 5: Recommendations 63
5.1 Restructure Production Schedule 64
5.2 Bake Fewer Wheels More Often 64
5.3 Stock Commonly Used Preform Molds 64
5.4 Restructure Employee Work Schedule 65
5.5 Utilize Capital Investment Budget 65
5.6 Increase Safety 66
Chapter 6: Conclusion 67
References 69
Appendices 73
Appendix A: Bottlenecks 73
Appendix B: Grinding Wheel Process 74
Appendix C: Operator Survey Questions 76
Coded Survey Responses (Operators) 77
3
Appendix D: Management Interview Questions and Answers 79
Capital Purchasing Engineer 79
Manufacturing Manager (responsible for staffing) 81
Quality Manager 83
Production Scheduling 85
Materials Manager 87
Coded Interview Responses (Managers) 89
Appendix E: Spaghetti Diagram Distances 91
Preform 91
Wheel 92
Appendix F: Backwards Scheduling Example 93
Appendix G: Presentation for Sponsor 94
4
Table of Figures Figure 1. Process of Large Resin Grinding Wheels................................................................................ 17
Figure 2. Standard Value Stream Map Icons. ........................................................................................... 19
Figure 3. Axiomatic Design Domains. ......................................................................................................... 21
Figure 4. Functions Requirements & Design Parameters. ................................................................. 22
Figure 5. Flow Chart of Methods. ................................................................................................................. 23
Figure 6. Axiomatic Design. ............................................................................................................................ 25
Figure 7. Axiomatic Design Functional Requirements and Design Parameters. ....................... 26
Figure 8. Axiomatic Design Matrix. ............................................................................................................. 27
Figure 9. Fishbone Diagram. .......................................................................................................................... 36
Figure 10. Reasons for Orders Arriving Late to the Diamond Room. ............................................ 38
Figure 11. Average Days Late Per Operation. ......................................................................................... 39
Figure 12. Total Production Time in Days. ............................................................................................... 40
Figure 13. Average Production Time by Operations in Hours ......................................................... 41
Figure 14. Spaghetti Diagram of Travel Distances Between Operations...................................... 44
Figure 15. Current State Value Stream Map. ........................................................................................... 47
Figure 16. Future State Value Stream Map .............................................................................................. 50
Figure 17. Backwards vs. Forward Scheduling ...................................................................................... 52
Figure 18. Modules of Basic Process Panel in Arena®. ....................................................................... 54
Figure 19. Current State Arena® Model. .................................................................................................. 57
Figure 20. Future State Arena® Model. .................................................................................................... 58
Figure 21. Cash Flow Analysis. ...................................................................................................................... 62
Figure 22. SA - Historical 2014 Thru 2016&2017 YTD Q1/Q2/Q3 for Total COPQ. ................ 84
Figure 23. Responses from 8 Operators. ................................................................................................... 90

5
Figure 24. Responses from 5 Management Employees. ..................................................................... 90
Figure 25. Backwards Scheduling Example. ............................................................................................ 93

6
Table of Tables Table 1. Expected Increase in Production & Profit ............................................................................... 60
Table 2. Summary of Recommendations. ................................................................................................ 63
Table 3. Interviewees. ...................................................................................................................................... 76
Table 4. Coded Survey Responses. .............................................................................................................. 78
Table 5. Total Survey Responses.................................................................................................................. 78
Table 6. Coded Interview Responses (Managers). ................................................................................ 89
Table 7. Preform Spaghetti Diagram Distances. ..................................................................................... 91
Table 8. Wheel Spaghetti Diagram Distances. ......................................................................................... 92

7
Table of Equations Equation 1 Formula to Calculate Increase in Production Volume. ................................................. 59
Equation 2. Calculated Increase in Production Volume. ..................................................................... 59
Equation 3. Calculated Increase in Production Volume. ..................................................................... 60
Equation 4. Calculated Increase in Production Volume. ..................................................................... 60
Equation 5. Formula to Calculate Present Worth. ................................................................................. 61
Equation 6. Formula to Calculate Number of Periods for an Investment in Excel ................... 61

8
Authorship This project was completed equally in all aspects by all five members of the team.
Team members include: Allison Holmes, Katherine LaPierre, Celeste Nicoletti, Ashley
White, and Chelsea White.

9
Acknowledgments We would like to thank the following individuals and organizations who contributed
to the overall success of our project.
We would first like to thank Nicole Zea, our project liaison to our sponsor, Saint-
Gobain Abrasives, for providing us with insight, feedback, and company contacts. We
appreciate her giving us the workspace and resources necessary for completing the project.
All of these things have proven invaluable for the completion and success of our project.
We would like to thank our 15 interviewees for the time they took to speak with us,
as their knowledge has helped shape our project. Each of these individuals provided us
with a greater understanding of the overall structure and current situation at Saint-Gobain.
Their responses allowed us to identify problems and solutions that we may not have
thought of otherwise.
Finally, we would like to thank Worcester Polytechnic Institute for giving our team
the opportunity to complete an off-campus project. In particular, we wish to acknowledge
the support and guidance provided by our project advisors, Professor Walter Towner,
Professor Helen Vassallo, and Professor Sara Saberi. We appreciate their guidance and
feedback through this entire process and for pushing our team to produce the most
impactful suggestions for Saint-Gobain to consider moving forward.

10
Abstract Saint-Gobain North America is a global leader in building materials and abrasives.
After acquiring Norton Company, a legacy manufacturing plant based in Worcester, in
1990, they were able to expand their market to a variety of grinding, cutting, blending,
finishing, and polishing solutions. Today, Saint-Gobain continues to manufacture a wide
variety of products. The Worcester campus manufactures ceramics, plastics, abrasives, and
superabrasives. One particular product they manufacture are large resin superabrasive
grinding wheels. The process, however, is not as efficient as it could be. Identifying
opportunities for waste reduction is essential in creating a sustainable and successful
process.
The overall objective of this project is to help Saint Gobain’s Worcester plant to
reduce the throughput time for their large resin superabrasive grinding wheels by utilizing
industrial engineering principles, lean manufacturing techniques, axiomatic design, and
computer simulation models. The proposal included a series of changes that the plant could
make in order to operate more efficiently while reducing bottlenecks and increasing the
likelihood of shipping customer orders on time. A financial analysis of the potential
increase in sales revenue based on process improvements was provided, as well as a cash
flow analysis for capital investment opportunities.
A review of the state of the art revealed examples of waste in the current system.
Observations and data collection showed that customer orders are frequently late, the
wheels travel a significant distance throughout the facility, and there is a long queue time
between steps of the process. These delays and waste cause an increase of non-value added
time in the process. Addressing these issues will allow a potential decrease in throughput
time for the large resin superabrasive grinding wheels.
The approach was to decompose the overarching problem of an unacceptably long
throughput time by analyzing scheduling, transportation, and wait time.

11
Methods used include the creation of a current and future state value stream map,
Arena® simulation models, a spaghetti diagram with calculated travel distances, as well as
an axiomatic design decomposition and financial analysis of the impact of the team’s
proposed recommendations.
The provided data that and the data that the team collected shows a high variance in
overall process times. These results raise concerns regarding the repeatability of the
throughput time, especially considering that all wheels are custom made. The
manufacturing process varies for each order.
The analysis of our collected data and models lead the team to three findings that in
order to reduce the throughput time and maintain improvements, Saint-Gobain should
consider revising their production scheduling methods, baking wheels more often, and
stocking commonly used preform molds.

12
Chapter 1: Introduction 1.1 Introduction to Saint-Gobain
Saint-Gobain, a French manufacturing company, is a global leader in sustainable
habitat, and the world’s largest building materials company (Saint-Gobain in North
America, 2014). Originally known as the Royal Manufactory of Mirror Glass, Saint-Gobain’s
roots date as far back as 1665 (Norton Saint-Gobain, 2014). Over 350 years later, they now
design, manufacture, and distribute building and high-performance materials. The
company also provides innovative solutions to the challenges of growth, energy efficiency,
and environmental protection (Norton Saint-Gobain, 2014).
In 1990, an effort to expand their market led Saint-Gobain to acquire Norton, a
legacy plant that has been manufacturing abrasives for over 130 years. The Norton
Company began as a tiny start-up in Worcester, Massachusetts in 1858, owned by cousins
Frederick Hancock and Frank B. Norton (Saint-Gobain, 2014). They began their business
making grinding wheels. As they rapidly expanded, the products they made were
diversified to include industrial products and other abrasives. By the 1980’s, the Norton
Company consisted of four successful divisions (abrasives, high-performance ceramics,
high-performance plastics, and healthcare products), which is what attracted Saint-Gobain
to the company. The 10-billion-dollar acquisition was a major turning point in Saint-
Gobain’s history, allowing the company to double its presence in America, as well as to
enter the abrasives market.
Norton, both at the time of their acquisition in the 1990s and today, is a world
leader in abrasives. Norton offers the widest selection of grinding, cutting, blending,
finishing, and polishing solutions for many different markets, materials and applications, as
well as offering the most advanced and affordable technology (About Norton, 2014).
Norton products are commonly used for construction purposes, in the iron, steel, and paper
industries, and in high tech industries for automobiles, aeronautics, and electronics. Saint-
Gobain has locations across the United States and Canada, with 8 facilities and over 2,200
employees (About Norton, 2014). Although Norton has changed its name to Saint-Gobain

13
Abrasives, the company continues to be a household name in abrasives. The headquarters
for the abrasives unit remains at the Norton legacy plant in Worcester.
Today, Norton Saint-Gobain manufactures many products, including light
construction equipment, non-abrasive products, and abrasive products. This project is
focused on their superabrasive products, in particular the large resin grinding wheels,
which was one of the original products of The Norton Company.
1.2 Problem Statement
The lead-time for the large resin grinding wheels in the super abrasive department
at Saint-Gobain’s Worcester plant is longer than desired. Saint-Gobain is a world leader in
the grinding wheel industry, and the Worcester location is a job shop manufacturing
facility. The majority of the orders are for single products or small made-to-order batches
for customers. Due to the nature of the business, there are inefficiencies when scheduling
production. It is difficult to make a uniform schedule, since each product takes a different
amount of time to manufacture. The resulting production schedules often causes
bottlenecks throughout the process. These bottlenecks are rate-limiting steps in the
process. A more descriptive summary of bottlenecks can be found in Appendix A. Saint-
Gobain strives to reduce the bottlenecks in order to decrease overall lead-time. Using
several lean tools, the team will identify opportunities for process improvement to aid in
reducing overall lead-time. These opportunities will become suggestions for Saint-Gobain
as they move forward in designing a more efficient grinding wheel production process.
1.3 Project Goals and Objectives
The goal of the project is to reduce the total lead-time for the large resin
superabrasive grinding wheels by identifying opportunities for process improvement.
Through the utilization of lean manufacturing techniques, the team could analyze and
improve the overall flow of the process. This subsequently aided in the reduction of
bottlenecks in the system. A current state value stream map gives visualization of how the
process currently runs. A future state value stream map will help Saint-Gobain identify
areas for continued improvement and opportunities to relieve bottlenecks. In addition to
both value stream maps, the team also simulated the production system using the

14
simulation software Arena®. This software helps to replicate what is happening in the
shop, and allows adjustments to be made to simulate different scenarios such as process
distribution times, process flow steps, and likely outcomes. From here, it was easier to
identify changes that would create an optimal production system. Finally, the team used a
spaghetti diagram to demonstrate where the wheels travel throughout the plant. By
completing these initiatives, the team identified process improvements to the overall
process.
1.4 Scope and Deliverables
Saint-Gobain manufactures several different varieties of grinding wheels; however,
the focus of this MQP was on the large DC-30 superabrasive grinding wheels and how to
reduce its throughput time. The project analyzed sources of waste within the
manufacturing process, identified bottlenecks, and provided future recommendations for
Saint-Gobain to pursue in order the improve the process. The deliverables used to identify
waste and bottlenecks included:
Both a current and future state value stream map created in Microsoft Visio
A hierarchical decomposition of the functional requirements and design parameters
of the manufacturing process using Acclaro® software
An Arena® simulation that models the production process
A spaghetti diagram of the manufacturing floor shows likely outcomes with travel
distances of the large resin wheels
A financial analysis of the impact of our proposed recommendations
1.5 Project Timeline
The timeframe for completing this MQP spanned from the beginning of A-term 2017
to the end of B-term 2017 (August 24th through December 15th). A Gantt chart broke
down the project into a series of goals and tasks. Each phase of the project was outlined as
follows:

15
Phase 1 (late August - mid September): Team familiarization with Saint-Gobain’s
history and current manufacturing process; background research on superabrasives
and Lean manufacturing; introduction writing
Phase 2 (mid to late September): Worked on the floor to collect data for determining
lead times and bottlenecks; first drafts of current state & ideal state value stream
maps; axiomatic design decomposition; and preliminary Arena® simulation
Phase 3 (late September to mid-October): Interviews with operators and
management; final draft of axiomatic design decomposition;
Phase 4 (late October to mid-November): Final drafts of current state & ideal state
value stream maps and Arena® simulation; financial analysis; mid-project
presentation for sponsor
Phase 5 (mid-November to mid-December): Finalized recommendations; completed
final paper and presentation for sponsor
Due to the two term nature of this MQP, the team planned to gather the majority of
the data required for the project during A-term in order to allow B-term to be focused on
creating the final drafts of the deliverables and paper.

16
Chapter 2: Background 2.1 Superabrasive Grinding Wheels
Abrasives are essential to many manufacturing processes today. They aid in the
cutting, grinding, and polishing operations of materials. In order to make uniform and
dependable cuts, abrasive grains must be of a controlled size, free of impurities, and
uniformly distributed (Norton Company, 1951). Abrasives are used to cut material that is
softer than the material doing the cutting (Norton Company, 1951).
This project focuses on superabrasives. Superabrasives are manufactured either
using diamond or cubic boron nitride (CBN) (Krar, 1995, p. 21). Superabrasives have
certain properties that cause them to stand out amongst regular abrasives. Their hardness
is much greater than that of other abrasives. Diamond is the hardest material with a
hardness range of 7,000 -10,000 on the Knoop hardness scale, while CBN has a hardness of
about 4,700. (Krar, 1995, p. 21). Diamonds also have a greater abrasion resistance, thus
allowing them to wear much more slowly, subsequently reducing the frequency of
replacement. Superabrasives have a greater compressive strength, which is the maximum
amount of stress an abrasive can undergo before breaking (Linke, 2016). For example, the
superabrasive diamond has 19 times the compressive strength of silicon carbide, a regular
abrasive (Krar, 1995, p. 21). Lastly, the thermal conductivity of superabrasives surpass that
of conventional abrasives (Krar, 1995, p. 21). These superabrasives are able to grind the
hardest industrial materials, thus increasing productivity and quality while reducing
manufacturing costs.
Grinding wheels are used in grinding machines to grind various types of material. The
types of industries Saint-Gobain’s superabrasive grinding wheels are used to manufacture
include:
Automobile engines
Transmission and bearing components
High-hardness cutting tools for machining and oil and gas exploration
Semiconductor chips and other electronic devices
Automotive and architectural glass processing (Saint-Gobain Abrasives, 2017)
17
In these industries, superabrasive materials are used to cut especially resistant
substances such as glass, stone, ceramics, and cemented carbides (Lewis, 1951, p. 14).
2.2 Grinding Wheels Process
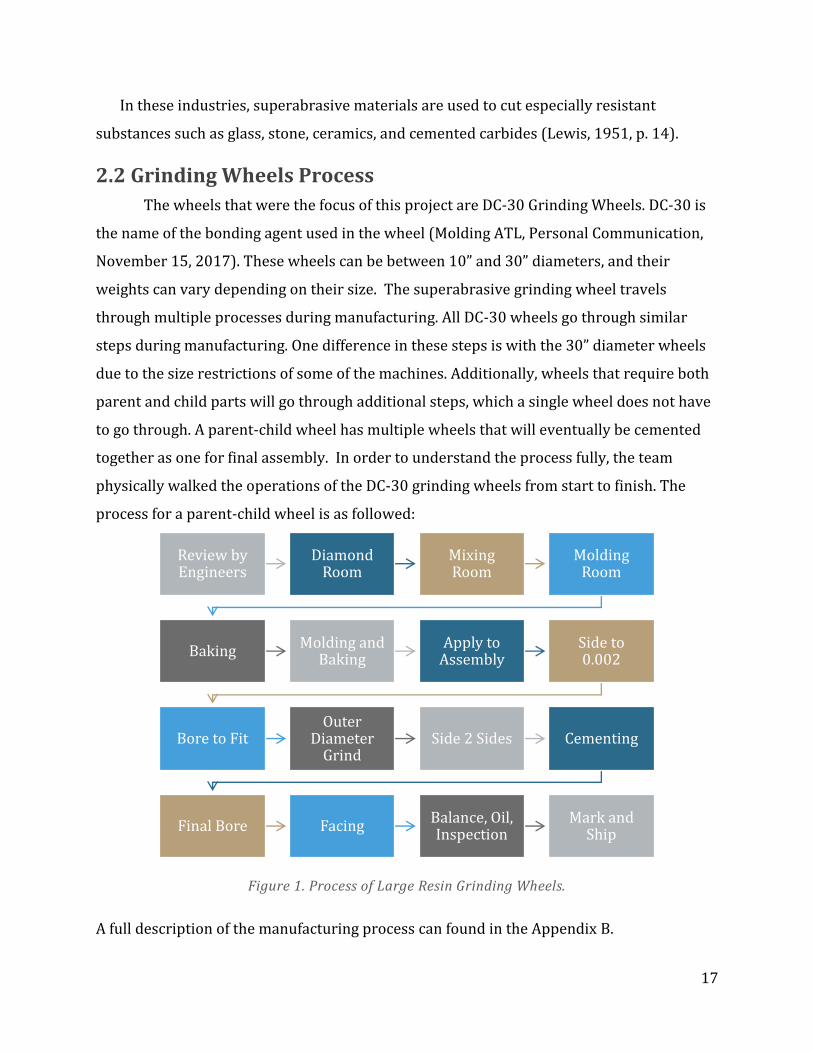
The wheels that were the focus of this project are DC-30 Grinding Wheels. DC-30 is
the name of the bonding agent used in the wheel (Molding ATL, Personal Communication,
November 15, 2017). These wheels can be between 10” and 30” diameters, and their
weights can vary depending on their size. The superabrasive grinding wheel travels
through multiple processes during manufacturing. All DC-30 wheels go through similar
steps during manufacturing. One difference in these steps is with the 30” diameter wheels
due to the size restrictions of some of the machines. Additionally, wheels that require both
parent and child parts will go through additional steps, which a single wheel does not have
to go through. A parent-child wheel has multiple wheels that will eventually be cemented
together as one for final assembly. In order to understand the process fully, the team
physically walked the operations of the DC-30 grinding wheels from start to finish. The
process for a parent-child wheel is as followed:
Figure 1. Process of Large Resin Grinding Wheels.
A full description of the manufacturing process can found in the Appendix B.
Review by Engineers
Diamond Room
Mixing Room
Molding Room
BakingMolding and
BakingApply to
AssemblySide to 0.002
Bore to FitOuter
Diameter Grind
Side 2 Sides Cementing
Final Bore FacingBalance, Oil, Inspection
Mark and Ship

18
2.3 Lean Tools
Lean manufacturing is a systematic approach that aims to eliminate waste, create
flow, and increase the speed of a process while continuously improving quality, cost, and
the speed of delivery for customers (Plenert, 2012, p. 6). Originally based on a Japanese
concept most commonly known as the Toyota Production System or Total Quality
Management, lean strives to eliminate anything that is not required for the delivery of a
valuable product to a customer, which is also known as eliminating non-value added time
(Feld, 2001, p. 12).
The first step in lean process improvement requires that value be defined from the
customer’s perspective; the value should not be defined from the industry’s perspective
(Plenert, 2012, p. 148). Anything that the customer would not deem valuable is considered
waste. Several methods are used to analyze where waste exists in a production system and
how to remove it. Some of these methods include value stream mapping, spaghetti
diagrams, 5S, Six Sigma, fishbone diagrams, and the seven wastes in manufacturing (Feld,
2001, p. 85).
2.3.1 The Seven Wastes
Taiichi Ohno, who proposed these wastes while analyzing the Toyota Production
System (Jackson, 2012), originally developed the idea of the Seven Wastes in
manufacturing. Since Ohno, the seven wastes have become a crucial element of the lean
improvement process. The seven wastes allow for two things: they help decompose a
process and assist in identifying where deficiencies lie, and they help differentiate between
value added and nonvalue added time. Ohno’s wastes are as follows (Plenert, 2012, p. 176)
1. Unnecessary transportation: information, people, or materials that are
unnecessarily transported, handled, or stored
2. Excess inventory: materials, products, or information that is waiting to be
processed; holding or ordering unnecessary inventory; storage of resources not
directly needed to satisfy current customer demand
3. Unnecessary movement by employees: excess movement or repeated
activities; handling steps that should be automated; poor layout

19
4. Waiting: time delays; idle time in the process; delays caused by shortages,
downtime, or redundancy
5. Overproduction: processing more or more quickly than meets customer
demand; producing product for which there is no customer demand
6. Over-processing: unneeded or redundant processing; adding more value to a
product than a customer wants or is willing to pay for
7. Defects: rework and correction or errors; scrap
2.3.2 Value Stream Mapping
Value Stream Mapping (VSM) is another process mapping and waste identification
tool that is used to identify lean improvement opportunities by focusing on finding non-
value added processes in a system (Bradley, 2014, p. 28). In a manufacturing setting, the
value stream generally spans the time from which the order is received to the time when
the product is delivered and payment is received from the customer. Value stream mapping
allows everyone involved in a process (i.e. management, the workforce, suppliers,
customers, etc.) to participate and differentiate between value and waste, and create a plan
of action for waste elimination. Value stream maps are drawn as pictures of the entire
process. There are standard value stream mapping symbols used to present a logical
representation of the process (Nash & Poling, 2008). These standard icons are seen in
Figure 2.
Figure 2. Standard Value Stream Map Icons.

20
There are certain guidelines to follow when making a value stream map.
Implementation of a value stream map involves the following steps (Mignosa, Voehl,
Charron, & Harrington, 2016):
1. Identify the process to be evaluated
2. Construct a flowchart of the current process (current state) to identify
a. Steps
b. Delays
c. Information flows require:
i. Raw materials
ii. Design flow
iii. Handling
3. Evaluate the current state value stream map flow to eliminate waste
4. Identify areas of improvement in the current state value stream map
5. Construct a future state value stream map
6. Implement plans to move toward the future state process flow
The current state value stream map is based on how the process works currently,
while the future state value stream map combines the current state with ideas and lean
tools to produce an idea for how the process could function in the future. The purpose of
developing a future state value stream map is to identify realistic goals to focus
improvements on. The future state is not the ideal process, rather an achievable one given
the company’s available resources.
2.3.3 Axiomatic Design
Axiomatic Design is a problem solving technique developed by Nam Suh, an
engineering professor at MIT, in the 1990’s. The goal of axiomatic design is to reduce the
complexity of a problem by being able to make right design decisions at all levels (Suh,
1990). This matrix-based approach analyzes the customer needs (CNs) by breaking them
down into functional requirements (FRs), design parameters (DPs), and process variables
(PVs) (Borgianni & Dominik, 2015). Axiomatic design is a beneficial problem solving tool
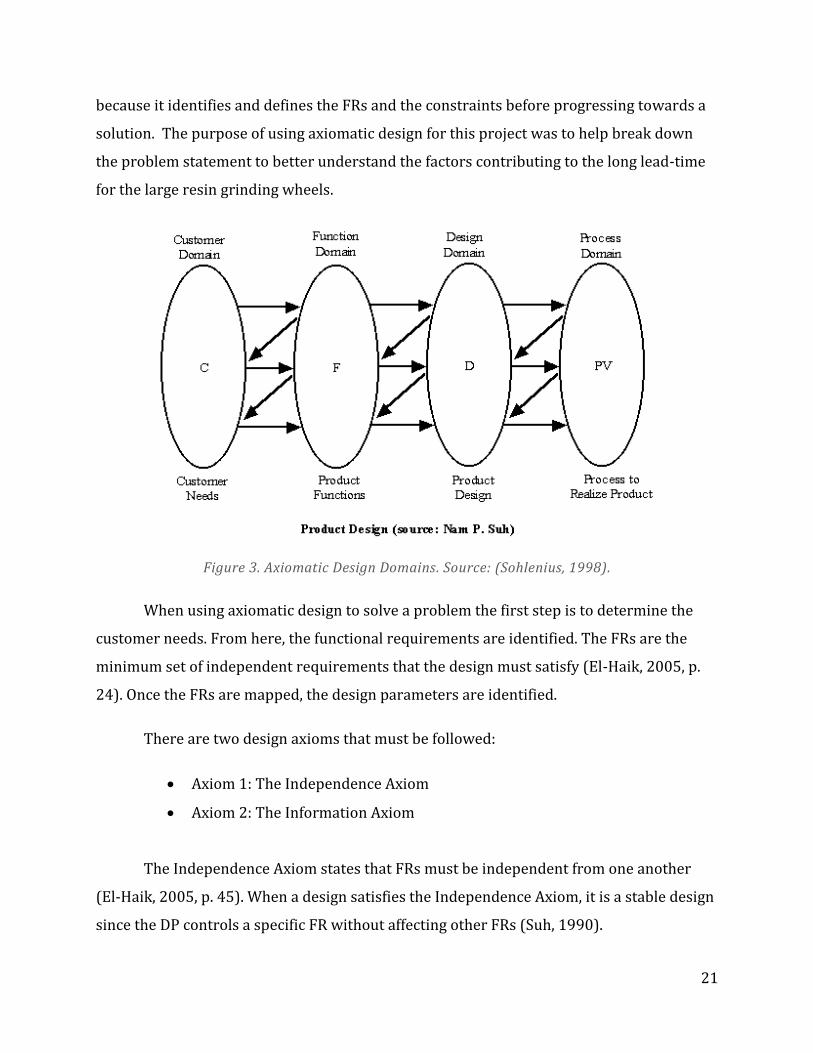
21
because it identifies and defines the FRs and the constraints before progressing towards a
solution. The purpose of using axiomatic design for this project was to help break down
the problem statement to better understand the factors contributing to the long lead-time
for the large resin grinding wheels.
Figure 3. Axiomatic Design Domains. Source: (Sohlenius, 1998).
When using axiomatic design to solve a problem the first step is to determine the
customer needs. From here, the functional requirements are identified. The FRs are the
minimum set of independent requirements that the design must satisfy (El-Haik, 2005, p.
24). Once the FRs are mapped, the design parameters are identified.
There are two design axioms that must be followed:
Axiom 1: The Independence Axiom
Axiom 2: The Information Axiom
The Independence Axiom states that FRs must be independent from one another
(El-Haik, 2005, p. 45). When a design satisfies the Independence Axiom, it is a stable design
since the DP controls a specific FR without affecting other FRs (Suh, 1990).

22
The Information Axiom is used to minimize the information content of the design in
order to make it as straightforward as possible. Suh stated, “Among all designs that satisfy
the Independence Axiom, the one that possesses the least amount of information is the
best” (Suh, 1990).
Figure 4. Functions Requirements & Design Parameters. Source: (Suh & Do, 2000).

23
Chapter 3: Methodology 3.1 Design of Methods
In order to achieve the overall project goal of providing suggestions to reduce the
throughput time for the large resin grinding wheels at Saint-Gobain Abrasives, the team
designed a methodology as a sequential systematic process, with each step building off data
from the previous. Each step is done before the preceding step. For each method the team
used, the purpose was also identified to ensure that all of the methods were useful in
achieving the project goal. There is one overall purpose for each method. See Figure 5 for a
breakdown of each method and its corresponding purpose.
Figure 5. Flow Chart of Methods.
Method
Identify value-added and non-value added activities
Collect relevant data
Create Ishikawa Diagram
Generate Current Value Stream Map
General Future Value Stream Map
Create ARENA Simulation
Purpose
Identifies how well the customer needs are being taken into
consideration
Understand what is currently done in factory, as well as recent
past
Categorize potential causes of a problem to identify true root
cause
Outlines the current process information in order to identify
bottlenecks
Apply lean tools to current state to identify how the site could
function in the future
Simulates different options for improving scheduling for products and operators

24
3.2 Problem Decomposition
To analyze the current state of the large resin grinding wheel production process,
the team utilized axiomatic design in order to decompose the process into functional
requirements to identify the customer needs. The team identified the top-level functional
requirement, FR0, as a need to reduce the throughput time for the large resin grinding
wheels. From there, the Seven Wastes of Lean manufacturing, commonly known by the
acronym “TIMWOOD”, further broke down the problem. The team chose to adapt the
acronym to “TIMPWOD” slightly. This is the acronym used by the production management
team at Saint-Gobain. It focuses on the following:
Transportation: reducing the distance each wheel is traveling. Depending on the
type of wheel ordered, it may have to go through a nonlinear process and cycle back
to a station it has already visited.
Inventory: each wheel is made-to-order and lead time can be long, so there is
constantly a sizeable amount of WIP in the system which could be minimized
Motion: reducing unnecessary motion of employees, which includes repetitive
motions, as well as movement to and from the workstation due to distractions, or
placement of materials.
Personnel Utilization: improving the utilization of employees during each shift to
ensure that each employee is using time as efficiently as possible. This will help
identify whether or not additional employees need to be hired, or if more shifts
should be added to the schedule.
Waiting: reduce waiting due to machine downtime, machine shortages, and
setup/shift changes. Several steps in the process cause long waits and increase non-
valued added time and due to the timing of shifts, some steps of the process take
longer than necessary.
Overprocessing: some wheels go through a step more than once, which leads to an
increase in lead-time and overall transportation of the wheel.
Defects: reducing the amount of defective wheels that are produced by identifying if
these issues are usually caused by a certain machine or step in the process.

25
The team chose to focus on personnel utilization in place of overproduction because
of the job shop nature of Saint-Gobain’s manufacturing for this line of grinding wheels. On
the other hand, personnel utilization is important because of the low number of employees
and shifts, which may create bottlenecks in certain departments. The team could then
identify which parts of the process may need more operators or additional shifts added.
After identifying the upper level functional requirements, most of the top level FRs
were broken down further, with their children requirements describing actions that would
also need to be taken in order to fulfil the parent FR, and ultimately, the team's FR0. Using
Acclaro® software, the team input the decomposition in order to generate the design
matrix.
Figure 6. Axiomatic Design.
FR0: Reduce the throughput time for the large resin superabrasive grinding wheels using IE and OM principles
FR1: Reduce TRANSPORTATION waste caused by nonlinear processes
•FR1.1: Reduce the amount of touches for each wheel
FR2: Reduce excess INVENTORY in the system
•FR2.1: Identify opportunities to reduce the amount of raw materials and WIP in the system
FR3: Reduce unnecessary MOTION due to interruptions
•FR3.1: Identify sources of employee distraction
FR4: Improve PERSONNEL UTILIZATION of employees
•FR4.1: Identify if the number of employees should be increased
FR5: Reduce WAITING for non-value added work
•FR5.1: Reduce wait times caused by setup and shift changes
•FR5.2: Reduce the downtime of each machine
•FR5.3: Identify machine shortages
FR6: Reduce OVERPROCESSING by eliminating redundancy in the process
FR7: Identify and reduce consistent DEFECTS in the process

26
Figure 7. Axiomatic Design Functional Requirements and Design Parameters.

27
Figure 8. Axiomatic Design Matrix.
As shown in the design matrix for this decomposition, there is no coupling of
functional requirements and design parameters, which is ideal. This eliminated the need
for the team to identify ways to decouple FRs and DPs for specific processes in order to
maintain the Independence Axiom. It is crucial to maintain this axiom because each design
parameter should only influence its related functional requirement. This allowed the team
to work on each design parameter independently, without concern that the design would
affect other requirements, and vice versa.

28
By decomposing the problem statement using axiomatic design, the team was able
to easily proceed to the analysis portion of the project after data collection because the
goals of the project were clearly defined. By having the project focus clearly communicated
from the beginning, the team was able to avoid changing the scope throughout the duration
of the project. While axiomatic design does not directly solve the problem statement, it
allows the user avoid unnecessary iterations in the design of solutions.
3.3 Root Cause Analysis
Root cause analysis is a set of tools and methods that is used to evaluate significant
events to help identify the root causes of potential problems (Vanden Heuvel, Lorenzo,
Montgomery, Hanson & Rooney, 2005). There are different methods that can be used to
perform a single case bore analysis or evaluate any undesirable event. Before identifying
the root cause of an event, the problem must be defined and data must be collected
(Ammerman, 1998, p. 79). There are many different approaches for collecting data, such as
reviewing records, conducting interviews, and observing the actual scene of the event
(Andersen & Fagerhaug, 2006, p. 31). After identifying the problem and collecting the data,
the event can be analyzed. There are four different kinds of analysis: task analysis, change
analysis, control barrier analysis, and event and causal factor charting (Ammerman, 1998,
p. 81). The team implemented task analysis.
Task analysis is a method of “dividing or breaking down a task into its steps or
subtasks by identifying the sequence of actions, instructions, conditions, tools, and
materials associated with the performance of a particular task” (Ammerman, 1998, p. 86).
The goal of task analysis is to figure out what is supposed to be happening in a system.
When determining the root cause of the problem, there must be different kinds of data that
is collected. A common way to collect data is through interviewing key stakeholders.
Understanding what information the user is seeking is critical. In the case of Saint-Gobain,
the goal of the interviews was to identify opportunities for improvement and
recommendations to reduce the lead-time based on the observations of the employees.
The team also created an Ishikawa diagram, or fishbone diagram, to help identify
the root cause of the problem. A fishbone diagram is a visual tool that helps categorize the

29
potential causes of the problem (Law, 2016). Working back from the initial problem, the
team identified four main categories that potential causes could fall in, which include
people, environment, process, and equipment. These categories were broken down further
to identify the potential problems and the causes within these categories.
When determining the root cause, it is important to remember, “Data plus analysis
equals information” (Ammerman, 1998, p. 86). There are many benefits to solving a
problem using root cause analysis. One benefit is that a root cause analysis is that it is used
to determine presumptive causes of the performance problem. It is also used to eliminate
apparent and presumptive causes that data does not support (Ammerman, 1998, p. 88). A
root cause analysis determines what actions need to be corrected. By looking at these
causes, it is easier to identify all the corrective actions that are required when preventing
the problem from reoccurring.
3.3.1 Interviews
Each stage in the grinding wheel manufacturing process plays a crucial role in
completing a wheel on time. To get a complete picture of the current opportunities for
improvement at Saint-Gobain, the team interviewed members of management and
operators. The goal was to attempt to draw parallels between the responses from each
group, as we expected each to have different perspectives. First, the team conducted
interviews with operators because they are the closest to the process. In order to get a
complete view of what works well and what does not on the manufacturing floor, the
interviewed employees all worked on different aspects of the process. These employees all
had several ideas regarding potential improvement opportunities. The team used a basic
questionnaire for the operators and it was modified based on their responses. The full
questionnaire for the operators is in Appendix C.
These employees are the experts in their respective departments and could offer
insightful information regarding improvement opportunities. A different set of questions
was created for each of these interviewees. These questions were beneficial in
understanding the role of the management employee and changes that the employee

30
envisions for Saint-Gobain. These questions, as well as the responses from the managers
can be found in Appendix D.
These interview sessions with both operators and managers helped to identify the
positive and negative aspects of the process. It also helped the team understand what
improvement efforts were made in the past and whether or not they were successful. The
collected responses helped the team identify potential areas to focus their efforts for
process improvement.

31
Chapter 4: Results and Discussion 4.1 Observations and Constraints
Observing both the steps of the manufacturing process as well as the operators
working on the production were essential to further understanding the problem statement
and helping develop feasible recommendations for improvement. The team made
observations from the first step of the process in the diamond room through to the final
step in finishing. Based on the observations, it was clear that the process is slow moving
and there is not a lot of opportunity for automation since each of the parts are different
dimensions (Capital Purchasing Engineer, Personal Communication, October 4, 2017).
After the observations were complete, the team identified scheduling, molding, and
baking as the main rate limiting steps. Some of the orders the team observed on the floor
appeared to be behind schedule, indicating that the production schedule may not be
optimal given the number of resources and operators.
The part goes through two different molding processes. The preform mold must be
completed before the diamond mold starts. On average, the preform molding takes 3 days,
but starts on average 2 days after the initial order is placed, leaving those previous days
wasted. Once the preform is molded, the part must bake, which causes a delay for the
second molding process. This becomes a common bottleneck. The elongated queue time
for the molding process is based on an influx of parts to the system when the initial baking
of the preform is complete. Parts are supposed to be done in a first-in first-out (FIFO)
order. Due to the influx, there is no specified order, so some parts sit longer, causing them
to get further behind schedule. Based on the data that was provided, it was clear that the
queue time for the molding operation is significantly higher than the other operations
(Production Engineer, Personal Communication, October 25, 2017). Another constraint
with the system is that the scheduler assumes infinite capacity, although in reality, only a
certain number of wheels can be molded per day based on the size and time that molding
takes. There are only eight presses to mold the preforms and wheels, making them a
limited resource.

32
The last major constraint that was identified was in Baking. Baking takes between
16 and 37 hours on average, although the parts sit in the oven for approximately 48 hours
(Production Scheduling, Personal Communication, November 8, 2017). Therefore, there are
between 11-32 unused hours in the baking process where the wheels are just sitting,
depending on the cycle. Additionally, the wheels that bake for 16 hours sit for the same
amount of time as the wheels that bake for 37 hours because the operator that unloads the
wheels comes every day and a half after baking starts (Molding ATL, Personal
Communication, November 15, 2017). This is a scheduled person so currently there is no
option to make this more frequent. The wheels are usually cooled and unloaded at 3am.
Another issue with the baking station is that the operators generally wait to start the
baking until an oven is filled. Since each oven can hold approximately 20 large resin wheels,
there are many wheels that are ready to be baked, but the wheels sit and wait until a full
batch can be made (Molding ATL, Personal Communication, November 15, 2017). Once the
baking of these large batches of wheels is complete, the wheels flood the queue for other
processes, causing a longer throughput time.
4.2 Interview Responses
By analyzing and breaking down the interview responses from employees, the team
was able to identify key takeaways from the interviews. These takeaways were broken into
five categories of the highest repeated responses. The categories were:
Scheduling problems
Management
Plant employees
Physical space in the plant
Capital investment
When designing the interview questions for the management, it was important to
tailor the questions to each person’s respective expertise. Interviewing someone from each
of the categories was important to understand if the operator’s needs matched the needs
and goals of the company and management. The team interviewed six employees from
management: the capital-purchasing engineer, manufacturing manager (staffing), quality

33
manager, production scheduling manager, materials manager, and finance controller. Each
management employee was asked a standard set of questions. From there, another set of
questions was created to extract the information that was pertinent to each of the
employees. These questions helped the team understand the root cause for the opportunity
to reduce the lead-time.
Through the interviews, the team was able to identify the following opportunities
for improvement:
Adjust when the wheel is scheduled to begin production
Operator accountability for FIFO
In an interview with the Manufacturing Manager, the team learned that Saint-
Gobain typically promises their customers 20 working days to produce the order
(Manufacturing Manager, Personal Communication, October 5, 2017). Each part currently
has a scheduled for a lead-time of 16 days. The scheduling system that Saint-Gobain uses
creates the timeline for the production of a wheel beginning at the required date of
completion and works backwards to determine the projected start date (Manufacturing
Manager, Personal Communication, October 5, 2017). However, the way the dates end up
being spaced out leaves approximately 4 days unaccounted for at the beginning of the
process because it calculates it as a late-start date instead of early-start. These extra days
are unused, which in turn contributes to the late production. The manufacturing manager
believes that having the orders mixed the day after the order is printed could make a
significant impact on reducing throughput time.
The interviews conducted also showed that there is a disconnect between what
management plans and what the operators do in terms of the order in which the parts are
worked on. Through an interview with Production Scheduling Manager, the team learned
that management intends for the manufacturing to work on FIFO (Production Scheduling,
Personal Communication, October 5, 2017). In an interview with a Laser Marker employee,
we learned that he tries to work by FIFO dates, but often times he gets products out of
order because machine operators will prioritize parts that are easier to finish (Laser

34
Marker, Personal Communication, September 13, 2017). The parts that are easier to
complete move along quickly, which leaves the parts that are more difficult to produce get
behind schedule and need to rush to be finished.
4.3 Fishbone Diagram
The fishbone diagram tool was used to breakdown and categorize the potential
causes of the long throughput time. The team identified four main categories influencing
the root cause; environment, equipment, process, and people. The people and the process
categories played significant roles in the potential root cause. Currently, the employee
resources are spread thin throughout the factory. Employees do not have one standard
process that they work on; rather the employees flex throughout the facility depending on
where there is a need. This means that the employees could be working on a different part
of the process each day depending on the production needs. Employees are shared
resources between large and small wheels, and there is no standard written schedule. The
amount of work in the system currently requires a frequent need for overtime. These
factors, as well as the nature of the workforce, plays a role in the employee morale. This
also can influence the throughput time based on injuries and the pace that the employee
works.
Another category that significantly influences the throughput time is the process.
This process has shared resources, so the machines are shared between multiple parts.
Since no machines are dedicated solely to the large resin grinding wheels, these parts enter
long queues. There is no FIFO system that is utilized currently, so parts can sit in the queue
far past their scheduled date. The nonlinear process also plays a role in the increased
throughput time. Since parts have to loop back through multiple steps of the process, the
distance traveled increases, and the amount of parts that are in certain queues. Looking at a
combination of the process and the people, the team identified that there is a lack of
operator accountability for logging the process. This is important because if the process
times are accurately recorded, it is hard for the management staff to understand the nature
of the process. The data that the management is looking at is reliant on whether or not the
operators are following each step of their job at certain times.
35
The other two categories of the fishbone diagram are also significant. The
environment is a fixed commodity and cannot be altered. Since the size of the factory
cannot be changed, any suggestions that are created based on the root cause analysis has to
take this into account. The equipment is also a major component in the cause of the
lengthened throughput time. Equipment in some areas of the production process are out of
date and inefficient to today’s standards. Although there is not a lot of open space to bring
in new machines, it could be useful to update these machines in order to account for out of
date equipment. Each of the categories make up the potential causes for a lengthened
throughput time. By identifying these causes, the team could move forward in identifying
potential solutions and recommendations to reduce the throughput time for the large
wheels. The full fishbone diagram is in Figure 9.

36
Figure 9. Fishbone Diagram.
Lo
ng
T
hro
ug
hp
ut
Tim
e
Pe
op
le
En
vir
on
me
nt
Pro
cess
Eq
uip
me
nt
Em
plo
ye
es
Re
sist
an
t to
Ch
an
ge
Ine
xpe
rie
nce
d
Ne
w E
mp
loy
ee
s
Dif
feri
ng
Em
plo
ye
e/M
an
age
me
nt
Pe
rsp
ect
ive
Hig
h E
mp
loy
ee
T
urn
ov
er
Ra
te
Re
qu
ire
d
Ov
ert
ime
Ma
chin
e L
ay
ou
t
Lim
ite
d
Flo
or
Spa
ceO
ut
of
Da
te
Eq
uip
me
nt
Sha
red
Re
sou
rce
s
Ma
chin
e W
ea
r
Lo
ng
Qu
eu
es,
Do
No
t F
oll
ow
FIF
ON
on
-Lin
ea
r P
roce
ss
Sch
ed
uli
ng
fro
m E
nd
Da
teD
iffe
rin
g E
mp
loy
ee
/Ma
na
gem
en
t P
ers
pe
ctiv
e

37
4.4 Discussion of Production Data
Based on the data collected and the data provided by various resources at Saint-
Gobain, the team was able to develop a better understanding of what was happening in the
process. The production data, which includes the late start log, routing sheet dates, and
travel distances, was analyzed and used to create the value stream maps and the Arena®
models (Rockwell Automation, 2017).
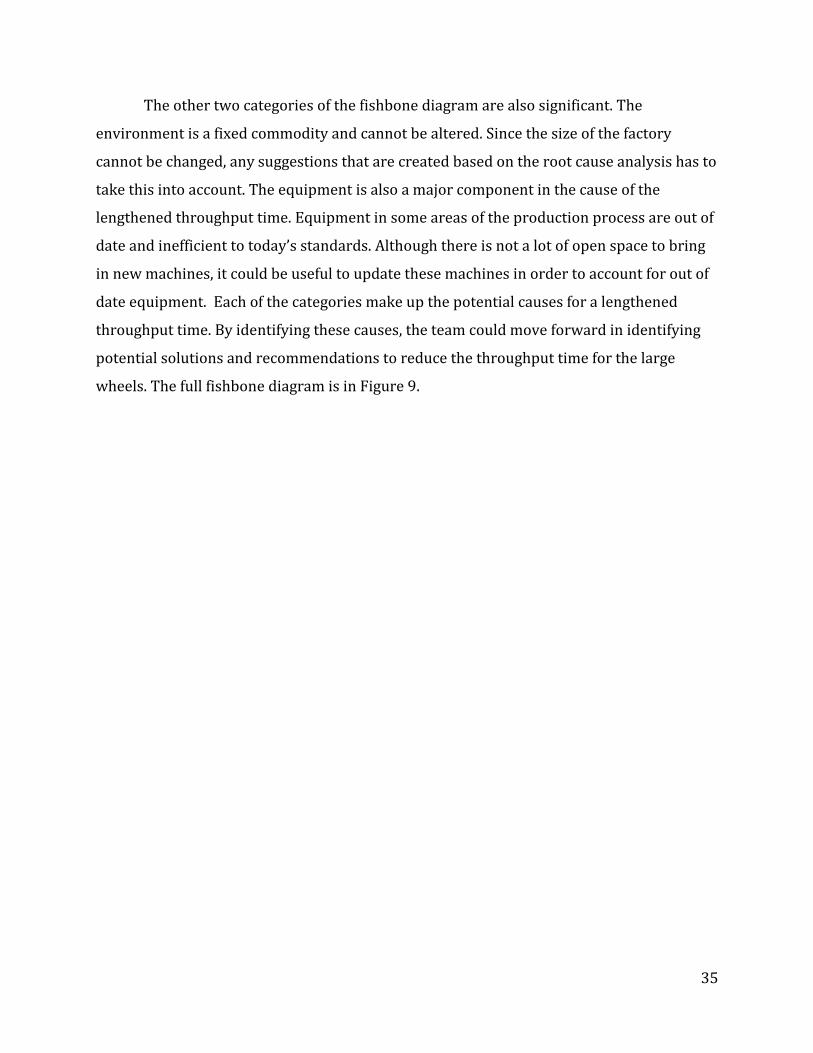
4.4.1 Late Start Log in the Diamond Room
Looking at the start of the process helps to identify if the process is beginning on
time. If the process is not starting on time, it is more likely that the final product will miss
its production deadline. The diamond room is where the production of the superabrasive
grinding wheels begins. Since it is the first step in the production process, it was important
to understand how often and why the orders were late to the diamond room. The team lead
in the diamond room keeps track of late orders in a paper log (Diamond Room ATL
September 15, 2017, Personal Interview). They allowed the team to use the recent
collected data in order to deduce the most common cause for the delayed starts. The
collected information includes:
Scheduled receive date
Actual receive date
Reason for being late (See Figure 10 below)
From mid-August through mid-September, there were 193 late orders. These late
orders are not all DC-30 wheels, and the late log does not specify which order types were
late. Of those 193 orders, 147 orders were released late because the engineers did not
review wheel specifications on time. This is the cause of 76% of the late shop orders. On
average, wheels are 3 days late to the diamond room.
38
Figure 10. Reasons for Orders Arriving Late to the Diamond Room.
4.4.2 Routing Sheet Historical Data
Another great opportunity for data collection was the routing sheets. The team was
provided historical data on the large resin grinding wheels from the past year (Plant
Manager, October 11, 2017, Email Correspondence). The majority of these data points
came in the first and second quarter of 2017. These excel sheets had data about start dates,
run times, and finishing dates. Coupled with this data was data that the team collected from
tracking sheets on the manufacturing floor. The data was collected on multiple days in the
morning, throughout the month of September (Finishing ATL, September 27, 2017,
Personal Interview). Information collected from the tracking sheets included:
Product number
Wheel size
Finish date (the day the wheel is expected to be completed)
Promise date (the latest date the wheel can be completed before the customer may
rescind the order)
Operation description along with that operations scheduled start date and actual
start date
0
20
40
60
80
100
120
140
160
Engineering Late Print Bore Stock Out Unsure
Late Shop Order Reasons
39
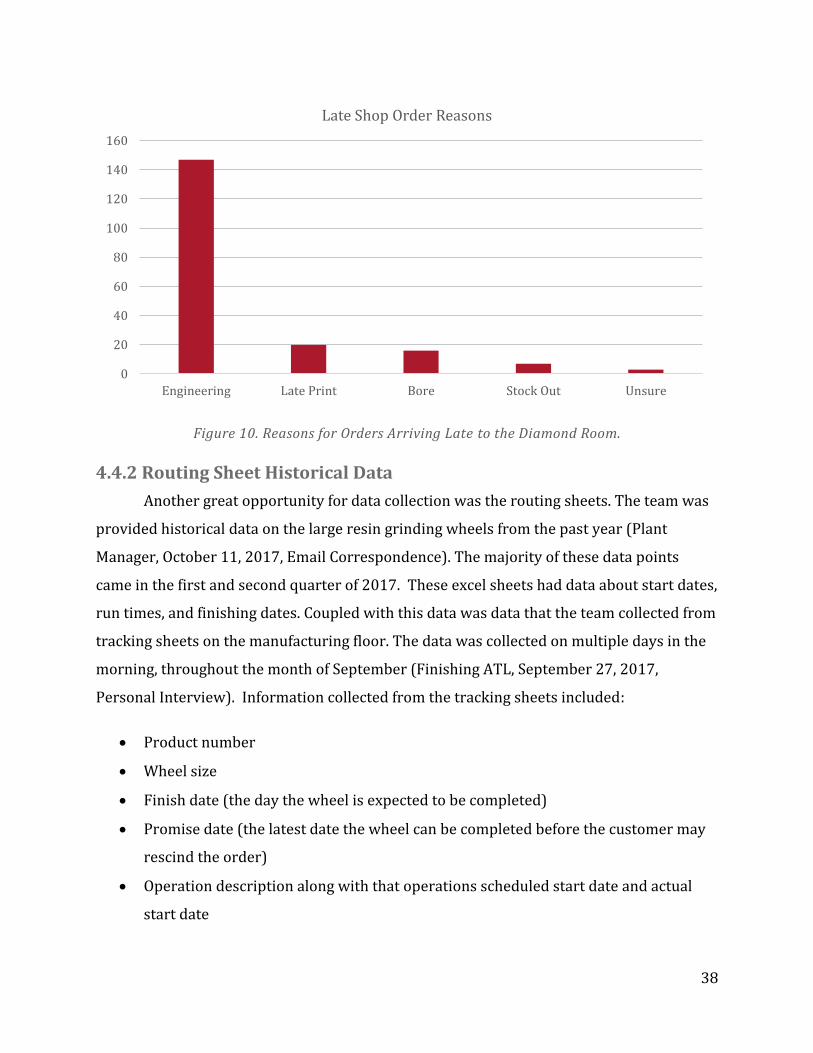
Both types of data were analyzed and averaged to best understand the order and of
the average amount late per operation. Figure 11 below shows the average amount of days
that each operation was late in the large resin grinding wheel-manufacturing process. The
data collected compared the scheduled start dates to the actual start dates on tracking
sheets that were provided to the team, as well as tracking sheets from the production floor.
While these dates are cumulative, the chart still shows that the process ends roughly 8 days
behind schedule, on average. The chart also shows that the process begins, on average, two
days behind schedule.
Figure 11. Average Days Late Per Operation.
Using tracking sheets, as well as production data logged in the manufacturing
software ShopVue, helped the team better understand production time and queue time.
Operators log the start and end times for each step of the process, which can then be used
to generate process times and queue times between steps. The graph below illustrates that
the wheels generally spend significantly more time in the queue than in the cycle,
1.671.93
1.17
4.34
5.64
6.43 6.68
8.55 8.438.94
9.45
8.36
0
1
2
3
4
5
6
7
8
9
10
Average
Average Days Late Per Operation
Issue from Stock Weigh Diamond Weigh and Mix Mold
Bake Side to 0.002 Apply to Assembly Bore to Fit
Cement Side 2 Sides Final Bore Facing

40
indicating that it is mostly wait time contributing to the long lead-time, not the speed of the
processes themselves.
While Figure 12 displays the total production time for twelve recent orders, Figure
13 below breaks down the production time for each step of the process as an average using
data from these orders.
Figure 12. Total Production Time in Days.
As shown in Figure 12, queue times make up a majority of the production time for
eleven of these twelve orders.
5.7 7.3 7.83.6
85.5
2.3 6.410.3
21.714.3 11.3
3.9
28.0
56.8
43.2
40.5
29.7
27.4
33.229.3
22.9
14.1 21.132.0
0.0
20.0
40.0
60.0
80.0
100.0
120.0
1 2 3 4 5 6 7 8 9 10 11 12
DA
YS
ORDER
Total Production Time
Total Days in Cycle Total Days in Queue

41
Figure 13. Average Production Time by Operations in Hours
1
14 16
0 0
13 7 12 9
1
115
94
15
61
2 1 1 0 0
0
49
311
52
00
45
21 80
111
38
5
89
4339
1 0 00
50
100
150
200
250
300
350
Ho
urs
Operation
Average Production Time by Operation
Cycle Hours Average Queue Hours Average

42
It is important to note that the data used in Figures 12 and 13 is based off of only
twelve orders that have been received and processed in the past several months (July 2017
through September 2017), and this small sample size may not be representative of the
entire population. In addition, it should be noted that both of these graphs represents
parent-child orders, so these charts will be representative of the steps in these processes. It
is also important to note that this data was collected by Saint-Gobain and provided to the
team, and the employee who compiled the information informed us that log times are not
always accurate (Production Engineer, Personal Communication, October 25, 2017).
Operators sometimes do not log their work right at the beginning or end of the task, or do
not log their work at all, causing some times to be zero hours. The blank section of the
graphs show this. As both process and queue times are calculated based off these logged
start and end times, any inaccuracies in employee logging would cause the data to be
skewed. For the purpose of these graphs, statistically significant outliers were not
removed.
4.4.3 Distance Between Operations
To gain a better understanding of how and where the wheels are transported
throughout the process, the team observed operators as they transported the wheel from
one operation to the next. A measuring wheel was then then used to track the distance as
the wheel moves through the process. The two colored lines seen below represent two
separate parts of the process. The blue lines represents the steps that the preform mold
goes through before it actually begins. The red lines are the standard steps for the wheel.
Operations 1 and 2 are done in parallel with the blue lines. These two operations come
together and become one process at red point 3. This is seen below in Figure 14. Between
operations 1, 2 and 3 of the red lines, the diamond mix is transported by hand, but once it
becomes a molded part it is exclusively moved by cart until it is packed at the final step.
Based on these numbers, the team observed that the majority of the long distances was by
traveling between repeated processes. The preform mold and the diamond mold each go
between molding and baking twice which accounts for 1,225 feet of the total distance of the
parts traveled, which is nearly 50% of the total distance traveled between both preform
and diamond molds. (Molding ATL, Personal Communication, September 20, 2017). A table

43
of the distances between operations is found in Appendix E. Since the process is not linear
and many machines are shared resources, the part has to travel through the final assembly
process loop twice. By making this a linear process, it would significantly reduce the
amount of time a part travels.

44
Figure 14. Spaghetti Diagram of Travel Distances Between Operations .

45
4.5 Current State Value Stream Map
Using the values that were developed from the observed data, the team created a
current state value stream map. The first step to creating a value stream map is to
construct a flow chart of the current process. The flowchart helps to identify the
movement of the materials through the process. Another benefit of constructing a flow
chart is to identify how parts travel, whether it is by hand, cart, or forklift. Due to the size of
the wheels, the majority of travel between processes is via cart or forklift. The only instance
where things are moved by hand is when it is still in an abrasive mixture state.
The tracking sheets were another tool the team utilized when mapping out the flow
of materials. In addition to using the tracking sheets for mapping the flow, the team used
tracking sheets to collect data for the queue times for different steps in the process. More
information on queue times, delays in the system, and cycle times were collected through
interviews and various spreadsheets provided by the Saint-Gobain management.
Observations from the team as well as the data from the spreadsheets were combined to
create the baseline values that were used on the current state value stream map. The
information displayed on the value stream map was specific to DC-30 large resin grinding
wheels.
The value stream map shows that the large resin grinding wheels have a lead time of
820.6 hours, or approximately 34 days, but the processing time is a mere 96.6 hours. This
leaves approximately 720 hours left for the part to be moving or sitting in a queue. These
numbers were calculated based on averages of values collected from tracking sheets from
the floor, as well as provided production data that was collected through the manufacturing
software ShopVue. Outliers that were statistically significant (α = 0.05) were removed for
the purpose of calculating these averages. The large difference between lead time and
processing time indicates that the wheels are spending most of their time waiting in
queues.
An important factor to note is that since all of the wheels are made to order, they’re
not all manufactured exactly the same way. This value stream map shows a parent-child
wheel in which a preform must be molded and several parts will be cemented together to
46
create the final product. For parent-child assemblies such as this one, the process is
nonlinear, as the weighing and mixing of the diamonds can take place as the preform is
being molded and baked.
Since not all wheels are manufactured the same way, not every wheel will go
through every step of this process, nor will the process times always be the same. For
example, the mix for some wheels needs to age for longer than others before molding, and
sometimes cement curing takes longer than the typical 24 hours. As a result, the values on
this map will not be applicable to every wheel, and therefore, neither will the total lead-
time. These times are averages for the large resin wheel process.

47
Figure 15. Current State Value Stream Map.
0.5
Bake
Pre
form
3.5
Mold
/Pre
ss
Dia
mond
0.5
Bake
0.5
Apply
to
Assem
bly
2
Sid
e t
o 0
.002
1
Bore
to F
it
Raw
Mate
rials
Ware
house
27 h
ours
45 h
ours
15.5
hours
36 h
ours
27 h
ours
48 h
ours
0.5
hours
52
hours
0.7
hours
72 h
ours
0.5
hours
70 h
ours
96.6
hours
724 h
ours
4 h
ours
Dia
mond (
every
day)
Suppliers
(2
5
regula
r,
100 tota
l)
Custo
mers
Pro
duction C
ontr
ol
2x d
aily
Fin
ished G
oods
Invento
ry
Ship
pin
g
Alu
min
um
/Ste
el (3
x w
eek)
Resi
n (
1x m
onth
)
3.5
Pre
form
Mold
ing
13 h
ours
48 h
ours
4
Mix
D
iam
ond
CT =
0.9
hours
Shifts
= 1
.5
Machin
es
= 0
1 h
our
49
hours
2
Weig
h
Dia
mond
0.9
hours
96 h
ours
WIP
1
Fin
ish B
ore
2
Face
1
Mark
3
Pack
1 h
our
48
hours
2 h
ours
34 h
ours
0.7
hours
8 h
ours
0.9
hours
20 h
ours
1 h
our
0.7
hours
0.4
hours
8 h
ours
1
OD
Gri
nd
1 h
our
24
hours
2
Sid
e 2
Sid
es
0.5
hours
24
hours
4
Cem
ent
3 h
ours
38 h
ours
CT =
1 h
our
Shifts
= 1
.5
Machin
es
= 0
CT =
13 h
ours
Shifts
= 2
Machin
es
= 8
pre
sses
CT =
18 h
ours
Shifts
= 0
.5
Machin
es
= 6
CT =
15.5
hours
Shifts
= 2
Machin
es
= 8
pre
sses
CT =
18 h
ours
Shifts
= 0
.5
Machin
es
= 6
CT =
0.5
hours
Shifts
= 0
.5
Machin
es
= 0
CT =
0.7
hours
Shifts
= 2
Machin
es
= 1
CT =
0.5
hours
Shifts
= 1
Machin
es
= 1
CT =
3 h
ours
Shifts
= 2
Machin
es
= 1
CT =
0.5
hours
Shifts
= 2
Machin
es
= 1
CT =
1 h
our
Shifts
= 1
Machin
es
= 1
CT =
0.9
hours
Shifts
= 2
Machin
es
= 0
CT =
0.7
hours
Shifts
= 1
Machin
es
= 1
CT =
1 h
our
Shifts
= 1
Machin
es
= 1
CT =
2 h
ours
Shifts
= 1
Machin
es
= 2
CT =
1 h
our
Shifts
= 1
Machin
es
= 1
CT =
0.4
hours
Shifts
= 1
.5
Machin
es
= 0
WIP
WIP
WIP
WIP
WIP
WIP
WIP
WIP
WIP
WIP
WIP
WIP
WIP
WIP
WIP
Check
s P
rinte
d (
once
per
day in t
he
morn
ing)
0.5
Inspection
0.5
Bala
nce/O
il
WIP

48
4.6 Future State Value Stream Map The purpose of developing a future state value stream map is to identify realistic
goals and improvements that can be made based on the current state (Plenert, 2012, p.
187). The current state combined with reasonable ideas based on the resources of the
company and lean tools equals the future state (Storch 2010). The first step is to create
several action items to focus on, taking into consideration factors such as implementation
difficulty, cost, time span, and overall impact on the process (Locher, 2008). These changes
typically include things such as reducing the cycle time, reducing the number of steps in the
process, improving quality, changing scheduling, and introducing kanbans (Abdulmalek &
Rajgopal, 2007). These kanbans are visual signals to evoke an action. Lastly, in order to
update the current state value stream map to a future state value stream map, values are
updated (such as process or queue times), and kaizen bursts are added to highlight specific
areas in the process where changes should be made. These kaizen bursts are rapid
improvement efforts to remove waste from the system. After the future state is completed,
the team compared the overall process times between the current state and the future state
to calculate the percent reduction in overall lead-time.
For the future state value stream map for Saint-Gobain, we chose to focus mainly on
reducing queue times. The team understood that reducing process times is outside the
scope of this project because it would most likely require new machinery or entirely new
production methods. Also, based on the complexity of the wheels and the fact that not all
wheels go through the exact same steps to be manufactured, the team chose not to focus on
changing the number of steps in the process either. Instead, a majority of the current state
queue times were significantly longer than they needed to be, while others were too short,
causing the process to get further behind. These discrepancies in process time cause the
required time between steps to be different from what is scheduled. In terms of kaizen
events, it is important to increase operator accountability for logging their work times
throughout all steps of the process, as well as increase accountability for working by FIFO.
Specifically to baking, the team suggested that the ovens run more often, even when the
ovens are not completely full.

49
Based on the future state recommendations, the new processing time would remain
96.6 hours, and the queue time would be 228 hours, for a total time of 324.6 hours, or
13.53 days. This is a 60.44% overall decrease from the current state. See Figure 16 for a
copy of the future state value stream map.

50
Figure 16. Future State Value Stream Map
0.5
Bake
Pre
form
3.5
Mold
/Pre
ss
Dia
mond
0.5
Bake
0.5
Apply
to
Assem
bly
2
Sid
e t
o 0
.002
1
Bore
to F
it
Raw
Mate
rials
Ware
house
27 h
ours
10.5
hours
15.5
hours
12 h
ours
27 h
ours
24 h
ours
0.5
hours
11.5
hours
0.7
hours
7 h
ours
0.5
hours
5.5
hours
96.6
hours
228 h
ours
4 h
ours
Dia
mond (
every d
ay)
Suppliers
(2
5
regula
r,
100 tota
l)
Custo
mers
Pro
duction C
ontr
ol
2x d
aily
Fin
ished G
oods
Invento
ry
Ship
pin
g
Alu
min
um
/Ste
el (3
x w
eek) R
esin
(1x m
onth
) 3.5
Pre
form
Mold
ing
13 h
ours
36 h
ours
4
Mix
D
iam
ond
CT =
0.9
hours
Shifts
= 1
.5
Machin
es
= 0
1 h
our
0.5
hours
2
Weig
h
Dia
mond
0.9
hours
36 h
ours
WIP
1
Fin
ish B
ore
2
Face
0.5
Bala
nce/O
il
0.5
Inspection
1
Mark
3
Pack
1 h
our
12
hours
2 h
ours
7 h
ours
0.7
hours
3 h
ours
0.9
hours
14 h
ours
1 h
our
0.5
hours
0.4
hours
5 h
ours
1
OD
Grind
1 h
our
12
hours
2
Sid
e 2
Sid
es
0.5
hours
24 h
ours
4
Cem
ent
3 h
ours
3.5
hours
CT =
1 h
our
Shifts
= 1
.5
Machin
es
= 0
CT =
13
hours
Shifts
= 2
Machin
es =
8 p
resse
s
CT =
18
hours
Shifts
=
0.5
Machin
es =
6
CT =
15.5
hours
Shifts
= 2
Machin
es =
8 p
resse
s
CT =
18
hours
Shifts
=
0.5
Machin
es =
6
CT =
0.5
hours
Shifts
=
0.5
Machin
es =
0
CT =
0.7
hours
Shifts
= 2
Machin
es =
1
CT =
0.5
hours
Shifts
= 1
Machin
es =
1
CT =
3
hours
Shifts
= 2
Machin
es =
1
CT =
0.5
hours
Shifts
= 2
Machin
es =
1
CT =
1 h
our
Shifts
= 1
Machin
es =
1
CT =
0.7
hours
Shifts
= 1
Machin
es =
1
CT =
0.9
hours
Shifts
= 1
Machin
es =
0
CT =
1 h
our
Shifts
= 1
Machin
es =
1
CT =
2
hours
Shifts
= 1
Machin
es =
2
CT =
1 h
our
Shifts
= 1
Machin
es =
1
CT =
0.4
hours
Shifts
= 1
.5
Machin
es =
0
WIP
WIP
WIP
WIP
WIP
WIP
WIP
WIP
WIP
WIP
WIP
WIP
WIP
WIP
WIP
Checks
Pri
nte
d
(tw
ice p
er
day –
morn
ing a
nd
aft
ern
oon) In
cre
ase o
pera
tor
accounta
bility for
loggin
g w
ork
Ensure
FIF
O is
follow
ed
Bake few
er
wheels
m
ore
oft
en
WIP

51
4.7 Backwards Scheduling
The current scheduling process that Saint-Gobain uses is backwards scheduling. In
this process, the program starts with the anticipated date of completion for the order and
then works backwards through all the steps in the process at the end of the program, the
late start of the order is calculated. However, the program does not calculate the early start
date, or the earliest day that the order can be started. Therefore, there are a certain amount
of days that are wasted because production will start on the late start and not the early
start (see an example in Appendix F). In this example, you can see that there are 6 unused
and wasted days in the beginning of the process.
Backwards scheduling works by starting at the final operation with the promised
completion date. Then, the preceding operation’s start time is calculated by looking at
when the following operation begins and subtracting the duration of the operation. This
process continues until the beginning of the schedule, where the latest start and finish
times are calculated. Forwards scheduling works by starting the first operation at day 0,
right when the order is placed. Then, the following operation would begin once the
previous operation was completed, and so on until the end of the process. If there were any
operations going on simultaneously, the following operation would start once the longest
operation was completed. Therefore, at the end, the process will begin and end on the
earliest date possible (see Figure 17 below).

52
Figure 17. Backwards vs. Forward Scheduling. Source: (Basics of Supply Chain Management.
Version 2.1, August 2001).
After speaking with the Manufacturing Manager, some insight was gained as to the
specific areas of the schedule that are creating these delays. The first source of delay is the
printing of the order checks. After the orders are received from the customers, it takes
about 2 days until the checks are printed, as checks are only printed once per day in the
morning at 5 AM, and are then distributed to the floor at 10 AM. Furthermore, once the
checks are printed, it takes an additional 2 days until production of the order actually
begins. If the checks were printed immediately and production began the day after checks
were printed, this change alone would save 3 days on the front end of the production
schedule.
Another issue with the scheduling stems from the fact that the automated system
that produces the schedule for each wheel sometimes is not accurate. For example,
scheduling Side to 0.002 one working day after Baking is not always realistic, because
baking can take anywhere from 16 to 37 hours; however, the automated system does not

53
account for this range and will always schedule Side to .002 for the next day. The
scheduling system also assumed unlimited resources, which frequently causes issues in
Molding, as they only have 8 presses to mold in. Molding generally takes a full day, and
scheduling more wheels to be molded per day than the number of presses available creates
a significant bottleneck. Additionally, some orders require multiple of the same wheel to be
made then cemented together, but typically there is only one mold for each size so it is not
realistic to mold multiple of the same wheel in one day. By generating unrealistic queue
and production times, it’s nearly impossible not to get behind. On the other hand, there is
usually a full day allotted between Weigh Diamond and Weigh & Mix, even though Weigh &
Mix could theoretically happen immediately after Weigh Diamond. This adds unnecessary
wait time.
4.8 Arena® Model
Arena® is a versatile simulation software that enables manufacturing organizations
to increase their throughput time, identify process bottlenecks, improve logistics, and
evaluate potential process changes (Elam, Anderson, Lamphere, & Wilkins, 2011). Arena®
allows users to model and analyze process flow, packaging systems, job routing, inventory
control, warehousing, distribution, and staffing requirements. The primary reason we are
utilizing Arena® as a program is because it allows the test of new process alternatives that
have a potential to contribute to increased throughput, reduced work in progress,
elimination of bottlenecks, and the optimization of resource utilization.
Arena® is relatively simple software to use and allows users to customize
parameters such as resources available, workers schedules, hours of operations, materials,
route hours, among other useful factors. These features have the ability to provide Saint-
Gobain with valuable insight on how to pursue making changes to the current state
operations without incurring the cost or risk associated with the physical implementation.
Additionally, simulation modeling has the ability to provide production planners insight
into forecasting and planning. After running an Arena® model, results and specific
performance measures, such as queue time, value added vs. non-value added time, transfer
time, machine utilization, and average total time, are displayed for analysis.

54
While there are many different ways to represent a model in Arena® software, we
chose to use the Basic Process panel because it provides the highest level of modeling. The
Basic Process Panel allows the creation of high-level models in a quick and easy way. The
basic building blocks for Arena® modules are called modules and there are two kinds:
flowchart and data. We used a combination of the Create, Separate, Process, Batch, and
Dispose flowchart modules because they allow a great deal of flexibility and provide all the
detail required for a simulation project. The data modules we used were Entity, Resource,
Schedule, and Set. In Figure 18 below, you can see what shape is corresponded with each
flowchart module.
Figure 18. Modules of Basic Process Panel in Arena®.
Each Arena module is parametrized by associated dialog boxes. Descriptions for each
module that we used from the Basic Process panel is as follows:
Create Module: Generates a stream of arrivals of Arena® entities (jobs,
people, messages, etc.)
Dispose: Entities that enter it are simply discarded
Process: Processes Arena® entities
Separate: Has a feature call Duplicate Transaction, where is creates a
duplicate of itself
Entity: Can see and edit aspects of the entities in a model
Resource: Allows determination of characteristics of each Resource in a
model, such as whether its capacity is fixed or varies according to a schedule
Schedule: Ability to set schedules for individual operators or machines
Set: Ability to group machinery and use shared resources across operations

55
The Create module is known as the “birth” node for arrival of entities to a model’s
boundaries. In terms of our model, the Create module simulates an order for a large resin-
grinding wheel being placed. The new order then moves into a Separate module, where the
entity is duplicated and split into both a wheel and a preform process. After this, the wheel
and preform move into their respective operations.
The team used the same data given to us for the value stream maps to create the
simulation model. Each Process module reflects probability distribution calculated for each
individual operation. It also takes into account the number of machines and/or operators
for that operation, in addition to shift schedules. The model is able to recognize shared
resources, so it takes into account that preforms and wheels both utilize the ovens and
presses.
Figure 19 and Figure 20 show our Current State Arena® Model and our Future State
Arena® Model, respectively. The major difference between our current state and future
state models is the removal of the preform operations. With the future state model, we
operate under the assumption that preforms can begin to be issued from stock instead of
created when an order is placed.
The output from our current state model indicated that the total output for 90 days
is 70 wheels, with a single wheel taking 758 hours to be completed. The future state model
had improved output, with 77 wheels created in 90 days, and a single wheel taking 737
hours to complete. This increases production by 10% in addition to reducing the amount of
hours it takes to produce a wheel. The current state model indicates that after a wheel goes
through the “Weigh Diamond” operation, the queue for “Preform Molding” is approximately
375 hours. It’s clear from the simulation that issuing preforms from stock has the
opportunity to reduce the throughput time by quite a lot of time, because a wheel cannot
move into pressing and molding the diamond until the preform is ready.
A separate change that was made to the current state map is reducing the amount of
wheels an oven needs to have before running it. When the model was changed to reduce
oven capacity from 20 wheels to 10, there was a 7% increase in production, with 75 wheels
being produced in 90 days. The utilization of the ovens went from an average of 28% to an
56
average of 51%, which means the ovens were being used more, and were able to help
increase production of large resin grinding wheels.
Issuing preform from stock and running the ovens more often is just a few examples
of the power that Arena® has when simulating potential changes to a process. With
additional data, such as data collected over the course of a year, it would be possible to
build an even more accurate model that would have the ability to analyze and test several
bottlenecks that cause severe congestion in different areas on the production line. Having
operators indicate the time as well as the date that they complete an operation will lead to
better statistical analysis for future simulation modeling. Purchasing a commercial license
for a simulation software such as Arena® would be a worthwhile investment for testing
changes to the current state process.

57
Figure 19. Current State Arena® Model.

58
Figure 20. Future State Arena® Model.

59
4.9 Financial Analysis
To analyze the financial impact of the recommendations for Saint-Gobain, the team
considered the improvement of the throughput time, as well as areas for capital investment
opportunities. Based on recommendations regarding scheduling and reduction of queue
times, it is expected that the manufacturing process will be completed 60% faster on
average.
Since all of the large resin wheels Saint-Gobain manufactures are made-to-order,
each wheel has its own unique cost to manufacture, as well as its own selling price. The
team was provided with data for all large resin sales that were sold in 2016 and through
October 2017, including the sale price, the cost of manufacturing, and profit. The profit for
these orders ranges from -$22,000 to $26,000 and each order consisted of 1-5 wheels; in
total, 819 wheels were sold in 2016. There are several reasons why the profit margin is
oftentimes negative; wheels are sometimes given to customers for free to compensate them
for production issues, as a replacement for recalled products, or for evaluation purposes.
Based on the proposed reduction in cycle time between the current state value
stream map and the future state value stream map, the calculated increase in production is
shown in Equation 1 and Equation 2:
𝐼𝑛𝑐𝑟𝑒𝑎𝑠𝑒 𝑖𝑛 𝑃𝑟𝑜𝑑𝑢𝑐𝑡𝑖𝑜𝑛 = [(𝐶𝑢𝑟𝑟𝑒𝑛𝑡 𝑃𝑟𝑜𝑑𝑢𝑐𝑡𝑖𝑜𝑛)
100% − 𝑅𝑒𝑑𝑢𝑐𝑡𝑖𝑜𝑛 𝑖𝑛 𝐿𝑒𝑎𝑑 𝑇𝑖𝑚𝑒] − 𝐶𝑢𝑟𝑟𝑒𝑛𝑡 𝑃𝑟𝑜𝑑𝑢𝑐𝑡𝑖𝑜𝑛
Equation 1 Formula to Calculate Increase in Production Volume.
𝐼𝑛𝑐𝑟𝑒𝑎𝑠𝑒 𝑖𝑛 𝑃𝑟𝑜𝑑𝑢𝑐𝑡𝑖𝑜𝑛 = [819 𝑤ℎ𝑒𝑒𝑙𝑠 𝑝𝑒𝑟 𝑦𝑒𝑎𝑟
100% − 60%] − 819 =
1228
𝑦𝑒𝑎𝑟
Equation 2. Calculated Increase in Production Volume.
With an average of an additional 409 wheels able to be manufactured each year, if
customers’ orders were increased due to the increased capacity for production, the
company could expect an increase in profit of approximately $409,000 annually. This is
based off the average profit of all wheels sold in 2016, which was calculated to be
approximately $1,000 per wheel. This accounts for wheels sold at a loss for promotional
purposes.

60
𝑃𝑜𝑡𝑒𝑛𝑡𝑖𝑎𝑙 𝐼𝑛𝑐𝑟𝑒𝑎𝑠𝑒 𝑖𝑛 𝑃𝑟𝑜𝑓𝑖𝑡 = 𝐼𝑛𝑐𝑟𝑒𝑎𝑠𝑒 𝑖𝑛 𝑃𝑟𝑜𝑑𝑢𝑐𝑡𝑖𝑜𝑛 ∗ 𝐴𝑣𝑒𝑟𝑎𝑔𝑒 𝑃𝑟𝑜𝑓𝑖𝑡 𝑝𝑒𝑟 𝑊ℎ𝑒𝑒𝑙
Equation 3. Calculated Increase in Production Volume.
𝑃𝑜𝑡𝑒𝑛𝑡𝑖𝑎𝑙 𝐼𝑛𝑐𝑟𝑒𝑎𝑠𝑒 𝑖𝑛 𝑃𝑟𝑜𝑓𝑖𝑡 = 409 𝑚𝑜𝑟𝑒 𝑤ℎ𝑒𝑒𝑙𝑠 𝑝𝑒𝑟 𝑦𝑒𝑎𝑟 ∗ $1,000 𝑎𝑣𝑒𝑟𝑎𝑔𝑒 𝑝𝑟𝑜𝑓𝑖𝑡 =$409,000
𝑦𝑒𝑎𝑟
Equation 4. Calculated Increase in Production Volume.
Current Production 819 wheels/year
Reduction in Cycle Time 60%
Increase in Production 409 wheels/year
Profit $1,000 per wheel
Increase in Profit $409,000 per year
Table 1. Expected Increase in Production & Profit
Saint-Gobain does have a specific amount allocated in their budget each year to be
used for capital investment, and the company is planning to purchase a CNC machining
center and a grinding machine in the near future. Each machine will cost between $500,000
and $750,000, depending on the features of the machine. While it is unknown at this time
where in the production process the machines will be used or what current machinery they
may end up replacing, the goal of the new equipment is to reduce lead-time (Capital
Purchasing Engineer, Personal Communication, November 15, 2017).
In order to understand the financial impact of this investment, the following
estimates were developed. These estimates are based off the following assumptions:
The cost for both machines will be approximately $1,250,000. This assumes
that both machines are purchased at the midrange of the two price points
that were provided, or $625,000 each.
The estimated increase in annual profit is $409,000. It’s assumed that this is
due to the reduced lead time that may lead to an increase in sales.
Acquisition, installation, and startup costs are accounted for in the total cost
of the machinery.
61
There will not be any maintenance costs for the machinery, and that the
potential earnings generated by the proposed increase in production remains
constant each year.
Using a minimum acceptable rate of return of 8%, which is commonly used for the
purchase of new manufacturing equipment, the discounted payback period was calculated
as follows in Equation 5:
Present Worth of Cost = -$1,250,000 + $409,000(F/P, 8%, n)
n = 5 years = -$1,250,000 + $409,000(1.469) = -$649,179
n = 10 years = -$1,250,000 + $409,000(2.159) = -$366,969
n = 15 years = -$1,250,000 + $409,000(3.172) = $47,348
Equation 5. Formula to Calculate Present Worth.
As the present worth becomes a positive value between 10 and 15 years, the
breakeven point falls within this period. Using the Excel function NPER as shown in
Equation 6, the exact period in years can be calculated.
=NPER(interest_rate, payment, present_value, future_value)
=NPER (8%, 0, $409000, $1250000) = 14.516 years
Equation 6. Formula to Calculate Number of Periods for an Investment in Excel
As seen in Equation 6, the discounted payback period for the investment is
approximately 14.5 years. This aligns with the present worth cost calculation, with the
breakeven point falling between 10 and 15 years.

62
Figure 21. Cash Flow Analysis.
With this $1,250,000 capital investment purchase and an expected increase in profit
of $409,000 annually, it would take approximately 14.5 years for Saint-Gobain to break
even with the purchase, as shown in Figure 18. While the upfront cost of the investment is
very high compared to their yearly revenue, the cost has been accounted for in Saint-
Gobain’s annual budget, and will be further justified by this expected increase in profit.
-$1,000,000
-$800,000
-$600,000
-$400,000
-$200,000
$0
$200,000
$400,000
$600,000
$800,000
1 2 3 4 5 6 7 8 9 10 11 12 13 14 15 16 17 18 19 20
Years
Discounted Payback Period

63
Chapter 5: Recommendations Once the data collection, analysis of the observations, and results occurred, the team
was able to develop key recommendations for Saint-Gobain to implement after the
completion of this project. When implemented, these recommendations will aid in the
reduction of the throughput time for the large resin grinding wheels. There are two main
recommendations as well as some additional minor recommendations that can benefit
Saint-Gobain. The following table summarizes these recommendations.
Recommendation Summary
Restructure Production Schedule Switch from a backwards scheduling method
to forwards scheduling
Increase Frequency of Running Ovens
Run the ovens even if they are not completely
full in order to get wheels through the process
at a faster rate
Issue to Stock Preform Molds
Keep the preform molds with the highest
demand in stock in order to eliminate the
need to mold the preform at the beginning of
the process.
Restructure Employee Work Schedule Have a full second shift and implement
written work schedule
Replace Old Machines and Reorganize
Floor Plan
Utilize capital investment budget to replace
outdated machines and reorganize Large Bay
Increase Safety Protective barrier and better signage around
the hot wheels in molding room
Table 2. Summary of Recommendations.
64
5.1 Restructure Production Schedule
One major recommendation for Saint-Gobain is to restructure the scheduling of the
grinding wheel production. Currently, Saint-Gobain is using backwards scheduling, which
produces a late start production date. The backwards scheduling results in a loss of days on
the front end, meaning the wheel is not started in production as soon as it is ordered. The
team recommends that Saint-Gobain use a forward scheduling program to utilize these
days, which will better meet the customer’s demand. This will not increase the lead-time
for the customer, as the goods issue date of the wheel will not change. Rather it will give
Saint-Gobain a better chance of meeting the original promise date.
5.2 Bake Fewer Wheels More Often
Currently, the ovens are only turned on to bake once they are full. Each oven can fit
about 20 wheels, and the wheels will sit in the ovens until they are full and ready to bake.
The ovens are initially turned on around 2:00PM and emptied around 3:00AM two days
later. These parts must be cooled before they are removed from the oven. Some parts are
extremely thin and must be held in traps, which need a longer cool time before they are
removed. When these parts are finally cooled and removed (around 4 hours later), the
parts are removed and either sent back to molding (if it was a preform mold) or sent on to
finishing. These subsequent processes cannot handle the influx of parts to the system, and
the process will become a bottleneck. If the ovens were to be run without being full, it could
reduce the amount of hours wasted waiting for the oven to fill, and could create less of a
bottleneck for the operators in finishing and molding.
5.3 Stock Commonly Used Preform Molds In order to reduce the time spent waiting for preform molds to be finished, the most
commonly used preforms could be manufactured in large quantities and kept in stock. In
2016, wheels made using the top three most common preforms accounted for 11% of sales
revenue.
Currently, the preforms take 3 days to complete. There are potential delays that can
occur in this process, particularly in waiting for the preform mold to bake. If there is a
delay, the production of the wheel cannot move forward past the weighing and mixing of
65
the diamond until the preforms are finished. Based on the current scheduling method,
molding the preform can add up to 5 days to the overall lead-time. If the mold/press
operators could take a preform from stock, the 3 days spent creating the preform and the
queue days could be eliminated, and the operators could continue the production of the
wheel immediately.
5.4 Restructure Employee Work Schedule
The fourth recommendation is to add a full second shift of employees, opposed to
the one and a half shifts that Saint-Gobain has now. Through conversations with employees
and managers, the team has determined that some of the key bottleneck locations do not
have as many operators as needed in order to meet demand. By increasing the number of
employees working on these operations, Saint-Gobain can reduce the bottleneck processes.
Furthermore, the team recommend the implementation of a written schedule to keep track
of what employees are working at which station, and how many employees are needed per
process. This will help determine where the employee is needed, and will allow for
flexibility within each shift to account for bottlenecks. Another recommendation is that
another employee be assigned to turn preform molds, as conversations with the Molding
Team Lead indicate that getting preform molds turned on time is a bottleneck (Molding
ATL, Personal Communication, September 20, 2017).
5.5 Utilize Capital Investment Budget
The fifth recommendation is that Saint-Gobain should use their capital investment
budget to replace old machines and reorganize floor space. Much of the technology in the
superabrasives plant is out of date. This equipment needs improvements. After speaking
with the Capital Purchasing Engineer, the team believes it could be useful to consider new
machines that can do two or more different jobs. Multi-functional machines would be
beneficial because there is limited floor space. Additionally, reorganizing the large bay
room and improving the technology in it with a tower storage system could reduce the
amount of time operators spend moving the wheel around the room (Capital Purchasing
Engineer, Personal Communication, October 4, 2017).

66
The Capital Purchasing Engineer also pointed out that Saint-Gobain has automated
mixing in some other processes. It could be beneficial to implement this process to the
superabrasives at this site in order to improve both the quality and process speed. (Capital
Purchasing Engineer, Personal Communication, October 4, 2017.
5.6 Increase Safety
The final recommendation for Saint-Gobain is regarding safety concerns. The team
observed that wheels cooling in the molding room are left in open areas, exposing
employees working in the area to a potential burn hazard. While only one burn has been
reported in this area in the past three years, there may be more unreported instances
(Safety Engineer, Email Correspondence, November 14, 2017). This one reported incident
was categorized as a TF3 incident, meaning that on-site first aid was recommended. Based
on the incident report, it does appear that the cause of the burn was a lack of protective
barrier between the operator working near the mold and the hot mold itself. Solutions to
this safety concern can include things such as warning signs or a physical barrier around
the hot wheels.

67
Chapter 6: Conclusion The team worked with Saint-Gobain personnel with the goal of reducing the total
lead-time for the large resin superabrasive grinding wheels by identifying opportunities for
process improvement. By identifying methods to reduce bottlenecks, or rate limiting steps,
the grinding wheel production process can become more efficient. With an axiomatic
design decomposition, data analysis from production data spreadsheets, as well as
operator and manager interviews, the team was better able to understand the cause of the
bottlenecks. In addition, the team used several lean tools including fishbone diagrams,
spaghetti diagrams, and value stream maps to verify the current state of the company and
identify the biggest opportunities for improvement.
The results showed that due to the nature of the business, certain inefficiencies are
created when generating the production schedule. Each of the wheels are different sizes
and, therefore, require different process times, making it difficult to create a level schedule.
The use of a future state value stream map and Arena® simulation model helped identify
these rate-limiting steps and provide recommendations based on changing different
variables in the current process. By implementing these recommendations, Saint-Gobain
should be able to focus their efforts and implement changes on processes that have been
identified as having the biggest opportunities for improvement.
There are a few different conclusions that are drawn from the above analysis. If
backwards scheduling is continued to be used for the large resin wheels, then the parts will
continue to be late. The current system allows for much time to be lost at the beginning of
the process and does not account for long queue times later in the system. Making
modifications to the system of scheduling could benefit Saint-Gobain in the end in order to
meet the delivery dates that are promised to their customers.
In addition, the baking process currently is the longest process, taking more than
two days to complete. One option Saint-Gobain could try to mitigate this time wasted is to
bake less wheels more often. This could mean running the machines more often but not at
full capacity. Another option Saint-Gobain has is stocking the most commonly used preform
molds. By stocking these preform molds, this eliminates a molding and baking step from

68
the operations subsequently reducing up to 5 days in the lead time, which can be allocated
to a different part of the process. Different scenarios are simulated using the Arena®
software to understand which might provide the shortest throughput time.
Based on these conclusions, the team conducted a financial analysis for the
company. By reducing the throughput time, there is a possible increase in sales revenue of
$460,000 per year. By implementing the changes recommended by the project team, Saint-
Gobain could potentially cut their lead-time on many products by 60%. This offers major
savings to the company in the end.
69
References
Abdulmalek, F. A., & Rajgopal, J. (2007). Analyzing the benefits of lean manufacturing and
value stream mapping via simulation: A process sector case study. International
Journal of Production Economics, 107(1), 223-236. doi:10.1016/j.ijpe.2006.09.009
About Norton. (2014). Retrieved from http://www.nortonabrasives.com/en-us/about-
norton
Ammerman, M. (1998). The Root Cause Analysis Handbook. Portland, Or: Productivity, Inc.
Retrieved from http://www.books24x7.com/marc.asp?bookid=4443
Andersen, B., & Fagerhaug, T. (2006). Root Cause Analysis: Simplified Tools and Techniques
(2nd ed.). ASQ Quality Press.
Borgianni, Yuri, and Dominik T. Matt. “Axiomatic Design and TRIZ: Deficiencies of Their
Integrated Use and Future Opportunities.” Procedia CIRP, vol. 34, 2015, pp. 1–6.,
doi:10.1016/j.procir.2015.07.002.
Bradley, J.R., and BEP eBooks. (2014). Improving business performance with lean (1st ed.).
New York, NY;: Business Expert Press.
Capital Purchasing Engineer. (2017, October 4). Personal Interview
Diamond Room ATL. (2017, September 15). Personal Interview
Elam, M., Anderson, D., Lamphere, J., & Wilkins, B. (2011). Process Improvement Using
Arena Simulation Software. International Journal of Business, Marketing, and
Decision Sciences, 4(1). Retrieved November 14, 2017.

70
El-Haik, B. (2005). Axiomatic Quality: Integrating Axiomatic Design with Six-Sigma,
Reliability, and Quality Engineering. John Wiley & Sons, Incorporated.
Feld, W. M., & ENGnetBASE. (2001;2000;). Lean manufacturing: Tools, techniques, and how
to use them (1st ed.). Alexandria, VA;Boca Raton, FL;: St. Lucie Press.
Finishing ATL. (2017, September 27). Personal Interview
Imaoka, Z. (2012). Understand Supply Chain Management Through 100 Words. Japan:
KOUGYOUCHOUSAKAI.
Jackson, B. (2012). Seven Wastes. Retrieved from
http://results.wa.gov/sites/default/files/The%207%20Wastes_1.pdf.
Krar, S. F. (1995). Grinding Technology. Albany: Delmar Publishers.
Laser Marking. (2017, September 13). Personal Interview
Law, J. (Ed.). (2016). A Dictionary of Business and Management (6th ed.). Oxford University
Press.
Linke, B. (2016). Superabrasives. CIRP Encyclopedia of Production Engineering, 1174-1180.
Retrieved November 14, 2017.
Lewis, K. B. (1951). The Grinding Wheel: A Textbook of Modern Grinding Practice. Concord,
N. H: Printed by the Rumford Press.
Locher, D. A. (2008). Value stream mapping for lean development : A how-to guide for
streamlining time to market. Portland: CRC Press. Retrieved from
http://lib.myilibrary.com?ID=137248

71
Manufacturing Manager. (2017, October 5). Personal Interview
Molding ATL. (2017, September 20). Personal Interview
Nash, M. A., & Poling, S. R. (2008). Mapping the Total Value Stream : A Comprehensive
Guide for Production and Transactional Processes. Portland: CRC Press.
Norton Company. (1951). Lectures on Grinding, Abrasives, Machines, Methods. Worcester,
Mass: The Company.
Norton Saint-Gobain. (2014). Retrieved from https://www.saint-gobain-
northamerica.com/business/brands/norton
Plant Manager. (2017, October 11). Email Correspondence
Plenert, G. J. (2012). Lean Management Principles for Information Technology. Boca Raton,
FL: CRC Press.
Production Engineer. (2017, October 25). Email Correspondence
Production Scheduler (2017, October 5). Personal Interview
Production Scheduler (2017, November 8). Personal Interview
Quality Engineer. (2017, October 6). Personal Interview
Rockwell Automation. “Arena (computer software).” 2100 Corporate Drive, Suite 550,
Wexford, PA, 2017.
Safety Engineer. (2017, November 14). Email Correspondence
72
Saint-Gobain (2014). Retrieved from https://www.saint-
gobain.com/en/group/our-history
Saint-Gobain Abrasives. (2017). Our Products. Retrieved from http://www.saint-gobain-
abrasives.com/en-us/products
Saint-Gobain in North America. (2014). Retrieved from https://www.saint-gobain-
northamerica.com/company/saint-gobain-north-america
Sohlenius, G. (1998). Axiomatic Design and Manufacturing Systems Design. Retrieved from
https://www.ielm.ust.hk/dfaculty/ajay/courses/ieem513/Design/AxiomDes.html
Storch, R. L. (2010). Value stream mapping. Retrieved from
http://courses.washington.edu/ie337/Value_Stream_Mapping.pdf
Suh, N. P. (1990). The Principles of Design. New York: Oxford University Press.
Suh, N. P., & Do, S. (2000). Axiomatic Design of Software Systems. CIRP Annals -
Manufacturing Technology, 49(1), 95-100. doi:10.1016/S0007-8506(07)62904-7
Vanden Heuvel, L. N., Lorenzo, D. K., Montgomery, R. L., Hanson, W. E., & Rooney, J. R.
(2005). Root Cause Analysis Handbook: A Guide to Effective Incident Investigation.
Rothstein Publishing.
Wilson L. How to implement lean manufacturing. 2nd edition. ed. New York, N.Y: McGraw-
Hill Education LLC; 2015. http://accessengineeringlibrary.com/browse/how-to-
implement-lean-manufacturing-second-edition.

73
Appendices Appendix A: Bottlenecks
In a manufacturing system, a bottleneck is defined as the resource that requires the
longest time in the operation of the supply chain to reach a certain demand. The bottleneck
determines what the total throughput of a supply chain can ultimately be. There is usually
an increase in inventory before the bottleneck, as well as an insufficiency of inventory after.
Throughout any system, as inventory moves through the supply chain, a bottleneck is likely
to occur. Every process that has an objective has a bottleneck unless the objective is fully
met. If the bottlenecks are identified properly, there is an opportunity to increase the
throughput of the system. In general, the cost per hour on a bottleneck equals the loss of
one hour for the entire supply chain (Imaoka, 2012).
The first step to identify a bottleneck is to look for the inventory buildup in the
system. After a process study is calculated for the time of each step, the longest cycle time is
usually the bottleneck. However, if it is a multistep process with a lot of work in progress
(WIP), then the bottleneck may cause the process to operate at a cycle time that is well
above its potential. This would lead to the succeeding steps producing at an extremely
low rate.
One method to discover a bottleneck is by using resource allocation. Many resource
allocation problems in manufacturing and service operations “require selecting integer-
valued levels for various activities that consume non-decreasing amounts of limited
resources” (Wilson, 2015). A basic bisection method can solve these types of problems by
using a nonlinear objective and constraints. Applications of the bottleneck resource-
allocation models include line balancing, raw material allocation, maintenance planning,
and storage allocation. Past research on bottleneck resource allocation has addressed
continuous variable versions of the problem or models with special structures. This
includes exploring the bisection approaches to address the decision problem.

74
Appendix B: Grinding Wheel Process
1. Review by engineers: The grinding wheel routing sheet is reviewed by engineers,
where they check specifications and make sure the order is correct.
2. Diamond Room: Here, the order is reviewed and different sized abrasives are
combined together to meet the specifications that the customer ordered.
3. Mixing Room: The abrasives move to the weighing and mixing room where the
mixture is combined with a bonding agent to help bond to the base of the grinding
wheel. It is put through screens and different machines to make sure that the
mixture is evenly blended.
4. Molding room: In the pre-molding process the DC-30 base and pressed in a high
pressure chamber that presses the adhesive to the DC-30 base. Before continuing
on, the part must cool down.
5. Baking: The wheel gets placed in a furnace to bake so the abrasive can set on the
DC-30 wheel.
6. Molding and Baking: The process repeats itself. This is where the diamond and
bonding agent mixture is poured into a mold and are added to the wheel. Once
pressed, the part is baked for a second time.
7. Apply to Assembly: If a part is considered a parent-child part, it must apply to
assembly where the routing sheets come together.
8. Side to 0.002: The part is polished to .002
9. Bore to Fit: The inside diameter must be bored to fit the specifications set by the
customer. This is not an exact boring, because the parts that go through this step
will be cemented and then re-bored.
10. Cementing: All of the child parts are cemented together with a bonding agent to
reach the desired size.
11. Side 2 Sides: Here the two sides of the wheels are sided to ensure that they are
balanced and are under the customer's specifications.
12. Outer Diameter Grind: The outer diameter and the inner diameter of the final
wheel are grinded to meet the customer specifications
13. Final Bore: The inner diameter is bored on final time to reach the exact
specifications that the customer needs.
14. Facing: The layer of protection around the abrasive is removed here. This is the
final assembly step of the wheel

75
15. Balance, Oil, Inspection: The wheel moves here where it is balanced to make sure
that it is correct. Then the wheel is inspected for any defects or other quality issues.
16. Mark and Ship: The last step in the process, where the part is marked with serial
numbers or a customer identification. From here the part is packed and ready for
shipping.

76
Appendix C: Operator Survey Questions
Name - Role
Years Worked
Position
What do you view works well at this site?
What do you feel needs to be improved?
What part of the process do you see as taking the longest?
People Interviewed
Position
Team Lead in Diamond/ Mixing Area
Mixer in the mixing room
Mixer in the mixing room
Team lead in Finishing
Finishing (Siding)
Molding Wheel (still unclear)
Laser Marker
Product Finisher
Table 3. Interviewees.

77
Coded Survey Responses (Operators)
Department Feedback Response
Category
#Times
Mentioned
Diamond
Room
(1 response)
- Shop view systems works to track orders
around the factory
- Uses FIFO
- Shop orders frequently delayed
- Engineering is the major cause
Schedule
Office
1
1
Mixing Room
(2 responses)
- If there is a large order, takes longer
because there is more sifting
- Wet mix takes longer
- Want to schedule small to large rather than
large to small
Help
Schedule
1
1
Molding
(2 responses)
- Space is limited
- Cooling down takes a long time
- Want to add a conveyer belt to move parts
easier
- Finishing holds back the DC-30s
- Lack of money to fund ideas
- Thick wheels have to keep pressing (press
up to 4 times)
- Scheduling problems, cannot make more
than 1 mold in a day, only have 1 mold for
each wheel
- Thinks that engineers do a lot of “fluffy
things” that are time wasters
- Need to talk to the people on the floor to
decide where capital is invested
- Need to come to the floor and learn the
process for themselves
- Do not replace molds fast enough because
company does not want to spend the
money
Space
Schedule
Office
Money
1
1
1
2
Finishing
(2 responses)
- Once you work there for a while, the jobs
get easier because you learn it really well
Schedule
Money
Help
Office
1
1
2
3

78
- Shared resources, some wheels take way
longer to make so that slows down the
process for all wheels
- Has to spend time switching the wheel
which takes a long time
- Lack of communication
- Incorrect routings
- High turnover rate with employees
- Lack of experienced employees
- Schedule does not reflect available
equipment
- Machines break down frequently
- Morale issues
Marking
(2 responses)
- Need to have a bigger push for quality
- Getting the wheels on time always takes
the longest
- Funnel system, everything filters through
him, so there is always a backlog of work
- Tries to work by dates, but gets orders out
of order because of the ease of set up
Office
Help
Scheduling
1
1
2
Table 4. Coded Survey Responses.
Total
Response Category # Times Mentioned
Space 1
Office 6
Money 3
Scheduling 6
Help 4
Table 5. Total Survey Responses.

79
Appendix D: Management Interview Questions and Answers Capital Purchasing Engineer
What is your role here? How long have you worked here, only in this position?
Been here 3 years--first 1.5 years was in quality in large bay area.
Familiar with that side of the project.
Moved line control then to capital improvements
6 months ago--manufacturing engineer.
Oversees everything in superabrasives.
Next year focus:
upgrading lot of finishing equipment in next year
What parts of the process do you see as needing the most improvement?
Need improvements in technology.
Large bay improvement project--reorganized the room but didn’t make big
improvements. Would benefit from a major investment.
In terms of transportation--his vision for the room is tower storage. They definitely
need to spend money to reorganize the room. It could take 20 minutes for a guy to
move the wheel around the room.
In regards to boring, we only see one machine doing that job, why is there only one?
Looking to combine machines to get a machine that can do 2 different jobs.
Still need flexibility in that area because some operations take longer/are more
common and others do not.
Just started looking at finishing area for capital investments, would be interested in
looking more into that
What would have to happen to buy another machine to do boring on?
Look at demand of machines to see if it is constantly used
How do you plan for your next capital investment?
Higher up--Nicole and steering committee have a vision. Like 100 things on the list,
maybe will work on 10 this year.
He’ll have to go through and learn about the process to figure out what they need.
Then make plans for consolidation.
Difficult because there’s so many shared resources.
Once you bring in a new machine you have to wait till its ready before you get rid of
the old machine.

80
Big places for improvement in terms of automation?
Tower storage.
Automated mixing. They have acoustic mixing in some of their other processes,
would like to move that to superabrasives.
Long term he would like to see mixing be moved to hoppers. Quality improvements
from not mixing in giant bowl.
How often can you make large purchases?
Haven’t really had anyone in that role before.
SG gives set amount of $ to spend on capital investments every year, but nobody
focused on just that.
They hired him, so they are willing to be spending that money. As long as it pays
itself back in a reasonable amount of time, they’ll be willing to spend it.
Wants to find a machine that can do 2 operations so you can reduce setup time,
especially for large wheels

81
Manufacturing Manager (responsible for staffing)
What is your role here?
Operations Manager for Superabrasives
How long have you worked here, only in this position?
A little over 26 years, been in superabrasives for last 4 or 5 years
How much do you know about the DC-30 production line?
In this role he doesn’t need to know everything about the process, so he’s no expert
What parts of the process do you see as needing the most improvement?
Concerned with 2 parts:
○ Front end: To make those large products, it’s pretty time consuming. A lot of
them are comprised of several pieces put together. Scheduling is an issue.
Product management is concerned about the lead time to the customer. They
promise the customer 2 to 4 week lead time. The molding area is constantly
behind, they can never seem to get started on time. Keys to service: starting
on time and keeping in moving. Sometimes they start so late that they don’t
have time to finish it, or its started on time but ends up sitting somewhere for
a long time. They do scheduling based on dates made by a computer system.
He believes the dates are set up for them to start late. If a customer makes an
order, they could promise 20 working days. The lead time is set up for maybe
16 days. The system starts from the end date and works backwards, so they
lose time on the front end. They lose those first 4 days of production.
“Shooting themselves in the foot”. He thinks things should be mixed the day
after the order comes in. They’re trying to change the settings on the system,
but it's hit a roadblock because management is concerned that the problem
won’t be solved it’ll just push the end date farther. One of biggest problems is
that systems dating is set up to start late.
○ Back end: In finishing he thinks we have staffing gaps. There are machines
out there that should be running 2 shifts, but they don’t have people trained
for that. Stuff backs up--it shouldn’t be like that, wheels should always be
moving through the process. Increasing staffing should help there
Are a lot of the parts late?
Yes
In regards to scheduling, how do you create the daily work schedule?

82
Schedule is based on customer demand
Based on the operators responses, it seems like there is only 1 ½ or 2 shifts for each operation.
Why not run a third shift if the majority of parts are behind
There’s a lot of things to balance. They could be 100% on time, but profitability by
adding a ton of people takes away.
Labor costs and their efficiency need to be taken strongly into consideration.
They also don’t have a constant volume, so they have periods of ups and downs.
○ If they’re in a down period, they could find that they have too much staff.
What is the frequency of employee turnover?
In superabrasives, they don’t have a high turnover rate rather a high retirement rate
Most people who come to work here stay here.
Also had an increase in demand, so they need to add new people accordingly
How long does it take to successfully train an employee?
It depends on the complexity of the operation.
○ With boring it's not the easiest, but also not the most complex.
To teach someone the basics it's generally a 4-6 week training.
How do you determine the need for overtime? How often do you run overtime?
At a high level he looks at the whole operation (what works need to be
accomplished and how long it should take to do that).
Has a spreadsheet that takes into account the # of workers they expect to have that
month, how much work they expect to have, then how much overtime they expect to
need.
Looks at how many people they have * 40 work week -> compare to demand
Are staff generally receptive to overtime?
Some like the money and like to work here and do a good job, some of them are on
the opposite end and struggle to work 40 hours.
Overtime hasn’t been met recently.

83
Quality Manager
What is your role here?
Quality Manager – Superabrasives. Also am the Quality Pillar Team leader.
Oversee, support, direct all of the quality related issues both internally (rejections,
reworks, waivers) as well as the quality related issues externally (Claims, incoming
raw material).
How long have you worked here, only in this position?
27 years. All with Superabrasives.
Title/Roles including – Research Assistant, Technician, Manufacturing Engineer,
Supervisor, Value Stream Coach, Quality Manager.
How much do you know about the DC-30 production line?
As VSC of Forming for 2+ years I have a pretty good understanding of front end
manufacturing of DC30 cores and finished goods using it. Not as much for Finishing.
What parts of the process do you see as needing the most improvement?
Pick a process, any process. There are opportunities to improve throughout the
entire manufacturing process front to back.
As far as needing improvement, I would target the front end of Forming.
○ Small Bay and Large Bay have increasing rejection levels.
○ Mixing has stabilized but needs solid sustainment.
○ Cold Press is way too volatile with high and low peaks with nothing tangible
to account for directional swing.
How many defects do you usually have?
Over 80+. The most common historically is Porous and Chips/Broken. See the
attached COPQ Paretos 2017 file.
What percent of things need to be reworked?
Currently about 8%. See Chart 1 below.
What’s the cost of each defect?
See Chart 1 below.
Do you have a quality defect log? Can we see it?
Yes, the COPQ log. Yes, when the Team is in next I will show our COPQ data file.

84
Do defects significantly delay the process, by how much?
Yes they do. Additional time that is not part of the set manufacturing cost adds to
the cost and delays timeliness.
Service is greatly affected by Replace orders.
2-4 weeks can be added to Lead Times for every rejection we have internally.
Figure 22. SA - Historical 2014 Thru 2016&2017 YTD Q1/Q2/Q3 for Total COPQ.
$1,327,592
$1,172,576
$962,801
$828,580
$299,633
$189,494
$207,321
$77,849
$45,408
$31,952
$28,433
$9,918
$0
$200,000
$400,000
$600,000
$800,000
$1,000,000
$1,200,000
$1,400,000
$1,600,000
$1,800,000
2014 2015 2016 2017
Rejection Rework Waiver

85
Production Scheduling
What is your role here?
Production Scheduler - Pretty much try to help manage level/capacity load in plan.
Our customer service is in Stevensville Texas, sales force is in country selling
wheels, constantly emailing CS saying to enter specs. Next day, materials release guy
and Jose sees what was entered yesterday so make sure they're not over capcacity.
Also expadites. There's a lot of things that goes into that.
Works a lot with Tom Moll. They all have different functions but work together for
common cause.
How long have you worked here, only in this position?
28 years
What parts of the process do you see as needing the most improvement?
Deals a lot with customer, so his answer is always going to be to better serve the
customer.
He is driven day to day to help the customer.
We found a lot of gaps between sched start and act start
Yeah those late wheels bother me because it's keeping the customer from getting
their wheel on time
How do you know the lead time of a part?
He doesn't, product design does. They have queue times. When they create a part
(UPC) they determine the queue time for each operation.
On average a UPC takes 4 weeks to complete. Once they have UPC they can come up
with a queue time. They do a 2 day window (2 days of start date) everyday. They
want manufacturing to work on FIFO. Tomorrow his scale will move a day.
When things are children, do you put them all on the same day or do you space them out? Do
you take into account the number of molds? Number of machines?
When product design creates it, they do date the children before they date the
parent.
Builds a timeline bridge to how a part is built.
Do you work based off FIFO, or do you work based off dates?
Yes, the plant is definitely FIFO.
They wanted to remove the ambiguity from the operators to do them at random.

86
If it says “ship by 5PM today” and it doesn’t actually ship by 5PM--what happens?
The tags are indicators that our ATL have created that they put for their operators
to work on. Mark Mitchell does it for finishing.
If it's not finished by 5PM, they go late. Next day they look at a dispatch list.
Look at late dispatches--ask ATL--ATL checks in and gives new estimated ship date.
They give that estimation back to the customer.
PP01 vs PP04 vs PP08?
Made to Order (MTO) PP04
Made to Stock (MTS) PP01
Replacements (orange sheets) PP08
Distribution center in Indianapolis--Jose job is to stock finished goods in that DC. If a
customer(s) buy a wheel often, they'll keep a set MTS amount in Indianapolis

87
Materials Manager
What is your role here?
Materials Manager to oversee Production Control, Purchasing, and Inventory
Control
How long have you worked here? How long have you worked in this position?
I started here in March of this year, in the same position
How much do you know about the DC-30 production line?
I’m not directly involved with specific production lines
What parts of the process do you see as needing the most improvement?
From a materials perspective, moving our receiving process from Bonded Abrasives
to here, Super Abrasives
What improvement efforts have you made in the past? What worked and what did not?
Cycle count procedure adjustments have improved inventory accuracy and safety
stock adjustments have reduced material stock-out situations dramatically
Please walk us through the process of scheduling a part?
Sales orders are entered by Customer Service with predetermined lead-times and
Production Control releases production orders to satisfy that demand daily
according to MRP scheduled release dates
How do you know the lead time of a part?
This business assumes infinite capacity and lead-times are predetermined based on
estimated processing times
Do you take available machines into account? What about available molds?
Assuming infinite capacity assumes machine and mold availability
Do you work based off FIFO, or do you work based off dates?
Strictly by customer due dates
Is there any accountability of working by dates?
Yes, the Operations Manager (Tom Moll) holds the Coaches accountable, the
Coaches hold the ATLs (Team Leads) accountable, and the ATLs hold the workforce
accountable

88
How do you schedule the loop back through? How does the queue line up?
Not sure what this means
How often do materials that you purchase come in?
Daily
Does this ever set you behind in releasing orders?
Production orders are released strictly by MRP scheduled released dates, assuming
all material is available
What percent of wheels are late?
As of this morning 132 of 2,085 orders in process are late…….6.3%

89
Coded Interview Responses (Managers)
The categories for the management responses are the same for operator employees from
above.
1. Schedule- This has to do with the production scheduling
2. Management- This pertains to the management decisions
3. Employees- This refers to the plant employees, their schedule, overtime, etc.
4. Money- Capital Investment opportunities
5. Space- Physical space within the plant
Department Feedback Response
Category
#Times
Mentioned
Management Michael Pettit
- Space: takes a long time to move parts
around a room
- Money: need to spend money to
reorganize
- Office: all capital abrasive projects (must
be approved from management)
Tom Moll
- Scheduling: concerned about lead time for
customer, molding always behind
- Scheduling: lose first 4 days because of the
way the system is set up
- People: staffing gaps in finishing
- People: many people retiring, new people
hired, takes over a month to be proficient
- Money: not willing to hire a lot of new b/c
of highs and lows of demand
- People: not receptive to overtime, not
meeting overtime needs
Steve Bieksha
- Quality: 80+ defects
- Scheduling: does not account for reworks
in lead time
Space
Office
Money
Scheduling
Help
1
6
3
6
4
Table 6. Coded Interview Responses (Managers).

90
Figure 23. Responses from 8 Operators.
Figure 24. Responses from 5 Management Employees.
1
6
3
6
4
Space Management Money Scheduling Employee Help
Responses from 8 Operators
2
1
2
4
3
1 1
Space Management Money Scheduling EmployeeHelp
Qualify Customer
Responses from 5 Management Employees

91
Appendix E: Spaghetti Diagram Distances Preform
From To Distance (ft)
1 – Preform Shelf 2 – Press 43
2 – Press 3 – Cooling Table 16
3 – Cooling Table 4 – Bake 183
4 – Bake 5 – Press 179
5 – Press 6 – Cooling Table 16
6 – Cooling Table 7 – Bake 183
7 – Bake 8 – Turn 115
8 – Turn 9 – Mold Room 229
Total: 964
Table 7. Preform Spaghetti Diagram Distances.

92
Wheel
From To Distance (ft)
1 – Weigh Diamond 2 – Weigh and Mix 49
2 – Weigh and Mix 3 – Mold Room 104
3 – Mold Room 4 – Press 34
4 – Press 5 – Cooling Table 16
5 – Cooling Table 6 – Bake 183
6 – Bake 7 – Press 131
7 – Press 8 – Cooling Table 52
8 – Cooling Table 9 – Apply to Assembly 298
9 – Apply to Assembly 10 – Side to .002 28
10 – Side to .002 11 – Bore to Fit 51
11 – Bore to Fit 12 – Cement 143
12 – Cement 13 – Side 2 Sides 189
13 – Side 2 Sides 14 – Bore 51
14 – Bore 15 – OD Grind 18
15 – OD Grind 16 – Finish Bore 32
16 – Finish Bore 17 – Face 117
17 – Face 18 – Inspection 47
18 – Inspection 19 – Balance/Oil 27
19 – Balance/Oil 20 – Mark 25
20 – Mark 21 – Pack 37
21 – Pack 22 – Ship 53
Total: 1685
Table 8. Wheel Spaghetti Diagram Distances.

93
Appendix F: Backwards Scheduling Example
Figure 25. Backwards Scheduling Example.

94
Appendix G: Presentation for Sponsor

95

96

97