thunderstorm characteristics in austria a study based on
TRANSCRIPT
Thunderstorm Characteristics in AustriaA Study based on Radar and Lightning data
Vera Meyer, Lukas Tüchler
DATA SOURCES
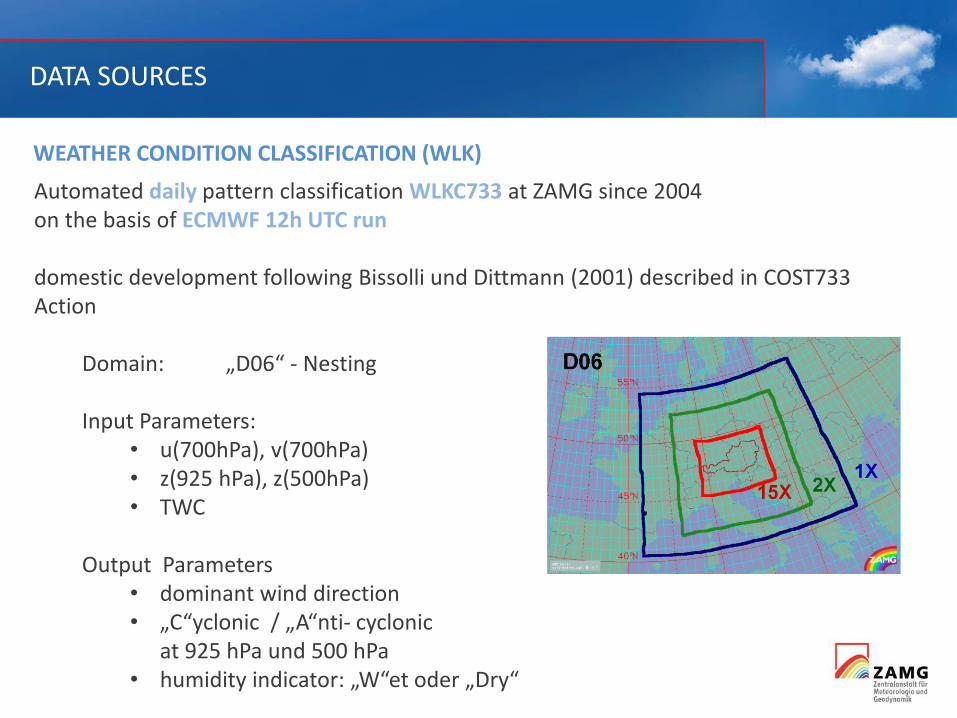
Automated daily pattern classification WLKC733 at ZAMG since 2004 on the basis of ECMWF 12h UTC run
domestic development following Bissolli und Dittmann (2001) described in COST733 Action
Domain: „D06“ - Nesting
Input Parameters: • u(700hPa), v(700hPa)• z(925 hPa), z(500hPa)• TWC
Output Parameters• dominant wind direction• „C“yclonic / „A“nti- cyclonic
at 925 hPa und 500 hPa• humidity indicator: „W“et oder „Dry“
WEATHER CONDITION CLASSIFICATION (WLK)

DATA SOURCES
8 wind direction sectors & weak gradient
WEATHER CONDITION CLASSIFICATION
weakgradient
DATA SOURCES
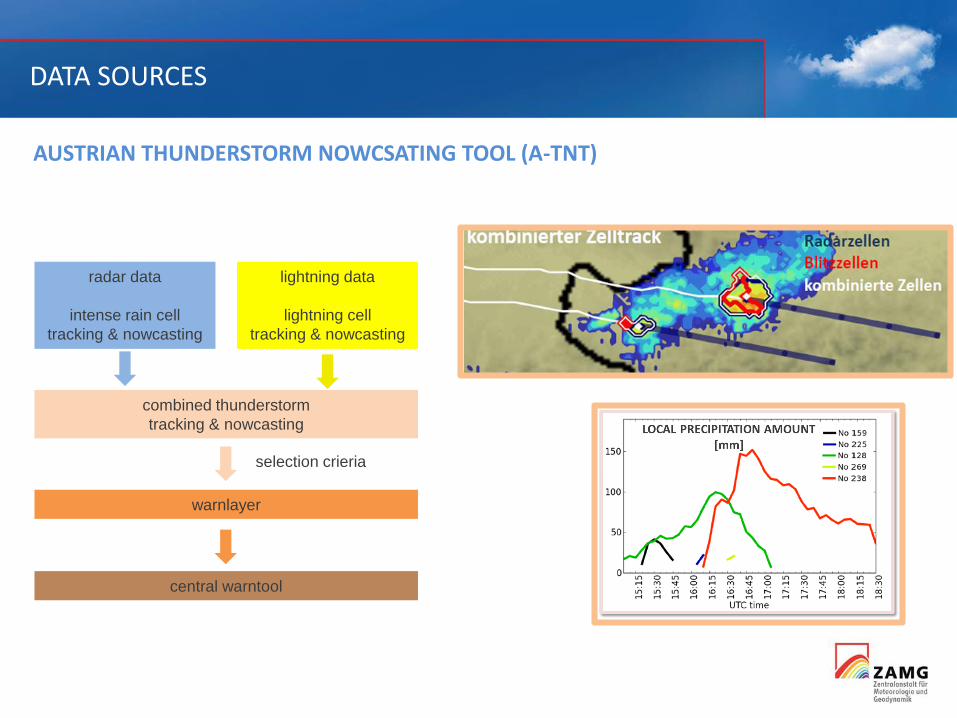
AUSTRIAN THUNDERSTORM NOWCSATING TOOL (A-TNT)
radar data
intense rain cell
tracking & nowcasting
lightning data
lightning cell
tracking & nowcasting
combined thunderstorm
tracking & nowcasting
warnlayer
central warntool
selection crieria
DATA SOURCES2
D A
NA
LYSE
SM
AX
CA
PP
Isi
nce
26
.03
.20
14
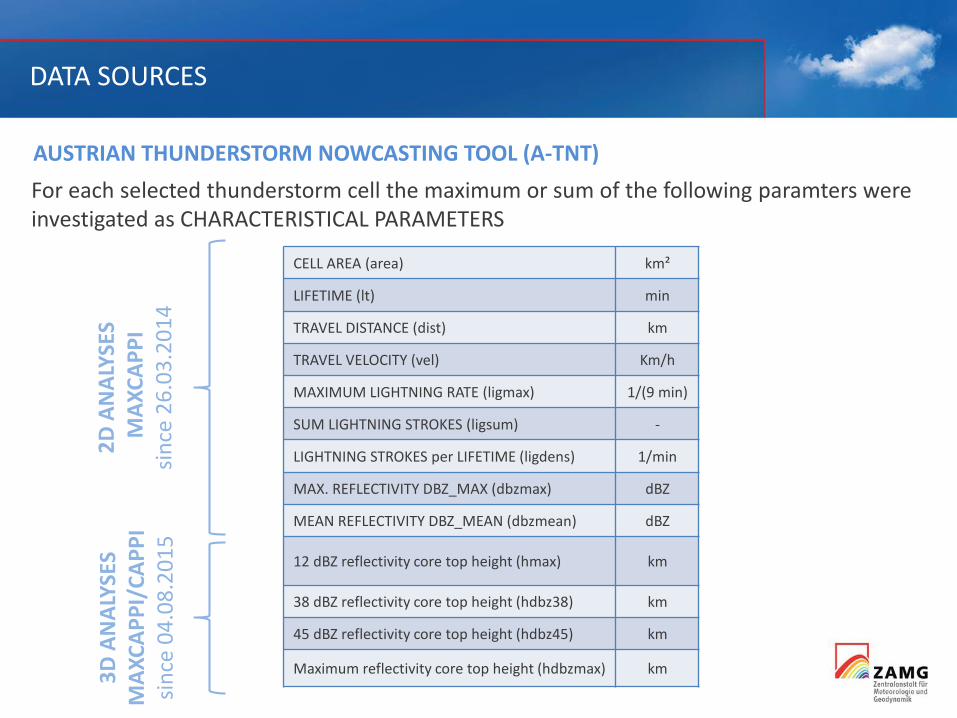
AUSTRIAN THUNDERSTORM NOWCASTING TOOL (A-TNT)
CELL AREA (area) km²
LIFETIME (lt) min
TRAVEL DISTANCE (dist) km
TRAVEL VELOCITY (vel) Km/h
MAXIMUM LIGHTNING RATE (ligmax) 1/(9 min)
SUM LIGHTNING STROKES (ligsum) -
LIGHTNING STROKES per LIFETIME (ligdens) 1/min
MAX. REFLECTIVITY DBZ_MAX (dbzmax) dBZ
MEAN REFLECTIVITY DBZ_MEAN (dbzmean) dBZ
12 dBZ reflectivity core top height (hmax) km
38 dBZ reflectivity core top height (hdbz38) km
45 dBZ reflectivity core top height (hdbz45) km
Maximum reflectivity core top height (hdbzmax) km
For each selected thunderstorm cell the maximum or sum of the following paramters wereinvestigated as CHARACTERISTICAL PARAMETERS
3D
AN
ALY
SES
MA
XC
AP
PI/
CA
PP
Isi
nce
04
.08
.20
15
DATA SOURCES
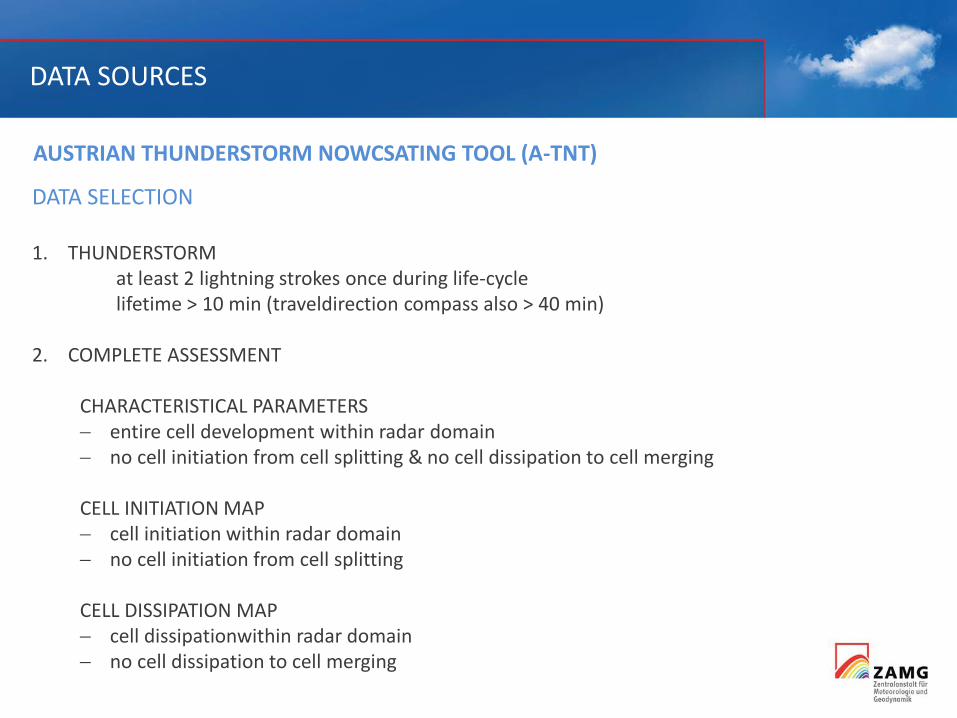
AUSTRIAN THUNDERSTORM NOWCSATING TOOL (A-TNT)
DATA SELECTION
1. THUNDERSTORMat least 2 lightning strokes once during life-cyclelifetime > 10 min (traveldirection compass also > 40 min)
2. COMPLETE ASSESSMENT
CHARACTERISTICAL PARAMETERS entire cell development within radar domain no cell initiation from cell splitting & no cell dissipation to cell merging
CELL INITIATION MAP cell initiation within radar domain no cell initiation from cell splitting
CELL DISSIPATION MAP cell dissipationwithin radar domain no cell dissipation to cell merging
DATA SOURCES
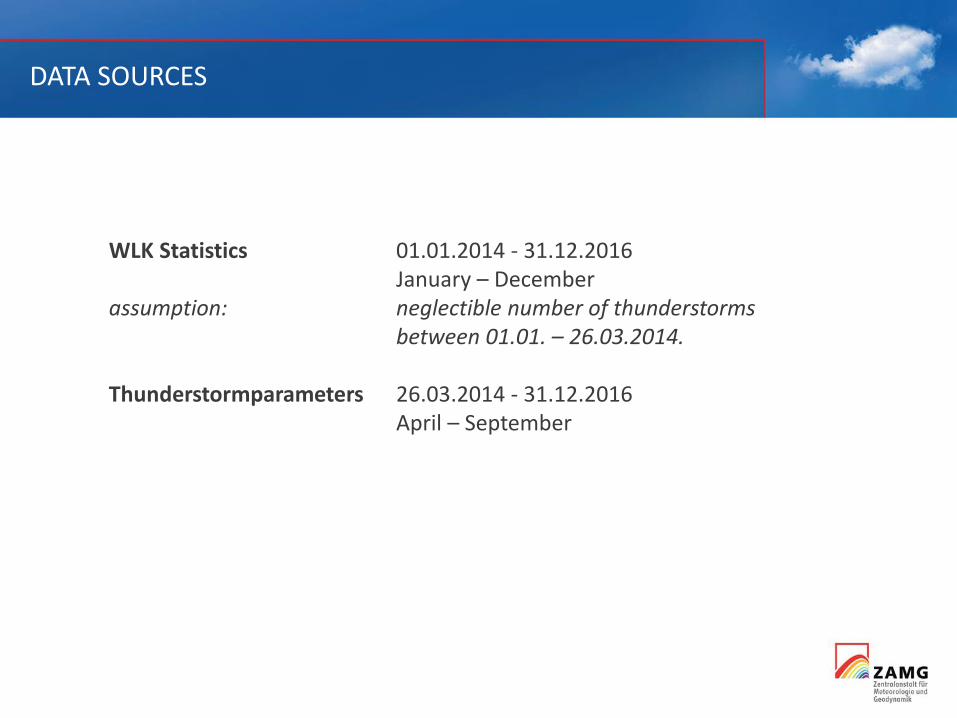
WLK Statistics 01.01.2014 - 31.12.2016January – December
assumption: neglectible number of thunderstormsbetween 01.01. – 26.03.2014.
Thunderstormparameters 26.03.2014 - 31.12.2016April – September
INTERPRETATION
To be considered for the interpretation:
• 3D radar parameter not available before August 2015
• local radar beam shading
• periphery
• underlying statistic
• daily resolution of the weather condition classification
28.05.2019Folie 9
INTERPRETATION
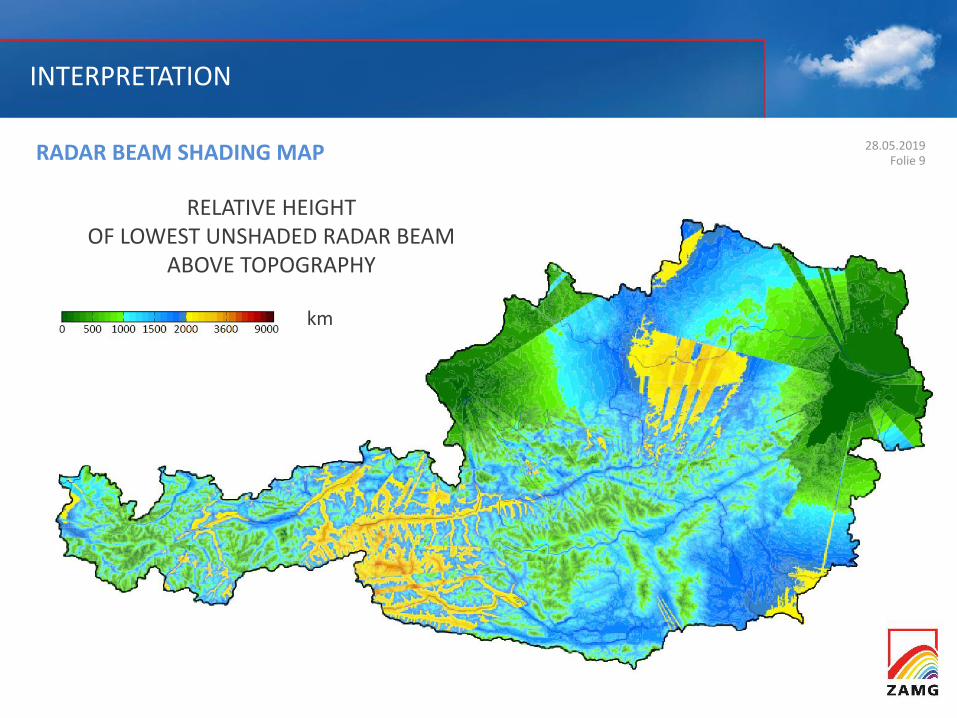
RADAR BEAM SHADING MAP
RELATIVE HEIGHT OF LOWEST UNSHADED RADAR BEAM
ABOVE TOPOGRAPHY
km
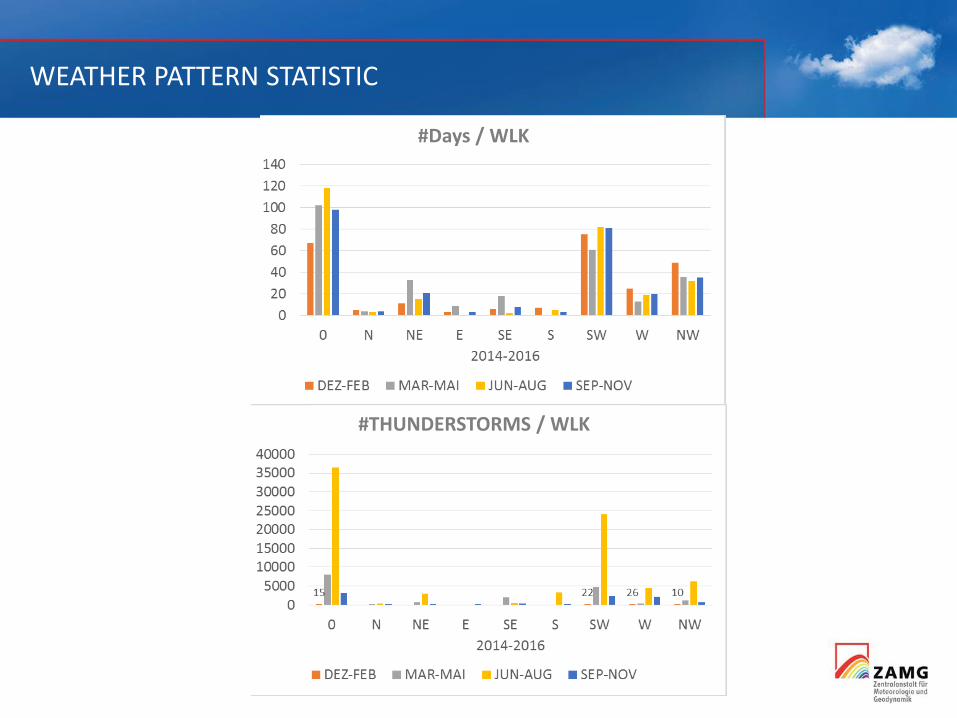
WEATHER PATTERN STATISTIC
#Days / WLK
#THUNDERSTORMS / WLK

WEATHER PATTERN STATISTIC
#Days / WLK
#THUNDERSTORMS / WLK

28.05.2019Folie 12
ANALYSES METHODS
FREQUENCY MAPS
Absolute Frequence of
• cell initiationwith mean travel direction and distance*mean travel distance if #cells/square > 3
resolution: 5 km x 5 km, 15 km x 15 km(depending on the underlying statistic)
• cell track density
resolution: 1 km x 1 km
*travel direction and distance are achieved bycomparing the cell centers of initiation anddissipation points
W
WW

28.05.2019Folie 13
ANALYSES METHODS
TRA
VEL
DIS
TAN
CE
STORM PATH COMPASS
Absolute frequencies of• travel direction*• travel distance*
Statistic
STATISTICMean/Median
*travel direction and distance are achieved bycomparing the cell centers of initiation anddissipation points
ANALYSES METHODS
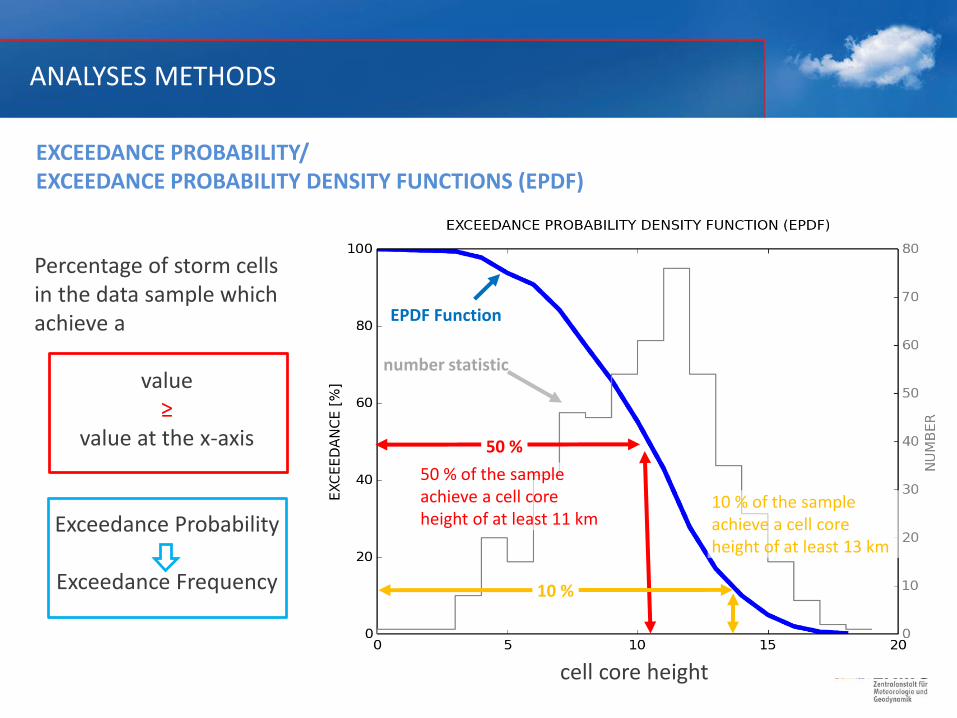
50 %
50 % of the sample achieve a cell coreheight of at least 11 km
10 %
10 % of the sample achieve a cell core height of at least 13 km
number statistic
EPDF Function
EXCEEDANCE PROBABILITY/EXCEEDANCE PROBABILITY DENSITY FUNCTIONS (EPDF)
Percentage of storm cellsin the data sample whichachieve a
value≥
value at the x-axis
Exceedance Probability
Exceedance Frequency
cell core height

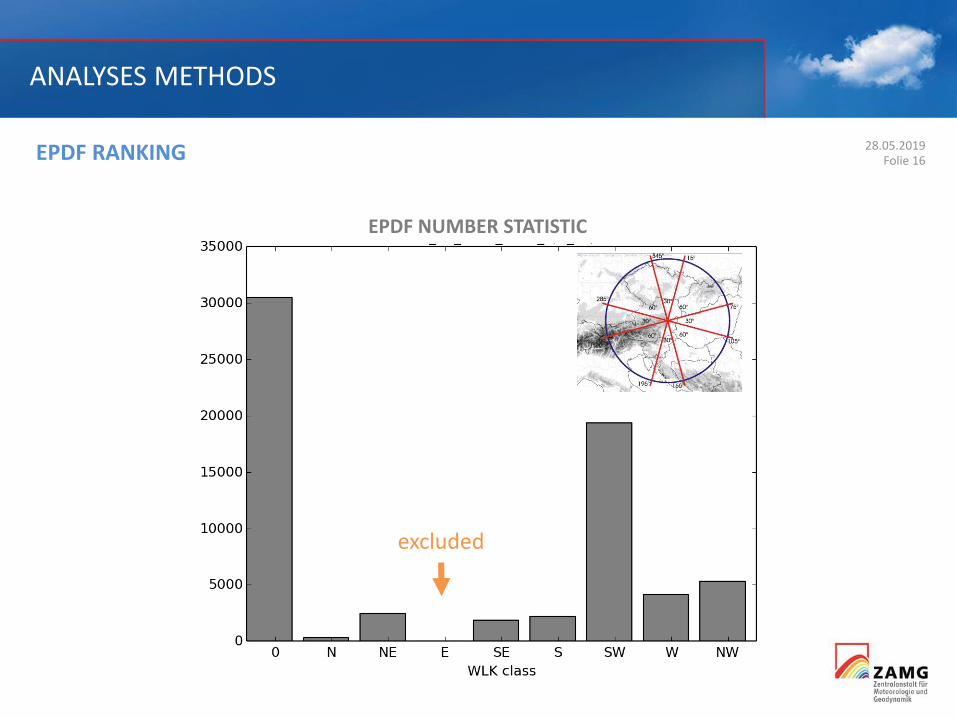
ANALYSES METHODS
EPDF RANKING
1234 DISCRETE RANKING
0% 20% 70% 100 % RELATIVE RANKINGEP 50%
A ranking can be done bycomparing the EPDFfunctions for differentweather patterns
For a specific exceedanceprobability data sampleswith tendential highervalues will be found athigher parameter values.
cell core height
28.05.2019Folie 16
ANALYSES METHODS
EPDF RANKING
excluded
EPDF NUMBER STATISTIC

28.05.2019Folie 17
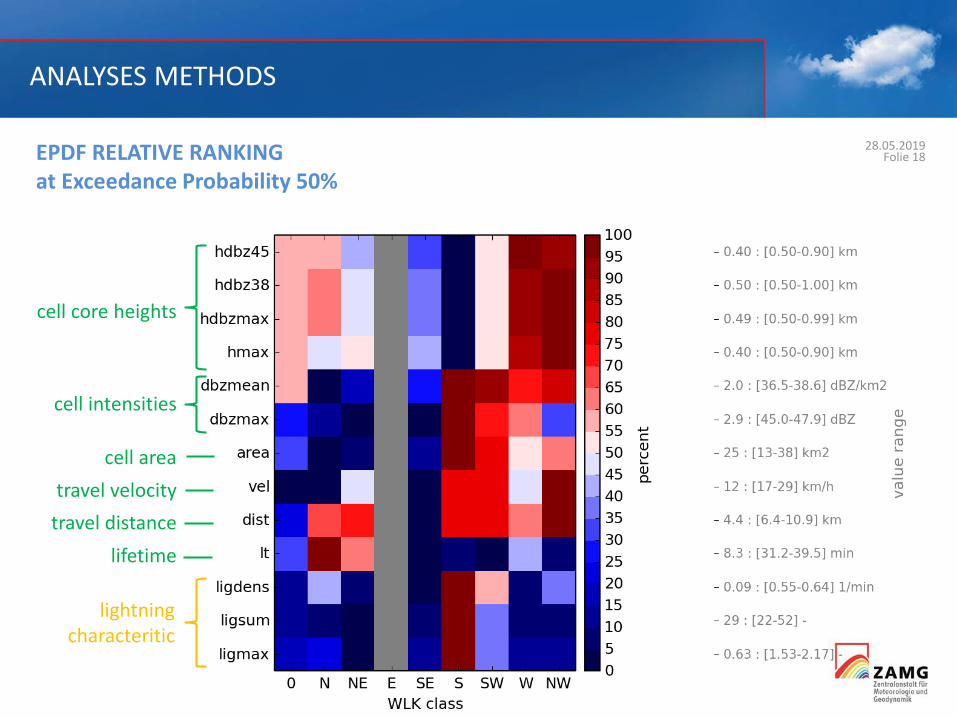
ANALYSES METHODS
cell core heights
cell intensities
cell area
travel velocity
travel distance
lightningcharacteritic
lifetime
EPDF RELATIVE RANKINGat Exceedance Probability 50%
cell parameters
STATISTICInterval: [Min – Max]
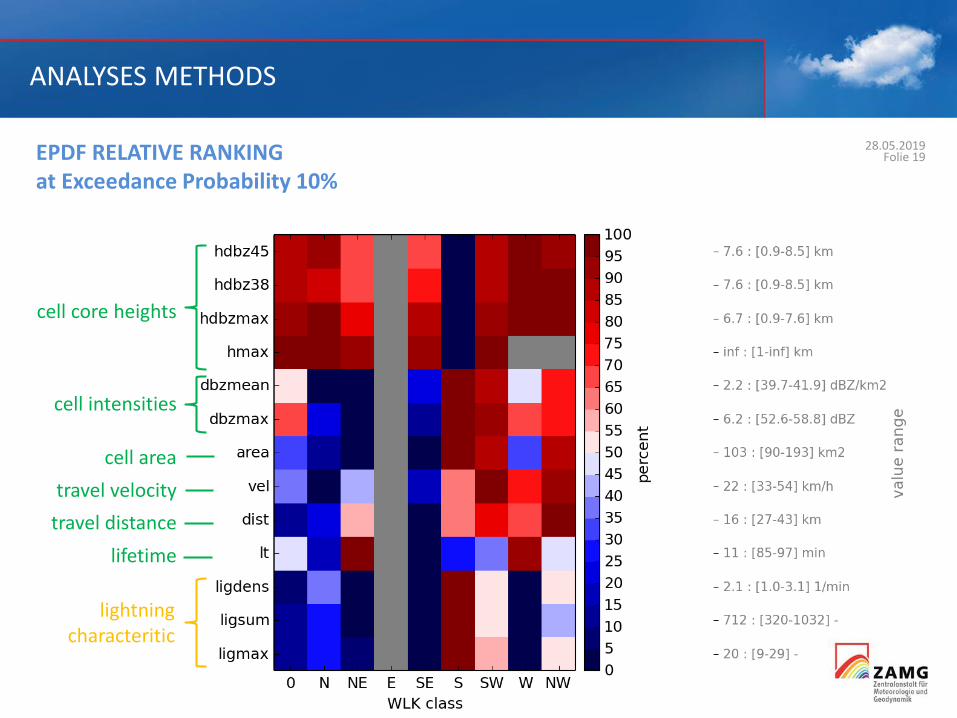
The color scales representsthe difference between the
parameter values at theselected exceedance
probability.High values are red,
low values blue
28.05.2019Folie 18
ANALYSES METHODS
EPDF RELATIVE RANKINGat Exceedance Probability 50%
cell core heights
cell intensities
cell area
travel velocity
travel distance
lightningcharacteritic
lifetime
28.05.2019Folie 19
ANALYSES METHODS
EPDF RELATIVE RANKINGat Exceedance Probability 10%
cell core heights
cell intensities
cell area
travel velocity
travel distance
lightningcharacteritic
lifetime

OUTLOOK
Work in Progress
• Extend Period 2011 –2020 • Include other Parameters
i.e. Probability of Hail, estimated local precipitation amount, 3D radar parameters• Closer look at outstanding features• Refined cell selections (WLK wet/dry, high lightning activities, high probabilities of hail, etc.)
• Feasibility study to integrate local prediction qualities in adaptive nowcasting cones.
More Ideas
• Investigate the role of the topography on thunderstorm paths and development• right shift in the direction compasses
THANK YOUJames Regan