thunderstorms - met office · ball lightning — a rare form of lightning in which a persistent and...
TRANSCRIPT

National Meteorological Library and Archive Fact sheet 2 — Thunderstorms
Thunderstorms
The National Meteorological Library and Archive
Many people have an interest in the weather and the processes that cause it, which is why the National Meteorological Library and Archive are open to everyone.
Holding one of the most comprehensive collections on meteorology anywhere in the world, the Library and Archive are vital for the maintenance of the public memory of the weather, the storage of meteorological records and as aid of learning.
The Library and Archive collections include:
• around 300,000 books, charts, atlases, journals, articles, microfiche and scientific papers on meteorology and climatology, for a variety of knowledge levels
• audio-visual material including digitised images, slides, photographs, videos and DVDs
• daily weather reports for the United Kingdom from 1861 to the present, and from around the world
• marine weather log books
• a number of the earliest weather diaries dating back to the late 18th century
• artefacts, records and charts of historical interest; for example, a chart detailing the weather conditions for the D-Day Landings, the weather records of Scott’s Antarctic expedition from 1911
• rare books, including a 16th century edition of Aristotle’s Meteorologica, held on behalf of the Royal Meteorological Society
• a display of meteorological equipment and artefacts
For more information about the Library and Archive please see our website at:
www.metoffice.gov.uk/learning/library

Introduction
A thunderstorm can be described as one or more sudden electrical discharges, manifested by a flash of light (lightning) and a sharp or rumbling sound (thunder). Thunderstorms are associated with convective clouds and are most often, but not necessarily, accompanied by precipitation at the ground.
Cumulonimbus clouds
(Latin: cumulus – heap; nimbus – rainy cloud)
Heavy and dense cloud, of considerable vertical extent, in the form of a mountain or huge towers. At least part of its upper portion is usually smooth, or fibrous or striated, and nearly always flattened; this part often spreads out in the shape of an anvil or vast plume. Under the base of this cloud, which is often very dark, there are frequently low ragged clouds either merged with it or not, and precipitation sometimes in the form of virga.
Figure 1. A mature cumulonimbus cloud (© M.J.O. Dutton).
Cumulonimbus clouds normally develop from large cumulus but they can also do so from stratocumulus or altocumulus. When they cover a large expanse of sky the under surface can present the appearance of nimbostratus. The character of the precipitation may be of assistance in identifying the cloud. Cumulonimbus gives showers, very often quite heavy for comparatively short periods of time.
If hail, thunder or lightning are observed then, by convention, the cloud is cumulonimbus. The evolution of the cloud can also aid identification. The change from large cumulus with domed tops and a hard outline (produced by water drops) to a top with a softer fibrous outline (produced by ice crystals) marks the change from cumulus to cumulonimbus.

A cumulonimbus cloud can be described as a ‘cloud factory’; it may produce extensive thick patches of cirrus, altocumulus, altostratus, cumulus or stratocumulus. The spreading of the highest part usually leads to the formation of an anvil; if the wind increases with height, the upper portion of the cloud is carried downwind in the shape of a half anvil or vast plume.
Figure 2. A cumulonimbus ‘cloud factory’ (© J. Corey).
Not all cumulonimbus clouds bring thunderstorms; some just bring heavy showers or hail. On average, an individual cumulonimbus cloud takes only one hour to take shape, grow and dissipate. It produces less than 30 minutes of thunder and lightning. If a thunderstorm lasts longer than this, it is probably because there is more than one cumulonimbus present.

Case study – Thunderstorms of the 24 May 1989
Satellite imagery is very useful in locating cumulonimbus cloud development. Severe convective storms on the 24 May 1989, following a spell of hot weather, led to some very intense point rainfalls at a number of places in southern England.
The satellite image (figure 3) shows these cumulonimbus cells clearly. The resulting cumulonimbus produced severe thunderstorm across parts of Hampshire, Surrey and Berkshire as well as the Midlands and northern England.
Figure 3. Visible satellite imagery for 1244z on 24 May 1989.

Rain-gauge site 24-hour rainfall totals
Sandford Sewage Works, Oxford (Oxfordshire) 68.5 mm
Sewage Works, Basingstoke (Hampshire) 68.5 mm
Cargate Reservoir, Aldershot (Hampshire) 64.2 mm
Juniper Hall, Mickleham (Surrey) 62.2 mm (rain fell from 1145Z to 1300Z)
South Farnborough (Hampshire) 60.2 mm (rain fell from 1215Z to 1330Z)
Upper Basildon (Berkshire) 57.0 mm
Pirbright Institute (Surrey) 56.5 mm
Merrist Wood Agricultural College (Surrey) 53.5 mm
Royal Horticultural Society Gardens, Wisley (Surrey) 52.6 mm
Frimley Pumping Station (Surrey) 51.6 mm
There were reports of heavy rain and flooding across many areas with some places having well over two inches of rainfall – Oxford and Basingstoke both reported over 68 mm (2.6 inches) during the day, much of which fell in the space of a couple of hours.
Table 1. 24-hour (0900Z-0900Z) rainfall totals for 24 May 1989.

Electrical charges within a cumulonimbus cloud
Lightning is a large electrical spark caused by electrons moving from one place to another.
Figure 4. Lightning seen over Iowa (© M. Clark).

Electrons are fundamental sub-atomic particles that carry a negative electric charge. They are so small they cannot be seen, but when lightning flashes they are moving so fast that the air around them glows. The actual streak of lightning is the path the electrons follow when they move.
Water droplets form inside a storm cloud. They are propelled towards the top of the cloud by strong internal winds (updraughts), where they turn to ice. Some of the pieces of ice grow large into hail, but others remain very small. As the pieces of hail get larger, they fall back through the cloud, bumping into smaller ice particles that are still being forced upwards. When the ice particles collide, some electrons are transferred to the hail. The electrons give the hail a negative charge, while the ice particles that have lost electrons gain a positive charge.
The winds continue to carry the ice particles upwards, giving the top of the cloud a positive charge. Some of the hail has now grown so heavy that the winds can no longer propel them upwards and so collect in the lower part of the cloud, giving it a negative charge. As well as being attracted to the positive atoms in the top of the cloud, the atoms are attracted to positive atoms in other clouds and on the ground. If the attraction is strong enough, the electrons will move towards the positive atoms. The path they make in doing so is the flash of lightning.
As negative charges collect at the base of the cloud, they repel the electrons near the ground’s surface. This leaves the ground and the objects on it with a positive charge. As the attraction between the cloud and the ground grows stronger, electrons shoot down from the cloud. The electrons move in a path that spreads in different directions — like a river delta. Each step is approximately 50 metres long and the branching path is called a stepped leader. Further electrons follow, making new branches. The average speed at which the stepped leader cuts through the air is about 270,000 miles per hour.
An atom consists of three basic parts, a Proton (which has a positive charge), a Neutron (which has no charge) and an Electron (which has a negative charge).
Electrons cling to the positively charged centre of the atom because they have a negative electrical charge.
During a thunderstorm, some of the atoms in the cloud lose their electrons and the others gain extra ones.
Figure 5. Basic structure of an atom.
Proton (+ive charge)
Neutron (no charge)
Electron (–ive charge)
–
––
– –
–
––
– –
–
– –
+ + + + + + + + + + + +
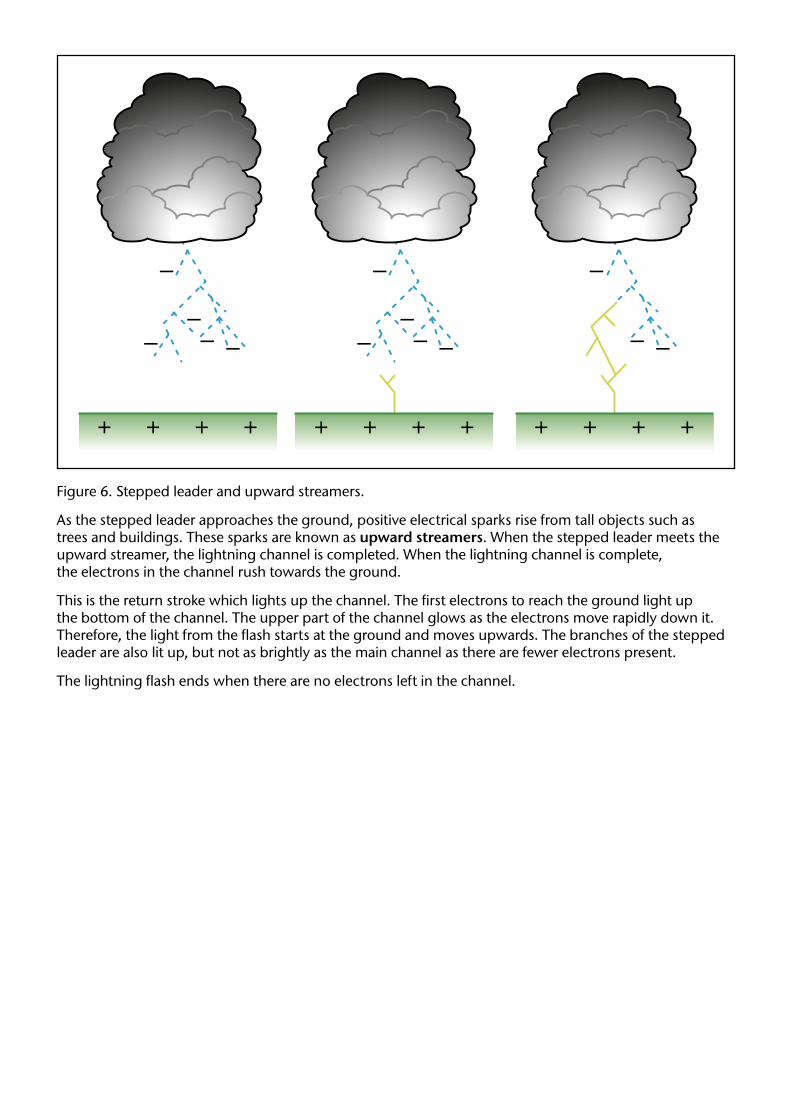
Figure 6. Stepped leader and upward streamers.
As the stepped leader approaches the ground, positive electrical sparks rise from tall objects such as trees and buildings. These sparks are known as upward streamers. When the stepped leader meets the upward streamer, the lightning channel is completed. When the lightning channel is complete, the electrons in the channel rush towards the ground.
This is the return stroke which lights up the channel. The first electrons to reach the ground light up the bottom of the channel. The upper part of the channel glows as the electrons move rapidly down it. Therefore, the light from the flash starts at the ground and moves upwards. The branches of the stepped leader are also lit up, but not as brightly as the main channel as there are fewer electrons present.
The lightning flash ends when there are no electrons left in the channel.

–
–
–
+ + + +
Figure 7. Return stroke and dart leaders.
If lightning flickers, it is probably because there has been more than one return stroke. When the lightning channel is empty it is possible for electrons from another part of the cloud to enter it.
The movement of the electrons into the channel is called a dart leader. It causes another return stroke to occur. The repeated return strokes and dart leaders make the lightning appear to flicker because of the great speed at which they occur.

Types of lightning
There are several types of lightning, these are:
• Ball lightning — a rare form of lightning in which a persistent and moving luminous white or coloured sphere is seen.
• Rocket lightning — a very rare and unexplained form of lightning in which the speed of propagation of the lightning stroke is slow enough to be perceptible to the eye.
• Pearl-necklace lightning — a rare form of lightning, also termed ‘chain lightning’ or ‘beaded lightning’, in which variations of brightness along the discharge path give rise to a momentary appearance similar to pearls on a string.
• Ribbon lightning — ordinary cloud-to-ground lightning that appears to be spread horizontally into a ribbon of parallel luminous streaks when a very strong wind is blowing at right angles to the observer’s line of sight.
• Forked lightning — lightning in which many luminous branches from the main discharge channel are visible.
• Sheet lightning — the popular name applied to a ‘cloud discharge’ form of lightning in which the emitted light appears diffuse and there is an apparent absence of a main channel because of the obscuring effect of the cloud.
• Streak lightning — lightning discharge which has a distinct main channel, often tortuous and branching, the discharge may be from cloud to ground or from cloud to air.
Figure 8. Forked lightning (© M.J.O. Dutton).

Figure 9. Sheet lightning (© M. Clark).

Figure 10. Streak lightning (© M. Clark).

Thunder
The word ‘thunder’ is derived from ‘Thor’, the Norse god of thunder. He was supposed to be a red-bearded man of tremendous strength; his greatest attribute being the ability to forge thunderbolts. The word Thursday is also derived from his name.
Thunder is the sharp or rumbling sound that accompanies lightning. It is caused by the intense heating and expansion of the air along the path of the lightning. The rumble of thunder is caused by the noise passing through layers of the atmosphere at different temperatures. Thunder lasts longer than lightning because of the time it takes for the sound to travel from different parts of the flash.
How far away is a thunderstorm?
This can roughly be estimated by measuring the interval between the lightning flash and the start of the thunder. If you count the time in seconds and then divide by three, you will have the approximate distance in kilometres. Thunder is rarely heard at a distance of more than 20 km.
Are thunderstorms dangerous?
Most people are frightened by the crackles and rumbles of thunder rather than the flash of lightning. However, thunder cannot hurt anybody, and the risk of being struck by lightning is far less than that of being killed in a car crash. Ninety per cent of lightning discharges go from cloud to cloud or between parts of the same cloud, never actually reaching the Earth. Most of the discharges that do strike the ground cause little or no damage or harm. Lightning takes the shortest and quickest route to the ground, usually via a high object standing alone.
How common are thunderstorms?
Thunderstorms occur throughout the world, even in polar regions, with the greatest frequency in tropical rainforest areas, where they may occur nearly daily. The most thundery part of the earth is the island of Java where the annual frequency of thunderstorms is about 220 days per year. In temperate regions, they are most frequent in spring and summer, although they can occur in cold fronts at any time of year. Thunderstorms are rare in polar regions due to the cold climate and stable air masses that are generally in place, but they do occur from time to time, mainly in the summer months. In recent years, thunderstorms have taken on the role of a curiosity. Every spring, storm chasers head to the Great Plains of the United States and the Canadian Prairies to explore the visual and scientific aspects of storms and tornadoes.
In the United Kingdom thunder is a variable element, the highest and lowest annual totals of thunderstorm days at many individual stations ranges from less than 5 in a quiet year to 20 or more in an active one. One consequence of this is that published maps showing the average frequency of days of thunder differ considerably in detail according to the period of records used. They agree, however, in showing that the average annual frequency is less than 5 days in western coastal districts and over most of central and northern Scotland, and 15 to 20 days over the east Midlands and parts of southeast England. There is relatively little seasonal variation on the western seaboard but elsewhere summer is the most thundery season.

Figure 11. Average number of days of thunderduring spring (1971 to 2000).
>65 to 64 to 53 to 42 to 31 to 2<1
Average value (days)

Figure 12. Average number of days of thunderduring summer (1971 to 2000).
>65 to 64 to 53 to 42 to 31 to 2<1
Average value (days)

Figure 13. Average number of days of thunderduring autumn (1971 to 2000).
>65 to 64 to 53 to 42 to 31 to 2<1
Average value (days)

Figure 14. Average number of days of thunderduring winter (1971 to 2000).
>65 to 64 to 53 to 42 to 31 to 2<1
Average value (days)

Figure 15. Average number of days of thunder during the whole year (1971 to 2000).
>1412 to 1410 to 128 to 106 to 84 to 6<4
Average value (days)

Intensity of thunderstorms
The intensity of a thunderstorm is dependant on the number of lightning flashes per minute. There are three categories, these are:
• Slight — rate of 1 flash per minute
• Moderate — rate of 2 to 3 flashes per minute
• Heavy — rate of 4 or more flashes per minute
Lightning and thunderstorms – some facts and figures
• Number of thunderstorms occurring at any given moment: 2,000.
• Number of lightning strikes every second: 100.
• Number of lightning strikes a day: 8 million.
• A typical lightning bolt contains 1 billion volts and contains between 10,000 to 200,000 amperes of current.
• The average flash would light a 100 watt light bulb for 3 months.
• A typical flash of forked lightning lasts for about 0.2 seconds.
• The temperature of lightning’s return stroke can reach 28,000°C.
• Lightning does strike twice; the Empire State Building in New York has been struck by lightning as much as 48 times in one day, but they have lightning conductors to carry the electricity harmlessly to the ground.
Lightning safety rules
Don’t...
• Venture outside, unless absolutely necessary.
• Use plug-in electrical equipment like hair driers, electric toothbrushes, or electric razors during the storm.
• Use the telephone during the storm. Lightning may strike telephone lines outside.
• Take laundry off the clothesline.
• Work on telephone or power lines, pipelines, or structural steel fabrication.
• Use metal objects like golf clubs.
• Handle flammable materials in open containers.
• Stay on hilltops, in open spaces, near wire fences, metal clotheslines, exposed sheds, and any electrically conductive elevated objects.
Do...
• Stay indoors.
• Stay away from open doors and windows, radiators, metal pipes, and plug-in electrical appliances.
• Get out of the water and off small boats.
• Stay in your car if you are travelling. Cars offer excellent lightning protection.
• Seek shelter in buildings. If no buildings are available, your best protection is a cave, ditch, or under head-high clumps of trees in open forest glades.
• When there is no shelter, avoid the highest object in the area. If only isolated trees are nearby, your best protection is to crouch in the open, keeping twice as far away from isolated trees as the trees are high.
• When you feel the electrical charge — if your hair stands on end or your skin tingles — lightning may be about to strike you. Drop to the ground immediately.
Thunderstorm location
Why do we need to detect lightning?
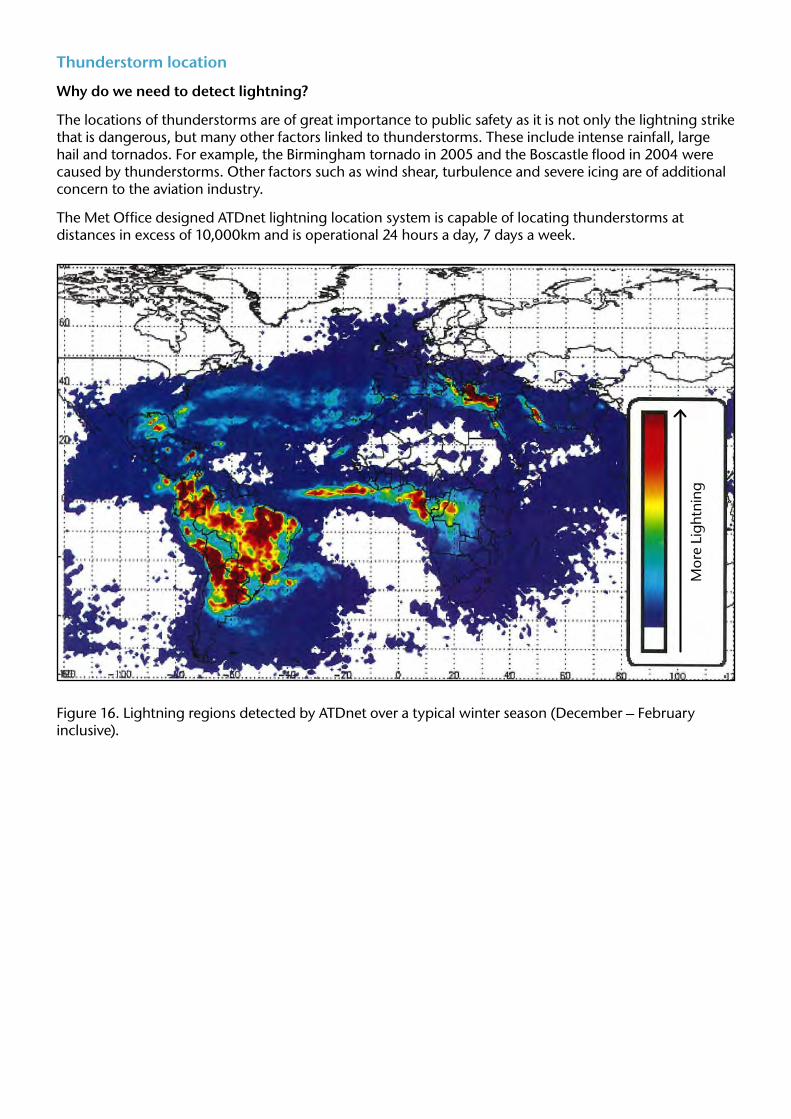
The locations of thunderstorms are of great importance to public safety as it is not only the lightning strike that is dangerous, but many other factors linked to thunderstorms. These include intense rainfall, large hail and tornados. For example, the Birmingham tornado in 2005 and the Boscastle flood in 2004 were caused by thunderstorms. Other factors such as wind shear, turbulence and severe icing are of additional concern to the aviation industry.
The Met Office designed ATDnet lightning location system is capable of locating thunderstorms at distances in excess of 10,000km and is operational 24 hours a day, 7 days a week.
Figure 16. Lightning regions detected by ATDnet over a typical winter season (December – February inclusive).
Mor
e Li
ghtn
ing

ATD – Arrival Time Differences.
How can lightning be detected?
When a lightning strike occurs, a pulse of electromagnetic energy is created going in every direction, some of which is seen as the bright flash of light usually associated with lightning. This pulse also produces emissions at frequencies which are outside of our visual range. The ATDnet system detects these pulses at a frequency known as VLF (Very Low Frequency) – much lower frequency than normal radio waves. At this frequency, the pulses are called ‘sferics’, from ‘atmospherics’.
These waves are capable of travelling great distances because they are reflected between the surface of the Earth and a layer of the upper atmosphere called the ionosphere — in a similar way to light travelling within a fibre optic cable.
Figure 17. The sferic travelling around the Earth.
Radiowaves propagateoutwards in all directions
Lightning strike
Edge of ionosphere
Strike detectedby sensor

The sferics from lightning strikes around the world can actually be heard on your radio as crackles and the effect of nearby storms produces interference on your TV. The ATDnet system picks up these sferics and as each has a unique waveform, similar to a fingerprint, it can separate out individual ones.
Figure 18. The waveform of a typical sferic. The peak is used for timing.

X
A single sensor may be able to detect a sferic, but you need several sensors to be able to calculate where the sferic came from, giving you the thunderstorm location. The ATDnet system consists of a network of 11 sensors positioned around the world, tuned to pick up these sferics and feed their reports back to a central computer in the Met Office Headquarters which works out the origin of the sferic.
If you have several sensors placed around the world, the unique sferics will arrive at different sensors at different times, depending on where the storm is happening, as the sferics travel at the speed of light. The difference in the time taken for the sferic to reach one sensor relative to another is called the ATD (Arrival Time Difference).
Figure 19. Detection of a strike by various sensors showing how the sferic arrives at each sensor at a different time.
Wave travels outwards
4
Strike location
Wave detected at sensorsin order of closeness to strike location
3
5
12
The time difference between the strike arriving at location one and location two is the Arrival Time Difference (ATD)
This ATD is different between one and two, compared to one and three, one and four and one and five (if one is chosen as the reference sensor)

If you choose one sensor as a reference, each of the other sensors will have an ATD relative to this. These ATDs are very specific values, meaning that there are only certain locations where a strike could occur and cause them.
These values when plotted on a map form a curve on the surface of the earth. If you plot the ATD of each of the sensors relative to the reference sensor on the same map, the place where all of the curves cross is the location of the thunderstorm.
Figure 20. ATD lines plotted on a map showing the location of a strike in Ireland. The reference sensor on this occasion is in the Shetland Islands, north of Scotland.
X
X
XSensor in the Shetland Islands acting as the reference station
Curve from the ATD at the Irish sensor
Curve from ATD at the Devon sensor
Curve from ATD at the Gibraltarsensor
Strike location
Sensor in Ireland
Sensor in Devon

How accurate in the system?
The system is designed with several quality control systems in place to stop incorrectly located strike locations from being displayed in products sent out to our customers. The false strike location rate must be kept low for our customers to maintain confidence in the system.
It is difficult to measure the actual accuracy of the system as there is not another way to measure global lightning besides satellite based systems. However, there are other countries with systems in place measuring more localised storms (usually within a range of approximately 200 km of the sensors) and we can compare our data to theirs, giving confidence that the locations that we are producing are correct.
The accuracy of the system is also calculated by the system as a theoretical value as part of the location calculation. These values show our average accuracy to be:
United Kingdom = 2.0-2.5 km
Western Europe = 2.0-3.0 km
Eastern Europe = 2.0-4.0 km
Eastern Atlantic = 10-15 km
Central Africa = approximately 20 km
South America = approximately 30 km
One of the main parameters of the system that has to be very accurate is the detected time of the lightning strike arriving at the sensor. As the sferic travels very close to the speed of light, the timing differences between even quite distant sensors is very small (1/100th of a second for two locations separated by 3,000km – equivalent to the distance between London and Egypt) and without very accurate timing, the calculations done to locate the strikes would be impossible.
As a result, the timing of each detected sferic is required to be accurate to at least 1/1,000,000 of a second. Because of this, the timing is done at each sensor using a precise time unit, all of which are synchronised with each other by satellite time signals (from the same satellites used for GPS navigation).

Other types of electrometeors
There are several other types of electrometeors, these are:
St Elmo’s Fire — a more or less continuous, luminous electrical discharge of weak or moderate intensity in the atmosphere, emanating from elevated objects at the Earth’s surface (lightning conductors, wind vanes, masts of ships) or from aircraft in flight (wing-tips etc.).
It is also seen on projecting objects on mountains. This phenomenon may be observed when the electrical field near the surface of objects becomes strong. According to some observations, the character of St Elmo’s Fire varies with the polarity of the electricity being discharged. The negative ‘fire’ is concentrated so that a structureless glow envelops an elongated object such as a mast or an aerial; the positive ‘fire’ takes the form of streamers about 10 cm long. It may also appear as luminous globes, a number of which are sometimes seen along the aerial. The colour of St Elmo’s Fire can be violet or greenish.
The phenomenon is also termed ‘corposant’ (corpo santo: holy body) because of its once-supposed supernatural nature.
Sprites — are electrical discharges that occur high above the cumulonimbus cloud of an active thunderstorm. They appear as luminous reddish-orange, plasma-like flashes, last longer than normal lower stratospheric discharges (typically around 17 milliseconds), and cause the discharges of positive lightning between the cloud and the ground. Sprites usually occur in clusters of two or more simultaneous vertical discharges, typically extending from 65 to 75 km (40 to 47 miles) above the Earth, with or without less intense filaments reaching above and below. Sprites are preceded by a sprite halo that forms because of heating and ionization less than 1 millisecond before the sprite. Sprites were first photographed on July 6, 1989, by scientists from the University of Minnesota and named after the mischievous sprite (air spirit) Ariel in Shakespeare’s ‘The Tempest’.
Blue Jets — these differ from sprites in that they project from the top of the cumulonimbus above a thunderstorm, typically in a narrow cone, to the lowest levels of the ionosphere 40 to 50 km (25 to 30 miles) above the earth. They are also brighter than sprites and, as implied by their name, are blue in colour. They were first recorded on October 21, 1989, on a video taken from the space shuttle as it passed over Australia.
Elves – these often appear as a dim, flattened, expanding glow around 400 km (250 miles) in diameter that lasts for, typically, just one millisecond. They occur in the ionosphere 100 km (60 miles) above the ground over thunderstorms. Their colour was a puzzle for some time, but is now believed to be a red hue. Elves were first recorded on another shuttle mission, this time recorded off French Guiana on October 7, 1990.

For more information about the Met Office, please contact the Customer Centre on:
Tel: 0870 900 0100 Fax: 0870 900 5050 Email: [email protected]
If you are outside the UK: Tel: +44 (0)1392 885680 Fax: +44 (0)1392 885681
All of the images used in this fact sheet along with many others covering all aspects of meteorology can be obtained from the National Meteorological Library.
For more information about what images available, please contact the Library Information Officer at:
Tel: 01392 884845 Email: [email protected]

Other titles in this series still available are:
• Number 1 Clouds
• Number 3 Water in the atmosphere
• Number 4 Climate of the British Isles
• Number 5 White Christmasses
• Number 6 The Beaufort Scale
• Number 7 Climate of South West England
• Number 8 The Shipping Forecast
• Number 9 Weather extremes
• Number 10 Air masses and weather fronts
• Number 11 Interpreting weather charts
• Number 12 National Meteorological Archive
• Number 13 Upper air observation and the tephigram
• Number 14 Microclimates
• Number 15 Weather radar
• Number 16 World climates
• Number 17 Weather observations

Met OfficeFitzRoy Road, ExeterDevon, EX1 3PBUnited Kingdom
Tel: 0870 900 0100Fax: 0870 900 [email protected] www.metoffice.gov.uk
Produced by the Met Office. © Crown copyright 2011 11/0434Met Office and the Met Office logo are registered trademarks
Our unique collection of weather images is now available via the National Meteorological Library and Archive’s online catalogue.
The collection illustrates all aspects of meteorology, from clouds and weather phenomena, to instruments and the work of the Met Office. Our online catalogue can be found at:
library.metoffice.gov.uk
All of the fact sheets in this series are available to download from our website
The full list can be found at:
www.metoffice.gov.uk/learning/library/factsheets