ti ti-83 plus conic graphing english www 21 feb 2001, … · ti-83 plus conic graphing english www...
TRANSCRIPT

11/6/02
TI-83 Plus
Conic Graphing
Getting StStart here
How To…Start and Qu
Use Conic W
Graph and T
ExamplesGraphing a C
Graphing an
More InfoDeleting Con
Error Recove
TI
arted
© 2000–2002 Texas Instruments
it Conic Graphing
indow and Conic Zoom
race a Conic Section
ircle Graphing a Hyperbola
Ellipse Graphing a Parabola
rmation ic Graphing Customer Support
ry Glossary

TI-83 Plus Conic Graphing Page 2
Important Information
Texas Instruments makes no warranty, either expressed or implied, including but not limited to any implied warranties of merchantability and fitness for a particular purpose, regarding any programs or book materials and makes such materials available solely on an “as-is” basis.
In no event shall Texas Instruments be liable to anyone for special, collateral, incidental, or consequential damages in connection with or arising out of the purchase or use of these materials, and the sole and exclusive liability of Texas Instruments, regardless of the form of action, shall not exceed the purchase price of this item or material. Moreover, Texas Instruments shall not be liable for any claim of any kind whatsoever against the use of these materials by any other party.
Graphing product applications (Apps) are licensed. See the terms of the license agreement for this product.
Windows, NT, Apple, and Mac are trademarks of their respective owners.

TI-83 Plus Conic Graphing Page 3
Where to Find Installation InstructionsYou can find detailed instructions on installing this and other free Flash applications in the guides section of education.ti.com. Follow the link to Flash Installation Instructions.
Installing this application requires TI�GRAPH LINKË software and link cable. You can purchase a link cable from the online store. After you enter the store, follow the links to Computer Software, then TI-GRAPH LINK.
You can download a free copy of the latest version of TI�GRAPH LINK software from the software section of education.ti.com. Follow the links to Connectivity Software, then TI-GRAPH LINK.

What is Conic Graphing?Conic Graphing is a TI�83 Plus calculator software application that you can use to graph the four basic conic sections. The conic equations can be in function, parametric, and polar forms.
Conic Graphing does not address degenerate cases of conic sections where the plane passes through the vertex resulting in a point, line, or two intersecting lines.
se le Parabola Hyperbola
EllipTI-83 Plus Conic Grap
Circ
hing Page 4

TI-83 Plus Conic Graphing Page 5
Starting and Quitting Conic Graphing
Starting Conic Graphing Quitting Conic Graphing
1. Press n to display the list of applications on your calculator.
2. Press ` or h to move the cursor to Conics and press ¯. The CONICS main menu is displayed.
From the CONICS main menu:
Select QUIT.
From any other screen:
Press \ [QUIT].
Values you input in Conic Graphing are saved in an application variable (AppVar) when you exit the application. The next time you run the application, the last values you entered will be displayed.

TI-83 Plus Conic Graphing Page 6
Getting StartedWork through this exercise to become familiar with the basic features of the Conic Graphing application. In this exercise, you trace the trajectory of Haley’s comet.
One of the more common uses of conics is to show the orbits of planets and other astronomical bodies. Planets have closed orbits that are almost circular, while comets have highly elliptical orbits. For example, Haley’s comet follows a long path out from the sun, but passes very close to the sun when it returns to the solar system. It has a major axis of 36.18 astronomical units, and an eccentricity of 0.97 (Larsen, Hostetler, and Edwards. 1997, 821). You can use Conic Graphing to trace the trajectory of Haley’s comet.
Note To complete this exercise, you need to set your calculator to radian mode before you start the Conics application. To do this:
1. Press ].
2. Move the cursor to Radian, and press ¯.
3. Press s to exit the mode screen.

TI-83 Plus Conic Graphing Page 7
1. We know the following: r = 2ep
1+e sin T , e = 0.97, and
2a ≈ 36.18. Find p, the halfway point of the distance from the focus to the directrix.
r1 =
2sin1
2π
e
ep
+r2 =
23
sin1
2π
e
ep
+
2a ≈ 36.18 ≈ r1 + r2, then
36.18 ≈
2sin1
2π
e
ep
++
23
sin1
2π
e
ep
+
Thus, p = .551
2. Select ELLIPSE from the CONICS main menu.
3. Press ] to display the CONIC SETTINGS screen.
4. Select POL to change the mode to polar.
5. Select Man so that you can manually change window settings.
6. Select ESC to return to the ELLIPSE screen.
7. Press h to select equation 4, R = 2ep
1 + e sin (T) .

TI-83 Plus Conic Graphing Page 8
8. Enter these parameters for e and p, as defined above in step 1: e = 0.97, p = .551
9. Press T to display the CONIC ZOOM screen.
10. Select Zoom Conic so that the aspect ratio on the screen is square. The graph of the ellipse is drawn.
The center (0, S2 ) is
the sun. The graph shows the path around the sun.
To see this graph, press T, and select ZStandard, then press T, and select ZoomIn. Press ¯ with the cursor near the origin.
TI-83 Plus Conic Graphing Page 9
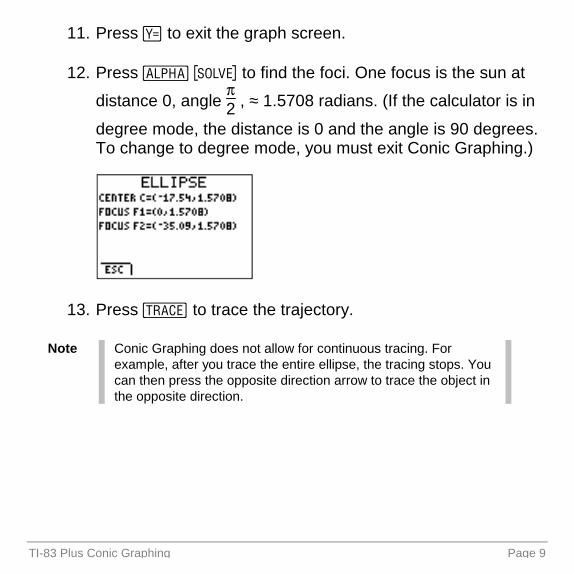
11. Press R to exit the graph screen.
12. Press e ? to find the foci. One focus is the sun at
distance 0, angle S2 , ≈ 1.5708 radians. (If the calculator is in
degree mode, the distance is 0 and the angle is 90 degrees. To change to degree mode, you must exit Conic Graphing.)
13. Press U to trace the trajectory.
Note Conic Graphing does not allow for continuous tracing. For example, after you trace the entire ellipse, the tracing stops. You can then press the opposite direction arrow to trace the object in the opposite direction.

TI-83 Plus Conic Graphing Page 10
Variables Used or Modified by the ApplicationConic Graphing modifies various calculator and window variables.
• Y-vars in the list below are modified, but are not restored when you exit the application.
• Real number variables in the list below are modified, but are restored after you exit the application.
• If any of the variables were archived, Conic Graphing unarchives them, but does not archive them again after you exit the application.
Variable type Variables used or modified
Y-vars Parametric equation editor: X1T, Y1T, X2T, Y2T
Polar equation editor: r1
Real number variables
A, B, C, D, E, F, G, H, J, K, L, M, N, O, P, Q, R, S, T, U, W, X, Y, Z, T
See the TI�83 Plus manual Getting Started section for more information about variables.

TI-83 Plus Conic Graphing Page 11
Conic SettingsYou can graph conic sections in function, parametric, or polar mode, based on your requirements. The Conic Graphing application restores the calculator to the original mode (before you started the application) when you exit the application.
Graphing Mode Description
FUNC (function) Plots functions where Y is a function of X
PAR (parametric) Plots relations where X and Y are functions of T
POL (polar) Plots functions where R is a function of TYou can also select automatic or manual window settings.
• Automatic changes the viewing window settings so that the conic section is displayed, no matter where it is on the graph. You cannot access window or zoom settings to change them manually.
• Manual allows you to change the window and zoom settings manually. If the conic section is graphed outside of the viewing window, you must manually change the settings so that it will be displayed in the viewing window.

TI-83 Plus Conic Graphing Page 12
From any Conic Graphing screen:
1. Press ]. The CONIC SETTINGS screen is displayed.
2. Press a or _ to highlight a graphing type mode and press ¯ to select it.
3. Press h to move to WINDOW SETTINGS.
4. Press a or _ to highlight AUTO (automatic) or MAN (manual) and press ¯ to select it.
5. Press R to select ESC to save the settings and return to the previous screen.

TI-83 Plus Conic Graphing Page 13
Conic Graphing Options
Selecting Options
To select an option at the bottom of a Conic Graphing screen, press the graphing key directly below the option.
• Select INFO to display the information screen, which contains the application version number.
• Select QUIT to exit Conic Graphing.
• Select ESC to go back one screen.
R S T U V R S T U V
Press a graphing key to select an option.

TI-83 Plus Conic Graphing Page 14
Window and Zoom Settings
CONIC WINDOW
The CONIC WINDOW settings screen allows you to modify the window characteristics. This screen is similar to the calculator’s window settings screen. You can change individual window parameters as needed.
1. Make sure that the conic graphing type mode is set correctly (to function, parametric, or polar, depending on what the equation requires).
2. Make sure the window settings mode is set to MAN.
3. Select a conic section from the CONICS main menu: CIRCLE, ELLIPSE, HYPERBOLA, or PARABOLA.
4. Select an equation.
Note • You can only access the CONIC WINDOW screen after you have selected an equation to graph.
• You can only access the CONIC WINDOW screen if the mode is set to MAN.
5. Set the parameters (for example, provide H, K, and R for the first circle equation in function mode).

TI-83 Plus Conic Graphing Page 15
6. Press S.
7. Change the window parameters as needed.
8. Press R to return to the previous screen.
Graphing Mode
Window Parameter
Description
All modes Xmin Smallest x value to be displayed in the viewing window
Xmax Largest x value to be displayed in the viewing window
Xscl Spacing between the tick marks on the x-axis
Ymin Smallest y value to be displayed in the viewing window
Ymax Largest y value to be displayed in the viewing window
Yscl Spacing between the tick marks on the y-axis
Parametric mode
Tmin Smallest T value (step) to evaluate

TI-83 Plus Conic Graphing Page 16
Graphing Mode
Window Parameter
Description
Tmax Largest T value to evaluate
Tstep Step increment
Polar mode (ellipse equations and circle equations 1 and 2)
Tmin Smallest T value (angle) to evaluate in radians/degrees
Tmax Largest T value to evaluate in radians/degrees
Tstep T increment in radians/degrees
Conic Graphing allows you to graph a partial conic section. To do this, you must modify Tmin, Tmax, or Tstep (in parametric mode) or Tmin, Tmax, or Tstep (in polar mode, for the ellipse and circle equations 1 and 2 only).

TI-83 Plus Conic Graphing Page 17
CONIC ZOOM
The CONIC ZOOM settings screen allows you to adjust the viewing window of the graph quickly. This screen is similar to the calculator’s zoom settings screen. Zoom settings that do not apply to conic sections are not displayed.
Zoom Conic is a new zoom setting that applies only to Conic Graphing. It changes the viewing window so that you can see the important characteristics of the conic section, regardless of the conic section’s position on the graph. The following table describes how Conic Graphing changes the calculator default variables, based on the zoom setting you choose.
Note • You can only access the CONIC ZOOM screen after you have selected an equation to graph.
• You can only access the CONIC ZOOM screen if the mode is set to MAN.

TI-83 Plus Conic Graphing Page 18
Zoom Parameter
Description
Zoom Conic Changes the zoom parameters so that you can see the important characteristics of the conic section in the viewing window, regardless of conic section’s position on the graph. Also, changes the viewing window so that #X=#Y, which makes the graph of a circle look like a circle. (Otherwise, it would look like an ellipse.)
Zoom In Magnifies the graph around the cursor.
Zoom Out Views more of the graph around the cursor.
ZBox Draws a box to define the viewing window.
ZSquare Changes the viewing window based on the current window variables so that #X=#Y, which makes the graph of a circle look like a circle. (Otherwise, it would look like an ellipse.) The midpoint of the current graph (not the intersection of the axes) becomes the midpoint of the new graph.
ZStandard Sets the standard window variables: Xmin = 110, Xmax = 10, Ymin = 110, Ymax = 10.

TI-83 Plus Conic Graphing Page 19
To see how different zoom settings affect the graph:
1. Make sure that the conic mode is set correctly (to function, parametric, or polar, depending on what the equation requires).
2. Select a conic section from the CONICS main menu.
3. Select an equation.
4. Enter values for each of the required parameters listed. Use ` and h to move from one parameter to the next.
Tip If you enter a value that is invalid for the specific equation, an error screen displays when you attempt to graph the conic section.
5. Press T.
6. Select Zoom Conic and view the graph.
7. Press T.
8. Select other zoom settings to see the differences in the graph. The graph is displayed after a zoom setting is selected (except for zoom settings that require another entry, such as Zoom In or Zoom Out).

TI-83 Plus Conic Graphing Page 20
Graphing a Conic SectionWhen you graph a conic section, you select an equation and input values for the parameters. For example, if you select the circle equation (X1H)2 + (Y1K)2 = R2, you input values for H, K, and R.
Keep the following points in mind when you input the parameters:
• Conic Graphing only supports real numbers; complex numbers are not supported.
• You can input a value with an unlimited number of digits, but Conic Graphing displays a rounded number to 14 digits.
• Conic Graphing works with 12-digit accuracy for all computations performed.
TI-83 Plus Conic Graphing Page 21
When you enter parameters, you can access the MATH (o), TEST (\ �) and VARS (r) menus. (For example, you might want to use the cube root or absolute value options from the MATH menu or test a value using an option from the TESTmenu.) However, when you display either of these menus, both the graphing keys and their secondary functions are ignored. Menu options that are not applicable to Conic Graphing are also ignored. To return to Conic Graphing from these menus, press s.
Caution If you press \ � to exit the MATH, TEST, or VARS menu, you will exit the Conic Graphing application.
To graph a conic section:
1. Make sure the conic mode is set appropriately for your equation.
2. Select a conic section from the CONICS main menu.
3. Select an equation for the conic section.
Tip A conic section may have more than one equation option for each mode. If an arrow appears below the equation number, you can press h to see more equations.
TI-83 Plus Conic Graphing Page 22
4. Enter values for each of the required parameters listed. Press ¯ to move the cursor to the next parameter. You can also press ` and h to move from one parameter to the next.
Note The number and type of required parameters change, depending on the equation you select and on the conic mode setting.If you enter an invalid value, an error message is displayed.
5. Press V to graph the conic section.
Note Plot selections (Plot1, Plot2, Plot3) are disabled in Conic Graphing.
6. Press R to escape from the graph screen. (The ESC option is not displayed on the graph screen, but is still available.)

TI-83 Plus Conic Graphing Page 23
Tracing a Conic Section
1. Press U. A cursor appears on the conic section.
2. Press _ or a to trace along the conic section.
Note • Press ` or h to move from one part of a hyperbola to the other.
• Conic Graphing does not allow for continuous tracing. For example, after you trace an entire circle, the tracing stops. You can then press the opposite direction arrow to trace the object in the opposite direction.
Using Free Trace
Conic Graphing does not have a free trace feature. However, you can use a zoom option to simulate a free trace.
1. Graph a conic section.
2. Press T.
3. Select Zoom In, Zoom Out, or Zbox.A free cursor is on the screen.

TI-83 Plus Conic Graphing Page 24
4. Use _, `, a, h to move the cursor around on the screen.
5. Press R to escape from the graph.
Note Zoom In, Zoom Out, or Zbox options place a free cursor on the screen because each is waiting for you to position the cursor and press ¯ so that the zoom can be carried out. Do not press ¯ unless you want to carry out that zoom feature.Press V to clear the cursor and coordinates from the screen without exiting the graph.

TI-83 Plus Conic Graphing Page 25
Finding Characteristics of Conic Sections
After you enter the values for each of the required variables, you can display information for the conic equation. Press e? to display the solution.
Note You can only press e ? to display the solution from the equation screen.
e ?

TI-83 Plus Conic Graphing Page 26
Graphing Examples
Circles
Definition Calculator mode
Equations
A circle is the set of points in a plane whose distance from a given fixed point in the plane is constant. The fixed point is the center of the circle; the constant distance is the radius.
Function (X1H)2 + (Y1K)2 = R2
AX2 + AY2 + BX + CY+ D = 0
(X-2)2 + (Y-2)2 = 25: Parametric
Polar
X = R cos (T) + H
Y = R sin (T) + K
R = 2A cos (T)
R = 2A sin (T)
A2 = B2 + R2 1 2BR cos (T1b)
Center (2,2)
Radius 5

TI-83 Plus Conic Graphing Page 27
Example
Graph an arc of a circle with radius = 8 whose center is at (0,0), using parametric mode.
Note To complete this exercise, you need to set your calculator to radian mode before you start the Conic Graphing application. To do this:
1. Press ].
2. Move the cursor to Radian, and press ¯.
3. Press s to exit the mode screen.
Steps:
1. Start the Conic Graphing application.
2. Select CIRCLE from the CONICS main menu.
3. Press ] to display the CONIC SETTINGS screen.
4. Select PAR to change the mode to parametric.
5. Select MAN so that you can manually change window settings.

TI-83 Plus Conic Graphing Page 28
6. Select ESC to return to the CIRCLE screen.
7. Select the equation X = R cos (T) + HY = R sin (T) + K
8. Enter the values for H, K, and R [(0,0) and 8], as defined in the problem.
9. Press T to display the CONIC ZOOM screen.
10. Select Zoom Conic so that the circle will be displayed correctly. (Otherwise, the circle may look like an ellipse.) The graph of the circle is drawn.
11. Press S to change the CONIC WINDOW settings.
12. Change the following parameters:Tmin = 0
Tmax = S2 (In degree mode, Tmax = 90. To change to degree
mode, you must exit Conic Graphing.)

TI-83 Plus Conic Graphing Page 29
13. Press V to graph the arc.You can change the Tmin and Tmax values to display the graph of the arcs in different quadrants.

TI-83 Plus Conic Graphing Page 30
Ellipses
Definition Calculator mode
Equations
An ellipse is the set of points whose distances from two fixed points in the plane have a constant sum. The two fixed points are the foci of the ellipse. The line through the foci of an ellipse is the ellipse's focal axis. The point on the axis halfway between the foci is the center. The points where the focal axis and ellipse intersect are the ellipse's vertices.
X2
25 + (Y-2)2
4 = 1:
Function
Parametric
(X1H)2
A2 + (Y1K)2
B2 = 1
(X1H)2
B2 + (Y1K)2
A2 = 1
X = A cos (T) + HY = B sin (T) + K
X = B cos (T) + HY = A sin (T) + K
Polar R = 2ep
11e cos (T)
R = 2ep
1 + e cos (T)
R = 2ep
11e sin (T)
R = 2ep
1 + e sin (T)Minor axis
Center (0,2)
Major axis
Focal axis
Vertex
Focus (-4.583,2)
Vertex
Focus (4.583,2)

TI-83 Plus Conic Graphing Page 31
Example
The planet Pluto moves in an elliptical orbit with the sun at one of the foci. Pluto’s orbit has an aphelion (distance farthest from the sun) of 7304.33 4 106 km and a perihelion (distance nearest to the sun) of 4434.99 4 106 km (NASA Goddard. 2001). Graph the shape using the polar form.
Note To complete this exercise, you need to set your calculator to radian mode before you start the Conic Graphing application. To do this:
1. Press ].
2. Move the cursor to Radian, and press ¯.
3. Press s to exit the mode screen.

TI-83 Plus Conic Graphing Page 32
Steps:
1. Determine the semi-major and semi-minor axes.One astronomical unit = 149.6 4 106 kmAphelion = 7304.33 3 149.6 = 48.83 AUPerihelion = 4434.99 3 149.6 = 29.65 AU
Semi-major axis (which is A) = 48.83 + 29.65
2 = 39.24
Semi-minor axis (which is B): 22 BA − = A 1 29.65, then22 B(39.24) − = 39.24 1 29.65. then
1539.776 1 B2 = (9.59)2, thenB2 = 1539.776 - (9.59)2, thenB = 1447.8095 = 38.05
2. Determine the eccentricity:
e = A
BA 22 −=
39.24(38.05)(39.24) 22 −
= .24
3. Determine the distance from the focus to the directrix, or p.
p = 22
2
BA
B
−3 2 = 75.48
4. Start the Conic Graphing application.

TI-83 Plus Conic Graphing Page 33
5. Select ELLIPSE from the CONICS main menu.
6. Press ] to display the CONIC SETTINGS screen.
7. Select POL to change the mode to polar.
8. Select MAN so that you can manually change window settings.
9. Select ESC to return to the ELLIPSE screen.
10. Select the equation R = 2ep
111e cos (TT)
11. Enter the values for e and p, as defined above in steps 2 and 3.
12. Press e ? to find the center and foci.
13. Press S to change the CONIC WINDOW settings.

TI-83 Plus Conic Graphing Page 34
14. Change the following parameters (determined by using the major and minor axis information):TTmin = 0TTmax = 2STTstep =
2S32
Xmin = 130Xmax = 48Xscl = 5Ymin = 145Ymax = 45Yscl = 5

TI-83 Plus Conic Graphing Page 35
15. Press V to graph the orbit.
16. Press U to trace the orbit.
Note Conic Graphing does not allow for continuous tracing. After you trace the entire orbit, the tracing stops. You can then press the opposite direction arrow key to trace the orbit in the opposite direction.
Pluto’s orbit around the sun is elliptical, as you would expect. However, it is almost circular. This graph is exaggerated because we did not change the aspect ratio. You can select Zoom Conic to see an unexaggerated graph of Pluto’s almost circular orbit.

TI-83 Plus Conic Graphing Page 36
Hyperbolas
Definition Calculator mode
Equations
A hyperbola is the set of points in a plane whose distances from two fixed points in the plane have a constant difference. The two fixed points are the foci of the hyperbola. The line through the foci of the hyperbola is the focal axis. The point on the axis halfway between the foci is the hyperbola's center. The points where the focal axis and hyperbola cross are the vertices.
(X13)2
9 1 (Y12)2
9 = 1:
Function
Parametric
(X1H)2
A2 1 (Y1K)2
B2 = 1
(Y1K)2
A2 1 (X1H)2
B2 = 1
X = A sec (T) + HY = B tan (T) + K
X = B tan (T) + HY = A sec (T) + K
Polar R = 2ep
11e cos (T)
R = 2ep
1+e cos (T)
R = 2ep
11e sin (T)
R = 2ep
1+e sin (T)Focal axis
Center (3,2)
Focus (7.243,2)Focus (-1.243,2)
Vertices (0,2) and (6,2)

TI-83 Plus Conic Graphing Page 37
Example
A lamp with an opaque cylindrical shade 1.5 feet in diameter, 2 feet high has a light bulb located at the center of the shade. It casts a shadow, which is of the form of a hyperbola, on a wall 3 feet from the bulb and parallel to the shade. Assume the origin is at the light bulb. Find the vertices, foci, and slope of the asymptotes of the hyperbola.
Steps:
The equation of the cone of light is 16X2
9 + 16Z2
9 1 Y2 = 0.
The equation of the wall is: Z = 3.
1. Substitute z into the equation and solve:16X2
9 + 16(3)2
9 1 Y2 = 0
16X2
9 1 Y2 = -16
Y21 16X2
9 = 16
Y2
16 1 X2
9 = 1

TI-83 Plus Conic Graphing Page 38
2. Start the Conic Graphing application.
3. Select HYPERBOLA from the CONICS main menu.
4. Press ] to display the CONIC SETTINGS screen.
5. Select FUNC to change the mode to functional.
6. Select MAN so that you can manually change window settings.
7. Select ESC to return to the HYPERBOLA screen.
8. Select the equation(Y11K)2
A2 11 (X11H)2
B2 = 1
9. Enter the values for A, B, H and K. From the solution in step 1, we know that A2 = 16, B2 = 9 so that A = 4, B = 3. The problem states that the light bulb is at the origin, so (H,K) is (0,0).

TI-83 Plus Conic Graphing Page 39
10. Press e ? to find the center, vertices, foci, and slope of the asymptotes.
11. Press T to change CONIC ZOOM settings.
12. Select Zoom Conic. The graph of the shape of the shadow is drawn.

TI-83 Plus Conic Graphing Page 40
Parabolas
Definition Calculator mode
Equations
A set that consists of all the points in a plane equidistant from a given fixed point and a given fixed line in the plane is a parabola. The fixed point is the focus of the parabola. The fixed line is the directrix. The point where the focal axis intersects the parabola is the vertex.
(Y12)2 = 8 (X13):
Function
Parametric
(Y1K)2 = 4P(X1H)
(X1H)2 = 4P(Y1K)
X = AT2 + HY = T + K
X = T + HY = AT2 + K
Polar
R = 2ep
11e cos (T)
R = 2ep
1+e cos (T)
R = 2ep
11e sin (T)
R = 2ep
1+e sin (T)
Vertex (3,2)
Directrix X=1
Focus (5,2)Focal axis

TI-83 Plus Conic Graphing Page 41
Example
Given the equation of projectile motion and necessary values, find the focus and directrix of the path of the projectile (parabola).
Assume a ball is thrown with a velocity of 65 ft/sec at an angle of T = tan11 (3/4). Assume that the gravitational force is g = 32 ft/sec2.
Equations of a projectile in motion:
Givens:
X = V0 cos (T) T V0 = 65 ft/sec
Y= V0 sin (T) T 1 12 GT2 G = 32 ft/sec2
From T = tan11 (3/4):
cos (T) = 45
sin (T) = 35

TI-83 Plus Conic Graphing Page 42
Steps:
1. Solve for X and Y.
X = 65
54
TX = 52T, then
T = X52 , then
Y = 65
53
T 1
21
32 T2, thenY = 39T 1 16T2
Substitute X52 for T: Y = 39
52X 1 16
2
52X
Complete the square:
2
8507
-X
= 1 169
2
641521
-Y
2. Start the Conic Graphing application.
3. Select PARABOLA from the CONICS main menu.
4. Press ] to display the CONIC SETTINGS screen.
5. Select PAR to change the mode to parametric.

TI-83 Plus Conic Graphing Page 43
6. Select MAN so that you can manually change window settings.
7. Select ESC to return to the PARABOLA screen.
8. Select the equation X = T + HY = AT2 + K
9. Enter the values for A, H and K:
A = / 1169 H =
5078 K =
152164
10. Press T to display the CONIC ZOOM window.
11. Select Zoom Conic. The graph is displayed.
12. Press R to escape from the graph screen.

TI-83 Plus Conic Graphing Page 44
13. Press e ? to find the vertex, focus, and directrix.
14. Press S to change the CONIC WINDOW settings.
15. Change the following variables to see the graph from the origin.Xmin = 0Xmax = 125Xscl = 5Ymin = 0Ymax = 25Yscl = 5
TI-83 Plus Conic Graphing Page 45
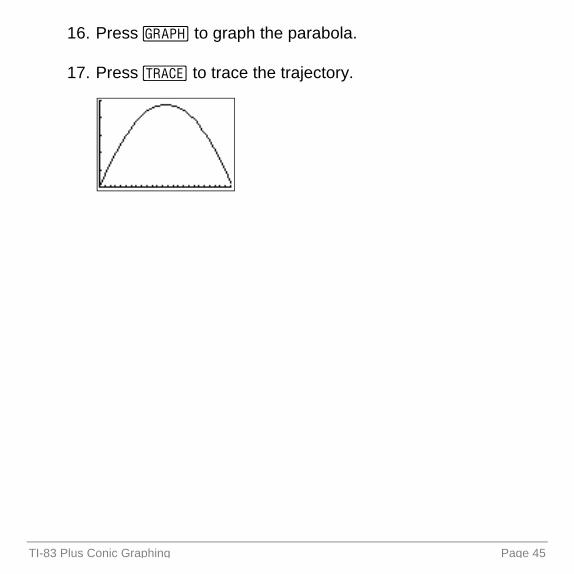
16. Press V to graph the parabola.
17. Press U to trace the trajectory.

TI-83 Plus Conic Graphing Page 46
GlossaryTerm Definition
Asymptote A straight line associated with a curve such that as a point moves along an infinite branch of the curve, the distance from the point to the line approaches zero and the slope of the curve at the point approaches the slope of the line.
Center A point that is related to a geometrical figure in such a way that for any point on the figure there is another point on the figure such that a straight line joining the two points is bisected by the original point.
Circle A closed plane curve in a plane whose distance from a given fixed point in the plane is constant.
Directrix A straight line the distance to which from any point of a conic section is in fixed ratio to the distance from the same point to a focus.
Eccentricity A mathematical constant that for a given conic section is the ratio of the distances from any point of the conic section to a focus and the corresponding directrix.
Ellipse A closed plane curve generated by a point moving in such a way that the sums of its distances from two fixed points is a constant.
Focus One of the fixed points that with the corresponding directrix defines a conic section (plural: foci).

TI-83 Plus Conic Graphing Page 47
Term Definition
Hyperbola A plane curve generated by a point so moving that the difference of the distances from two fixed points is a constant.
Major axis The axis passing through the foci of an ellipse.
Minor axis The chord of an ellipse passing through the center and perpendicular to the major axis.
Parabola A plane curve generated by a point moving so that its distance from a fixed point is equal to its distance from a fixed line (directrix).
Semi-major axis
One half of the major axis of an ellipse (as that formed by the orbit of a planet).
Semi-minor axis
One half of the minor axis of an ellipse (as that formed by the orbit of a planet).
Slope The tangent of the angle made by a straight line with the x-axis.
Vertex A point where an axis of a circle, ellipse, parabola, or hyperbola intersects the curve itself.

TI-83 Plus Conic Graphing Page 48
Deleting Conic Graphing from the TI-83 PlusTo delete the application from your calculator:
1. From the home screen, press \ ÅMEMÆ to display the MEMORY menu.
2. Select Mem Mgmt/Del.
3. Use h or ` to select Apps.
4. Use h or ` to highlight the application you want to delete with the cursor.
5. Press ^.
6. Select Yes.

TI-83 Plus Conic Graphing Page 49
Error Recovery Instructions
Conic Graphing Application Errors
If the curve does not display or a partial curve displays after you press V, the parameters you entered may be outside of the acceptable range for the calculator.
All Equations
If this error occurs or if you receive this error message…
Make this change:
The curve does not display correctly, or a partial curve displays.
The parameters you entered may be outside of the acceptable range for the calculator.
If you changed the CONIC SETTINGS window settings modeto MAN, press T and select Zoom Conic to redefine the window settings.
Window range error or zoom error Change the window parameters (Xmin, Xmax, Ymin, Ymax) so that the window is larger or smaller, depending on the graph.
Invalid input Change the input to a valid value.

TI-83 Plus Conic Graphing Page 50
If this error occurs or if you receive this error message…
Make this change:
Requested zoom has invalid results
Change the window parameters (Xmin, Xmax, Ymin, Ymax) orXfact and Yfact zoom factors. You must exit Conic Graphing to change the Xfact and Yfact zoom factors.
Invalid AppVar CONICSD. Please remove.
The application variable (AppVar) named CONICSD has been corrupted, or another application variable uses the same name.
Delete the AppVar, or use TI-GRAPH LINK to remove it and save it on your computer.
Error saving Conics settings The AppVar CONICSD cannot be modified.
Delete the AppVar, or use TI-GRAPH LINK to remove it and save it on your computer.
TI-83 Plus Conic Graphing Page 51
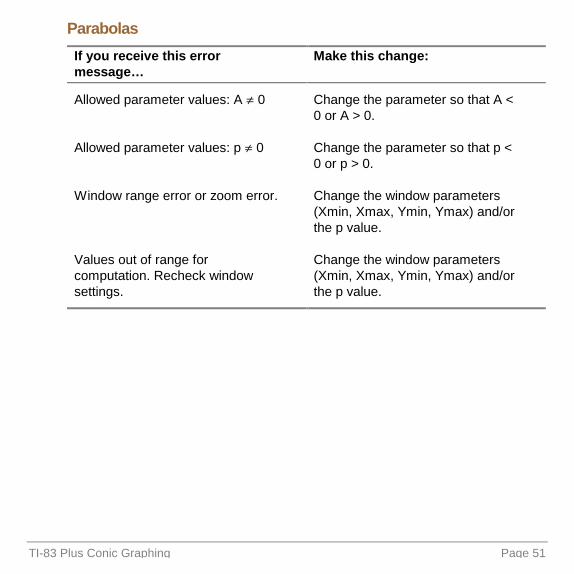
Parabolas
If you receive this error message…
Make this change:
Allowed parameter values: A e 0 Change the parameter so that A < 0 or A > 0.
Allowed parameter values: p e 0 Change the parameter so that p < 0 or p > 0.
Window range error or zoom error. Change the window parameters (Xmin, Xmax, Ymin, Ymax) and/or the p value.
Values out of range for computation. Recheck window settings.
Change the window parameters (Xmin, Xmax, Ymin, Ymax) and/or the p value.

TI-83 Plus Conic Graphing Page 52
Circles
If you receive this error message…
Make this change:
Allowed parameter values: R d 0 Change the parameter so that R d0.
Allowed parameter values: A d 0 Change the parameter so that A d0.
Values out of range for computation. Recheck window settings
Change the parameter so that b < 1E12 (occurs only in polar mode in equation 3).
Parameters create a non-real answer
Change the parameters so that for the equation AX2+AY2+BX+CY+D=0, the following is satisfied:
(-D/A) + (B/2A)2 + (C/2A)2 d 0
TI-83 Plus Conic Graphing Page 53
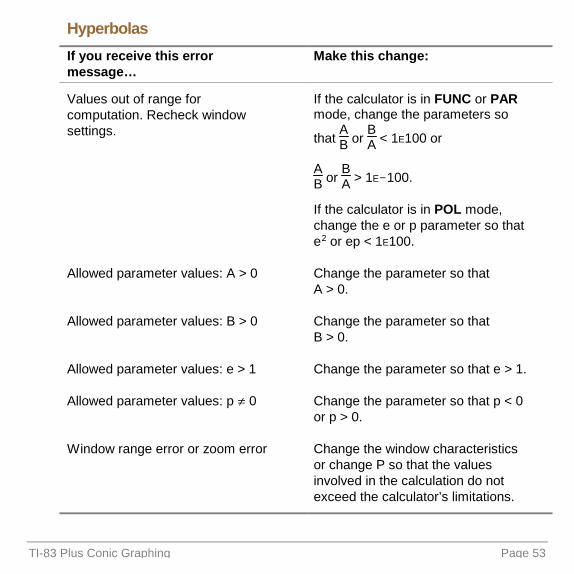
Hyperbolas
If you receive this error message…
Make this change:
Values out of range for computation. Recheck window settings.
If the calculator is in FUNC or PARmode, change the parameters so
that AB or
BA < 1E100 or
AB or
BA > 1E1100.
If the calculator is in POL mode, change the e or p parameter so that e2 or ep < 1E100.
Allowed parameter values: A > 0 Change the parameter so that A > 0.
Allowed parameter values: B > 0 Change the parameter so that B > 0.
Allowed parameter values: e > 1 Change the parameter so that e > 1.
Allowed parameter values: p e 0 Change the parameter so that p < 0 or p > 0.
Window range error or zoom error Change the window characteristics or change P so that the values involved in the calculation do not exceed the calculator’s limitations.

TI-83 Plus Conic Graphing Page 54
Ellipse
If you receive this error message…
Make this change:
Allowed parameter values:
0 < A < B
Change the parameter so that A > B and B > 0.
Values out of range for computation. Recheck window settings.
Change the parameter so that 0 < A < 1E50.
Allowed parameter values:0 < e < 1
Change the parameter so that e > 0 and e < 1.
Allowed parameter values: p e 0 Change the parameter so that p < 0 or p > 0.

TI-83 Plus Conic Graphing Page 55
Installation Error Messages
Low Battery Condition
Do not attempt to download a Flash application if the low-battery message appears on the calculator. Low battery indication is shown on the initial screen. If you receive this error during an installation, change the batteries before trying again.
Archive Full
This error occurs when the TI�83 Plus does not have sufficient memory for the application. In order to make room for another application, you must delete an application and/or archived variables from the TI�83 Plus. Before you delete an application from the TI�83 Plus, you can back it up by using the Link > Receive Flash Software menu in TI�GRAPH LINK for the TI�83 Plus. You can reload it to the TI�83 Plus later using the Link > Send Flash Software menu in TI�GRAPH LINK.

TI-83 Plus Conic Graphing Page 56
Computer to Calculator Communication Error
This error indicates that TI�GRAPH LINK is unable to communicate with the TI�83 Plus. The problem is usually associated with the TI�GRAPH LINK cable and its connection to the TI�83 Plus and/or to the computer. Make sure the cable is firmly inserted in the calculator I/O port and the computer. Verify that the correct cable type is selected in TI�GRAPH LINK.
If this does not correct the problem, try a different TI�GRAPH LINK cable and reboot your computer. If you continue to get this error, please contact TI�CaresË Customer Support for assistance.
Calculator to Calculator Communication Error
This problem is usually associated with the unit-to-unit cable and its connection between the TI�83 Plus calculators. Make sure the cable is firmly inserted in the I/O port of each calculator.
If you continue to get this error, please contact TI�Cares.
TI-83 Plus Conic Graphing Page 57
Invalid Signature or Certificate
Either this calculator does not have a certificate to run the application, or electrical interference caused a link to fail. Try to install the application again. If you continue to receive this error, contact TI�Cares.
Other Errors
See pages B-6 through B-10 in the TI�83 Plus manual for information about the specific error or contact TI�Cares.

TI-83 Plus Conic Graphing Page 58
Miscellaneous
Verify Operating System Version and ID Number
Conic Graphing is compatible with TI�83 Plus operating system 1.12 and higher.
To verify your operating system version number:
1. From the home screen, press \ /.
2. Select 1: ABOUT.
The operating system version number is displayed below the calculator name and has the format x.yy. The ID number appears on the line below the product number.

TI-83 Plus Conic Graphing Page 59
Verify Flash Application Version
1. Press n.
2. Select Conics.
3. Select INFO.
The version number appears on the information screen below the application name.
Check Amount of Flash Application Free Space
1. From the home screen, press \ /.
2. Select 2: MEM MGMT/DEL...
Conic Graphing requires at least 33,070 bytes of ARC FREE (Flash) to load the application and 1250 bytes of RAM to run the application.
There are approximately 160K bytes total archive memory in the TI�83 Plus, and 1.5M bytes in the TI�83 Plus Silver Edition. For more information about memory and memory management, refer to the TI�83 Plus manual.

TI-83 Plus Conic Graphing Page 60
Texas Instruments (TI) Support and Service Information
For general information
E-mail: [email protected]
Phone: 1-800-TI-CARES (1-800-842-2737)For US, Canada, Mexico, Puerto Rico, and Virgin Islands only
Home page: http://education.ti.com
For technical questions
Phone: 1-972-917-8324
For product (hardware) service
Customers in the US, Canada, Mexico, Puerto Rico, and Virgin Islands: Always contact TI Customer Support before returning a product for service.
All other customers: Refer to the leaflet enclosed with your product (hardware) or contact your local TI retailer/distributor.

TI-83 Plus Conic Graphing Page 61
Works CitedLarson, Roland E., Robert P. Hostetler, and Bruce Edwards.
1997. Precalculus with Limits: A Graphing Approach. 2d ed. Boston: Houghton Mifflin Company.
NASA Goddard Space Flight Center. 2001. Pluto Fact Sheet. Greenbelt, MD: Author. Retrieved February 9, 2001 from the Planetary/Lunar Sciences database of the National Space Science Data Center on the World Wide Web: http://nssdc.gsfc.nasa.gov/planetary/factsheet/plutofact.html.

TI-83 Plus Conic Graphing Page 62
End-User License AgreementBY INSTALLING THIS SOFTWARE YOU AGREE TO ABIDE BY THE FOLLOWING PROVISIONS.
1. LICENSE: Texas Instruments Incorporated (“TI”) grants you a license to use and copy the software program(s) (“License Materials”) contained on this diskette/CD/web site. You, and any subsequent user, may only use the Licensed Materials on Texas Instruments calculator products.
2. RESTRICTIONS: You may not reverse-assemble or reverse-compile the Licensed Materials. You may not sell, rent, or lease copies that you make.
3. COPYRIGHT: The Licensed Materials and any accompanying documentation are copyrighted. If you make copies, do not delete the copyright notice, trademark, or protective notices from the copies.
4. WARRANTY: TI does not warrant that the Licensed Materials or documentation will be free from errors or that they will meet your specific requirements. THE LICENSED MATERIALS ARE PROVIDED “AS IS” TO YOU OR ANY SUBSEQUENT USER.
5. LIMITATIONS: TI makes no warranty or condition, either expressed or implied, including but not limited to any implied warranties of merchantability and fitness for a particular purpose, regarding the Licensed Materials.
IN NO EVENT SHALL TI OR ITS SUPPLIERS BE LIABLE FOR ANY INDIRECT, INCIDENTAL, OR CONSEQUENTIAL DAMAGES, LOSS OF PROFITS, LOSS OF USE OR DATA, OR INTERRUPTION OF BUSINESS, WHETHER THE ALLEGED DAMAGES ARE LABELED IN TORT, CONTRACT, OR INDEMNITY.
SOME STATES OR JURISDICTIONS DO NOT ALLOW THE EXCLUSION OR LIMITATION OF INCIDENTAL OR CONSEQUENTIAL DAMAGES, SO THE ABOVE LIMITATION MAY NOT APPLY.
IF YOU AGREE TO BE BOUND BY THIS LICENSE, CLICK ON THE “ACCEPT” BUTTON; IF YOU DO NOT AGREE TO BE BOUND BY THIS LICENSE, CLICK ON THE “DECLINE” BUTTON TO EXIT THE INSTALLATION.

TI-83 Plus Conic Graphing Page 63
Page Reference
This PDF document contains electronic bookmarks designed for easy on-screen navigation. If you decide to print this document, please use the page numbers below to find specific topics.
Important Information............................................................................................2
Where to Find Installation Instructions..................................................................3
What is Conic Graphing? ......................................................................................4
Starting and Quitting Conic Graphing ...................................................................5
Getting Started ......................................................................................................6
Variables Used or Modified by the Application....................................................10
Conic Settings .....................................................................................................11
Conic Graphing Options......................................................................................13
Graphing a Conic Section ...................................................................................21
Graphing Examples.............................................................................................26
Glossary ..............................................................................................................46
Deleting Conic Graphing from the TI-83 Plus .....................................................48
Error Recovery Instructions.................................................................................49
Miscellaneous .....................................................................................................58
Texas Instruments (TI) Support and Service Information ...................................60
Works Cited ........................................................................................................61
End-User License Agreement .............................................................................62