tidal datums, navd 88, and coastal commission regs curt burfield, pls chief of survey standards...
TRANSCRIPT

Tidal Datums, NAVD 88, and Coastal Commission Regs
Curt Burfield, PLS
Chief of Survey StandardsCaltrans
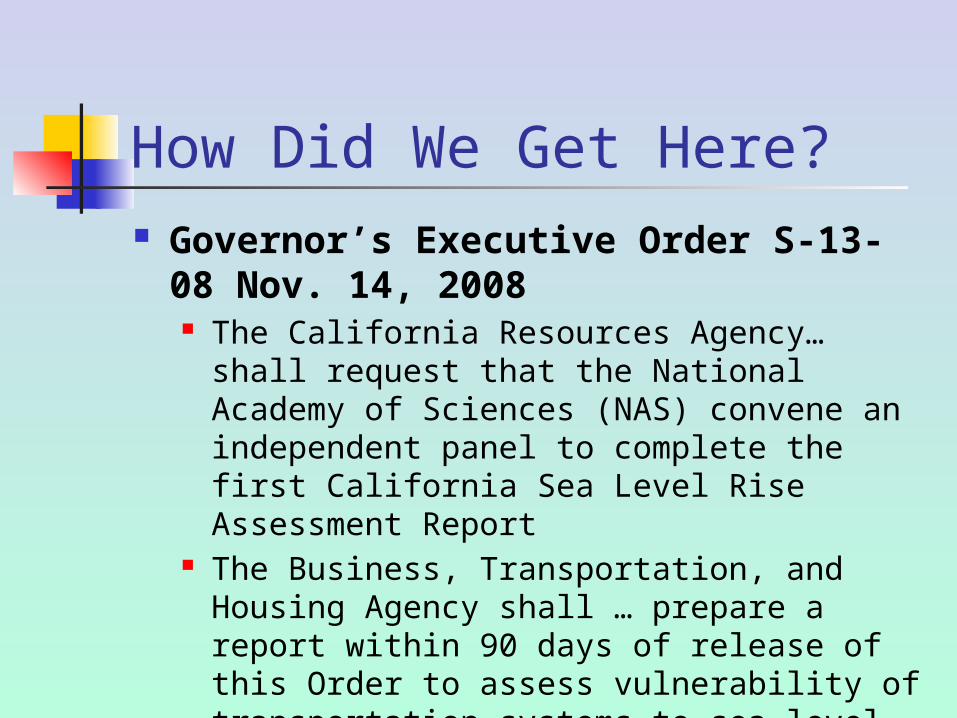
How Did We Get Here? Governor’s Executive Order S-13-08
Nov. 14, 2008 The California Resources Agency… shall
request that the National Academy of Sciences (NAS) convene an independent panel to complete the first California Sea Level Rise Assessment Report
The Business, Transportation, and Housing Agency shall … prepare a report within 90 days of release of this Order to assess vulnerability of transportation systems to sea level rise…

The $64,000 Question Caltrans’
Guidance on Incorporating Sea Level Rise – 2011 1. Request information from District
Surveys to evaluate existing vertical elevation data and benchmarks to determine the correlation between current sea level and planned facility elevations…

Outline Geodetic Datums Tidal Datums Tidal Stations and Data Sheets Matching Datums Using Tide
Stations VDatum (NOS Software) Sea Level Rise
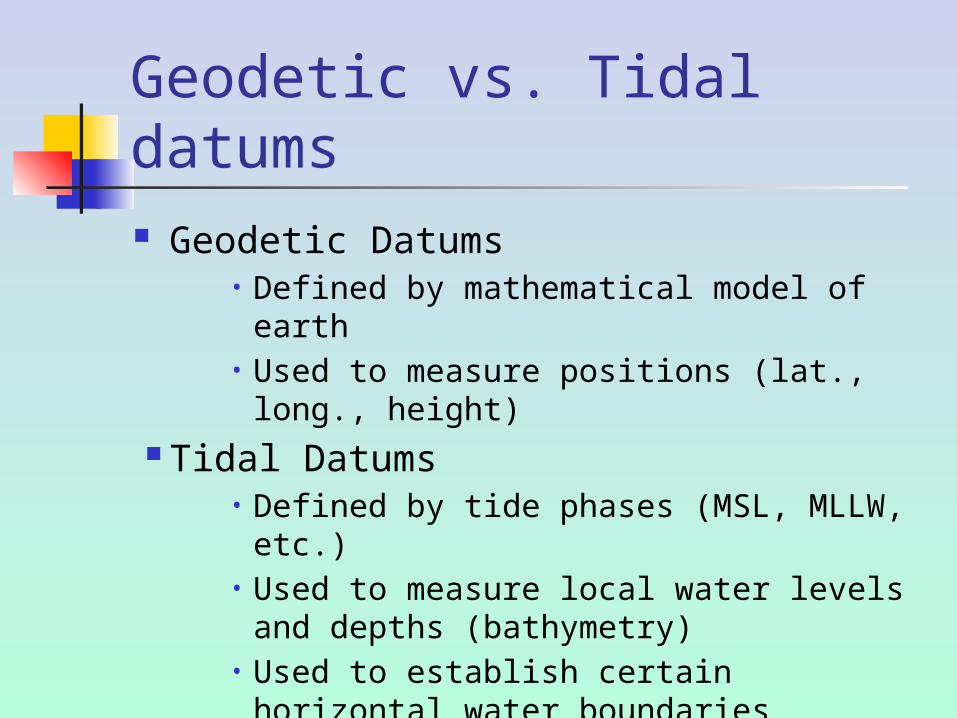
Geodetic vs. Tidal datums Geodetic Datums
• Defined by mathematical model of earth• Used to measure positions (lat., long.,
height) Tidal Datums
• Defined by tide phases (MSL, MLLW, etc.)• Used to measure local water levels and
depths (bathymetry) • Used to establish certain horizontal water
boundaries


Orthometric Heights*
* Everything you wanted to know about vertical datums
but were afraid to ask

9
The National Geodetic Vertical Datum of
1929 is referenced to 26 tide gauges in the
US and Canada
10
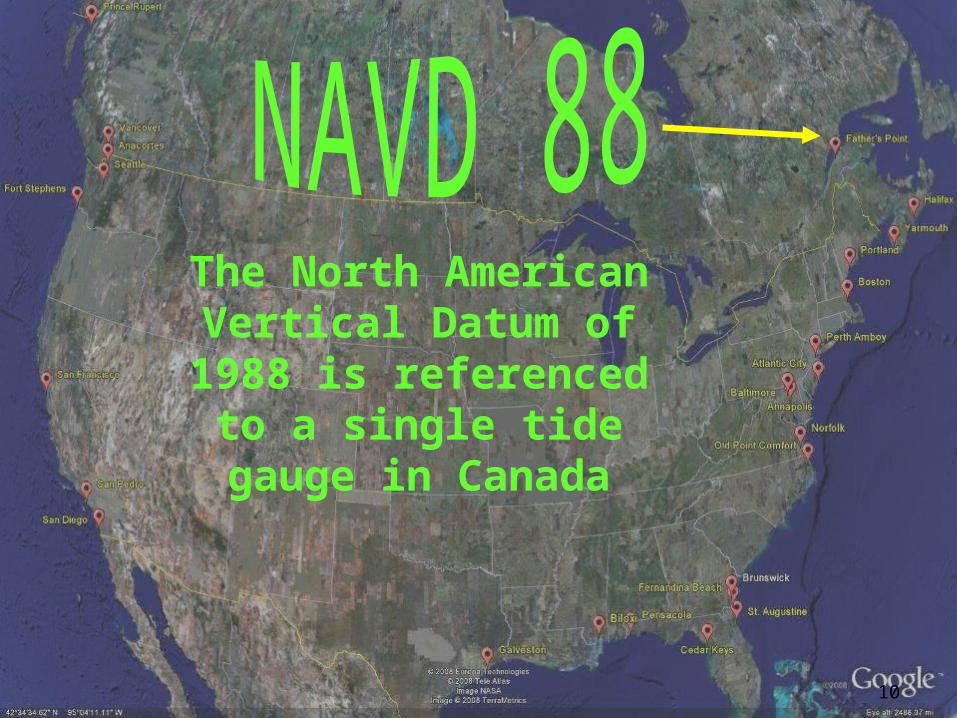
The North American Vertical Datum of 1988 is referenced to a
single tide gauge in Canada

11

12
Gravity Recovery And Climate Experiment (GRACE)
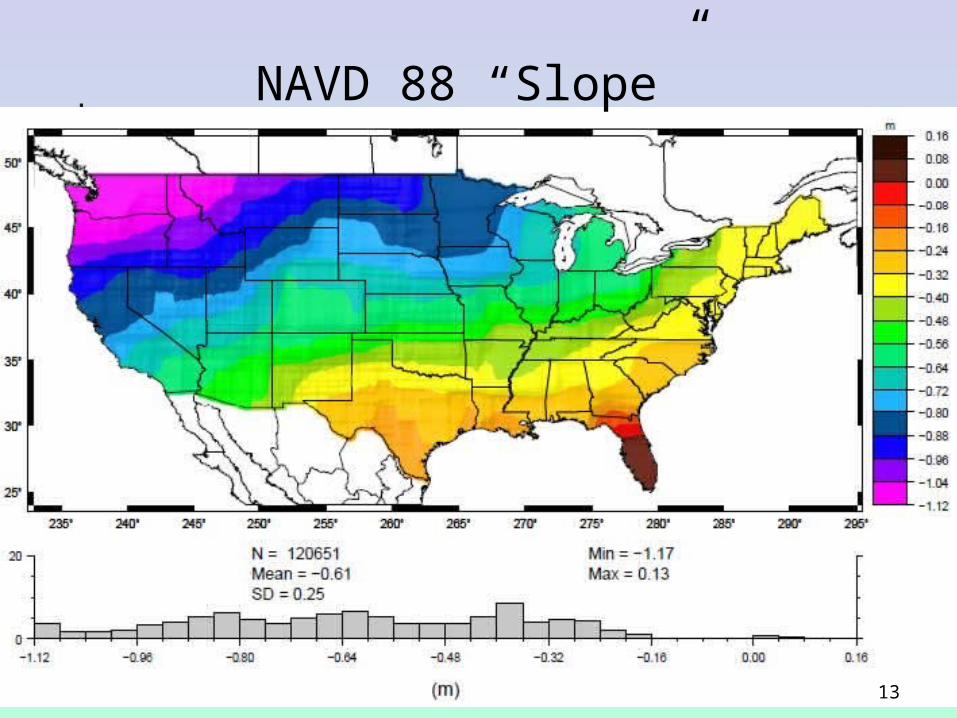
13
NAVD 88 “Slope”

Tidal Datums
Tide Gauges Tidal Benchmarks National Tidal Datum
Epochs Datums

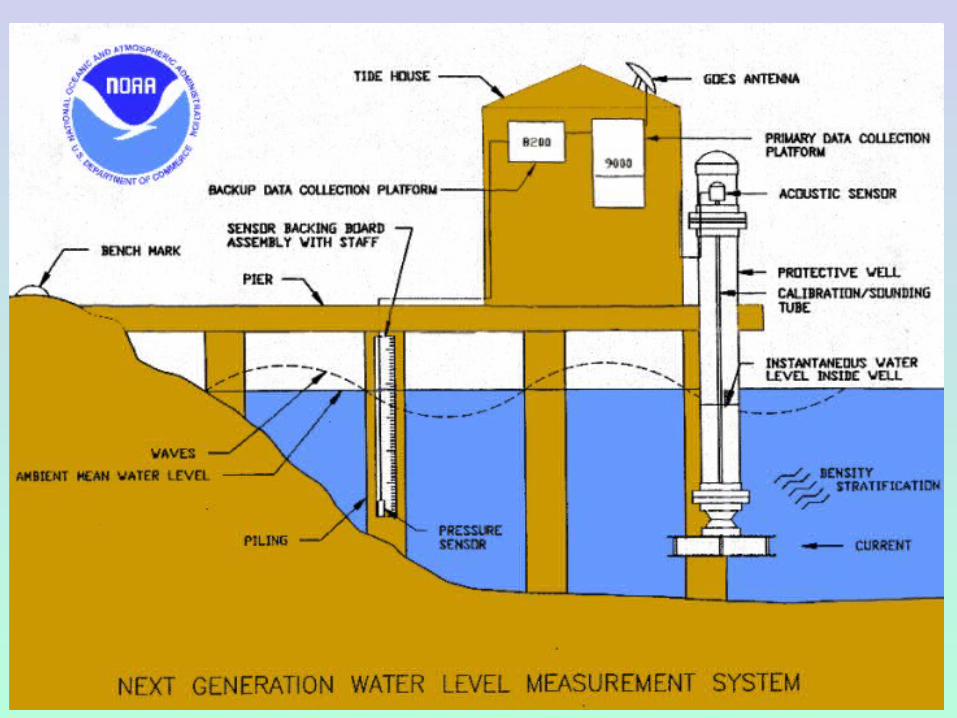
NWLON StationsEssential Equipment
• Automatic water level sensor• Backup water level sensor• Backup & Primary data collection platform• Protective well• Shelter• Solar Panel• GOES satellite radios• Telephone modem• Ancillary geophysical instruments• System of Bench Marks
• Data Collection Platform• Acoustic or pressure sensor• Solar Panel• GOES Transmitter
Short term stations
Control Stations
• Water Level• Wind Speed/Direction• Barometric Pressure• Air/Water Temp.• Conductivity/Temp• Chart Datum• Tsunami/Storm Surge
Observations Collected
15

6A specific 19 year period that includes the longest periodic tidal variations caused by the astronomic tide-producing forces.
6Averages out long term seasonal meteorological, hydrologic, and oceanographic fluctuations.
6 Provides a nationally consistent tidal datum network (bench marks) by accounting for seasonal and apparent
environmental trends in sea level that affects the accuracy of tidal datums.
6The NWLON provides the data required to maintain the epoch and make primary and secondary determinations of tidal datums.
NATIONAL TIDAL DATUM EPOCH

Types of Tides
Mixed Tide
Semidiurnal Tide
Diurnal Tide

MHHW

Tidal Datums Station Datum: Unique to each water
level station - Established at a lower elevation than the water is ever expected to reach. - Referenced to the primary bench mark at the station- Held constant regardless of changes to the water level gauge or tide staff MHHW: Mean Higher High Water The average height of the higher high
water of each tidal day observed over the NTDE MHW: Mean High Water
The average of all the high water heights observed over the NTDE
MTL: Mean Tide Level The arithmetic mean of mean high water
and mean low water MSL: Mean Sea Level or LMSL: Local
Mean Sea Level The arithmetic mean of HOURLY heights
observed over the NTDE MLW: Mean Low Water The average of all the low water heights
observed over the NTDE MLLW: Mean Lower Low Water The average of the lower low water
height of each tidal day observed over the NTDE
GT: Great Diurnal Range The difference in height between mean
higher high water and mean lower low water
Higher High Water
20

Tide Station Data Online
Center for Operational Oceanographic Products and
Services (CO-Ops)


Let’s Put It All Together
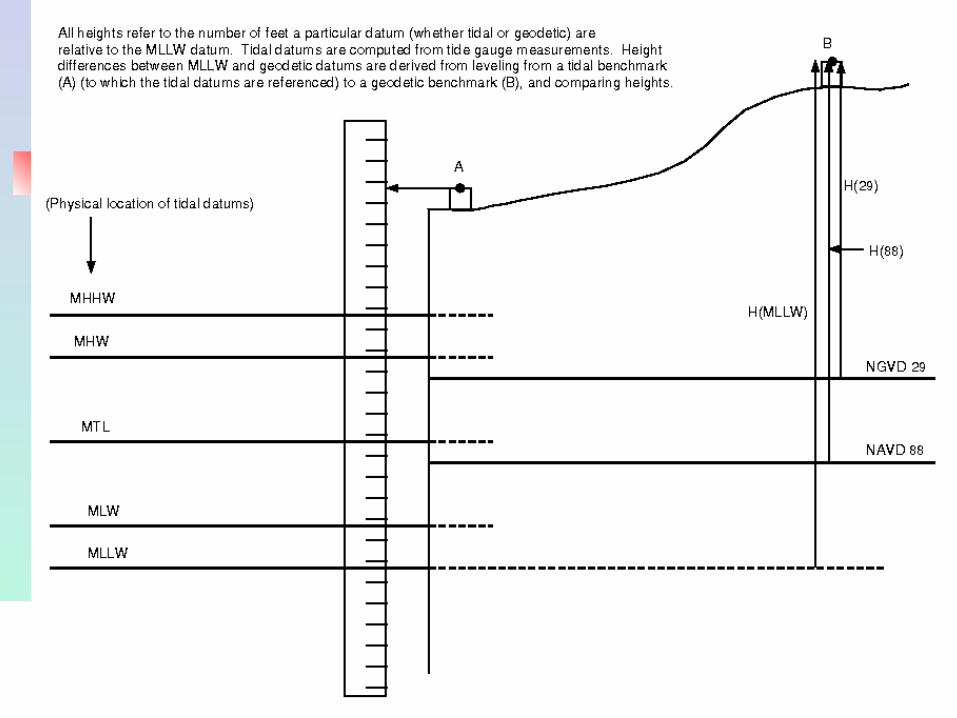
Matching Tidal Datums to Orthometric Heights
S.F. Golden Gate Datasheet and Tidal Bench Mark

Datum ConversionsHumbolt Bay- North Spit Primary Tide Station Datums
Datums ABBR. Tidal Metric Tidal Feet NAVD88 Metric NAVD88 FEET
Highest Observed Water Level HOWL 2.693 8.84 2.590 8.50
Mean Higher High Water MHHW 2.090 6.86 1.987 6.52
Mean High Water MHW 1.874 6.15 1.771 5.81
Mean Sea Level MSL 1.129 3.70 1.026 3.37
Mean Low Water MLW 0.384 1.26 0.281 0.92North American Vertical Datum NAVD88 0.103 0.34 0.000 0.00
Mean Lower Low Water MLLW 0.000 0.00 -0.103 -0.34
Lowest Observed Water Level LOWL -0.883 -2.90 -0.986 -3.23

Then It Falls Apart Many
Secondary and almost all Tertiary Stations Don’t have NAVD 88 Datums

Tide Stations Without NAVD 88 Elevations

VDatum – Where Land and Sea Meet

Vertical Datums - 3 height systems
A surface to which heights are referred.
Tidal Datums (Tide Stations)Defined by observation of tidal variations over a
specified epoch of timeMean Lower Low Water (MLLW)Mean Sea Level (MSL)
Orthometric Datums (Leveling)Related to the geoidHeights from differential leveling
North American Vertical Datum 1988 (NAVD 88)
Ellipsoidal (3-D) Datums (GPS)Related to an ellipsoidal model of the EarthHeights directly from GPS
North American Datum 1983 (NAD 83)

VDatum Conversions Horizontal Between NAD 27 – NAD
83-ITRF – WGS 84 Vertical Between NGVD29 and
NAVD88 using VERTCON Vertical Between NAD 83 and
NAVD 88 using GEOID 12A, or earlier geoids
Tidal Datums for CONUS and PR, VI


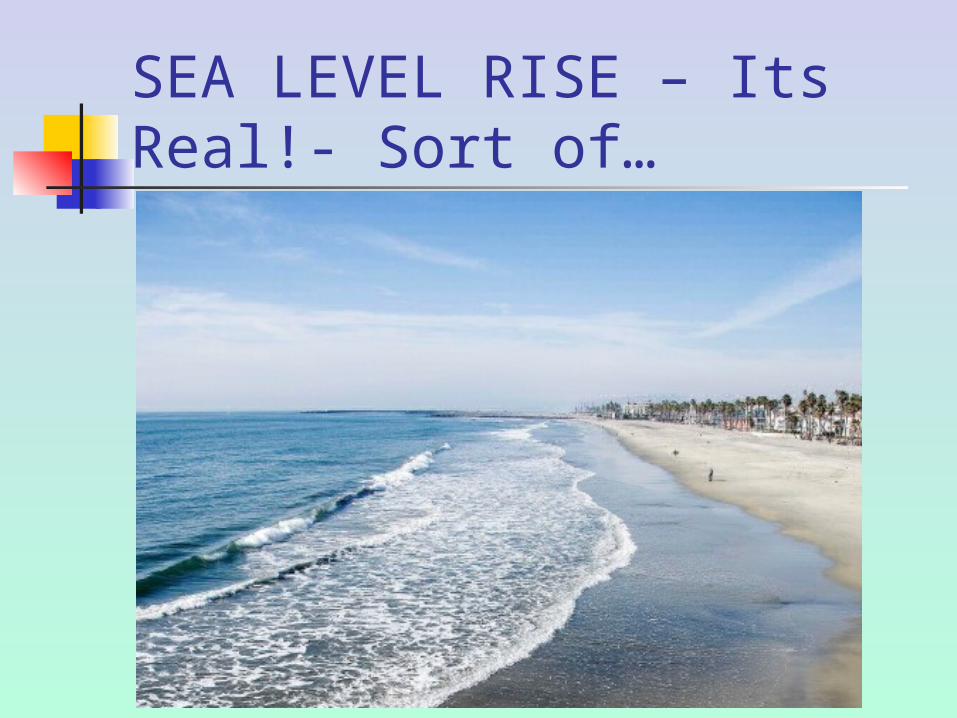
SEA LEVEL RISE – Its Real!- Sort of…
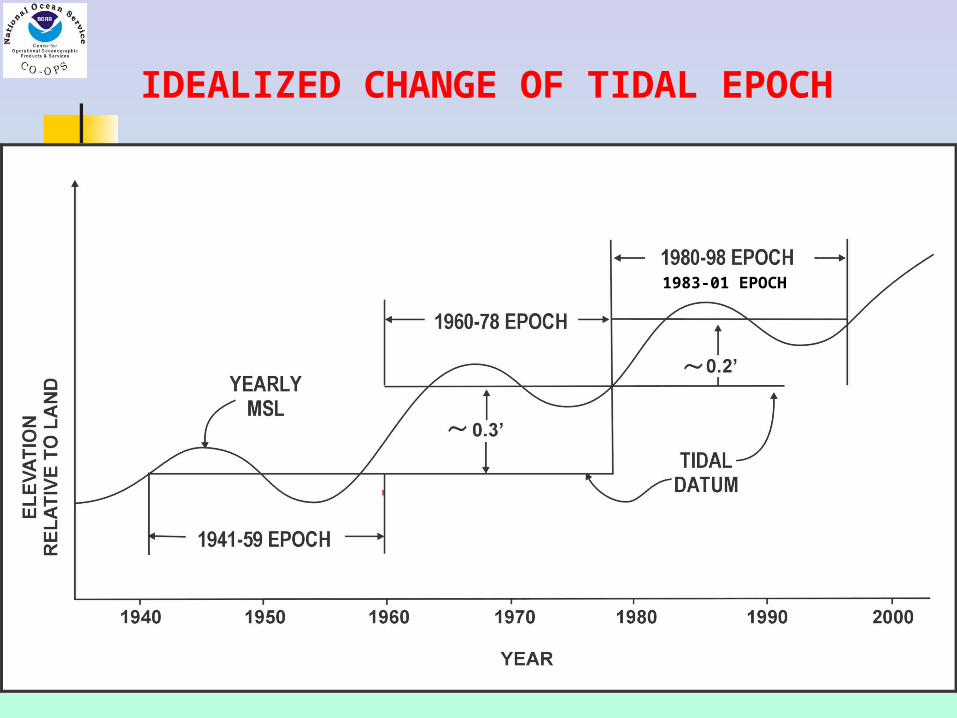
IDEALIZED CHANGE OF TIDAL EPOCH
1983-01 EPOCH

RELATIVE SEA LEVEL CHANGE AT SEVERAL LOCATIONS IN THE U.S.

How Did We Get Here? Governor’s Executive Order S-13-08
The California Resources Agency… shall request that the National Academy of Sciences (NAS) convene an independent panel to complete the first California Sea Level Rise Assessment Report
The Business, Transportation, and Housing Agency shall … prepare a report within 90 days of release of this Order to assess vulnerability of transportation systems to sea level rise…

Vermeer & RahmstorfYear Average of Models Range of Models
2030 7 in (18 cm) 5-8 in (9-17 cm)
2050 14 in (36 cm) 10-17 in (26-43 cm)
2070
Low 23 in (59 cm) 17-27 in (43-70 cm)
Medium 24 in (62 cm) 18-29 in (46-74 cm)
High 27 in (69 cm) 20-32 in (51-81 cm)
2100
Low 40 in (97 cm) 31-50 in (78-128 cm)
Medium 47 in (121 cm) 37-60 in (95-152 cm)
High 55 in (140 cm) 43-69 in (110-176 cm)

Tectonic Shifts
This is from the NAS report. The San Andreas Fault runs up the California Coast, and heads out to sea at Cape Mendocino. South of the Cape, Sea levels are rising, but north of the Cape, The land is rising, and sea levels dropping.
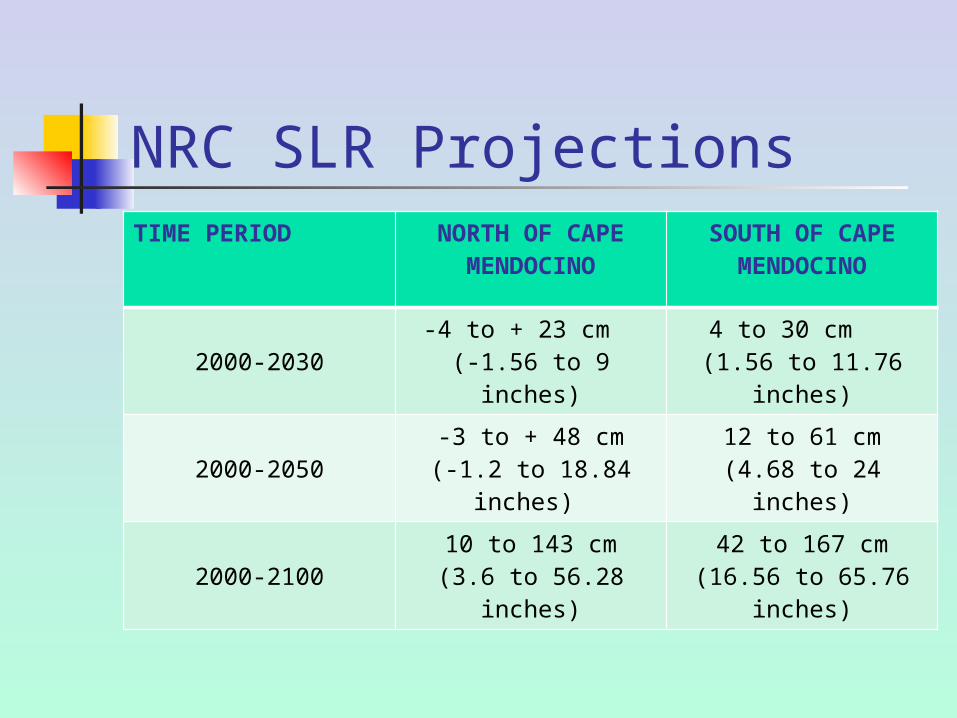
NRC SLR ProjectionsTIME PERIOD NORTH OF CAPE
MENDOCINOSOUTH OF CAPE
MENDOCINO
2000-2030 -4 to + 23 cm (-1.56 to 9 inches)
4 to 30 cm (1.56 to 11.76
inches)
2000-2050-3 to + 48 cm(-1.2 to 18.84
inches)
12 to 61 cm(4.68 to 24 inches)
2000-2100 10 to 143 cm(3.6 to 56.28 inches)
42 to 167 cm(16.56 to 65.76
inches)

Charting Sea Level RiseProjected Sea Level Rise - NAVD88 Metric North Spit
DATUM 2000 2030 min 2030 max 2050 min 2050 max 2100 min 2100 max
SLR +0.0 -0.04 0.23 -0.03 0.48 0.10 1.43
HOWL 2.590
MHHW 1.987 1.947 2.217 1.957 2.467 2.087 3.417
MHW 1.771 1.731 2.001 1.741 2.251 1.871 3.201
MSL 1.026 0.986 1.256 0.996 1.506 1.126 2.456
MLW 0.281 0.241 0.511 0.251 0.761 0.381 1.711
MLLW -0.103 -0.143 0.127 -0.133 0.377 -0.003 1.327
LOWL -0.986


CCC Draft SLR Steps At Least 2 scenarios-
a low and high rise 1. Establish SLR
Range for Project 2. Determine how
impacts from SLR affect the site
3. Determine how the project will impact coastal resources
4. Identify Project design alternatives to minimize impacts
5. Finalize Design and Submit Coastal Development Permit (CDP)
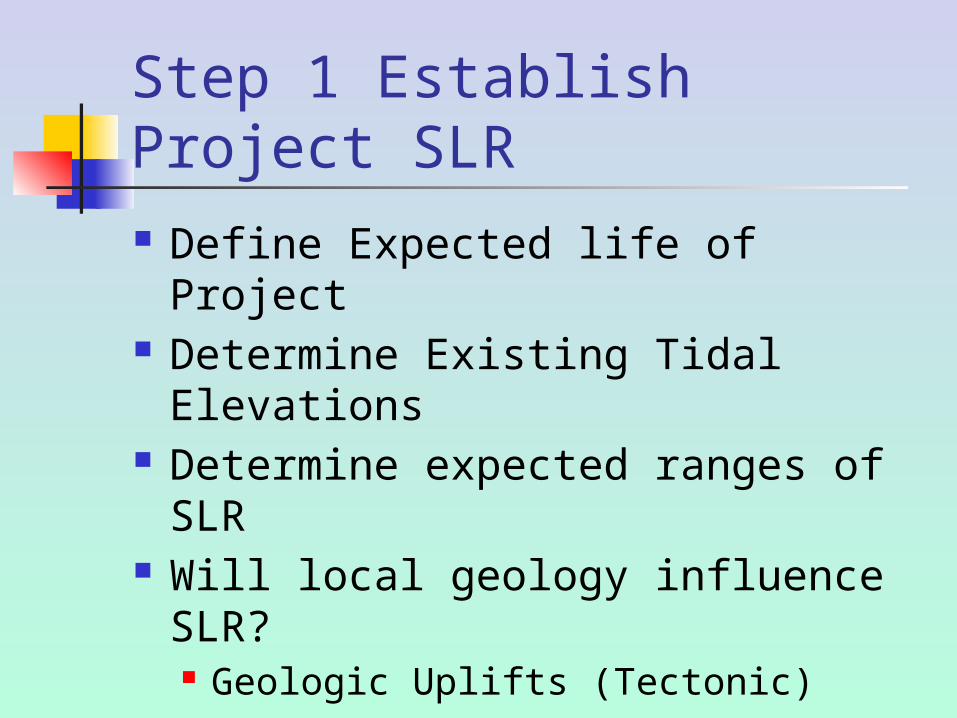
Step 1 Establish Project SLR Define Expected life of Project Determine Existing Tidal Elevations Determine expected ranges of SLR Will local geology influence SLR?
Geologic Uplifts (Tectonic) Subsidence (water over drafting or
oil extraction)

Step 2 Determine Impacts Apply SLR scenarios to projects
site For large areas, NOAA Lidar Data is
acceptable for DTM Erosion (Engineers) Flooding and Inundation
Tipping Point Other (Groundwater)

How Accurate are the Maps?

The Tipping Point

Analysis of MLLW / MHHWIf Short term Project –
Minimal SLR Long Term Project No Tipping Point within
Project lifespan Tipping point within
Project lifespan
Then No Further Evaluation
More Work Submit findings to
Planners Submit findings,
including expected dates – More Work

Questions


AL, AK, CA, CT, FL, GA, LA, MD, MS, NJ, NY, NC, OR, RI, SC, WA
Privately OwnedUplands
State OwnedTidelands
Territorial Seas
State Submerged Lands
Contiguous Zone
Exclusive Economic Zone
Federal Submerged Lands
High Seas
Privately Owned
State Owned
TX
3 n. mi.
12 n. mi.
200 n. mi.
Privately Owned
State Owned
DE, MA, ME, NH, PA, VA
MHHWMHW
MLLW
Importance of Shoreline
Chart Datum

Maritime BoundariesAL, AK, CA, CT, FL, GA, MD, MS, NJ, NY, NC, NH, OR, RI,
SC, WAPrivately Owned
Uplands
State Owned
Tidelands
Territorial Sea
State Submerged Lands
Contiguous Zone
Outer Continental Shelf
High Seas
Privately Owned
State Owned
HI, LA, TX
3 n. mi.*12 n. mi.
200 n. mi.
Privately Owned
State Owned
DE, MA, ME, PA, VA
MHHWMHW
MLLW Chart Datum
24 n. mi.
* TX, the Gulf Coast of FL, and Puerto Rico claim submerged lands to 3 marine leagues or 9 n. mi
Exclusive Economic Zone (international)US EEZ
(fisheries)