tifr_report
TRANSCRIPT

1
“DESIGNING ‘TURN-ON’ LUMINESCENT PROBES
FOR IN VIVO PHOSPHOLIPID SENSING”
A PROJECT REPORT SUBMITTED TO SASTRA UNIVERSITY IN PARTIAL FULFILLMENT OF THE REQUIREMENT FOR THE
AWARD OF THE DEGREE OF
BACHELOR OF TECHNOLOGY
IN
INDUSTRIAL BIOTECHNOLOGY
SUBMITTED BY
SRISHTI RAMAKANT GUPTA (114016055)
Under the guidance of
Dr. Ankona Datta
Department of Chemical Sciences
TATA Institute of Fundamental Research, Mumbai
APRIL 2014
School of Chemical & Biotechnology
SASTRA UNIVERSITY
(A University established under section 3 of the UGC Act, 1956)
Thanjavur-613402

2
DECLARATION
I hereby declare that this submission “Designing ‘TURN-ON’ Luminescent Probes, for in-vivo
Phospholipid Sensing” is a record of my project work carried out in Tata Institute of Fundamental
Research, Mumbai, under the supervision of Dr. Ankona Datta, Department of Chemical Sciences,
and is my own work and that, to the best of my knowledge and belief, it contains no materials
previously published or written by another person, except where acknowledgement has been made
in text.
Date: 24/03/2014 SRISHTI RAMAKANT GUPTA
SASTRA University (114016055)

3
Certificate from TIFR to be attached

4
ACKNOWLEDGEMENT
I would first want to sincerely thank Dr. Ankona Datta for her guidance, motivation and support
throughout the course of my project. Her continuous efforts and valuable advice made it possible
for me to complete this work on time. She has been an inspiring and also a very approachable
guide throughout the course of my work in TIFR.
I want to express my heartfelt gratitude to Ms. Shafali Gupta and Mr. Samsuzzoha Mondal for
efficiently training me with patience and encouragement through the course of this project.
I would also like to sincerely thank all my lab mates Ms. Anindita Sarkar, Ms. Ananya Rakshit, Ms.
Subha B, Ms. Sayani Das, Dr. Manish Dhyani for their valuable inputs, help, whole-hearted
cooperation and constructive criticism. Several people are responsible for making my stay at TIFR
memorable, most important amongst them are Dr. Jyotishman Dasgupta and all his lab members.
My sincere thanks to Dr. Shayamalava Mazumdar, Kansara Ji, Mr. Rahul Gera for their help and
inputs. I cannot miss thanking the NMR facility, MALDI facility and staff, Biochemistry facility and all
the DCS lab members of TIFR.
I owe TIFR Mumbai for giving me this opportunity to be able to learn and work in a highly
motivated and progressive environment.
Date: 24/03/2014 SRISHTI RAMAKANT GUPTA
SASTRA University (114016055)

5
INDEX
A. Introduction
A.1. Background……………………………………………………….6
A.2. Lanthanide Based ‘TURN-ON’ approach………………………7
A.3. Aim and Strategy………………………………………………..9
B. RESULTS AND DISCUSSIONS
B.1. Protein expression and purification…………………………………………...11
B.2.Protein Labeling…………………………………………………………………………..13
B.3. Synthesis of chromophores capable of Lanthanide sensitization
a. Attachment through cysteine residues……………………………………..14
b. Attachment through tryptophan & tyrosine residues………………..24
C. EXPERIMENTAL SECTION
C.1.Instrumentation and General Procedures……………………………………..26
C.2. Protein Expression & Purification………………………………………………….27
C.3. Thrombin cleavage………………………………………………………………………..27
C.4. Protein labeling……………………………………………………………………………..28
C.5. Synthesis of chromophores capable of Lanthanide sensitization……28
REFERENCES……………………………………………………………………………..30

6
A. INTRODUCTION
The basic structure of biological membranes is the lipid bilayer, the main components of which are
phospholipids. Phospholipids maintain the integrity of the cell and organelles by creating a semi-
impermeable barrier from their outside environment. Phospholipids are composed of a glycerol
moiety linked to fatty acids and a phosphate group to which polar head groups like choline, serine or
inositol are attached. Based on the head group attached, phospholipids are named as
phosphatidylcholine (PC), phosphatidylserine (PS) and Phosphatidylinositol respectively (Figure
A.1). The chemical nature of the headgroups governs the self-assembly of phospholipids in the
membrane.
Figure A.1: Basic structure of phospholipids.
Phospholipids show asymmetric distribution on the membrane and studies indicate that this
asymmetry may play a critical role in many important biological and cellular processes.3 The
alteration of phospholipid distribution (for example, the externalization of PS on the cell membrane)
can also play important roles in activating cellular or biological processes such as blood coagulation,
recognition and removal of apoptotic cells, cytokinesis, and cell fusion. Phospholipids are thus not
mere spectators forming the matrix of the membrane. Several cell signaling pathways are mediated
through membrane interacting peripheral proteins that have specific interactions with PLs.11
Therefore visualizing and quantifying phospholipids on the cell membrane can provide mechanistic
insights into cell signaling processes.
A common strategy for PL detection involves the use of protein-dye conjugates incorporating
fluorophores. However, a strong background signal from unbound sensors is a major shortcoming of
this current approach. The potential of small molecules like Zn2+
based complexes (bis-ZnDPA) to
recognize phosphorylated biomolecules, has also been used in the recent past.10
But this approach is
based on electrostatic interactions and shows lack of specificity to target. The issues of high

7
background and low specificity can only be addressed by developing sensors that ‘turn-on’
specifically only in the presence of a particular phospholipid. Several membrane binding peripheral
proteins like, protein kinase C, annexin V, and synaptotagmin, interact with anionic phospholipids
via a Ca-bridging mechanism, where Ca2+
ions in the phospholipid binding sites interact with the
phosphate head-groups of the PLs. Selectivity towards a specific phospholipid arises from the
headgroup interacting with the binding pocket amino acid residues. Using this PL−metal ion
interaction, the ‘Datta Group’ of Chemical Biology & Molecular Imaging, TIFR, has developed a
unique “turn-on” detection strategy for anionic PLs via lanthanide (Ln) reconstituted proteins or
“lanthano” proteins.
Peripheral Ca2+
binding 36 kDa protein, human annexin V, has been exploited for sensing an
essential anionic signaling PL, phosphatidylserine by the ‘turn on’ PL detection strategy developed.1
PS comprises 5-15% of the total phospholipids in mammalian cells. Although PS is a quantitatively
minor component, PS is widely distributed in cellular organelles, indicating its fundamental
structural role in biological membranes. Specific binding of PS is known to be involved in full
activation of protein kinase C, a key mediator of diverse signal transduction pathways. The
proteolytic activity of blood coagulation factor Xa and prothrombin is facilitated in the presence PS.
Coagulation factor Va specifically undergoes conformational change upon the binding of PS, with
consequent activation of the protein. It is thus important to develop imaging agents for
phosphatidylserine (PS).
Figure A.2: Jablonski diagram depicting Lanthanide sensitization by chromophore.

8
A.2. Lanthanide Based ‘TURN-ON’ approach
Crystal structures of the protein AnxV have identified five Ca2+
binding sites. PS binds selectively to
Ca2+
bound AnxV. Strategically placed amino acids with positive and negative side chains, interact
with the carboxyl and amine moieties of the serine head group. These interactions provide the
specificity for PS. Crystallographic and modeling studies propose that phosphate groups of PS
replace inner sphere water molecules on Ca2+
ions. These Ca2+
ions in the protein can be replaced by
lanthanide ions since lanthanides have similar co-ordination preferences and also similar size as Ca2+
ions. Lanthanides can be sensitized to luminesce via energy transfer from aromatic chromophores.
AnxV has ample aromatic amino acids for Ln sensitization. Lanthanide emission is quenched by
inner sphere coordinated water molecules. Thus replacement of the inner sphere water molecules in
AnxV by PS should cause the sensor to ‘turn-on’ (Figure A.3). A great advantage of Ln-based
systems is that the emission wavelengths can be anywhere from the visible to the near-infrared
depending on the Ln used.1
Figure A.3: ‘Turn-on’ sensingstrategy for PS detection throughlanthanoAnxV. Communication
To test this strategy Anx V was expressed and purified, followed by desalting to remove metal ions.
The purified protein was reconstituted with Ln3+
to prepare the PL sensor. The natural sensitizers in
proteins being UV absorbers, Tb3+
(visible emitters which can be effectively sensitized by UV-
absorbing chromophores) was selected to prepare “lanthano” Anx V. A single tryptophan and 12
tyrosines provided the aromatic residues in Anx V for Ln sensitization. Thus a simple, but specific
“turn-on” detection strategy for PS, by using TbIII-AnxV was successfully demonstrated by the
Datta group.1

9
A.3. Aim and Strategy
The excitation wavelength of the developed sensor was at 280 nm. This excitation at 280 nm is not
compatible for biological imaging as it falls in the ultra violet region. Spectrum of ultraviolet
radiation damages many molecules in the biological system. Ultraviolet photon has the power to
alter chemical bonds in molecules.
In order to perform in vivo/cellular imaging, the excitation wavelength has to be shifted from UV to
the visible region (> 400 nm). This can be done by incorporation of a chromophore into the protein
that absorbs at visible wavelength and is capable of sensitizing lanthanides. (Figure A.4) The
chromophore absorbs the excitation energy and energy transfer to the metal center takes place, due
to this a metal centered, sensitized luminescence occurs. This process is also termed as antenna
effect. Energy transfer from chromophore to metal center takes place from triplet excited state T1
after intersystem crossing. The following criteria should be met for the above mentioned process to
occur. (Figure A.2)
Energy difference between T1 of the chromophore and excited state of the Lanthanide should
not be too large with T1 being the higher in energy.
Too small an energy gap could result in back energy transfer from Ln excited state to T1.9
Based on these conditions suitable chromophores for Lanthanide sensitization had been selected.9
Figure A.4: Chromophore attached to protein to sensitize Lanthanide.
The specific aim of the project was two fold
a. To express and purify a mutant of protein AnxV which has surface accessible cysteine
residues.
b. Synthesize chromophores which are capable of lanthanide sensitization and absorb in the
visible wavelength.

10
The acetamides of these chromophores can be attached to the reactive thiol sites in cysteine residues
present on the surface of the mutant protein. Attachment of chromophores could also be done
through tryptophan and tyrosine residues present in the protein by the formation of its diazonium
salts. (Figure A.5)
This would further be used to apply the developed ‘turn-on’ optical sensing strategy for anionic
phospholipids for in-cellulo measurments.
Figure A.5: Techniques to shift excitation wavelength from UV to Visible region
Biconjugation techniques
Conjugation of sensitizer through tyr and trp.
Conjugation of sensitizer
through cysteine.

11
B. RESULTS AND DISCUSSIONS
B.1. Protein expression and purification:
The first step was to express and purify mutants of human AnxV which have surface accessible
cysteine residues for attachment of the chromophores. Sites in human AnxV which do not interact
with PS or Ca, have hydrophobicity comparable to that of cysteine, and are also surface accessible
were identified.7 This was done by calculating the required distances from the crystal structures
using PyMOL, surface accessibilities were studied using ExPASy. These sites should also be in
appropriate distance from the Ca binding pockets so that efficient energy transfer can take place
from the sensitizer. These sites were identified to be Leu65 and Ala55. Plasmid pET28a-
hAnxVA55C, obtained from genscript had previously been used to transform BL21a E.coli cells.
Mutant proteins L65C-hAnxV and A55C-hAnx5 were expressed and then purified.
Figure B.1: SDS-PAGE gel depicting protein ladder in 1st lane from left and His-tag purified Human Anx V (36kDa)
in other lanes.
Figure B.2: SDS-PAGE gel depicting final purified protein obtained after gel filtration along with protein ladder in 1st lane.
12
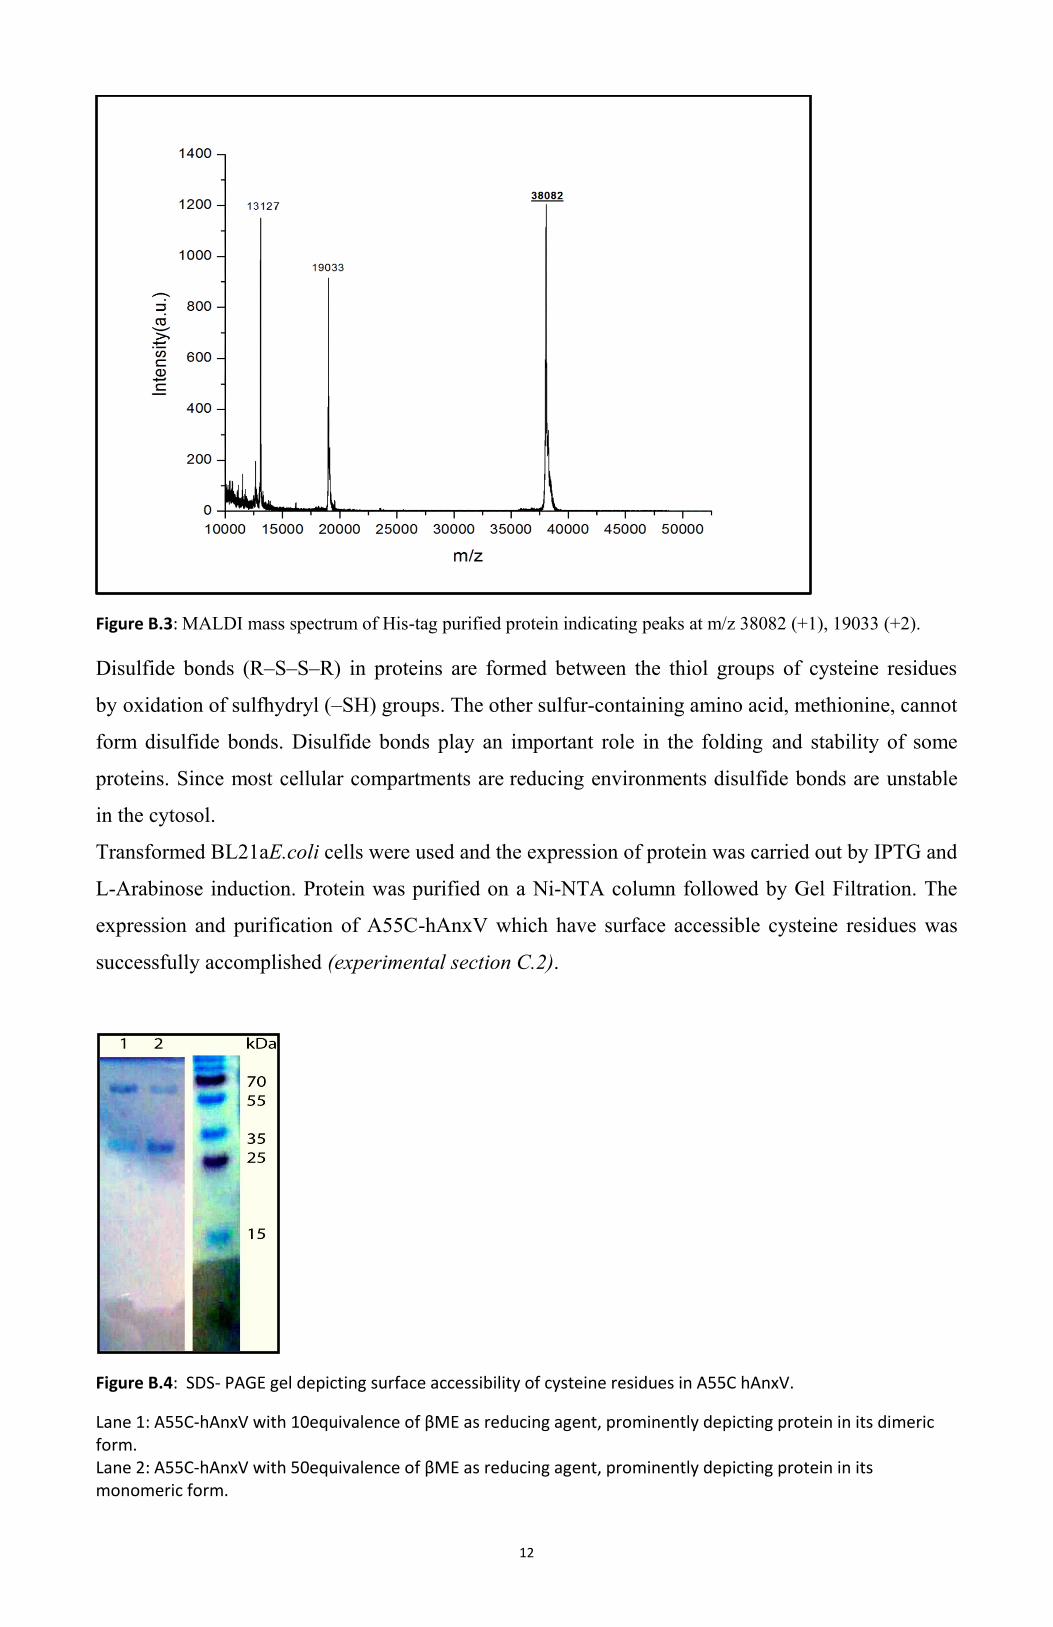
Figure B.3: MALDI mass spectrum of His-tag purified protein indicating peaks at m/z 38082 (+1), 19033 (+2).
Disulfide bonds (R–S–S–R) in proteins are formed between the thiol groups of cysteine residues
by oxidation of sulfhydryl (–SH) groups. The other sulfur-containing amino acid, methionine, cannot
form disulfide bonds. Disulfide bonds play an important role in the folding and stability of some
proteins. Since most cellular compartments are reducing environments disulfide bonds are unstable
in the cytosol.
Transformed BL21aE.coli cells were used and the expression of protein was carried out by IPTG and
L-Arabinose induction. Protein was purified on a Ni-NTA column followed by Gel Filtration. The
expression and purification of A55C-hAnxV which have surface accessible cysteine residues was
successfully accomplished (experimental section C.2).
Figure B.4: SDS- PAGE gel depicting surface accessibility of cysteine residues in A55C hAnxV.
Lane 1: A55C-hAnxV with 10equivalence of βME as reducing agent, prominently depicting protein in its dimeric form. Lane 2: A55C-hAnxV with 50equivalence of βME as reducing agent, prominently depicting protein in its monomeric form.

13
B.2.Protein Labeling
Conjugation of acetamides of chromophores capable of lanthanide sensitization to surface accessible
cysteine residues in A55C-hAnxV and L65C-hAnxV was attempted. The protocol followed for
protein labeling is mentioned in the Experimental section (C.4 ).6
Figure B.5 Conjugation of chromophores to protein through Cysteine residue
Several attempts towards labeling the mutants A55C-hAnxV and L55C-hAnxV protein and
optimizing the labeling protocol were made.
100 equivalence of the dye was initially used with 10 equivalence of β mercaptoethanol (βME) as
the reducing agent. Later, the amount of reducing agent used was substantially increased (10
equivalence, 50 equivalence, 100 equivalence) while following labeling protocol.6
The labeled protein was not being detected in Matrix-assisted laser desorption/ionization (MALDI),
a soft ionization technique used in mass spectrometry, following which Bradford assay was
performed to detect the concentrations of protein present. This concentration was found to be very
low (0.4 µM). Loss of protein could have taken place during the process of gel filtration or dialysis
which was done to remove the unreacted dye. The labeled protein was then concentrated 10 times by
evaporation under vacuum after which its characterization by MALDI mass spectroscopy was
reattempted. In next attempt protein samples were concentrated by way of centrifugal ultrafiltration
using Amicon Ultracel 3000 Da molecular weight cutoff centrifugal filter units. The protein was
transferred to a new HEPES (20 mM HEPES, 100 mM NaCl) buffer from TRIS (TRIS 20 mM, 100
mM) buffer. The labeling protocol was followed again using (tris(2-carboxyethyl)phosphine)
(TCEP) as the reducing agent.
The reaction time for the protein reduction was also varied from 30 min to 12h. The ionization of
molecules and their desorption in MALDI MS could be affected by presence of contaminants like
salts present in the buffer or DMSO used with the dye. The DMSO present was evaporated under
high pressure, excess salts removed and characterization was reattempted. MALDI-MS was also
performed for 2 controls, one containing protein reacted with reducing agent (concentrations similar
to the labeling protocol) and other, protein with dye to be labeled (in DMSO, concentrations similar
to the labeling protocol). The labeled protein was not detected on characterization by MALDI mass
spectroscopy in all of the above cases.
14
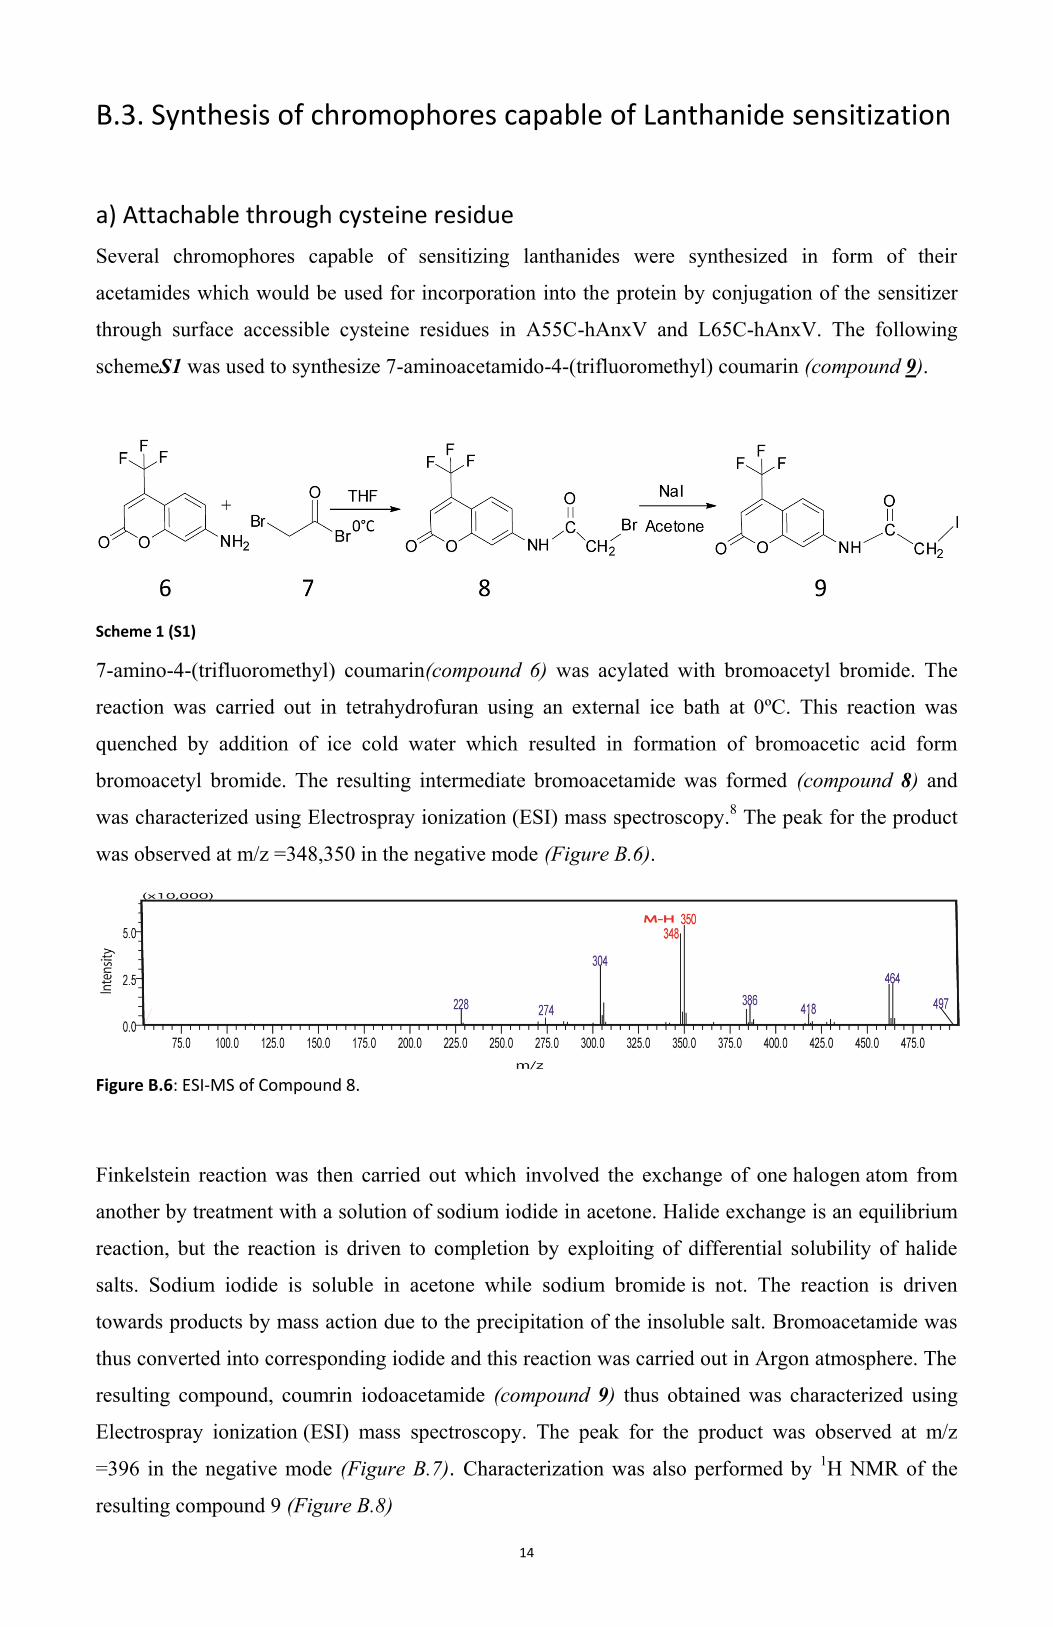
B.3. Synthesis of chromophores capable of Lanthanide sensitization
a) Attachable through cysteine residue
Several chromophores capable of sensitizing lanthanides were synthesized in form of their
acetamides which would be used for incorporation into the protein by conjugation of the sensitizer
through surface accessible cysteine residues in A55C-hAnxV and L65C-hAnxV. The following
schemeS1 was used to synthesize 7-aminoacetamido-4-(trifluoromethyl) coumarin (compound 9).
Scheme 1 (S1)
7-amino-4-(trifluoromethyl) coumarin(compound 6) was acylated with bromoacetyl bromide. The
reaction was carried out in tetrahydrofuran using an external ice bath at 0ºC. This reaction was
quenched by addition of ice cold water which resulted in formation of bromoacetic acid form
bromoacetyl bromide. The resulting intermediate bromoacetamide was formed (compound 8) and
was characterized using Electrospray ionization (ESI) mass spectroscopy.8 The peak for the product
was observed at m/z =348,350 in the negative mode (Figure B.6).
Figure B.6: ESI-MS of Compound 8.
Finkelstein reaction was then carried out which involved the exchange of one halogen atom from
another by treatment with a solution of sodium iodide in acetone. Halide exchange is an equilibrium
reaction, but the reaction is driven to completion by exploiting of differential solubility of halide
salts. Sodium iodide is soluble in acetone while sodium bromide is not. The reaction is driven
towards products by mass action due to the precipitation of the insoluble salt. Bromoacetamide was
thus converted into corresponding iodide and this reaction was carried out in Argon atmosphere. The
resulting compound, coumrin iodoacetamide (compound 9) thus obtained was characterized using
Electrospray ionization (ESI) mass spectroscopy. The peak for the product was observed at m/z
=396 in the negative mode (Figure B.7). Characterization was also performed by 1H NMR of the
resulting compound 9 (Figure B.8)
15
Figure B.7: ESI-MS of Compound 9.
Figure B.8: 1H NMR of Compound 9.
Synthesis of N-((1,10-phenanthrolin-4-yl)methyl)-2-iodoacetamide (Compound 5) was attempted
following the scheme (S2) mentioned below.
Scheme 2 (S2)

16
Compound 2 was obtained through SeO2 mediated benzylic oxidation of 4-methyl-1,10
phenanthroline (Compound 1) and the reaction was performed under Argon atmosphere. The
oxidation using SeO2 follows a mechanism where the first step is a cycloaddition reaction. The
allylic seleninic acid produced undergoes a [2,3]-sigmatropic rearrangement to reinstate the double
bond position. Rapid decomposition of the selenium (II) intermediate leads to an allylic alcohol.
Oxidation continues to give the α,β-unsaturated carbonyl product (Compound 2). Presence of
Compound 2 was characterized using MALDI mass spectrometry. The expected peak was found at
m/z = 209 (M+H) (Figure B.9). Characterisation was also performed by 1H NMR (Figure B.10).
Compound 3 was then synthesised by performimg solid state reaction using Fmoc protected Rink
amide resin. Fmoc deprotection of resin was done using Piperidine after which coupling was
performed by addition of Compound 2 with 1:1 DMF:MeOH, AcOH and Na(CN)BH3 to the
deprotected resin. The reaction was performed for 18 h after which the resulting Compound 3 was
cleaved from the resin using trifluoroacetic acid (TFA), triisopropylsilane (TIS) and H2O. The
solvent was removed under a stream of N2, and the product obtained. The advantages of performing
solid state reaction were that only the compound of interest reacts with N-terminus in the resin.
Impurities can be easily removed by wash with DMF and MeOH and the resulting compound has
high purity.
Figure B.9: MALDI MS of Compound 2

17
Figure B.10: 1H NMR of Compound 2
Synthesis of 2-iodo-N-((5-oxo-5H-thiochromeni[2,3-b]pyridine-2-yl)methyl)acetamide (Compound
h) was attempted following the Scheme (S3) mentioned below.
Scheme 3 (S3)
18
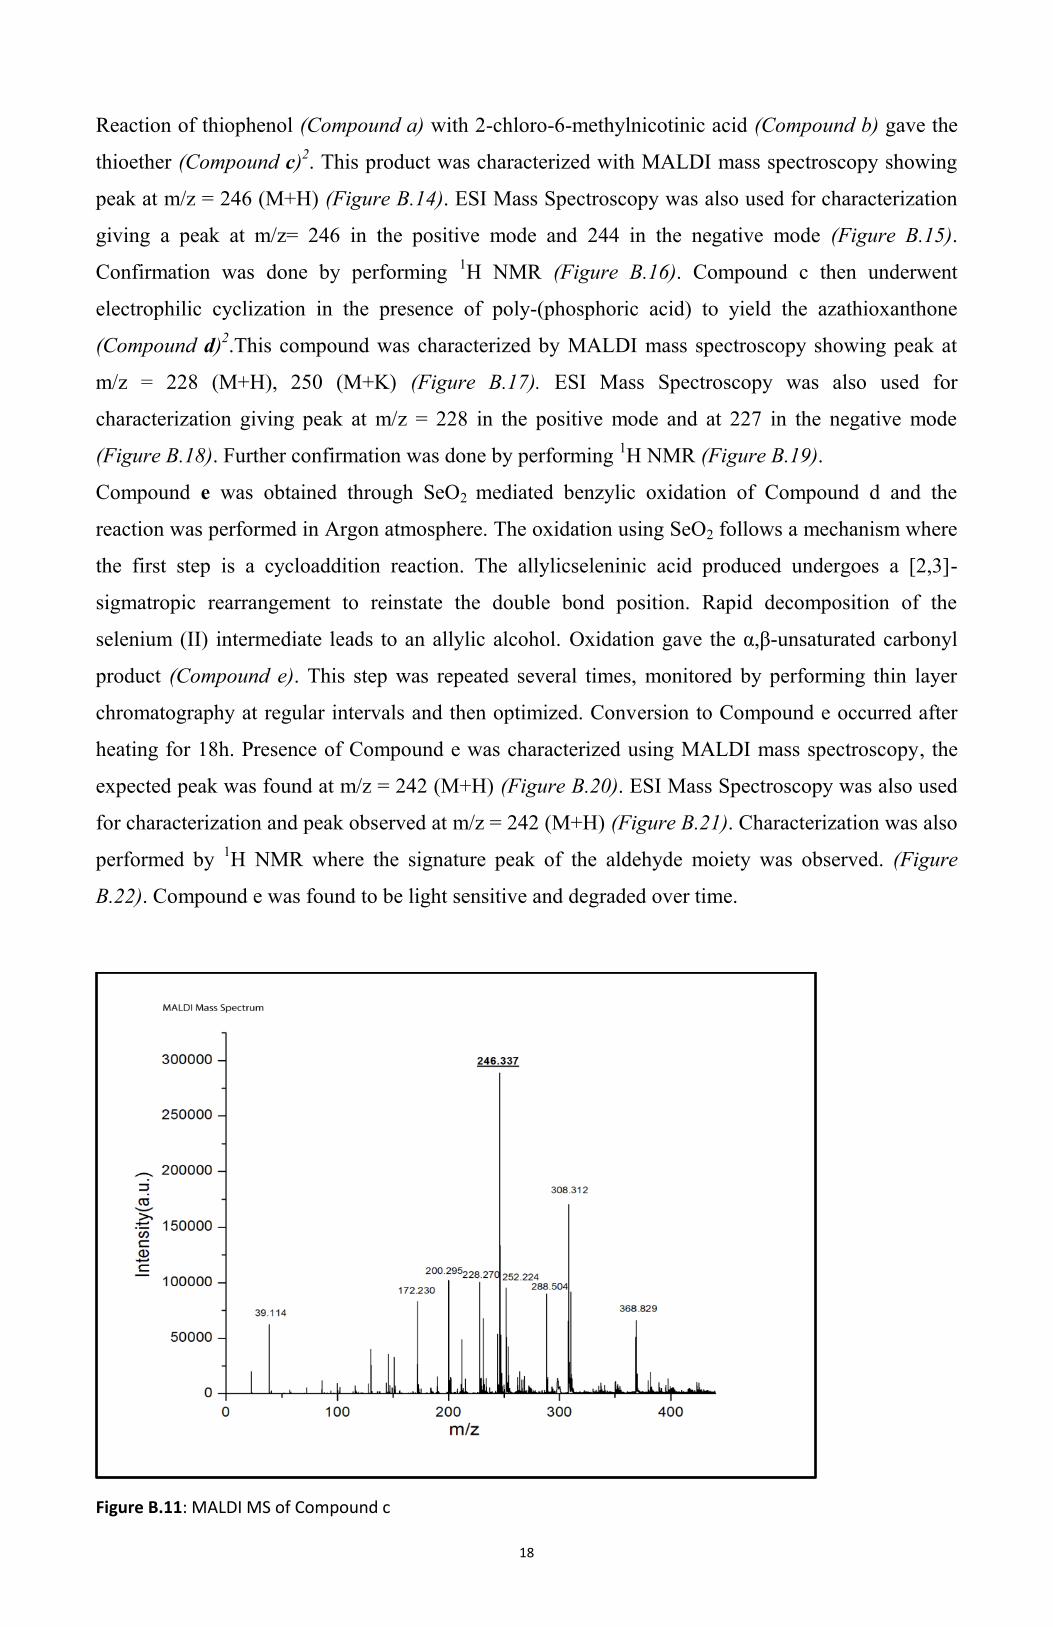
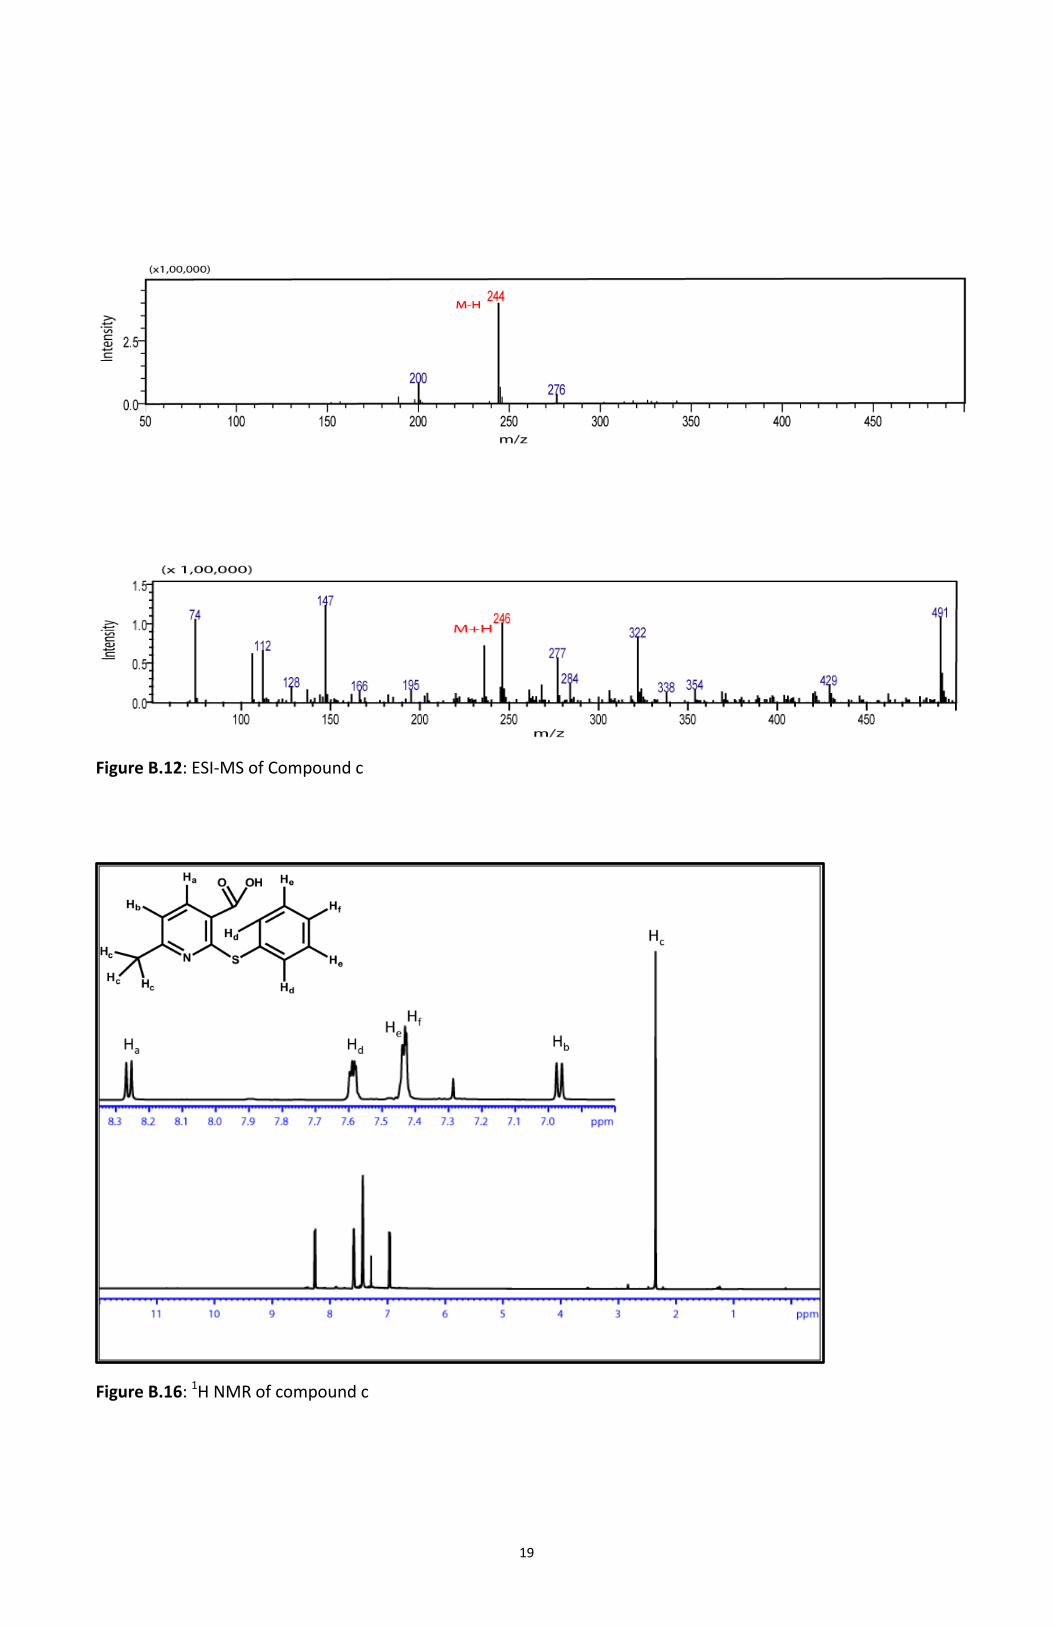
Reaction of thiophenol (Compound a) with 2-chloro-6-methylnicotinic acid (Compound b) gave the
thioether (Compound c)2. This product was characterized with MALDI mass spectroscopy showing
peak at m/z = 246 (M+H) (Figure B.14). ESI Mass Spectroscopy was also used for characterization
giving a peak at m/z= 246 in the positive mode and 244 in the negative mode (Figure B.15).
Confirmation was done by performing 1H NMR (Figure B.16). Compound c then underwent
electrophilic cyclization in the presence of poly-(phosphoric acid) to yield the azathioxanthone
(Compound d)2.This compound was characterized by MALDI mass spectroscopy showing peak at
m/z = 228 (M+H), 250 (M+K) (Figure B.17). ESI Mass Spectroscopy was also used for
characterization giving peak at m/z = 228 in the positive mode and at 227 in the negative mode
(Figure B.18). Further confirmation was done by performing 1H NMR (Figure B.19).
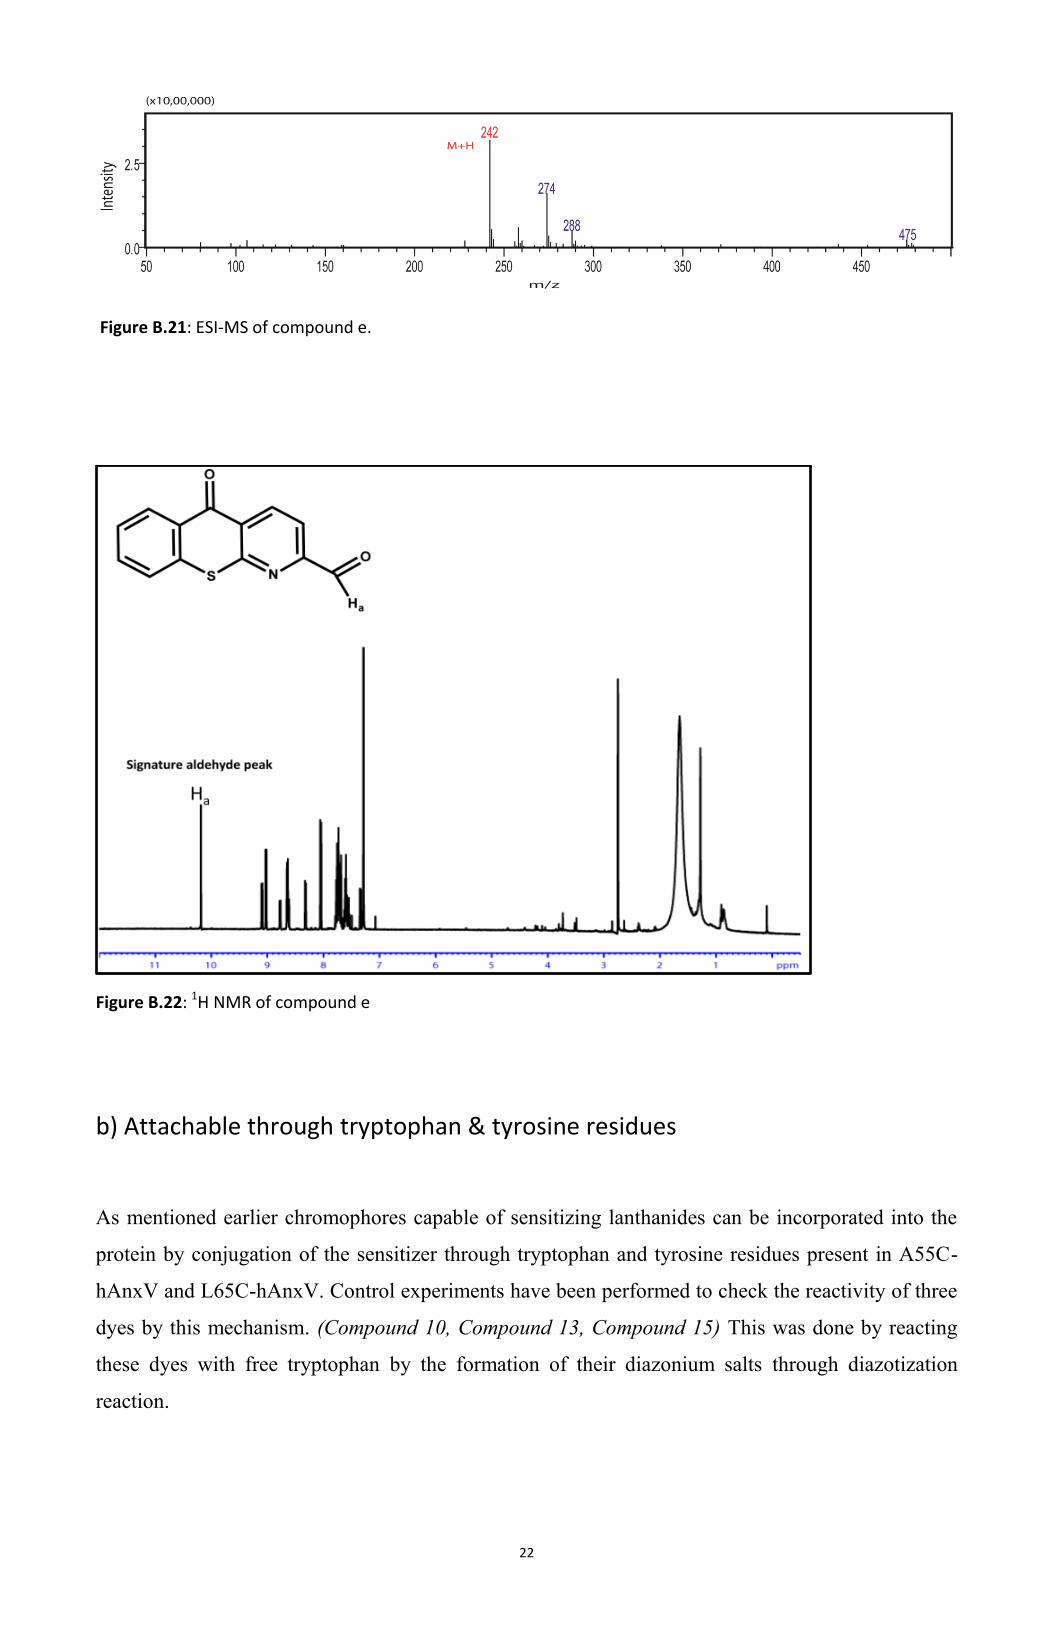
Compound e was obtained through SeO2 mediated benzylic oxidation of Compound d and the
reaction was performed in Argon atmosphere. The oxidation using SeO2 follows a mechanism where
the first step is a cycloaddition reaction. The allylicseleninic acid produced undergoes a [2,3]-
sigmatropic rearrangement to reinstate the double bond position. Rapid decomposition of the
selenium (II) intermediate leads to an allylic alcohol. Oxidation gave the α,β-unsaturated carbonyl
product (Compound e). This step was repeated several times, monitored by performing thin layer
chromatography at regular intervals and then optimized. Conversion to Compound e occurred after
heating for 18h. Presence of Compound e was characterized using MALDI mass spectroscopy, the
expected peak was found at m/z = 242 (M+H) (Figure B.20). ESI Mass Spectroscopy was also used
for characterization and peak observed at m/z = 242 (M+H) (Figure B.21). Characterization was also
performed by 1H NMR where the signature peak of the aldehyde moiety was observed. (Figure
B.22). Compound e was found to be light sensitive and degraded over time.
Figure B.11: MALDI MS of Compound c
19
Figure B.12: ESI-MS of Compound c
Figure B.16: 1H NMR of compound c

20
Figure B.17: MALDI MS of compound d
Figure B.18: ESI-MS of compound d.

21
Figure B.19: 1H NMR of compound d.
Figure B.20: MALDI-MS of compound e.
22
Figure B.21: ESI-MS of compound e.
Figure B.22: 1H NMR of compound e
b) Attachable through tryptophan & tyrosine residues
As mentioned earlier chromophores capable of sensitizing lanthanides can be incorporated into the
protein by conjugation of the sensitizer through tryptophan and tyrosine residues present in A55C-
hAnxV and L65C-hAnxV. Control experiments have been performed to check the reactivity of three
dyes by this mechanism. (Compound 10, Compound 13, Compound 15) This was done by reacting
these dyes with free tryptophan by the formation of their diazonium salts through diazotization
reaction.

23
Scheme 4 (S4)
Protocol as that mentioned in the experimental section was followed (C.5)
The nitrosation of aromatic amines with nitrous acid lead to formation of diazonium salts5. In
aqueous solution diazonium salts are unstable at temperatures above +5 °C; the -N+≡N group tends
to be lost as N2 (nitrogen gas). Diazonium compound was not isolated once prepared, and used
immediately for further reaction. Azo coupling was performed where the diazonium compound was
attacked by electron-rich substrate (free tryptophan, Compound 11). 4,5
An enhancement in the fluorescence was observed in the reaction performed with 7-Amino-
4(trifluoromethyl) coumarin (Compound 13). 6-amino-fluorescein (Compound 15) was found to
fluoresce only after its conjugation with Tryptophan residues. To test that the fluorescence observed
in this case was due to formation of compound 16 and not due to free fluorescein which could be
formed on detachment of the amine group in compound 15, Liquid chromatography–mass
spectrometry (LCMS) was performed. No presence of free fluorescein was observed (Figure B.24).
To further confirm this result a thin layer chromatography was performed with compound 15,
compound 16 and free fluorescein. (Figure B.25)

24
Figure B.24: LCMS data showing presence of Compound 16 and absence of free fluorescein, thereby confirming
the observation.
Figure B.25: Thin Layer Chromatography. (5% MeOH in CH2Cl2).
Lane 1: Fluorescein
Lane 2: 6 amino fluorescein (Compound 15)
Lane 3: Reaction product (Compound 16)

25
C. EXPERIMENTAL
C.1.Instrumentation and General Procedures
Protein Purification. All cell cultures were incubated at 37°C in MaxQ* 8000 Incubated Stackable
Shakers (Thermo Scientific, Inc.). Cell lysis was performed by sonication in Sonics, Vibra Cell TM.
Protein purifications wereperformed on Ni SepharoseTM 6 Fast Flow BioProcess medium (GE
Healthcare Life Sciences). His-Tag removal viathrombin cleavage was achieved using Thrombin
Clean Cleave TM Kit from Sigma Aldrich®. General desalting andremoval of cleaved His-tag were
performed using Sephadex® G-75 gel filtration media (Sigma Aldrich®). Proteinsamples were
concentrated by way of centrifugal ultrafiltration using Amicon® Ultracel® 3000 Da molecular
weight cut off centrifugal filter units (Millipore, USA). Centrifugations were performed using the
following instruments: 1) AvantiTM J-20XP centrifuge (Beckman Coulter, Inc., USA); 2) Eppendorf
Centrifuge 5810R (Eppendorf AG, Germany); or 3) Sorvall Legend Micro 17R centrifuge (Thermo
Fisher Scientific, Inc.).
Gel Analyses. For protein analysis, sodium dodecyl sulfate-polyacrylamide gel electrophoresis
(SDSPAGE) was run on a Mini-PROTEAN® gel running apparatus (Bio-Rad laboratories Inc.,
USA). Page Ruler Pluspre-stained protein ladder (Thermo Fisher Scientific, Inc.) was applied in at
least one lane of each gel to determinethe apparent molecular weight of the proteins. Protein bands
were visualized using Brilliant Blue R dye (Sigma Aldrich®).
UV-Visible spectrometric measurements for protein and phospholipid concentrations were
performed on SPECORD® 205 (Analytik Jena AG, Germany). Protein concentrations were also
determined on Nano Drop 1000spectrophotometer (Thermo Fisher Scientific, Inc.).
Mass Spectrometry Protein samples were analyzed on an Agilent 1200 SL RapidResolution LC
coupled to an ESI Agilent 6520 Q-TOF. Samples were desalted with ZipTip C18 Columns (Pierce,
Thermo Scientific Inc.) before injecting into the mass spectrometer. The samples were loaded onto
an Agilent nano CHIP C18 reverse phase column (150 mm, 300Å, C-18 chip w/40 nL trap column)
connected to a nano HPLC system.
Matrix Assisted Laser Desorption-Ionization Time of Flight (MALDI-TOF) mass spectra were
obtained ona BrukerUltrafleXtremeTM (BrukerDaltonics). Samples in buffer or water (0.5µL) were
mixed with a solution of3,5-Dimethoxy-4-hydroxycinnamic acid (1:2 MeCN: ddH2O with 0.1%
trifluoroacetic acid, 0.5µL) and applied onthe MALDI plate. Samples were allowed to dry
completely before analysis.

26
C.2. Protein Expression & Purification
Mutant A55C Human Annexin V (A55C-hAnx5) cDNA was obtained in vector that encoded a His-
Tag unit with a thrombin cleavage site which had been used to transform BL21a-E.coli cells.
LB medium (50mL) containing 30 µg/mL Kanamycin was incubated with the transformed colonies
at 37 °C overnight. The incubation was stopped once OD of 0.2 was reached. A secondary culture
was propagated in the LB Medium (1 L) containing 30 µg/mL of Kanamycin. This was done by
inoculating with the primary culture, followed by incubation at 37 °C until an OD of 0.6 was
reached. Protein expression was induced by addition of L-Arabinose (final concentration 0.2% w/v)
and isopropyl-1-thio-β-D-galactopyranoside (final concentration 1 mM) to the medium. This culture
was incubated at 37 °C for 4h. The bacterial culture obtained was pelleted down by centrifugation
(1.5 h at 7000 rpm, 4 °C). The supernatant was discarded and the pellet was resuspended into a
buffer containing 20 mM HEPES, 10 mM Imidazole, and 500 mM NaCl, at pH 7.4 (buffer a). This
was followed by sonication at 4 °C for 1.5 h at 40 % amplitude with 30 s of ‘ON’ and 20 s of ‘OFF’
cycles. The mixture was then centrifuged at 4000 rpm for 1 h at 4 °C and the supernatant obtained
was suspended in Ni Sepharose beads which were pre equilibrated with buffer a for 12 h at 4 °C.
The mixture was packed into a column and washed with a buffer containing 20 mM HEPES, 20 mM
Imidazole, and 500 mM NaCl at pH 7.4 to remove undesired protein impurities. The protein of
interest was then eluted using a buffer containing high concentration of Imidazole (500 mM). The
protein fractions were collected based on SDS-PAGE electrophoresis confirmation and taken
forward for His-Tag cleavage (Figure B.1). Thrombin cleavage was confirmed by SDS-PAGE. The
cleaved protein was purified and desalted by gel filtration using G-75 gel filtration media in a buffer
consisting of 20 mM TRIS, and 100 mM NaCl, at pH 6.8. Pure protein fractions were pooled based
on SDS-PAGE confirmation (Figure B.2). The protein was characterized by MALDI mass
spectrometry (Figure B.3). Protein concentrations were estimated from absorbance values at 280 nm
using NanoDrop 1000 spectrophotometer. A65C-hAnxV mutant with maximum concentration of
10µM was obtained.
C.3. Thrombin cleavage
Components:
Thrombin-Agarose: 50% suspension in 50% glycerol, 20mM Tris-HCl, pH 8.2
10x Cleavage Buffer: 500mM Tris-HCl, pH 8.0, 100mM CaCl2
The thrombin-agarose resin was thoroughly resuspended and made into homogeneous slurry. 100 µl
aliquot of a 50% (v/v) suspension of resin was removed and gently spun in a microcentrifuge at
2500rpm to pellet the resin. The supernatant was removed, 500 µl of 1x Cleavage Buffer was added
and gently resuspended. The system was centrifuged at 2500rpm and supernatant removed. The
above mentioned step was repeated again.

27
100 µl of 10x Cleavage Buffer was added to the centrifuged beads and gently resuspended. 1 mg of
the his-tag purified A55C-hAnxV was added and final volume brought to 1ml with water. The
cleavage reaction was incubated at 4ºC with gentle agitation to keep beads suspended. The aliquot
was removed after 16 h, gently centrifuged to remove resin and supernatant was analyzed for
cleavage.
C.4. Protein labeling
Reduction of disulfide bonds in the surface accessible cysteine residues of A55C-hAnx5 and L65C-
hAnx5 was performed by addition of 10 fold molar excess of freshly prepared solution of TCEP or β
Mercapto Ethanol to the mutant protein solution. The mixture was then allowed to stir for 30 min
following which a 10-fold molar excess of thiol reactive Compound 9 in DMSO was slowly added to
the protein solution while constantly stirring. Reactions were allowed to occur for 4h at RT in the
dark. Removal of the unreacted dye from the reaction mixtures was performed by passage through a
Sephadex G-25 column followed by dialysis.
C.5. Synthesis of chromophores capable of Lanthanide sensitization
SCHEME 1, (S1)
Synthesis of compound 8:
7 amino-4-(trifluoromethyl)coumarin (100 mg, 0.44 mmol) was added to ice cold solution of
bromoacetyl bromide (100 mg, 0.5 mmol) in THF. After 30 min at room temperature 3 ml ice cold
water was added to the reaction mixture.The product was then seperated, washed with water, dried
and recrystallised from Ethyl acetate to obtain crude 2-bromo-N-(2-oxo-(trifluoromethyl)-2H-
chromen-7-yl)acetamide (compound 8).
ESI-MS-: m/z 348, 350
Synthesis of compound 9:
2-bromo-N-(2-oxo-(trifluoromethyl)-2H-chromen-7-yl)acetamide (compound 8) was taken to which
NaI(90 mg, 0.60 mmol) and a few drops of acetone was added. The reaction mixture was refluxed
under Argon environment for 2 h. The mixture was cooled to room temperature, filtered and dried to
obtain bright yellow coloured 2-iodo-N-(2-oxo-4-(trifluoromethyl)-2H-chromen-7-yl) (compound 9).
ESI-MS-: m/z 396 (M-H)
1H NMR: (DMSO-D6, 500 MHz): δ 10.82 (1H, s, Hc); 7.86 (1H, s, Hd); 7.51 (1H, d, J=5.35 Hz, Ha);
6.92 (1H, s, He); 6.65 (1H, d, J= 5.6 Hz, Hb); 3.87(2H, s, Hf)

28
SCHEME 2, S2
Synthesis of compound 2:
A mixture of 4-methyl-1,10-phenanthroline (compound1) (194.23 mg, 1 mmol) and Selenium
dioxide (443.84 mg, 4 mmol) in dioxane containing 4% water (20 ml) was heated under reflux for 60
min. The mixture was then filtered through celite while hot. A solid was found to be separated in
cold filterate and recrystallised from dioxane containing 4% water to give the crude product 1,10-
phenanthroline-4-carbaldehyde (compound 2).
MALDI MS: 209 (M+H)1H NMR: (DMSO-D6, 500 MHz): δ 10.71 (1H, s, Ha); 9.44 (1H,d,J=7.3 Hz,
Hb); 9.18(1H, d, J=5.1 Hz, Hf ); 9.00(1H, d, J=9.2 Hz, Hg); 8.69(1H, d, J=9.15 Hz, Hd); 8.58(1H, d,
J=7.7 Hz, Hc); 8.23-8.44(1H, m, He); 8.17(1H,d, J=8.7 Hz, Hh).
Synthesis of compound 3:
Compound 3 was synthesized using Fmoc protected Rink amide resin HL (100-200 mesh, 0.74
mmol/g resin). The resin was allowed to swell in DMF for 45 minutes. Fmoc deprotection of resin
was done using a solution of 20% Piperidine in DMF. After deprotection, coupling was performed
by taking 20 mg of the deprotected resin and addition of (15.29 mg, 5 equivalence) Compound 2, 1:1
DMF:MeOH (1 ml), AcOH (40 µL) and Na(CN)BH3 (40 mg, 0.637 mmol). These were placed in a
15 mL capped plastic tube and allowed to react for 18 h by placing this tube on a rotor with a speed
of 16 rpm. After 18 h, the solution was allowed to stand for some time and the supernatant solution
was decanted, leaving the resin in the plastic tube. The resin was washed twice, for 20 min each,
with 5 mL of DMF and once with 5 ml of MeOH for 20 min, by placing the tube on a rotor with a
speed of 16 rpm, and dried under reduced pressure. 20 mg of the resin was allowed to react
with trifluoroacetic acid (TFA): triisopropylsilane (TIS):H2O (700 µl: 20 µL: 20 µL) for 4 h, and the
resin was separated by filtration. The solvent was removed under a stream of N2, and the product
(Compound 3) was precipitated in cold Methyl tert-butyl ether, washed twice and dried under
reduced pressure to afford crude product
SCHEME 3, S3
Synthesis of compound c:
2-Chloro-6-methylnicotinic acid (compound a) (500 mg, 2.92 mmol) and thiophenol (compound b)
(380 mg, 3.45 mmol) were both taken and dissolved in DMF (3 ml) whilestirring continuously. This
was followed by the addition of copper(I) bromide (25 mg, 1.75 mmol) and K2CO3(600 mg, 4.35
mmol). The mixture was then heated for 30 min at 130 °C followed by heating for 18 h at 150 °C.
This resulted in the generation of a light yellow solution. The mixture was then cooled and treated
with water (170 ml) to give a yellow suspension, which was washed with ether (3 x 20 ml). The
aqueous solution was then acidified by the addition of acetic acid. This yielded a light yellow
precipitate on cooling. This precipitate was then filtered, washed with water, and then dried

29
thoroughly to yield crude6-methyl-2-(phenylthio)nicotinic acid (compound c) as a pale yellow,
crystalline solid.
MALDI MS: m/z 246 (M+H).
ESMS+: m/z 246 (M+H), ESMS-: m/z 244(M-H).
1H NMR: (CDCl3, 500 MHz) δ 8.26(1H,d,J=7.95 Hz,Ha); 7.29-7.59(2H,m,Hd); 7.41-7.47(2H,m,He);
7.41-7.45(1H,m,Hf); 6.96(1H,d,J=7.95 Hz,Hb); 2.36(3H,s,Hc).
Synthesis of compound d:
Polyphosphoric acid (60 cm3) was added to 6-methyl-2-thiophenoxynicotinic acid. This mixture was
heated at 120 °C for 4 h under argon with stirring. The resulting brown liquid was cooled to room
temperature and then it was slowlypoured into cold concentrated aqueous sodium hydroxide solution
with stirringvigorously. The light yellow precipitate that was formed was collected through filtration.
The product was recrystallized from warm EtOH. The crystals that formed upon standing were
filtered and dried thoroughly to yield 2-methyl-5H-thiochromeno[2,3-b]pyridine-5-one (compound
d) as a pale yellow crystalline solid.
MALDI MS: m/z 228 (M+H), 250(M+K).ESMS+: m/z 228, ESMS-: m/z 226.1H NMR:
(CDCl3,500MHz) δ 8.74(1H,d,J=8Hz,Hc); 8.61(1H,d,J=8Hz,Hg); 7.67-7.72(1H,m,He); 7.63-
7.67(1H,m,Hd); 7.50-7.56(1H,m,Hf); 7.31(1H,d,J-8Hz,Hb); 2.72(3H,s,Ha).
Synthesis of compound e:
A mixture of 4-methyl-1,10-phenanthroline (compound d) and Selenium dioxide (443.84 mg, 10
mmol) in dioxane containing 4% water (20 ml) was heated under reflux for 18 h. The mixture was
then cooled to room temperature and filtered to obtain 5-oxo-5H-thiochromeno[2,3-b]pyridine-2-
carbaldehyde] (compound e) as a pale yellow solid.
MALDI MS: m/z 242(M+1).
ESMS-: m/z 241(M-H)
SCHEME 4, S4
Diazotisation reaction:
50 μL of an aqueous solution of p-TsOH (800 mM, 4 equivalence) was added to 100 μL of a 100
mM solution of compound 10/13/15in DMF in an Eppendorf tube. The resulting solution was
mixedby vortexing it and then cooled to 0 °C in an external ice bath. Thereafter5 x 10 μL aliquots of
an aqueous solution of NaNO2 (400 mM, 2 equivalence) was added to the cooled solutionat 0°C. The
solutionwas mixed thoroughly after every addition and incubated at 0 °C for 1 min. After the
addition of the last aliquot of NaNO2, the diazotizationreaction was allowed to proceed for 15 min
on addition of compound 11 to obtain compounds 12, 14, 16.

30
References:
1. Shafali Gupta, SamsuzzohaMondal, Amit Mhamane, and AnkonaDatta; ‘Smart “Lanthano”
Proteins for Phospholipid Sensing.’ Inorg. Chem. 2013, 52, 12314−12316
2. Junhua Yu, David Parker, Robert Pal, Robert A. Poole, and Martin J. Cann ; ‘A Europium
Complex That Selectively Stains Nucleoli of Cells.’ J. AM. CHEM. SOC. 2006, 128, 2294-
2299.
3. Akiko YAMAJI-HASEGAWA and Masafumi TSUJIMOTO; ‘Asymmetric Distribution of
Phospholipids in Biomembranes.’ Biol. Pharm. Bull. (2006), 29(8) 1547—1553.
4. Wikipedia, Diazonium Compound, can be found in the link as follows
‘http://en.wikipedia.org/wiki/Diazonium_compound’
5. Jacob M. Hooker, Ankona Datta, Mauro Botta, Kenneth N. Raymond and Matthew B. Francis;
‘Magnetic Resonance Contrast Agents from Viral Capsid Shells: A Comparison of Exterior
and Interior Cargo Strategies.’ Nano Lett., Vol. 7, No. 8, 2007.
6. Felix N. Castellano, Jonathan D. Dattelbaum, and Joseph R. Lakowicz; ‘Long-Lifetime Ru(II)
Complexes as Labeling Reagents for Sulfhydryl Groups.’ Analytical Biochemistry 255, 165–
170 (1998).
7. Pierre Montaville, Jean-Michel Neumann, Françoise Russo-Marie, Françoise Ochsenbein and
Alain Sanson; ‘A New Consensus Sequence for Phosphatidylserine Recognition by Annexins.’
J. Biol. Chem. 2002, 277:24684-24693.
8. Cle´mentineFe´au,a Emmanuel Klein,a Paul Kerthb and Luc Lebeaua; ‘Synthesis of a
coumarin-based europium complex for bioanalyte labeling.’ Bioorg. Med. Chem. Lett. 17
(2007) 1499–1503
9. Anders Døssing; ‘Luminescence from Lanthanide(3+) Ions in Solution’; Eur. J. Inorg. Chem.
2005, 1425–1434.
10. Youngmin You, Sumin Lee, Taehee Kim, Kei Ohkubo, Weon-SikChae, Shunichi
Fukuzumi, Gil-JaJhon, Wonwoo Nam, and Stephen J. Lippard; ‘Phosphorescent Sensor for
Biological Mobile Zinc.’ J. Am. Chem. Soc., 2011, 133 (45), pp 18328–18342
11. LizarbeM. A, Barrasa J. I., OlmoN, Gavilanes F., Turnay J; ‘Annexin-phospholipid
interactions. Functional implications’; Int.J. Mol. Sci. 2013, 14, 2652.
12. Youngmin You, Sumin Lee, Taehee Kim, Kei Ohkubo, Weon-Sik Chae, Shunichi
Fukuzumi , Gil-Ja Jhon , Wonwoo Nam , and Stephen J. Lippard; ‘Phosphorescent Sensor for
Biological Mobile Zinc’; J. Am. Chem. Soc., 2011, 133 (45), pp 18328–18342

31