tigerweb user guide - pennsylvania department of … and statistics/tigerweb user... · hydrography...
TRANSCRIPT

1
TIGERweb User Guide
About TIGERweb: TIGERweb is a web-based mapping tool that allows you to view and query boundaries (legal and statistical), features such as, roads, railroads, hydrography and landmarks, such as selected college campuses and national parks, stored in the MAF/TIGER database. TIGERweb covers the 50 states, the District of Columbia, Puerto Rico and the Island Areas. In addition, TIGERweb includes attribute information, including 2010 Census and Census 2000 population and housing unit counts. The TIGERweb applications allow you to view TIGER data without Geographic Information System (GIS) software and without downloading data. With TIGERweb, you can control the map’s content by turning on and off layers. For example, you can view the census tracts in your city, county or state. You can also search for features, view their attributes and compare boundaries for different years. In addition to the online applications, you can access TIGER data stored in TIGERweb by using either the Open Geospatial Consortium, Inc. (OGC) Web Map Service (WMS) standard at: http://www.opengeospatial.org/standards/wms or Esri's Representational State Transfer (REST) interface at: http://www.esri.com/industries/landing-pages/geoservices/geoservices. Both of these services will allow you to produce maps containing TIGERweb layers combined with layers from your own data or other services. Data Available in TIGERweb Vintages: TIGERweb contains two mapping applications, TIGERweb and TIGERweb Decennial. The TIGERweb application contains four vintages: current, two years of American Community Survey (ACS) and Census 2010. The TIGERweb Decennial application contains two vintages: Census 2010 and Census 2000. The vintages contained in both the TIGERweb and the TIGERweb Decennial applications refer to TIGER benchmarks, which are snapshots of the TIGER data in the MAF/TIGER database. The Geography Division creates two benchmarks each year, one in May and another in September. The benchmark created in May is the ACS benchmark. This benchmark supports statistical surveys such as the ACS and the Population Estimates program. The geographic boundaries for the ACS are usually available to the public approximately a year before the release of the statistical data.

2
There are two vintages of ACS data available in TIGERweb so the most current boundaries and the geography matching the most recent ACS statistical data are available. Products from the ACS benchmark are released in late summer/early fall, including adding the data to TIGERweb. There is also a ‘Current’ vintage in TIGERweb. As mentioned above, the Geography Division creates a second yearly benchmark of TIGER each September known as the Boundary and Annexation Survey (BAS) benchmark. Data from this benchmark supports some of our partnership programs, such as the BAS. TIGERweb is updated with data from the BAS benchmark in late winter. This means that for half of the year, the ‘Current’ vintage will match the most recent ACS layer. For the other half of the year, the ‘Current’ vintage will represent the BAS benchmark. If you just want to view the most recent geographic data, use the ‘Current’ vintage. If you are looking at boundaries in relation to ACS data, you should use one of the two ACS vintages.
There is also a 2010 vintage in the TIGERweb application. This vintage represents the boundaries that were in effect for the 2010 Census, but shows them as they appear in the most recent benchmark. This means that it includes updates made since 2010 to linear features such as roads. For example, if a road has been reshaped and it forms the boundary of a geographic area, then the reshaped boundary will be displayed. To view the 2010 Census boundaries exactly as they were in the 2010 Census, use the TIGERweb Decennial version of the application.
You can choose which vintage to view from the Select Vintage dropdown menu, shown below.
The TIGERweb Decennial application contains both 2010 Census geography (data as of January 1, 2010) and Census 2000 (data as of January 1, 2000). TIGERweb Decennial shows the features and geographic areas in TIGER exactly as they were in the 2010 Census. Use this application if you want to view boundaries or features, as they were for the 2010 Census and if you want to view Census 2000 data.

3
Map Layers: The TIGERweb map layers consist of legal and statistical boundaries as well as roads, railroads, and hydrography. The Census Bureau organized the layers into separate groups, termed map services, based on geographic type. Grouping the layers into map services verses individual layers makes rendering the layers more efficient, reducing the layer drawing time. You will have to expand each map service to see all of the available layers. See the list of map services and the features or geographic areas contained within below. Some geographic areas are only available for selected vintages. Please refer to Appendices A and B for a list of geographic areas and vintages. American Indian, Alaska Native, and Native Hawaiian Areas: Alaska Native Regional Corporations Tribal Subdivisions Federal American Indian Reservations Off-Reservation Trust Lands State American Indian Reservations Hawaiian Home Lands Alaska Native Village Statistical Areas Oklahoma Tribal Statistical Areas State Designated Tribal Statistical Areas Tribal Designated Statistical Areas American Indian Joint-Use Areas Census Regions and Divisions Census Divisions Census Regions Census Tracts and Census 2010 Blocks: Census Tracts Census Block Groups Census 2010 Blocks Hydrography Linear Hydrography Areal Hydrography Glaciers

4
Legislative Areas: 108th Congressional Districts 111th Congressional Districts 113th Congressional Districts 114th Congressional Districts 2000 State Legislative Districts – Upper 2000 State Legislative Districts- Lower 2010 State Legislative Districts – Upper 2010 State Legislative Districts- Lower 2013 State Legislative Districts - Upper 2013 State Legislative Districts - Lower 2014 State Legislative Districts – Upper 2014 State Legislative Districts – Lower Voting Districts Metropolitan and Micropolitan Statistical Areas and Related Statistical Areas Combined New England City and Town Areas New England City and Town Areas Combined Statistical Areas Metropolitan and Micropolitan Statistical Areas Metropolitan Statistical Areas/Consolidated Metropolitan Statistical Areas Primary Metropolitan Statistical Areas Military and Other Special Land Use Areas: National Parks Correctional Facilities Colleges and Universities Military Installations Places and County Subdivisions: Estates County Subdivisions Subbarrios Consolidated Cities Incorporated Places Census Designated Places PUMAs, UGAs, and ZCTAs: Public Use Microdata Areas (PUMA) Traffic Analysis Districts (TAD) Traffic Analysis Zones (TAZ) Urban Growth Areas (UGA) ZIP Code Tabulation Areas (ZCTA)

5
School Districts: Unified School Districts Secondary School Districts Elementary School Districts

6
Transportation (Roads and Railroads) Primary Roads Secondary Roads Local Roads Railroads Tribal Census Tracts and Block Groups: Tribal Census Tracts Tribal Block Groups Urban Areas Urbanized Areas Urban Clusters Attributes: You can view the attributes for legal or statistical areas and features by
selecting the Identify tool. The attribute information for Crawford County is below. Population and housing unit count data are available in TIGERweb Decennial and in the 2010 vintage in TIGERweb. For a complete listing of attributes and their definitions, please refer to Appendix C.

7
Using TIGERweb Getting Started: To launch TIGERweb, go to http://tigerweb.geo.census.gov/tigerwebmain/TIGERweb_apps.html. You will see links to the two separate mapping applications on the left hand side, TIGERweb and TIGERweb Decennial. These two applications have the same look and feel. Please note: The TIGERweb application is used for all of the examples below.

8
Tools: All standard navigation tools are available from the TIGERweb Main Display and toolbars. The Main Display includes the Layers, Legend, and Task Results tabs. A B C
D E F G H
I J K L
M
N

9
A. Layers – The Layers tab opens the Layers menu where you can select map content
B. Legend – The Legend tab provides a key to all symbology on the map. Click on ‘Detailed Legend’ to get a complete list of the geography and feature symbols
C. Task Results – The Tasks tab includes the Identify, Query and Geocoder results.
D. Compare – Compare data from two separate vintages E. Identify – Attribute information for the selected area F. Query – Search for geographic entities and features G. Print – Print a map of the selected area, including a title, legend and
overview map H. Help/About – The ‘Help’ link provides basic instructions for all of the
navigation tools. It links to TIGERweb's Help Guide, instructional video and TIGERweb’s main webpage, where you will find background information, map services, system requirements, source information, release updates and contact information. The link also includes information about TIGERweb such as the current version and the vintage of the legal and statistical boundaries and features
I. Find My Location – Uses your location to help you orient yourself on the map
J. Default Extent – Returns you to the original map extent before panning and/or zooming
K. Clear Map – Clears all previous selections L. Zoom In / Zoom Out – Clicking on the individual plus and minus
signs or using the slide bar will increase and decrease the amount of detail on the map
M. Topography – Displays the topography layer in the background, you can toggle between imagery, landmass and terrain
N. Geocoder – Converts an address to an approximate latitude/longitude
Layers:
The ‘Layers’ tab includes all Census geographies in separate map services and can be used to turn the map layers on and off, change the transparency of individual map layers and view the symbology for each map layer.
Users can easily view the relationship between different geographic areas by selecting the map layers from the ‘Layers’ menu. The number of selectable layers is unlimited. Just remember that each layer has a range of zoom levels in which it will display. For example, to see small geography like blocks, you must zoom in to a large enough scale.

10
American Indian areas, on the other hand require a smaller scale to be visible. The ‘Layers’ menu allows you to select vintage, geography, and adjust layer transparency.
1. Select the vintage from the ‘Select Vintage’ dropdown menu to change the vintage (or year) of the data.
2. Check the boxes to select the layers to view on the map. 3. Click on the plus sign to expand each map service and view the
layers within it. Layers in gray are out of scale. Zoom in on the map to make the layers visible and available to identify.
4. Use the slider tool to make the layer more or less transparent. The ‘Layers’ menu:
11
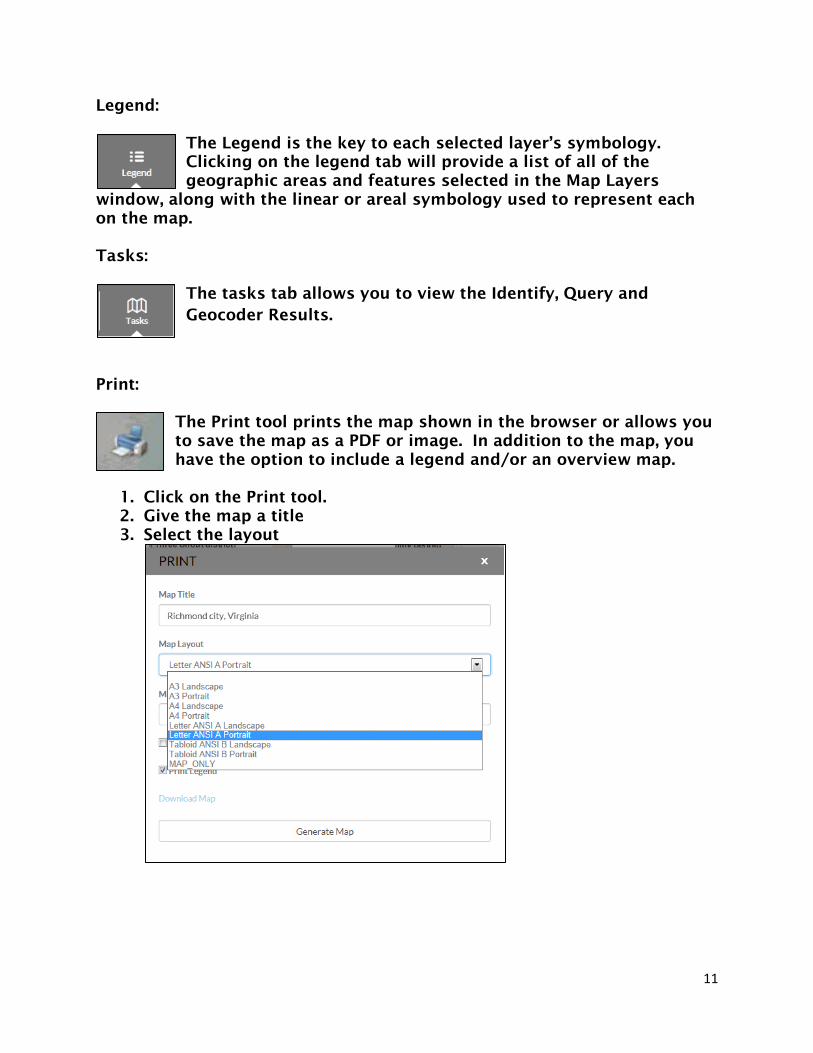
Legend:
The Legend is the key to each selected layer’s symbology. Clicking on the legend tab will provide a list of all of the geographic areas and features selected in the Map Layers
window, along with the linear or areal symbology used to represent each on the map. Tasks:
The tasks tab allows you to view the Identify, Query and Geocoder Results.
Print: The Print tool prints the map shown in the browser or allows you to save the map as a PDF or image. In addition to the map, you have the option to include a legend and/or an overview map.
1. Click on the Print tool. 2. Give the map a title 3. Select the layout

12
4. Then, select the format
The Print tool gives you the option of maintaining the map scale and printing a legend.
5. Next, click on Generate Map. 6. Finally, click on Download Map.

13
The Print tool generates the map shown in the browser
14
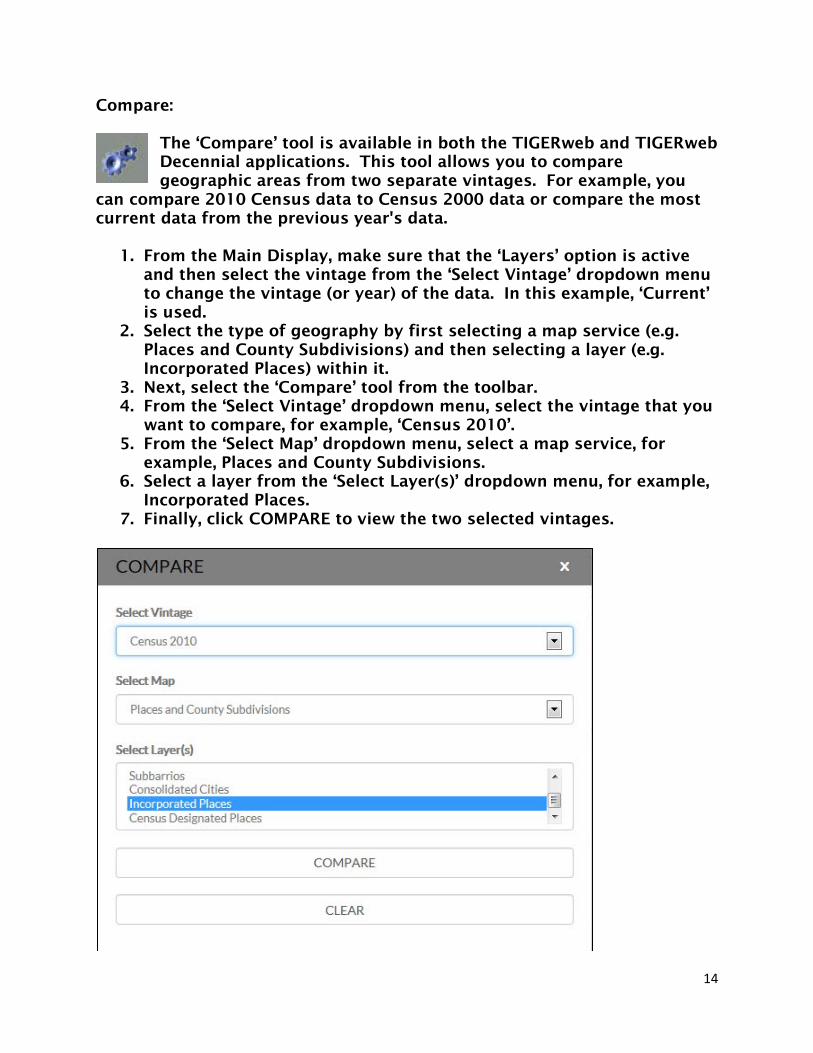
Compare: The ‘Compare’ tool is available in both the TIGERweb and TIGERweb Decennial applications. This tool allows you to compare geographic areas from two separate vintages. For example, you
can compare 2010 Census data to Census 2000 data or compare the most current data from the previous year's data.
1. From the Main Display, make sure that the ‘Layers’ option is active and then select the vintage from the ‘Select Vintage’ dropdown menu to change the vintage (or year) of the data. In this example, ‘Current’ is used.
2. Select the type of geography by first selecting a map service (e.g. Places and County Subdivisions) and then selecting a layer (e.g. Incorporated Places) within it.
3. Next, select the ‘Compare’ tool from the toolbar. 4. From the ‘Select Vintage’ dropdown menu, select the vintage that you
want to compare, for example, ‘Census 2010’. 5. From the ‘Select Map’ dropdown menu, select a map service, for
example, Places and County Subdivisions. 6. Select a layer from the ‘Select Layer(s)’ dropdown menu, for example,
Incorporated Places. 7. Finally, click COMPARE to view the two selected vintages.

15
The vintage that you chose from the ‘Layers’ menu will be shown on the left of the slide bar and the vintage that you chose from the ‘Compare’ tool is on the right side of the slide bar. Drag the slide bar to the left and right to compare the two vintages. This image shows the 2010 Census boundary for Escobares.

16
This image shows the Current boundary for Escobares after the annexation.
Identify:
The Identify tool displays the attributes for all visible layers for the point you selected on the map. The attributes include land and water area in square meters, geographic codes, names and
population counts for geographic areas in the 2010 Census and Census 2000 vintages.
1. From the Main Display, make sure that the ‘Layers’ option is active and then select the vintage and the layer that you want to query. You will need to zoom in far enough to see the boundary or feature you want to query. For example when querying ‘places’, you will need to zoom in until you can see the place boundaries on the map.
2. Click on the Identify tool. 3. Click on START.

17
4. Click inside of the ‘place’ boundary on the map to get the attribute data.
5. You will then see the geographic areas listed under ‘Identify Results’ from the Tasks menu located in the Main Display.
18
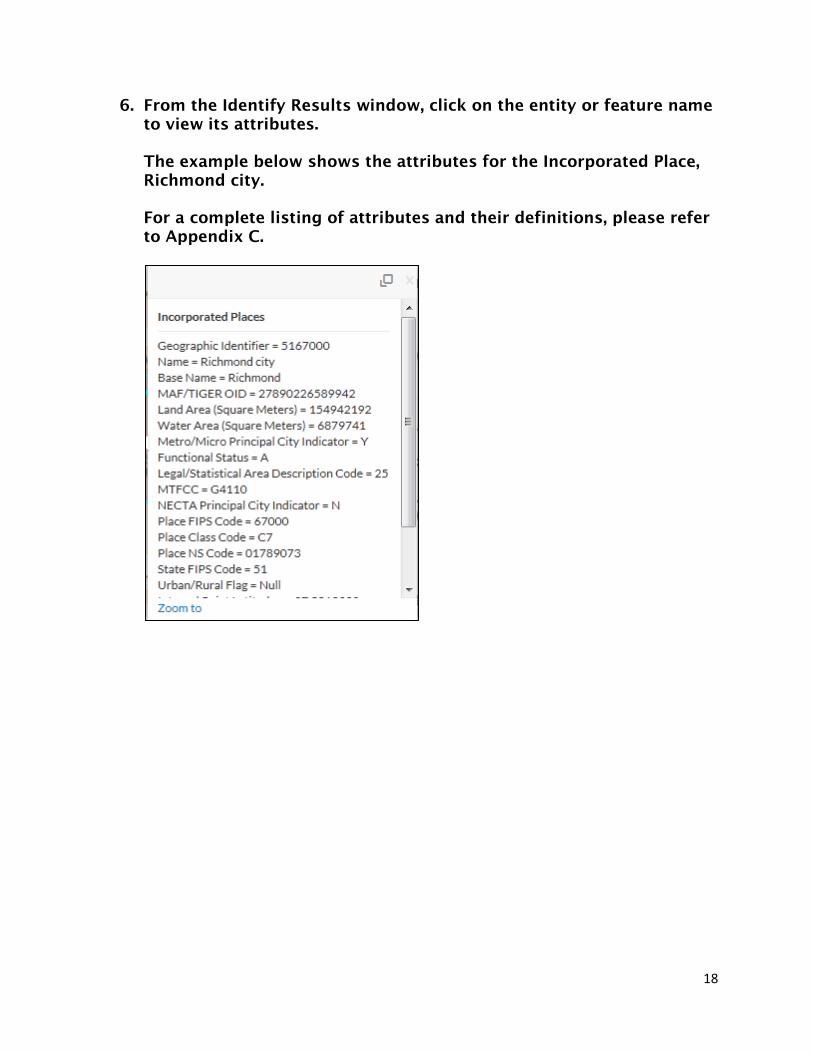
6. From the Identify Results window, click on the entity or feature name to view its attributes.
The example below shows the attributes for the Incorporated Place, Richmond city.
For a complete listing of attributes and their definitions, please refer to Appendix C.

19
Query: The Query tool allows you to search the geographic layers to find a geographic area on the map.
There are two types of query functions, the attribute query and the spatial query. The attribute query allows you to search legal and statistical areas, and features by name or geographic code. The spatial query allows you to search by drawing a polygon or a line. Attribute Query:
1. From the Main Display, make sure that the ‘Layers’ option is active and then select the vintage and the layer that you want to query. You will need to zoom in far enough to see the boundary or feature you want to query. For example when querying the transportation layer, you will need to zoom in until you can see road features and road names.
2. Next, select the ‘Query’ tool from the toolbar (the default is Attribute query)
3. From the ‘Select Map’ dropdown, select a map service from the list.
20
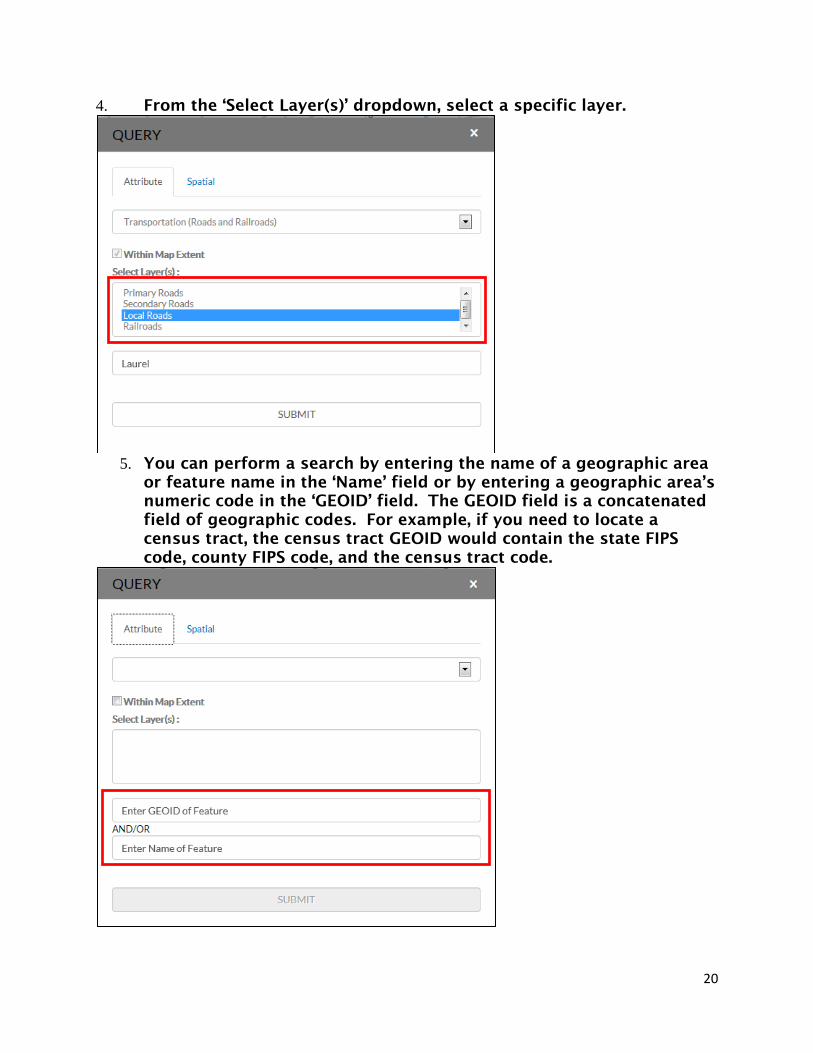
4. From the ‘Select Layer(s)’ dropdown, select a specific layer.
5. You can perform a search by entering the name of a geographic area
or feature name in the ‘Name’ field or by entering a geographic area’s numeric code in the ‘GEOID’ field. The GEOID field is a concatenated field of geographic codes. For example, if you need to locate a census tract, the census tract GEOID would contain the state FIPS code, county FIPS code, and the census tract code.
21
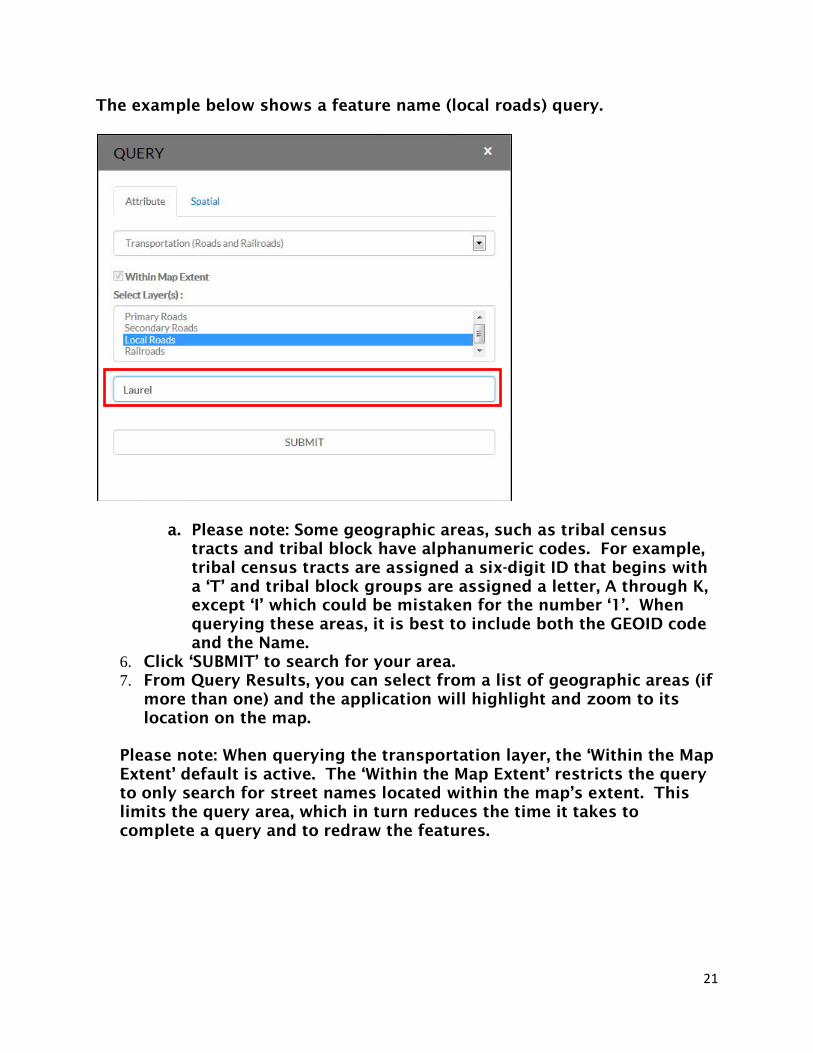
The example below shows a feature name (local roads) query.
a. Please note: Some geographic areas, such as tribal census tracts and tribal block have alphanumeric codes. For example, tribal census tracts are assigned a six-digit ID that begins with a ‘T’ and tribal block groups are assigned a letter, A through K, except ‘I’ which could be mistaken for the number ‘1’. When querying these areas, it is best to include both the GEOID code and the Name.
6. Click ‘SUBMIT’ to search for your area. 7. From Query Results, you can select from a list of geographic areas (if
more than one) and the application will highlight and zoom to its location on the map.
Please note: When querying the transportation layer, the ‘Within the Map Extent’ default is active. The ‘Within the Map Extent’ restricts the query to only search for street names located within the map’s extent. This limits the query area, which in turn reduces the time it takes to complete a query and to redraw the features.

22
You will get a list of the local road(s) named ‘Laurel’; you must then select an entry by clicking on it.
The attribute query results are below. The map below shows the local road, Laurel highlighted with a red line.

23
Spatial Query:
1. From the Main Display, make sure that the ‘Layers’ option is active and then select the vintage and the layer that you want to query. You will need to zoom in far enough to see the boundary or feature you want to query.
2. Next, select the ‘Query’ tool from the toolbar (select Spatial) 3. From the ‘Select Map’ dropdown, select a type of geography. 4. From the ‘Select Layer’ dropdown, select a specific layer. 5. Select a drawing tool, for this example the rectangle search tool is
used, and then draw a polygon on the map.
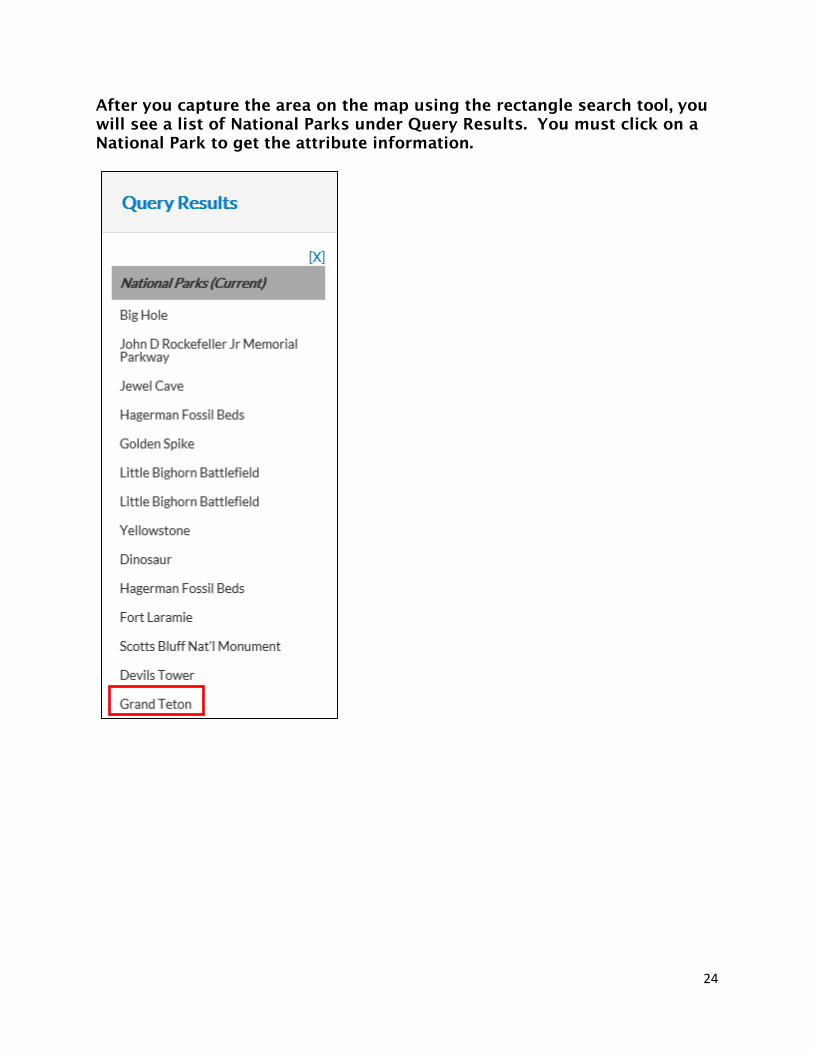
This example illustrates a spatial query for National Parks.
Each drawing tool captures an area or feature differently. For example, if you only need to capture a single area use the circle (point search) tool. If you need to capture multiple areas or features, use the polygon search tool.
24
After you capture the area on the map using the rectangle search tool, you will see a list of National Parks under Query Results. You must click on a National Park to get the attribute information.

25
The map below shows the Grand Teton National Park in green.

26
Help/About:
The Help/About tool displays information about TIGERweb such as the current version and the vintage of the legal and statistical boundaries and features.
Find My Location:
The Find my Location tool is a location awareness feature. It gathers your location information in order to help you orient yourself on the map and to help you navigate to various locations on the map more quickly.
Default Extent:
Returns you to the original map extent before panning and/or zooming

27

28
Clear Map: Clears all previous selections
Zoom In/Zoom Out:
The ‘Zoom In’ tool increases the amount of detail on the map. There are three ways to zoom in. First, you can zoom in by clicking on the ‘Zoom In’ tool located on the tool bar. Using this method automatically zooms the map in. You can also zoom in by rolling the mouse wheel forward. Finally, you can zoom in using the Zoom In / Zoom Out vertical scale bar located on the left hand side of the map. Move the slide up to zoom in. The ‘Zoom Out’ tool decreases the amount of detail on the map. There are three ways to zoom out. First, you can zoom out by clicking on the ‘Zoom Out’ tool located on the tool bar. Using this method
automatically zooms the map out. You can also zoom out by rolling the mouse wheel backward. Finally, you can zoom out using the Zoom In / Zoom Out vertical scale bar located on the left hand side. Move the slide down to zoom out. Topography:
The Topography button displays the topography layer in the background; users can toggle between imagery, landmass and terrain.
Census Geocoder:
The Census Geocoder is an address look-up tool that will convert your address to an approximate latitude/longitude. The map will automatically

29
locate and zoom to the address that you enter. You can then view the geographic areas that the point is within. Web Services: The Census Bureau does not recommend that you use the TIGERweb viewer to analyze data or link to data. For these tasks, TIGERweb offers two types of web services: the Open Geospatial Consortium, Inc. (OGC) Web Map Service (WMS) standard and Esri's Representational State Transfer (REST) interface. Both options allow you to access the TIGER data stored in the TIGERweb database. If you have a client that supports the WMS standard, then you may access our Web Map Services using the TIGERweb WMS URLs and TIGERweb Decennial WMS URLs listed at the bottom of page: http://tigerweb.geo.census.gov/tigerwebmain/TIGERweb_wms.html If you have a client that supports the REST interface, then you may access the map services by adding the following URL to your Rest interface client application http://tigerweb.geo.census.gov/arcgis/rest/services/TIGERweb Other TIGERweb Data: The TIGERweb main webpage at: http://tigerweb.geo.census.gov/tigerwebmain/ contains additional information including 508-compliant data files. The Data Files tab includes the record layouts for all of the map services and layers available from both the TIGERweb and the TIGERweb Decennial mapping applications. The TIGERweb Geography tab includes links to the geographic entity definitions. Other TIGER Data: The TIGER Products webpage at: http://www.census.gov/geo/maps-data/data/tiger.html contains links to the entire collection of TIGER products including; TIGER/Line Shapefiles, geodatabases, cartographic boundary files, KML files and TIGERweb.

30
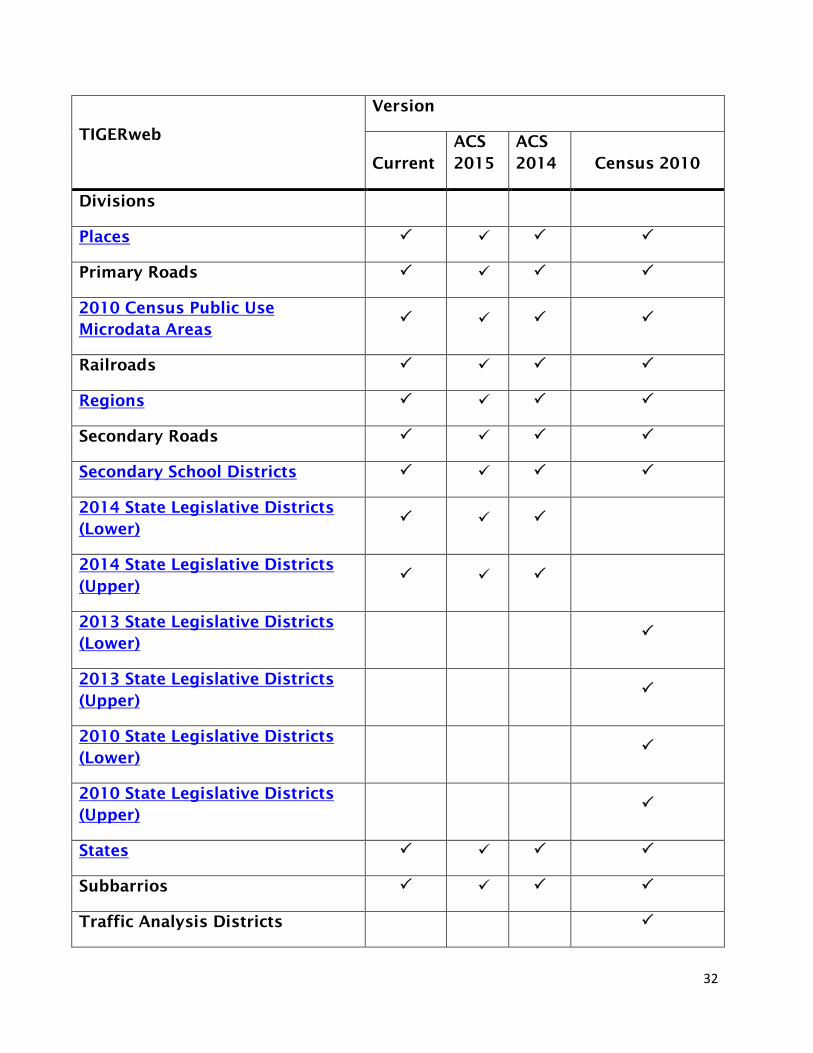
Appendix A TIGERweb Map Layers and Vintage
TIGERweb
Version
Current ACS 2015
ACS 2014 Census 2010
Alaska Native Regional Corporation
American Indian/Alaska Native/Native Hawaiian Areas
Including:
Alaska Native Regional Corporations Tribal Subdivisions Federal American Indian Reservations Off-Reservation Trust Lands State American Indian Reservations Hawaiian Home Lands Alaska Native Village Statistical Areas Oklahoma Tribal Statistical Areas State Designated Tribal Statistical Areas Tribal Designated Statistical Areas American Indian Joint-Use Areas
American Indian Tribal Subdivision
Areal Hydrography
Census 2010 Blocks
Block Groups
Census Tracts

31
TIGERweb
Version
Current ACS 2015
ACS 2014 Census 2010
Combined New England City and Town Areas
Combined Statistical Areas
114th Congressional Districts
113th Congressional Districts
111th Congressional Districts
Consolidated Cities
Counties
County Subdivisions
Divisions
Elementary School Districts
Estates
Hydrography
Linear Hydrography
Local Roads
Metropolitan Divisions
Metropolitan Statistical Areas
Micropolitan Statistical Areas
Military Installations
New England City and Town Areas
New England City and Town
32
TIGERweb
Version
Current ACS 2015
ACS 2014 Census 2010
Divisions
Places
Primary Roads
2010 Census Public Use Microdata Areas
Railroads
Regions
Secondary Roads
Secondary School Districts
2014 State Legislative Districts (Lower)
2014 State Legislative Districts (Upper)
2013 State Legislative Districts (Lower)
2013 State Legislative Districts (Upper)
2010 State Legislative Districts (Lower)
2010 State Legislative Districts (Upper)
States
Subbarrios
Traffic Analysis Districts

33
TIGERweb
Version
Current ACS 2015
ACS 2014 Census 2010
Traffic Analysis Zones
Tribal Block Groups
Tribal Census Tracts
Unified School Districts
Urban Areas
Urban Growth Areas
Voting Districts
2010 Census ZIP Code Tabulation Areas

34
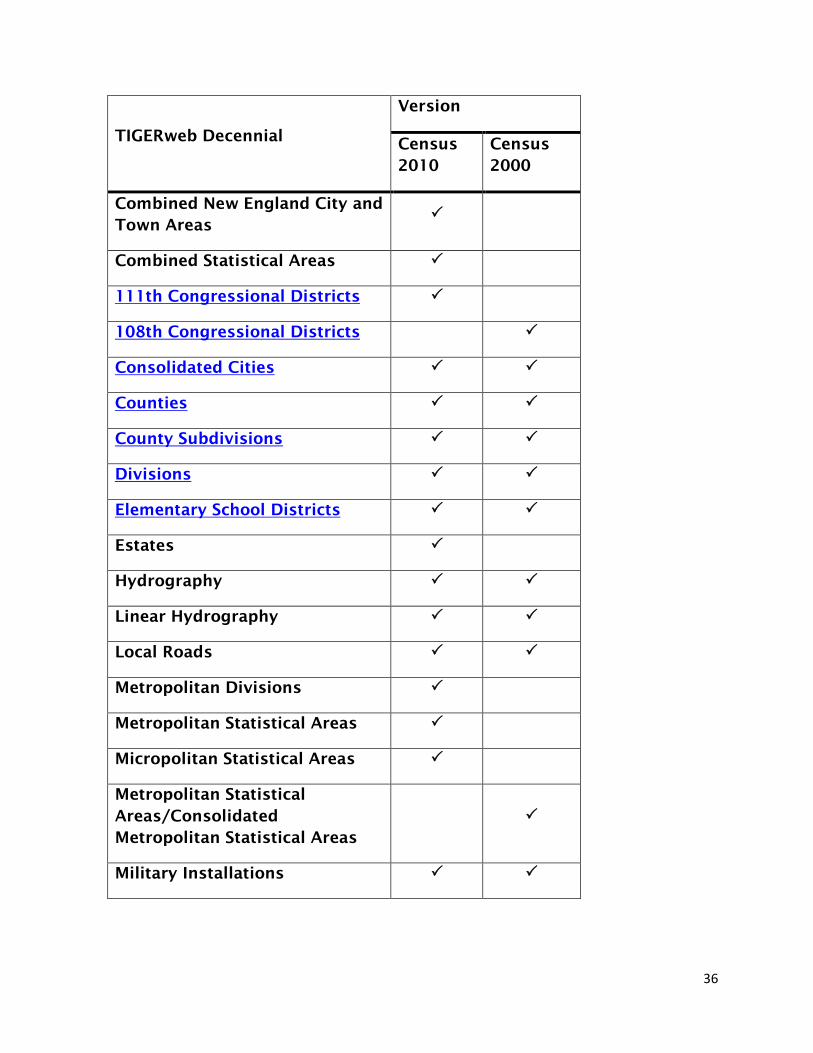
Appendix B
TIGERweb Decennial Map Layers and Vintage
TIGERweb Decennial
Version
Census 2010
Census 2000
Alaska Native Regional Corporation
American Indian/Alaska Native/Native Hawaiian Areas
Including:
Alaska Native Regional Corporations Tribal Subdivisions Federal American Indian Reservations Off-Reservation Trust Lands State American Indian Reservations Hawaiian Home Lands Alaska Native Village Statistical Areas Oklahoma Tribal Statistical Areas State Designated Tribal Statistical Areas Tribal Designated Statistical Areas American Indian Joint-Use Areas
American Indian Tribal Subdivision
Areal Hydrography
Census 2010 Blocks
Block groups

35
TIGERweb Decennial
Version
Census 2010
Census 2000
Census Tracts
36
TIGERweb Decennial
Version
Census 2010
Census 2000
Combined New England City and Town Areas
Combined Statistical Areas
111th Congressional Districts
108th Congressional Districts
Consolidated Cities
Counties
County Subdivisions
Divisions
Elementary School Districts
Estates
Hydrography
Linear Hydrography
Local Roads
Metropolitan Divisions
Metropolitan Statistical Areas
Micropolitan Statistical Areas
Metropolitan Statistical Areas/Consolidated Metropolitan Statistical Areas
Military Installations

37
New England City and Town Areas Including: Metropolitan New England City and Town Areas Micropolitan New England City and Town Areas
New England City and Town Divisions
Places
Primary Metropolitan Statistical Areas
Primary Roads
Public Use Microdata Areas
Railroads
Regions
Secondary Roads
Secondary School Districts
2010 State Legislative Districts (Lower)
2010 State Legislative Districts (Upper)
2000 State Legislative Districts (Lower)
2000 State Legislative Districts (Upper)
States
Subbarrios

38
Tribal Census Tracts
Tribal Block Groups
Unified School Districts
Urban Areas
Urban Growth Areas
Voting Districts
ZIP Code Tabulation Areas

39
Appendix C Attribute Definitions Attribute Attribute Definition
AIANNH American Indian/Alaska Native/Native Hawaiian Area Census code
AIANNHCC American Indian/Alaska Native/Native Hawaiian Area FIPS Class code
AIANNHFP1 American Indian/Alaska Native/Native Hawaiian Area FIPS code 1
AIANNHFP2 American Indian/Alaska Native/Native Hawaiian Area FIPS code 2
AIANNHFP3 American Indian/Alaska Native/Native Hawaiian Area FIPS code 3
AIANNHR Flag indicating level of recognition of an American Indian, Alaska Native, or Native Hawaiian Area
AIANNHNS American Indian/Alaska Native/Native Hawaiian Area GNIS code
AIHHTLI Reservation/Statistical Area or Off-Reservation Trust Land Indicator
AITS1 Tribal Subdivision FIPS code 1 AITS2 Tribal Subdivision FIPS code 2 AITS3 Tribal Subdivision FIPS code 3 AITSCC FIPS Class code AITSCE Tribal Subdivision Census code AITSNS Tribal Subdivision GNIS code ANRC Alaska Native Regional Corporation FIPS code ANRCCC Alaska Native Regional Corporation FIPS Class code ANRCNS Alaska Native Regional Corporation GNIS code
ANSICODE Official code for the landmark for use by federal agencies for data transfer and dissemination
AREALAND Land Area (square meters) - Created for statistical purposes only.
AREAWATER Water Area (square meters) - Created for statistical purposes only.
ARTPATH Artificial path indicator. BASENAME Base name portion of the standardized name BASESTAT Military Installation Operational Status Flag BLKGRP Census Block Group code BLOCK Census Block code
CBSA Core-based Metropolitan and Micropolitan Statistical Area FIPS code
CBSAPCI CBSA Principal City Indicator

40
Attribute Attribute Definition CD108 108th Congressional District code CD111 111th Congressional District code CD112 112th Congressional District code CD113 113th Congressional District code CD114 114th Congressional District code CDSESSN Congressional District Session code CENTLAT Centroid Latitude CENTLON Centroid Longitude CMSA Combined Metropolitan Statistical Area FIPS code CNECTA Combined New England City and Town Area FIPS code CONCITCC Consolidated City Class code CONCITNS Consolidated City GNIS code CONCITY Consolidated City FIPS code COUNTY FIPS County code COUNTYCC County Class code COUNTYNS County GNIS code COUSUB County Subdivision FIPS code COUSUBCC County Subdivision Class code COUSUBNS County Subdivision GNIS code CSA Combined Statistical Area FIPS code DIVISION Division Census code ESTATE Estate FIPS code ESTATECC Estate FIPS Class code ESTATENS Estate National Standard code
FSRFLG American Indian/Alaska Native/Native Hawaiian Area Federal-State Recognition Flag
FUNCSTAT Functional Status GEOID Geographic Identifier - fully concatenated geographic code HIGRADE Highest grade covered by school district HU100 Housing Count INTPTLAT Latitude of internal point INTPTLON Longitude of internal point ISLOCAL A flag that indicates whether a feature is local or official. LOGRADE Lowest grade covered by school district LSADC Legal/Statistical Area Description LSY Legislative Session Year MATYP Metropolitan Statistical Area Distinction Flag METDIV Metropolitan Division FIPS code MILTYP Military Installation Type
MSACMSA Metropolitan Statistical Area/Combined Metropolitan Statistical Area code
MTFCC MAF/TIGER feature class code NAME Name with Legal/Statistical Area Description

41
Attribute Attribute Definition NECTA New England City and Town Area FIPS code NECTADIV New England City and Town Area Division FIPS code NECTAPCI NECTA Principal City Indicator OID Object ID PLACE Place FIPS code PLACECC Place Class code PLACENS Place GNIS code PMSA Primary Metropolitan Statistical Area code POP100 Population Count PREDIR Prefix direction code component of the feature name.
PREDIRABRV Prefix direction description component of the feature name.
PREQUAL Prefix qualifier code component of the feature name.
PREQUALABRV Prefix qualifier description component of the feature name.
PRETYP Prefix type code description component of the feature name.
PRETYPEABRV Prefix type description component of the feature name PUMA Public Use Microdata Area Census code REGION Region Census code RTTYP Route type code SDELM Elementary School District code SDSEC Secondary School District code SDTYP School district type SDUNI Unified School District code SLDL State Legislative District Lower Chamber code SLDU State Legislative District Upper Chamber code STATE State FIPS code STATENS State GNIS code STUSAB USPS State Abbreviation SUBMCD Subminor Civil Division FIPS code SUBMCDCC Subminor Civil Division Class code SUBMCDNS Subminor Civil Division GNIS code SUFDIR Suffix direction code component of the feature name.
SUFDIRABRV Suffix direction description component of the feature name.
SUFQUAL Suffix qualifier code component of the feature name.
SUFQUALABRV Suffix qualifier description component of the feature name.
SUFTYP Suffix type code description component of the feature. SUFTYPEABRV Suffix type description component of the feature name. TAD Traffic Analysis District TAZ Traffic Analysis Zone

42
TBLKGRP Tribal Block Group Census code TRACT Census Tract code TTRACT Tribal Tract Census code UA Urban Area Census code UGA Urban Growth Area code Attribute Attribute Definition UGATYP Urban Growth Area type UR Urban / Rural Flag VTD Voting District code VTDI Voting District Indicator ZCTA5CC ZCTA Class Code ZCTA5 Zip Code Tabulation Area Code ZIP ZIP Code