time development and operations resources infrastructure – procure and setup develop solution...
TRANSCRIPT


Introducing Azure Stream AnalyticsJudy MeyerPrincipal Group Program Manager
DBI-B316

Breakout SessionsCDP-B307 Azure Event Hub (Fri 2:45)
Related content
Lab DBI-IL204 Speed Lab Azure Stream
Analytics (Fri 8:30)Find Me Later At…Microsoft Solutions Experience Location
(MSE):Data Platform & Business Intelligence
Ask the Experts
Introducing…Azure Stream Analytics

Data at Rest Data in Motion
why

What are customers wanting to do?
Smart grid CRM alerting sales with customer scenario
Data and identity protection services
Real-time fraud detection
Click-stream analysis
Real-time financial portfolio alerts
Connected car scenario
Real-time financial sales tracking
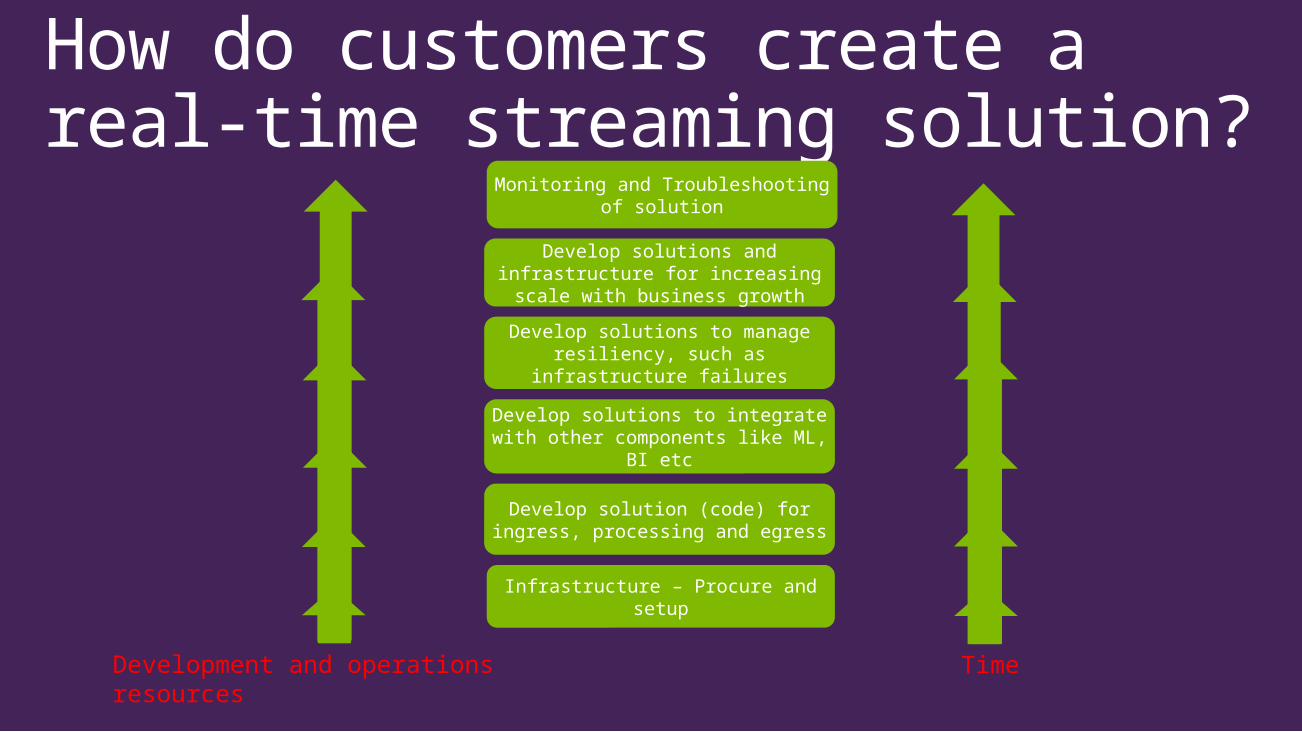
How do customers create a real-time streaming solution?
TimeDevelopment and operations resources
Infrastructure – Procure and setup
Develop solution (code) for ingress, processing and egress
Develop solutions to integrate with other components like ML, BI etc
Develop solutions to manage resiliency, such as infrastructure
failures
Develop solutions and infrastructure for increasing scale with business
growth
Monitoring and Troubleshooting of solution

Customers using Azure Stream Analytics
Infrastructure – Procure and setup
Develop solution (code) for ingress, processing and egress
Develop solutions to integrate with other components like ML, BI etc
Develop solutions to manage resiliency, such as infrastructure
failures
Develop solutions and infrastructure for increasing scale with business
growth
Monitoring and Troubleshooting of solution
From Event or Data Streams to Real Time Insights in less time with less people resources

High Throughput
Low Latency
what Dashboard
Monitoring
Internet of Things
Command & Control
Real Time
Blob Archiving

Canonical Event-driven ScenarioIngestor (broker)
Collection Presentation and action
Event producers
Transformation
Long-term storage
Event hubs
Storage adapters
Stream processingCloud gateways
(web APIs)
Field gateways
Applications
Legacy IOT (custom protocols)
Devices
IP-capable devices(Windows/Linux)
Low-power devices (RTOS)
Search and query
Data analytics (Excel)
Web/thick client dashboards
Service bus
Azure DBs
Azure storage
HDInsight
Stream Analytics
Devices to take action

Aerocrine Experience
Join me in Welcoming…
Anders Murman, CTO of Aerocrine

Company Confidential
Improving Asthma Diagnosis and Treatment
NIOX® MINO®
NIOX® VERO®

Better Asthma OutcomesFeNO testing improves patient outcomes while
decreasing exacerbations.
Cost-EffectivenessFeNO testing saves healthcare costs by
decreasing ER visits and hospitalizations.
Physician and Patient Behavior
FeNO testing improves appropriate medication use, predicts relapse, and provides compliance
monitoring.
Value Added by FeNO Testing
Unmet Need
Aerocrine is building support through promoting the value of FeNO to KOLs, payers and providers
1 Establish FeNO as Standard of Care

2 Drive Penetration in Defined U.S. Professional Segment
Currently, Aerocrine has 26 sales territories staffed, 4 regional managers and 3 csls

Microsoft Connectivity project
NAVCRM
Azure
MS/AER Streaming Analytics
MS/AER PowerBI reporting and app
publishing
Customer Support
Local sales reps
Mgmt

More AboutAzure Stream Analytics

Introducing stream analytics
Mission critical reliability and scale
Enables rapid development
Fully managed real-time analytics

Intake millions of events per secondProcess data from connected devices/appsIntegrated with highly-scalable publish-subscriber ingestor
Easy processing on continuous streams of data Transform, augment, correlate, temporal operationsDetect patterns and anomalies in streaming data
Correlate streaming with reference data
Real-time analytics

No challenges with deployment
No hardware acquisition and maintenance
Bypasses deployment expertiseUp and running in a few clicks (and within minutes)No software provisioning and maintaining
Easily expand your business globally

Introducing stream analytics
Mission critical reliability and scale
Enables rapid development
Fully managed real-time analytics

Guaranteed events deliveryGuaranteed not to lose events or incorrect outputPreserves event order on per-device basis
Guaranteed business continuityGuaranteed uptime (three nines of availability)Auto-recovery from failures Built in state management for fast recovery
Mission critical reliability
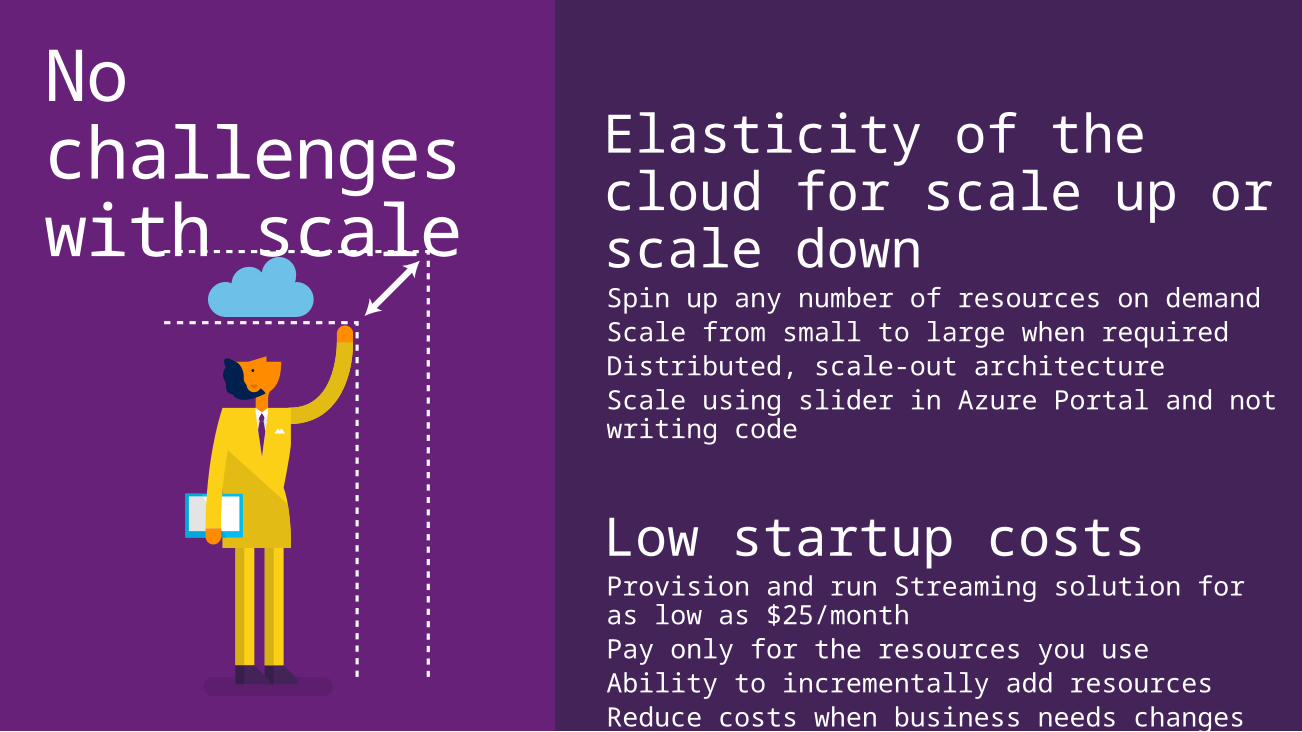
Elasticity of the cloud for scale up or scale downSpin up any number of resources on demandScale from small to large when requiredDistributed, scale-out architectureScale using slider in Azure Portal and not writing code
Low startup costsProvision and run Streaming solution for as low as $25/month Pay only for the resources you useAbility to incrementally add resourcesReduce costs when business needs changes
No challenges with scale

Introducing stream analytics
Mission critical reliability and scale
Enables rapid development
Fully managed real-time analytics

Decrease bar to create Stream Processing Solutions via SQL-like LanguageEasily filter, project, aggregate, join streams, add static data with streaming data, detect patterns or lack of patterns with a few lines of SQLBuilt-in temporal semantics
Development and debugging experience through Azure PortalManage out-of-order events & actions on late arriving events via configurations
Rapid DevelopmentRapid Development

Scheduling and monitoring built in
Built-in monitoring View your system’s performance at a glanceHelp you find the cost-optimal way of deployment
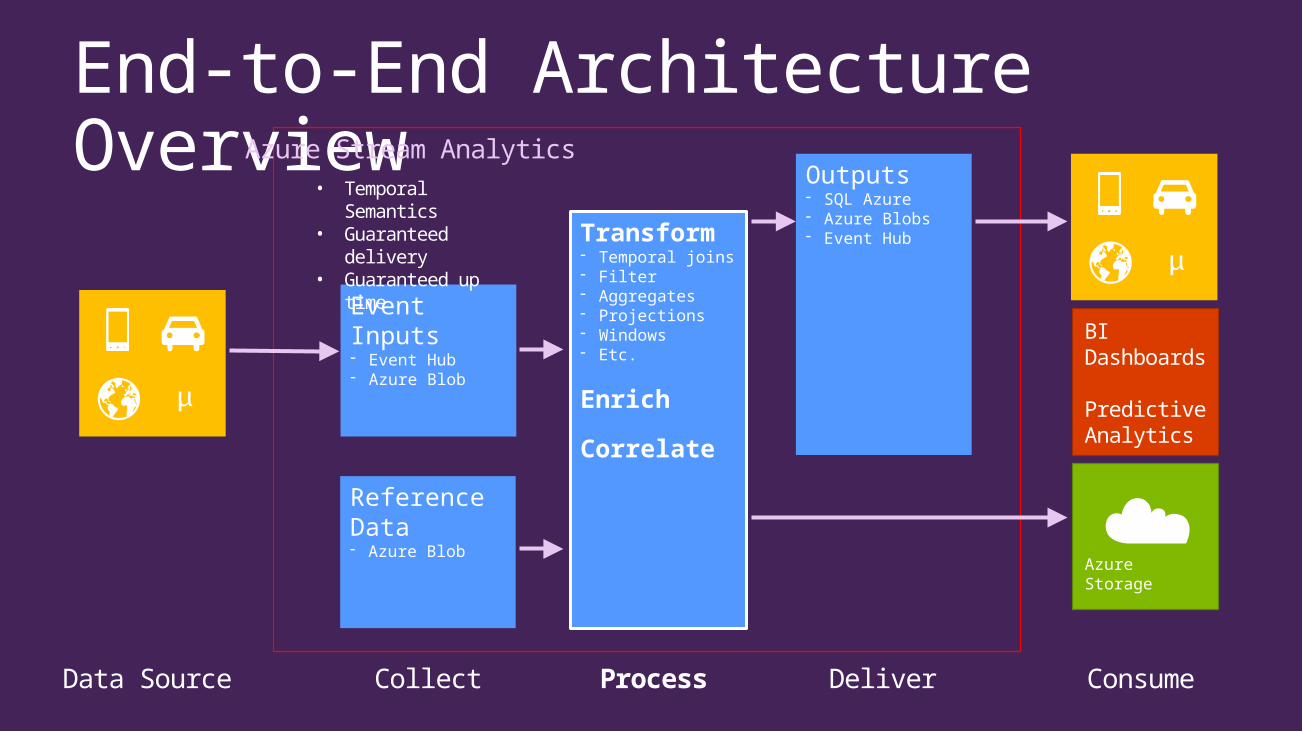
End-to-End Architecture Overview
Data Source Collect Process ConsumeDeliver
Event Inputs- Event Hub- Azure Blob
Transform- Temporal joins- Filter- Aggregates- Projections- Windows- Etc.
Enrich
Correlate
Outputs- SQL Azure- Azure Blobs- Event Hub
☁
BI Dashboards
Predictive Analytics
AzureStorage
• Temporal Semantics
• Guaranteed delivery
• Guaranteed up time
Azure Stream Analytics
Reference Data- Azure Blob
Azure Stream Analytics
In Action
Dipanjan BanikProgram Manager

SELECT count(*), Topic FROM TweetsGROUP BY Topic, TumblingWindow(second, 5)
Let’s count tweets by topic…
That’s all. Just 2 (very short) lines of code.
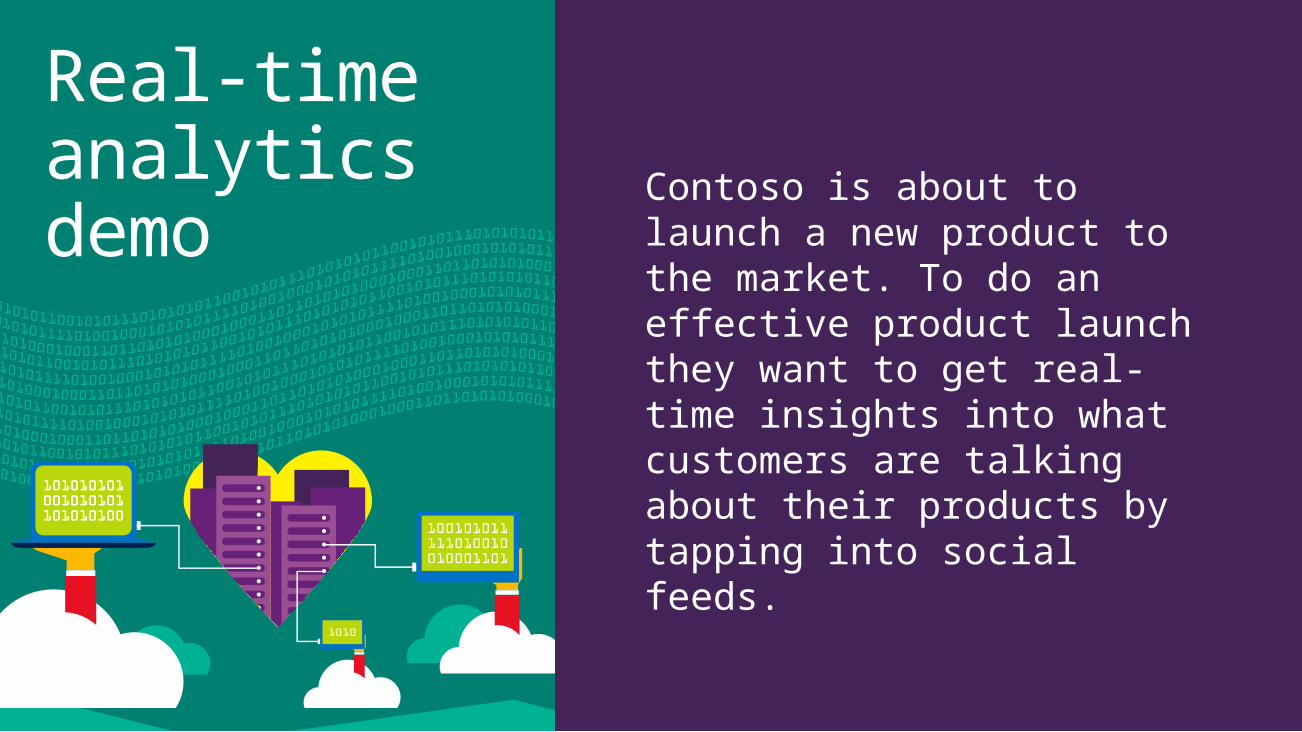
Contoso is about to launch a new product to the market. To do an effective product launch they want to get real-time insights into what customers are talking about their products by tapping into social feeds.
Real-time analytics demo
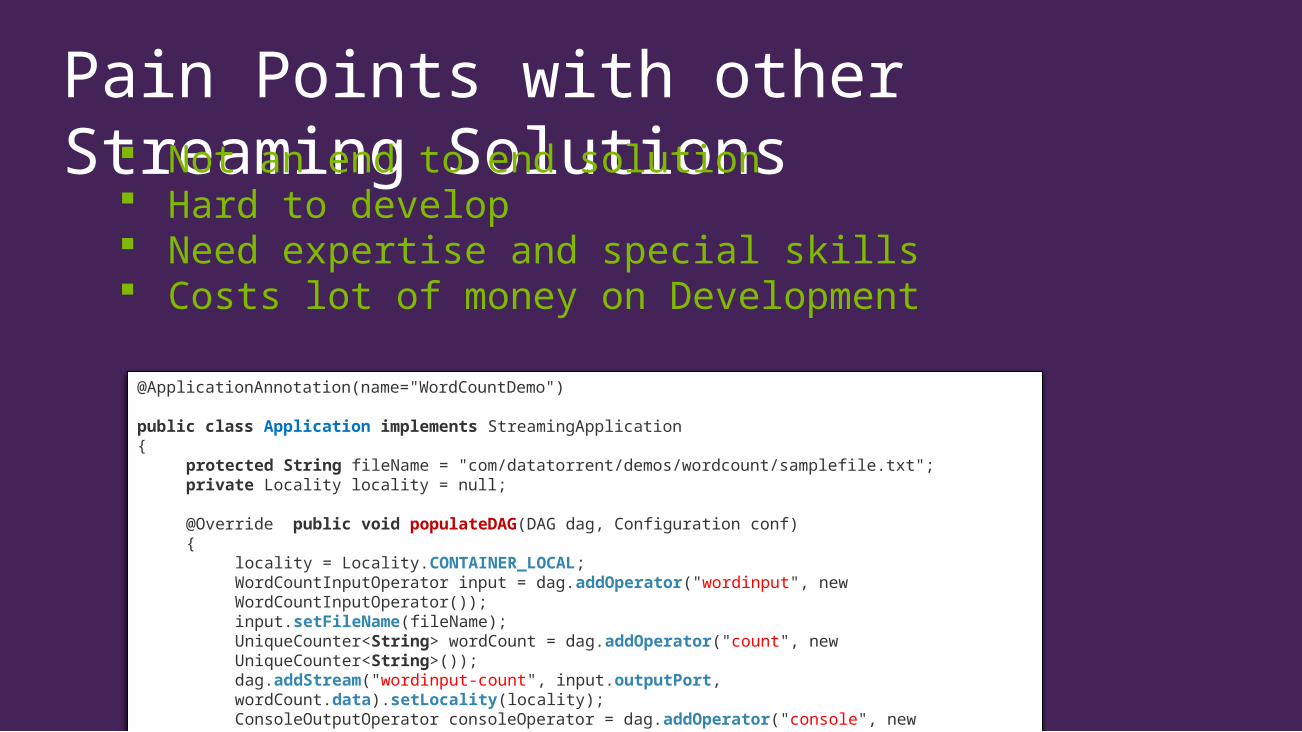
Pain Points with other Streaming Solutions Not an end to end solution
Hard to develop Need expertise and special skills Costs lot of money on Development
@ApplicationAnnotation(name="WordCountDemo")
public class Application implements StreamingApplication{
protected String fileName = "com/datatorrent/demos/wordcount/samplefile.txt"; private Locality locality = null;
@Override public void populateDAG(DAG dag, Configuration conf) {
locality = Locality.CONTAINER_LOCAL; WordCountInputOperator input = dag.addOperator("wordinput", new WordCountInputOperator()); input.setFileName(fileName); UniqueCounter<String> wordCount = dag.addOperator("count", new UniqueCounter<String>()); dag.addStream("wordinput-count", input.outputPort, wordCount.data).setLocality(locality); ConsoleOutputOperator consoleOperator = dag.addOperator("console", new ConsoleOutputOperator()); dag.addStream("count-console",wordCount.count, consoleOperator.input);
} }


Azure Stream Analytics Query Language

Query Language
You write declarative queries in SQL No code compilation, easy to author and deploy
Unified programming modelBrings together event streams, reference data and machine learning extensions
Temporal Semantics All operators respect, and some use, the temporal properties of events
Built-in operators and functionsThese should (mostly) look familiar if you know relational databases
Filters, projections, joins, windowed (temporal) aggregates, text and date manipulation

Scenario – Toll Station
Our toll station has multiple toll booths, where a sensor placed on top of the booth scans an RFID card affixed to the windshield of the vehicles as they pass the toll booth.
The passage of vehicles through these toll stations can be modelled as event streams over which interesting operations can be performed.
Entry data stream
Exit data stream
Toll Id
EntryTimeLicensePlat
eStat
eMake Model
Vehicle Type
Vehicle Weight
Toll Tag
12014-09-10
12:01:00.000JNB 7001 NY Honda CRV 1 1535 7
22014-09-10
12:02:00.000YXZ 1001 NY Toyota Camry 1 1399 4 123456789
…
Toll Id
ExitTime LicensePlate
1 2014-09-10T12:03:00.0000000Z JNB 7001
2 2014-09-10T12:03:00.0000000Z YXZ 1001
…

Projections
1, 1450, “VW”, “Golf”, (…)
2, 1230, “Toyota”,“Camry”, (…)
1, 2400, “VW”,“Passat”, (…)
1, 980, “Ford”,“Fiesta”, (…)
SELECT TollId, VehicleWeight / 1000 AS Tons FROM EntryStream
1, 1.45 2, 1.23 1, 2.40 1, 0.980
Show me the Toll Id and Vehicle Weight in Tons for all vehicles passing through the Toll Booth
Time

Filters
SELECT Model FROM EntryStream WHERE Make = "VW"
1, 1450, “VW”, “Golf”, (…)
2, 1230, “Toyota”,“Camry”, (…)
1, 2400, “VW”,“Passat”, (…)
1, 980, “Ford”,“Fiesta”, (…)
“Golf” “Passat”
Show me the Model of vehicles manufactured by Volkswagen
Time

Tumbling Windows
SELECT TollId, COUNT(*) FROM EntryStream GROUP BY TollId, TumblingWindow(minute,5)
How many vehicles entered each toll both every 5 minutes?

Aggregate functionsCount, Min, Max, Avg, Sum
Scalar functionsCast
Date and time: Datename, Datepart, Day, Month, Year, Datediff, Dateadd
String: Len, Concat, Charindex, Substring, Patindex
Types
Built-in functions and supported types
Type Descriptionbigint Integers in the range -2^63 (-9,223,372,036,854,775,808) to 2^63-1 (9,223,372,036,854,775,807).
float Floating point numbers in the range - 1.79E+308 to -2.23E-308, 0, and 2.23E-308 to 1.79E+308.
nvarchar(max) Text values, comprised of Unicode characters. Note: A value other than max is not supported.
datetime Defines a date that is combined with a time of day with fractional seconds that is based on a 24-hour clock and relative to UTC (time zone offset 0).

Pricing

Stream Analytics is priced on two variables:
Volume of data processed Streaming units required to process the data stream
Pricing
Meter Price (USD)
Volume of Data Processed Volume of data processed by the streaming
job (in GB)$.001 per GB
Streaming Unit Blended measure of CPU, memory,
throughput. $0.031 per hour
* Streaming unit is a unit of compute capacity with a maximum throughput of 1MB/s

Daily Azure Stream Analytics cost for 1 MB/sec of average processing
Volume of Data Processed Cost -$0.0005 /GB * 84.375 GB = $0.04 per day, streaming max 1 MB/s non-stop
Streaming Unit Cost -$.016 /hr * 24 hrs = $0.38 per day, for 1 MB/sec max. throughput
Total cost -$0.38 + $0.04 = $0.42 per day -or- ~$12.60 per month
Example Pricing for Public Preview @ 50%

27 Hands on Labs + 8 Instructor Led Labs in Hall 7
DBI Track resources
Free SQL Server 2014 Technical Overview e-book
microsoft.com/sqlserver and Amazon Kindle StoreFree online training at Microsoft Virtual Academy
microsoftvirtualacademy.com Try new Azure data services previews!Azure Machine Learning, DocumentDB, and Stream Analytics

Resources
Learning
Microsoft Certification & Training Resources
www.microsoft.com/learning
TechNet
Resources for IT Professionals
http://microsoft.com/technet
Sessions on Demand
http://channel9.msdn.com/Events/TechEd
Developer Network
http://developer.microsoft.com

Please Complete An Evaluation FormYour input is important!TechEd Schedule Builder CommNet station or PC
TechEd Mobile appPhone or Tablet
QR code
Evaluate this session

© 2014 Microsoft Corporation. All rights reserved. Microsoft, Windows, and other product names are or may be registered trademarks and/or trademarks in the U.S. and/or other countries.The information herein is for informational purposes only and represents the current view of Microsoft Corporation as of the date of this presentation. Because Microsoft must respond to changing market conditions, it should not be interpreted to be a commitment on the part of Microsoft, and Microsoft cannot guarantee the accuracy of any information provided after the date of this presentation. MICROSOFT MAKES NO WARRANTIES, EXPRESS, IMPLIED OR STATUTORY, AS TO THE INFORMATION IN THIS PRESENTATION.