time-resolved cubesat photometry with a low … · time-resolved cubesat photometry with a low cost...
TRANSCRIPT

Time-resolved CubeSat photometry with a low cost electro-optics system
Forrest Gasdia, Aroh Barjatya, Sergei Bilardi
Department of Physical Sciences, Embry-Riddle Aeronautical University
ABSTRACT
Once the orbits of small debris or CubeSats are determined, optical rate-track follow-up observations can provide
information for characterization or identification of these objects. Using the Celestron 11” RASA telescope and an
inexpensive CMOS machine vision camera, we have obtained time-series photometry from dozens of passes of
small satellites and CubeSats over sites in Florida and Massachusetts. The fast readout time of the CMOS detector
allows temporally resolved sampling of glints from small wire antennae and structural facets of rapidly tumbling
objects. Because the shape of most CubeSats is known, these light curves can be used in a mission support function
for small satellite operators to diagnose or verify the proper functioning of an attitude control system or deployed
antenna or instrument. We call this telescope system and the accompanying analysis tools OSCOM for Optical
tracking and Spectral characterization of CubeSats for Operational Missions. We introduce the capability of
OSCOM for space object characterization, and present photometric observations demonstrating the potential of high
frame rate small satellite photometry.
1. INTRODUCTION AND BACKGROUND
Between 2000 and 2015, more than 1 in 3 typical CubeSats to reach orbit suffered mission failure [1]. Additionally,
the low cost of entry, rapid development cycle, and increasing capability of microelectronics has led to an
exponential growth in the number of CubeSats launched each year. In order to provide feedback to satellite
operators and scientists on the performance of their satellite, enhanced failure analysis to spacecraft engineers, and
identification and characterization of CubeSats as they end their operational phase and become debris for other
satellites, Embry-Riddle Aeronautical University developed the OSCOM system in 2014. OSCOM, which stands for
Optical tracking and Spectral characterization of CubeSats for Operational Missions, is a system of hardware and
software for observation and analysis of small satellite optical signatures. The primary function of OSCOM is
targeted characterization and physical state estimation of small satellites and debris with known low earth orbits
rather than detection of these objects. OSCOM therefore utilizes rate-track observations instead of staring optics and
streak detection.
To produce photometry at several samples per second for CubeSat-class satellites or debris, OSCOM takes
advantage of recent developments in commercial-off-the-shelf (COTS) hardware. The result is an inexpensive and
portable, yet sensitive telescope system which can be deployed alone or in multiples for simultaneous multi-color or
multi-site observations. The image data is then reduced, processed, and analyzed by a custom OSCOM Python
package in order to promptly provide results from each observation.
In section 2, we describe the OSCOM system and how it can be deployed for observations. In section 3, we provide
several sample light curves that demonstrate the ability of the system to observe CubeSats and nanosats. Finally, in
section 4 we discuss ongoing work to utilize OSCOM for small satellite operational mission support by integrating
optical markers onto the spacecraft bus.
2. SYSTEM DESCRIPTION
Following the Raven system paradigm, OSCOM chose to utilize entirely COTS hardware in order to minimize the
cost and development time of the system [2]. The goal was to produce an electro-optical system capable of imaging
CubeSats at up to 10 Hz and larger objects at rates exceeding 100
Hz. Additionally, a wide field of view was
important in order to accommodate CubeSats with old or inaccurate orbital elements, and it was necessary to
balance the pixel sampling to maximize satellite signal against the background sky.
Copyright © 2016 Advanced Maui Optical and Space Surveillance Technologies Conference (AMOS) – www.amostech.com

The introduction of the Rowe-Ackermann Schmidt Astrograph by Celestron provided high throughput optics at f/2.2
for low cost. OSCOM has utilized the 11” optical tube, which is available for only $3,500 [3]. This same telescope
series has been reviewed in greater detail by reference [4]. We pair the RASA with the Manta G-235 machine vision
camera made by Allied Vision. The Manta is a CMOS camera with a global shutter Sony Pregius IMX174
monochrome sensor, and is available for only $1300 [5]. The camera has a peak QE of about 70% and produces 12
bit imagery at about 25 frames per second. A cropped region of the sensor can be read out for higher frame rates.
When paired with the 11” RASA, the field of view is 1°×0.7°. Sloan Digital Sky Survey (SDSS) u’g’r’i’z’ filters can
be inserted into the light path to provide color information; otherwise, no filters are used for maximum radiometric
sensitivity.
Fig. 1. The 11" Celestron RASA and Manta G-235 on a Losmandy G11 mount in Needham, MA before a night of
observations.
The RASA/Manta system has been mounted on several COTS tracking mounts: a Losmandy G11, Software Bisque
Paramount MX, and Paramount ME. Each of these mounts are controlled by custom OSCOM software which uses
Two Line Element sets (TLEs) published by Space-Track.org to provide initial pointing and rate-track information
to the mounts. If the target satellite is captured near the edge of the field due to errors in pointing or the published
TLE, a human operator or machine vision algorithm can provide inputs to the mount to center the satellite while
tracking.
Most OSCOM observations have been made from permanently mounted piers on the veranda of the College of Arts
and Sciences building on Embry-Riddle’s Daytona Beach campus. The veranda is specially designed to not retain
heat from solar heating during the day and the piers are mounted independently from the roof deck in order to isolate
vibrations from the footsteps of telescope operators. On several occasions the system has been deployed in the field
operating entirely on battery power. These observations have been made with a tripod-mounted Paramount ME from
the Palm Beach area in Florida and from a tripod-mounted G11 in the suburbs of Boston, Massachusetts. The
portability of the system has allowed us to be flexible when choosing sites for simultaneous observations of
particular satellites.
After data is collected, it is processed using an OSOCM Python software package called the Optical Satellite
Analysis Toolkit. This tool provides image processing, reduction, photometry, and analysis algorithms in a single
multi-threaded environment in order to efficiently process large sets of image data. Typically, a single short script
can be developed for a particular observing campaign and be run for tens or hundreds of thousands of images over
as many nights of observation as necessary.
Copyright © 2016 Advanced Maui Optical and Space Surveillance Technologies Conference (AMOS) – www.amostech.com

3. SAMPLE LIGHT CURVES
In its most basic form, OSCOM can be operated with as little as $10,000 of hardware. Despite the low cost, it is
capable of capturing photometric measurements of nanosats and CubeSats at up to about 10 Hz. This relatively high
temporal resolution reveals the presence of smaller facets or sharper glints that would otherwise be averaged out if
longer integration times are used. In this section, we present several representative light curves of small satellites
taken by OSCOM. The light curves were created by performing standard bias and flat image reduction followed by
circular aperture photometry with OSCOM’s Optical Satellite Analysis Toolkit. The background value is determined
across the immediate area around the satellite and subtracted from the image before summing the flux in the satellite
aperture and converting to astronomical magnitudes. The error bars shown are the single frame photometric error.
Each light curve is corrected for first order atmospheric extinction, normalized for satellite range, and shifted in
magnitude to approximately match the true apparent magnitude of the brightest glint. No corrections are made for
changing solar phase angle throughout the pass.
The Orbiting Picosatellite Automatic Launcher (OPAL) was the second Satellite QUick Research Testbed
(SQUIRT) satellite developed by the Space Systems Development Laboratory (SSDL) at Stanford University and
the largest satellite with a light curve presented here. The OPAL spacecraft is shaped like a hexagonal prism and has
a total of four UHF monopole antennas mounted on the top and bottom panels. OPAL deployed six picosats on orbit
and continued to provide long-term characterization of the bus and magnetometer. OPAL does not have a complete
attitude control system, but it does have a passive damper to ensure the satellite will spin around only one axis [6].
OPAL’s light curve (Fig. 2) shows smooth and steady variation.
Fig. 2. An OPAL pass observed from Needham, MA on August 1, 2015 with 80 ms integration time. In the inset, an
artist’s rendition of the OPAL satellite in orbit [7].
Copyright © 2016 Advanced Maui Optical and Space Surveillance Technologies Conference (AMOS) – www.amostech.com
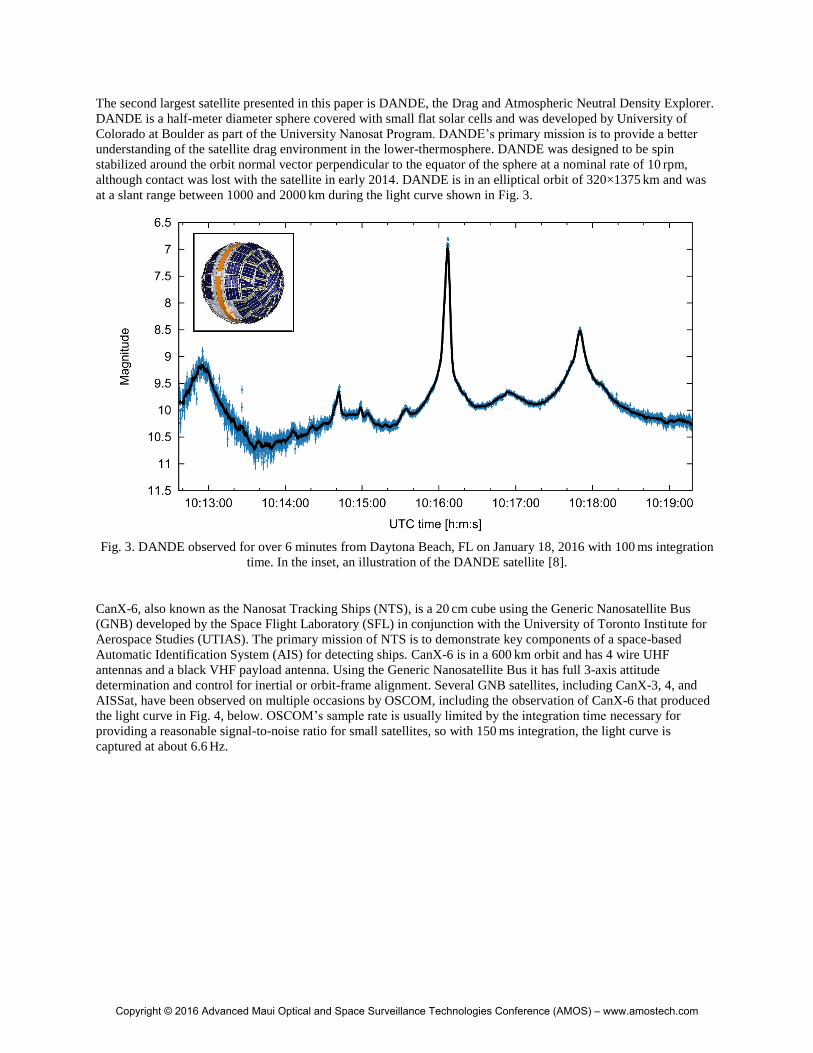
The second largest satellite presented in this paper is DANDE, the Drag and Atmospheric Neutral Density Explorer.
DANDE is a half-meter diameter sphere covered with small flat solar cells and was developed by University of
Colorado at Boulder as part of the University Nanosat Program. DANDE’s primary mission is to provide a better
understanding of the satellite drag environment in the lower-thermosphere. DANDE was designed to be spin
stabilized around the orbit normal vector perpendicular to the equator of the sphere at a nominal rate of 10 rpm,
although contact was lost with the satellite in early 2014. DANDE is in an elliptical orbit of 320×1375 km and was
at a slant range between 1000 and 2000 km during the light curve shown in Fig. 3.
Fig. 3. DANDE observed for over 6 minutes from Daytona Beach, FL on January 18, 2016 with 100 ms integration
time. In the inset, an illustration of the DANDE satellite [8].
CanX-6, also known as the Nanosat Tracking Ships (NTS), is a 20 cm cube using the Generic Nanosatellite Bus
(GNB) developed by the Space Flight Laboratory (SFL) in conjunction with the University of Toronto Institute for
Aerospace Studies (UTIAS). The primary mission of NTS is to demonstrate key components of a space-based
Automatic Identification System (AIS) for detecting ships. CanX-6 is in a 600 km orbit and has 4 wire UHF
antennas and a black VHF payload antenna. Using the Generic Nanosatellite Bus it has full 3-axis attitude
determination and control for inertial or orbit-frame alignment. Several GNB satellites, including CanX-3, 4, and
AISSat, have been observed on multiple occasions by OSCOM, including the observation of CanX-6 that produced
the light curve in Fig. 4, below. OSCOM’s sample rate is usually limited by the integration time necessary for
providing a reasonable signal-to-noise ratio for small satellites, so with 150 ms integration, the light curve is
captured at about 6.6 Hz.
Copyright © 2016 Advanced Maui Optical and Space Surveillance Technologies Conference (AMOS) – www.amostech.com

Fig. 4. CanX-6 observed for over 5 minutes from Daytona Beach, FL with integration time 150 ms on April 9, 2016.
In the inset, a diagram of the CanX-6 nanosat with VHF antenna.
CINEMA, the CubeSat for Ion, Neutral, Electron, Magnetic fields, is an international nanosatellite mission with
collaborating institutions in the United States, United Kingdom, and Korea. CINEMA’s main objective is to provide
critical space weather measurements including mapping of energetic neutral atoms from low Earth orbit. The
spacecraft is a 3U CubeSat with a magnetometer on the end of a 1 meter long boom. During operation, it was spin
stabilized nominally at 4 rpm with the spin axis oriented normal to the ecliptic plane [9]. In Fig. 5 is one of a series
of 40 second glints from CINEMA-2 (KHUSAT-1) observed on the night of April 9, 2016 from Daytona Beach, FL.
This satellite was confirmed operating in 2014, but its mission had ended at the time of observation.
Fig. 5. One glint off the CINEMA-2 (KHUSAT-1) CubeSat observed April 9, 2016 from Daytona Beach, FL with
150 ms exposures. In the inset, a diagram of the CINEMA CubeSat with 1 m magnetometer boom deployed [10].
Copyright © 2016 Advanced Maui Optical and Space Surveillance Technologies Conference (AMOS) – www.amostech.com

The Dynamic Ionosphere CubeSat Experiment (DICE) is a pair of 1.5U CubeSats and is the smallest satellite bus
shown here. DICE’s primary mission was to map geomagnetic storm enhanced density plasma bulge and plume
formations in Earth’s ionosphere. DICE has several expandable booms and antennae and is supposed to be spin
stabilized about the body length axis and aligned parallel to Earth’s rotation axis. Once a stable spin of
approximately 2 Hz is achieved, the four 5
m electric field probe (EFP) booms are designed to begin slowly
despooling. When fully deployed, the spin rate should be about 0.1 to 0.2 Hz [11]. Unfortunately, on neither DICE
spacecraft could the EFP wire booms deploy. DICE-2 was able to achieve a stable spin about its z-axis, but had
issues making consistent contact with the operations center and had electronics resets likely due to the space
environment. DICE was not operational during our observations and thus it is unlikely DICE-2 was spinning at the
nominal rate. The primary flash period of DICE-2 is 1.17 Hz, as shown in Fig. 6.
Fig. 6. DICE-2 observed from Needham, MA on August 1, 2015 using 125 ms integration time. Only 26 seconds are
shown so the 1 second glints are clearly visible. In the inset, a diagram of DICE with electric field probe booms
deployed [12].
4. ONGOING WORK
A major goal of OSCOM is to use observed light curves for small satellite and CubeSat mission support. CubeSat
failures may be due to several reasons: uncontrolled spin, failed antenna deployment, or unfavorable pointing
leading to power loss. In such cases, optical observations are potentially the only resource for troubleshooting and
failure analysis because they are completely independent of the satellite’s telemetry data and condition. Optical
observations can provide information on the state of spacecraft physical features and parameters. For example,
telemetry might suggest that a solar panel has been deployed, but if the spacecraft registers low power in house-
keeping data, then an optical observation can provide further evidence as to whether or not the solar panels were
completely deployed. Optical telescope measurements can also assess spin-rates and possibly give some indication
of spacecraft attitude.
Many CubeSats already have some identifying optical characteristics, such as number and size of antennae or other
deployed instruments. We are reaching out to the university CubeSat community to assist in the next phase of
OSCOM. By actively making small changes to a CubeSat bus, one can provide a more unique or useful reflected
optical signature for simpler and more confident attitude or physical state estimation. One basic technique stems
from the concept of albedo-area product. A satellite can be broken up into many individual facets each with an
albedo-area product—the multiplication of the facet projected area and albedo of the surface material. This product
directly drives the reflected brightness of the facet. Each illuminated facet that is visible to the observer contributes
Copyright © 2016 Advanced Maui Optical and Space Surveillance Technologies Conference (AMOS) – www.amostech.com

to the total observed brightness of an unresolved satellite. Payne, et al. have shown the relationship between
projected albedo-area product and aggregate photometric measurement and the product has been used by several
others for objects in geosynchronous orbit (GEO) [13] [14].
For CubeSats, the albedo-area product offers two opportunities. For diffusely reflecting flat plates, there is a strong
dependence on the plate area, especially when the area is very small, i.e. less than 0.1 m
2 [15]. This means that if a
CubeSat is able to change its area slightly, there is a meaningful change in its magnitude. For CubeSats which have
fixed size, the albedo of CubeSat rails can be changed by differential polishing: each consecutive rail is polished
more than the one before it. This stepped change in albedo should provide a signature to help orient an observed
light curve with respect to the real orientation of the satellite. Continuing work on multi-band color or spectral
characteristics, as well as polarization, may also prove to be useful indicators on CubeSat buses.
5. CONCLUSION
Embry-Riddle’s OSCOM system for optical tracking and spectral characterization produces CubeSat-class satellite
photometry at up to about 10 Hz from an inexpensive and portable platform. This electro-optical system takes
advantage of COTS hardware including the Celestron RASA and machine vision CMOS sensors. We have
presented several examples of OSCOM nanosatellite photometry and have shared general plans to actively modify
the optical signature of CubeSats in order to more easily estimate their attitude and mission status.
6. REFERENCES
[1] Michael Swartwout, "CubeSats and Mission Success: A Look at the Numbers," , 2016.
[2] Paul F. Sydney et al., "Raven automated small telescope systems," in Imaging Technology and Telescopes, oct
2000. [Online]. http://dx.doi.org/10.1117/12.405780
[3] Celestron, LLC. (2014) Rowe-Ackermann Schmidt Astrograph. [Online]. http://www.celestron.com/browse-
shop/astronomy/optical-tubes/rowe-ackermann-schmidt-astrograph
[4] Mark Ackermann, Peter Zimmer, John McGraw, and Eric Kopit, "COTS Options for Low-Cost SSA," in
Proceedings of the Advanced Maui Optical and Space Surveillance Technologies Conference, 2015.
[5] Allied Vision Technologies GmbH. Manta G-235. [Online].
https://www.alliedvision.com/en/products/cameras/detail/Manta/G-235.html
[6] Brian Engberg, Jeff Ota, and Jason Suchman, "The OPAL Satellite Project: Continuing The Next Generation of
Small Satellite Development," in Ninth Annual AIAA/Utah State University Conference on Small Satellites,
1995.
[7] Space and Systems Development Library. (2016) OPAL (Orbiting Picosatellite Automatic Launcher). [Online].
https://directory.eoportal.org/web/eoportal/satellite-missions/o/opal
[8] Lee Jasper and Kyle Kemble, "Drag and Atmospheric Neutral Density Explorer (DANDE) Spherical
Spacecraft Design Challenges," University of Colorado at Boulder, 2009.
[9] European Space Agency. (2016) eoPortal. [Online]. https://directory.eoportal.org/web/eoportal/satellite-
missions/c-missions/cinema
[10] Gunter Dirk Krebs. (2016, Jan.) Gunter's Space Page. [Online]. http://space.skyrocket.de/doc_sdat/cinema.htm
Copyright © 2016 Advanced Maui Optical and Space Surveillance Technologies Conference (AMOS) – www.amostech.com
[11] Tim Neilsen, Cameron Weston, Chad Fish, and Bryan Bingham, "DICE: Challenges of Spinning CubeSats," in
37th Annual AAS Guidance & Control Conference, 2014.
[12] Space Dynamics Laboratory, "DICE Dynamic Ionosphere CubeSat Experiment," Utah State University
Research Foundation, Logan, UT, 2013.
[13] Tamara E. Payne et al., "A Derivation of the Analytical Relationship between the Projected Albedo-Area
Product of a Space Object and its Aggregate Photometric Measurements," in Proceedings of the Advanced
Maui Optical and Space Surveillance Technologies Conference, 2013, p. E33.
[14] Brandoch Calef, John Africano, Brian Birge, Doyle Hall, and Paul Kervin, "Photometric signature inversion,"
in Unconventional Imaging II, aug 2006. [Online]. http://dx.doi.org/10.1117/12.683015
[15] G. A. McCue, J. G. Williams, and J. M. Morford, "Optical characteristics of artificial satellites," Planetary and
Space Science, 1971. [Online]. http://www.sciencedirect.com/science/article/pii/0032063371901371
Copyright © 2016 Advanced Maui Optical and Space Surveillance Technologies Conference (AMOS) – www.amostech.com