time to power change
TRANSCRIPT

INTERIM RESULTS AND STRATEGIC UPDATE
17 November 2021
TIME TO POWER CHANGE

2
This presentation contains forward-looking statements about financial and operational matters. Because they relate to future events and are subject to future circumstances, these forward-looking statements are subject to risks, uncertainties and other factors. As a result, actual financial results, operational performance and other future developments could differ materially from those envisaged by the forward-looking statements.
SSE plc gives no express or implied warranty as to the impartiality, accuracy, completeness or correctness of the information, opinions or statements expressed herein. Neither SSE plc nor its affiliates assume liability of any kind for any damage or loss arising from any use of this presentation or its contents.
This presentation does not constitute an offer or invitation to underwrite, subscribe for, or otherwise acquire or dispose of any SSE shares or other securities and the information contained herein cannot be relied upon as a guide to future performance.
DISCLAIMER

AGENDA17 November 2021
3
08:30 Interim Results to 30 September 2021
09:00 Strategic Update – SSE’s Net Zero Acceleration Programme
10:00 Q&A

05
101520253035
Total recordable injuries
HY22 HY21
SAFETYInterim Results for six months to 30 September 2021
4
Safety• Six more injuries recorded versus same period last year• TRIR1 fell from 0.19 to 0.16 compared to the same period last year1
0
0.05
0.1
0.15
0.2
TRIR1
HY22 HY21
1 Total Recordable Injury Rate - total number of recordable injuries per 100,000 hours worked2 HY21 comparator restated to exclude impact of SSE Contracting & Rail and Neos Networks (formerly SSE Telecoms)
2 2

PROGRESS AND DELIVERY OVER LAST SIX MONTHSHighlights from SSE’s net zero-focused electricity infrastructure strategy
5
Reshaping the Group for net zero• Completion of Contracting & Rail and E&P disposals
• Agreed disposal of entire SGN stake
• 10GW (gross) development portfolio acquisition in Japan, with selected entry into other international auctions
Delivering on infrastructure projects• Construction continuing at pace on Seagreen,
Dogger Bank A&B and Viking• Keadby 2 first power & East Coast Cluster ‘Track 1’ • Work under way on Shetland HVDC link, progressing
additional Needs Case submissions and ED2 plan
Seagreen jackets being prepared for installation
SummaryDeliveryFive Year PlanStrategyNet Zero
AccelerationInterim Results

6
FINANCIAL PERFORMANCE TO 30 SEPTEMBER 2021

INCOME STATEMENT – CONTINUING OPERATIONS
7
Adjusted 1 HY22 HY21
Operating Profit - £m 376.8 328.9
Profit Before Tax - £m 174.2 133.9
EPS - pence 10.5 7.3
Reported 1 HY22 HY21
Operating Profit - £m 1,904.4 939.9
Profit Before Tax - £m 1,686.1 779.4
EPS – pence 103.6 62.9
1HY22 discontinued operations: • Gas Production assets operating profit (£77.7m adjusted / £(16.2)m reported)• Investment in SGN operating profit (£21.0m adjusted/ £89.4m reported)
Key commentary• HY21 included c.£115m adverse effect
from coronavirus, primarily impacting Distribution, Business Energy and Enterprise, with some residual impact continuing to be seen in HY22.
• HY22 saw significantly lower renewables output due to exceptionally dry and calm weather conditions across the UK and Ireland.
• Adjusted EPS slightly above expected range provided in Notification of Closed Period.
Interim Results for six months to 30 September 2021
SummaryDeliveryFive Year PlanStrategyNet Zero
AccelerationInterim Results
Expect to report full year adjusted EPS at least in line with analysts’ consensus of 83p2
2Bloomberg, 15 November 2021

IMPACT FROM RECENT MARKET VOLATILITY
8
• Calm weather conditions across the UK over summer led to renewables output shortfall• However direct exposure to short term commodity price volatility managed through:
• Balanced mix of businesses;• Disciplined application of clearly defined hedging policies; and• £2m VAR trading limits for EPM maintained.
Interim Results for six months to 30 September 2021
Business Unit Impact of recent market volatility on adjusted results
SSE Renewables Lower than expected output volumes across wind and hydro meant hedges had to be ‘bought back’ at higher prices.
SSE Thermal & Gas Storage
Power and gas volatility is positive for these businesses, depending upon plant availability and merit order.
Business Energy Contract customer sales are 100% hedged, with volume risk on tariff customers reduced through dynamic forecasting approach.
Airtricity Vertical integration of generation and customer businesses in Irish market limits commodity exposure.
SSE Group Significant increase in collateral requirements, however minimal cash collateral required.
SummaryDeliveryFive Year PlanStrategyNet Zero
AccelerationInterim Results

INCOME STATEMENT – CORE BUSINESSES
9
Adjusted EBIT (£m) HY22 HY21SSEN Transmission 181.7 115.2SSEN Distribution 153.3 114.3Total regulated networks 335.0 229.5
Hydro (inc. pumped storage) 36.3 62.5Onshore wind (28.3) 27.7Offshore wind 17.4 51.4Total SSE Renewables 25.4 141.6
Total core businesses 360.4 371.1
• Higher allowed revenue and volumes in HY22
• HY21 impacted by coronavirus
Movement
• Earlier phasing of allowed revenue across T2, partially offset by increases in operating costs and depreciation
• £23m Seagreen disposal in HY21
• Reduced volumes due to exceptionally still and dry conditions for much of the first half of the year
• Hedge buy-backs at higher prices
Interim Results for six months to 30 September 2021
SummaryDeliveryFive Year PlanStrategyNet Zero
AccelerationInterim Results

INCOME STATEMENT – OTHER BUSINESSES
10
Adjusted EBIT (£m)1 HY22 HY21Total core businesses 360.4 371.1SSE Thermal 36.1 49.6Gas Storage 28.7 (17.9)Business Energy 2.4 (27.4)Airtricity (2.9) 16.6EPM 5.7 (1.5)Distributed Energy (7.3) (37.8)Total other businesses 62.7 (18.4)Corporate unallocated (46.3) (23.8)SSE Group 376.8 328.91HY22 discontinued operations: Investment in SGN and Gas Production assets
• Reduced impact from coronavirus• Contracting & Rail losses included in
period to disposal on 30 June 2021
• Higher volumes through reduced impact of coronavirus
• Increase non-commodity costs
• Merchant operation enabling capture of spread in volatile markets
• HY22 includes £(17)m net adjustment to historic accruals and estimates
• Strong BM performance and higher achieved prices
• HY21 included £20.4m non-recurring developer profits from Slough Multifuel
• Decrease in external income as transition service agreements unwind
Interim Results for six months to 30 September 2021
SummaryDeliveryFive Year PlanStrategyNet Zero
AccelerationInterim Results

FAIR VALUE REMEASUREMENTS
11
Interim Results for six months to 30 September 2021
IFRS 9 remeasurements• EPM and Gas Storage, through exposure to unsettled
commodity contracts and physical gas inventory, are subject to unrealised mark-to-market remeasurements.
• At 30 September 2021, total positive net remeasurement under IFRS 9 of £1.4bn recognised on unsettled contracts / inventory.
These IFRS 9 remeasurements do not:• Reflect c.£(1.3)bn adverse remeasurement of ‘own
use’ hedging agreements which are excluded from IFRS 9 but largely offset the IFRS 9 remeasurement.
• Impact SSE’s Adjusted Performance Measures, given their distortive nature and scale.
EPM continues to operate under strict position limits and VAR controls
SummaryDeliveryFive Year PlanStrategyNet Zero
AccelerationInterim Results

RECONCILING ADJUSTED AND REPORTED
12
Income Statement - £m HY22Adjusted PBT 174.2
Remeasurements - Operating derivatives 1,204.0
Remeasurements – Gas Inventories 235.2
Remeasurements - Financing derivatives (55.9)
SSE Thermal historic impairment reversals 181.6
Disposals and prior year true-ups (20.0)
Depreciation on historic fair value uplifts (10.3)
Interest on net pension liabilities/assets 2.3
Share of JV and associate tax (25.0)
Reported PBT 1,686.1
• Weaker Sterling against the Euro and Dollar
• Reversal of historic impairments on CCGT plant due to higher price curves
Interim Results for six months to 30 September 2021
• Mark to market movements on predominantly gas derivatives
• Broadly offset by contracts designated as ‘own use’ and therefore not reported under IFRS9
• Includes £18m Contracting & Rail loss on disposal
• Unwinding of historic exceptional non-cash gains from wind farm partnerships
• Usual adjustment made for consistent treatment of JV/associate tax
SummaryDeliveryFive Year PlanStrategyNet Zero
AccelerationInterim Results

CAPITAL AND INVESTMENT EXPENDITURE
13
Adjusted Capex (£m) HY22 Share %SSEN Transmission 291.0 28SSEN Distribution 171.3 16SSE Renewables 417.5 40SSE Thermal 93.3 10Other Business Units 69.7 6Total 1,042.8 100
Now expect capital and investment expenditure for FY22 to be in excess of £2bn previously guided
• Predominantly Slough Multifuel and Keadby 2
• £28m Skye subsea cable replacement• IT & resilience expenditure
• £249m Seagreen contribution• £111m Dogger Bank C devex
expected to be reimbursed at financial close
• £57m Viking onshore wind farm
• £57m reinforcements of East Coast• Shetland HVDC link
Interim Results for six months to 30 September 2021
SummaryDeliveryFive Year PlanStrategyNet Zero
AccelerationInterim Results

DISPOSAL OF NON-CORE ASSETS
14
Agreed Disposals, £m CompletionStatus
Headline Consideration
FY21 Recognised Gain / (Loss)
HY22 Recognised Gain / (Loss)
Total Recognised Gain / (Loss)
Walney offshore wind farm 350.0 188.7 - 188.7MapleCo meter assets 95.3 70.4 - 70.4Multifuel Energy 995.0 669.9 - 669.9Contracting & Rail 1 22.5 (51.2) (18.1) (69.3)Gas Production assets 2 120.0 - - TBCInvestment in SGN 3 Est. FY22 1,225.0 - - TBCTotal 2,807.8 877.8 (18.1) > 859.7
1 Completed on 30 June 2021 for upfront consideration of £17.5m (before adjustments for certain items), a £5m loan note repayable in 2026 and excludes up to £5m contingent upon achieving FY22 EBITDA performance.2 Completed on 14 October 2021 for upfront consideration of £25m, with a £95m (before adjustments for certain items) loan note repayable in 2024 and excludes up to £40m contingent upon future gas prices. The final loss on disposal is estimated at £24.1m and will be recognised in the second half of the financial year.3 Disposal agreed on 2 August 2021 for cash consideration of £1,225m. Disposal is conditional on certain regulatory approvals and is expected to complete by 31 March 2022. The final gain on disposal will be determined on completion of the transaction, but is expected to be in excess of £570m.
Impact from agreed disposals of approximately 7 pence dilution to adjusted EPS for FY22 forecast
Interim Results for six months to 30 September 2021
SummaryDeliveryFive Year PlanStrategyNet Zero
AccelerationInterim Results

SSE’S PENSION SCHEMES
15
Interim Results for six months to 30 September 2021
Pensions Asset/(Liability) - £m HY22 FY21Scottish Hydro Electric Pensions Scheme (SHEPS) 501.7 543.1Southern Electric Pension Scheme (SEPS) (63.7) (186.1)Combined Asset/(Liability) 438.0 357.0
Increase in net pension surplus • £81m increase in combined net surplus in the six months to September 2021
• Reduction in SEPS deficit of £122.4m• Partially offset by reduction in SHEPS surplus of £41.4m• SHEPS is largely hedged to future volatility due to 2019/20 asset buy-in
Triennial valuation as at 31 March 2021 completed in the period• SHEPS contribution holiday agreed to continue
SummaryDeliveryFive Year PlanStrategyNet Zero
AccelerationInterim Results

MAINTAINING A STRONG BALANCE SHEET
16
HY22 FY21 HY21
Adjusted net debt and hybrid capital - £m 9,611 8,899 10,622
Average debt maturity (excl. hybrid) – years 7.2 7.4 6.9
Average cost of debt at period end, inc. hybrid capital 3.89% 3.75% 3.58%
Adjusted net finance costs - £m 202.6 441.6 224.4
Net debt / EBITDA• Targeting a ratio of net det to EBITDA of around 4.5 times at 31 March 2022• Ratio of 4.6x at 31 March 2021
Interim Results for six months to 30 September 2021
Credit Ratings (issued September 2020)• S&P - BBB+ with stable outlook• Moody’s - Baa1 with negative outlook
SummaryDeliveryFive Year PlanStrategyNet Zero
AccelerationInterim Results

REMUNERATING SHAREHOLDERS
17
• Strong operational performance and strategic progress• HY22 Adjusted EPS of 10.5 pence – slightly above pre-close guidance• The Group reiterates its existing dividend commitment to March 2023
Continuing to target RPI increases in FY22 and
FY23
Interim dividend declared
25.5 pence1
Financial performance
slightly ahead of expectations
Interim Results for six months to 30 September 2021
Scrip dividend capped at 25%
• Expect to recommend a full-year dividend of 81 pence plus RPI inflation• Dividend beyond FY23 rebased to 60p, with >5% growth per annum to FY26
1Assuming average RPI of 5% over the year to 31 March 2022
SummaryDeliveryFive Year PlanStrategyNet Zero
AccelerationInterim Results

AGENDA17 November 2021
18
08:30 Interim Results to 30 September 2021
09:00 Strategic Update – SSE’s Net Zero Acceleration Programme
10:00 Q&A

FULLY-FUNDED ENHANCED£12.5BN INVESTMENT PLANFully-funded five year capex and investment plan focused on low-carbon infrastructure
SSE’S NET ZERO ACCELERATION PROGRAMMEA bold and comprehensive plan to 2026 creating the optimal pathway for accelerated growth
Delivers accelerated growth at attractive returns, maximising value for all stakeholders
ACCELERATING GROWTH AT ATTRACTIVE RETURNS TO 2026
Leading the energy transition and creating a platform for longer term growth to 2031 and beyond
PLATFORM FOR GROWTH TO 2031 AND BEYOND
19
SummaryDeliveryFive Year PlanStrategyNet Zero
AccelerationInterim Results

Energy Portfolio Management
SSE Renewables SSE Thermal
RESHAPED AND READY TO SEIZE OPPORTUNITIES
20
Wind generation Low-carbon flexible generationHydro and storage
SSEN Transmission
SSEN Distribution
Smart, flexible distribution grid
Transmission links transporting growing renewable output
Distributed Energy
SSE represents a balanced mix of businesses uniquely positioned for the transition to net zero
SSE Business EnergySSE Airtricity
SummaryDeliveryFive Year PlanStrategyNet Zero
AccelerationInterim Results

LEADING IN THE NET ZERO TRANSITIONLeading capabilities and investment pipeline position SSE as UK’s clean energy champion
21
The UK is leading the charge on net zero globally…
>£4bn/year sector investment in GB1
40 GW offshore wind target by 2030
+20 GW low-carbon flexibility needed by 2030
to ensure security of supply3
…and SSE focused on accelerating investment in the infrastructure needed
for the UK and internationally
Electricity Networks
Over 20% of planned GB investment
Enabling delivery of over 25% of UK’s offshore wind target
Coire Glaswould increase UK’s pumped storage capacity by 50%
Developing options for ‘1st of a kind’ CCUS & hydrogen projects
Offshore Wind
Hydro options
CCUS & Hydrogen
Distributed energy
Developing options for GW-scale battery pipeline
FULLY DECARBONISED
UK POWER SYSTEM BY
2035
UK TARGET
1Includes current draft RIIO-ED2 plans2Scottish Government draft Onshore Wind Policy Statement targets 8-12 GW of installed onshore wind capacity additions by 20303Smart Systems and Flexibility Plan 2021, needed to achieve offshore target
Targeting up to 20% of Scotland's onshore wind additions
Onshore Wind
16 – 20 GW onshore wind target by 20302
SummaryDeliveryFive Year PlanStrategyNet Zero
AccelerationInterim Results

SSE PLC: NET ZERO ACCELERATION PROGRAMMEThe optimal pathway to maximise shareholder value and growth into the 2030s
1 All capex presented includes investments in development pipeline and is net of project finance development expenditure refunds2 After modelling assumption of 25% minority interest disposal of Transmission and Distribution during FY243 Underlying business, assumes 2% CPI inflation p.a. Distribution based on RIIO-ED2 Draft Business plan submission, subject to final submission and Ofgem determination4 Dividend rebased at 60p in 23/24, targeting at least 5% annual growth thereafter to March 2026
22
…AND THE PLATFORM FOR GROWTH TO 2031 & BEYOND
£11-13bn net Networks RAV2
1.5° celsiusScience-based carbon targets
>3GWNet low carbon
flexible thermal & distributed generation
>13GWNet installed Renewables capacity
0
5
10
20/21 25/26
£bn
SSE Ownership Minority Interest
+4GW net capacity
> 350p / share 4
rebased dividend across five years
5-7%Adjusted EPS CAGR
…DELIVERING ACCELERATED GROWTH AT ATTRACTIVE RETURNS INTO 2026…
~10%gross RAV CAGR3
4.5x net debt/EBITDA
Strong credit rating
>15GW pipeline
RENEWABLES ELECTRICITY NETWORKS
0
2
4
6
8
20/21 25/26
GW
Offshore Wind Onshore Wind Hydro
£7.4bn ~£9bn
~2x
Minority stake sale in Transmission and
Distribution2
Growth-enabling rebased dividend plan
FULLY-FUNDED ENHANCED INVESTMENT PLAN…
Networks Renewables Thermal Other
£12.5bn net capex1
~40% ~40%
~20%
SummaryDeliveryFive Year PlanStrategyNet Zero
AccelerationInterim Results

THE OPTIMAL VALUE-CREATING PLANCreating options and opportunities for investment and growth
Board review concluded this five-year investment plan represents the optimal pathway to:1. Drive sustainable long-term value for all stakeholders,2. Deliver the scale of its capital investment and growth opportunities; and 3. Provide the optimal sources of funding to underpin this accelerated growth.
23
Sustainable long-term value
• Clear focus on delivering long-term solutions for net zero at critical time
• ESG-aligned business mix • Optimises risk-adjusted returns across
index-linked and market-based earnings • Growth enabling dividend, maximising
long-term shareholder value• Responsible national clean energy
champion
Deliver investment opportunity
• Drives accelerated growth in networks, renewables and flexible generation
• Strong growth options across net zero electricity
• Delivers integrated solutions (storage, hydrogen, offshore transmission)
• Builds on existing shared capabilities• Realises investment opportunity, whilst
retaining portfolio options for the future
Optimise sources of funding
• Fully-funded plan to accelerate growth • Secures strong investment grade credit
rating • Business mix creates financial stability• Group balance sheet enables delivery of
large offshore wind projects• Minority networks sale to achieve
premium value and fund growth
Investment plan supports renewed emission targets aligned with a science-based 1.5° pathway
SummaryDeliveryFive Year PlanStrategyNet Zero
AccelerationInterim Results

24
Strategic Update – SSE’s Net Zero Acceleration Programme
SSE’S COMMITMENT TO NET ZERO

A POWERFUL PURPOSE, VISION AND STRATEGYFocused on creating value for all stakeholders in the transition to net zero
25
OUR PURPOSETo provide energy needed today while building a better world of energy for tomorrow.
OUR VISION
To be a leading energy company in a net zeroworld.
OUR STRATEGY
To create value for shareholders and society in a sustainable way by developing, building, operating and investing in the infrastructure and businesses needed in the transition to net zero.
SummaryDeliveryFive Year PlanStrategyNet Zero
AccelerationInterim Results

>2 x
ELECTRICITY AT THE CORE OF THE ENERGY SYSTEMNet zero by 2050 requires rapid deployment of innovative clean energy technologies
26
Projected global electricity generation to more than doubleby 2050, as electricity moves to core of energy system
Renewables mix to increase threefold, putting more stress on low-carbon flexible generation to balance system
1 IRENA Transforming Energy Scenario (2019q) & REmap (https://www.irena.org/Statistics/View-Data-by-Topic/Energy-Transition/REmap-Energy-Generation-and-Capacity)2 UK Government Energy White Paper December 2020
-
15,000
30,000
45,000
60,000
2017 2030 2040 2050
TWh
Non-renewables Hydro Onshore Wind Offshore Wind Solar PV Other renewables
Global electricity generation by technology to 20501
85% Renewables
25% Renewables
Electricity networks investment critical to:• support growth in decarbonised energy demand
• connect renewables and distributed energy; and
• facilitate future electrification of transport and heat.
UK electricity demand under net zero scenarios2
0
100
200
300
400
500
600
700
2020 Low High Low High
TWh
Domestic Non-Domestic Electric Vehicles Heating2030 2050
SummaryDeliveryFive Year PlanStrategyNet Zero
AccelerationInterim Results

LOWER CARBON, HIGHER FLEXIBILITYRenewables dominated electricity systems needs network investment and low-carbon flexibility
27
0
10
20
30
40
50
60
FY07 FY11 FY15 FY19 FY23 FY27 FY31
Gen
erat
ion
outp
ut (T
Wh)
Hydro Onshore Wind Offshore Wind Hydrogen-fired Solar Gas-fired (abated) Gas-fired (unabated) Coal-fired
Illustrative future output
Note: Gas-fired output includes a small minority of oil-fired generation, which represented c.2% of Thermal output during FY21
SSE has the options, assets and ability to deliver the renewable output, the networkcapacity, and the flexible decarbonised electricity required for the future
SSE actual and forecast generation output (2007–31)
> 90% renewables
and low-carbon
flexible generation
SummaryDeliveryFive Year PlanStrategyNet Zero
AccelerationInterim Results

0
5
10
15
20
25
30
FY06 FY18 FY21 FY30(old target)
FY30(new target)
Mt C
O2e
SSE’s absolute scope 1 and 2 GHG emissions
1.5°C-ALIGNED SCIENCE-BASED TARGETSAcceleration of 2030 carbon targets to align to the SBTi power sector 1.5°C-aligned targets
28
1.5° CELSIUS
THRESHOLD
* From FY18 baseline
0
100
200
300
400
500
600
700
FY06 FY18 FY21 FY30(old target)
FY30(new target)
gCO
2e/k
Wh
SSE’s Scope 1 GHG Intensity
1.5° CELSIUS
THRESHOLD
~2x acceleration
from previous
~80% reduction*>70% reduction*
~2x acceleration
from previous
SummaryDeliveryFive Year PlanStrategyNet Zero
AccelerationInterim Results

OUR 2031 TARGETS
Wind Operating 3.8GW (gross) Constructing >5GW (gross) with
world’s largest offshore wind farm
~10GW pipeline with plan for >15GW by FY26 Up to 4.1GW Berwick Bank super project Up to 1.5GW pumped storage option Carefully selected international partnerships and
platformsHydro 1.5GW operational capacity Optimising 84 assets
Transmission Pioneering Caithness-Moray HVDC Shetland subsea HVDC under way
Progressing >£1bn Initial Needs Cases for T2 Long-term growth connecting 14GW+ renewables
Distribution Leading innovation and flexibility Delivering Distribution System
Operation
Proposed a 35% increase in investment v ED1 Facilitating electrification for net zero
Low-carbon thermal
Constructing Keadby 2 (840MW) most efficient CCGT in Europe
‘First-of-a-kind’ CCS development clusters Hydrogen generation, storage and production
Distributed energy Developing 350MW of battery sites
Developing GW-scale battery and solar pipeline EV charging solutions
MARKET LEADING CAPABILITIES AND PIPELINE
29
PIPELINE FOR TOMORROWDELIVERING TODAY
SSE is delivering the energy needed today, whilst delivering growth into net zero
1 Assumes 25% minority interest disposal of Transmission and Distribution in April 20232 Underlying business, assuming consistent ownership percentage over five-year plan
>13GWRenewables installed
(net)
More than trebling current capacity
£11-13bn Electricity networks
RAV (net)1
~8-9% CAGR (gross)2
>3GWNew low-carbon
flexible generation
Pathway to 1.5ºC
SummaryDeliveryFive Year PlanStrategyNet Zero
AccelerationInterim Results

> 350p / share 4
rebased dividend across five years
4.5x net debt/EBITDA
Strong credit rating
SSE PLC: NET ZERO ACCELERATION PROGRAMMEThe optimal pathway to maximise shareholder value and growth
30
£11-13bn net Networks RAV2
1.5° celsiusScience-based carbon targets
>3GWNet low carbon
flexible thermal & distributed generation
>13GWNet installed Renewables capacity
0
5
10
20/21 25/26
£bn
SSE Ownership Minority Interest
+4GW net capacity
5-7%Adjusted EPS CAGR
~10%gross RAV CAGR3
>15GW pipeline
RENEWABLES ELECTRICITY NETWORKS
0
2
4
6
8
20/21 25/26
GW
Offshore Wind Onshore Wind Hydro
£7.4bn ~£9bn
~2x
Minority stake sale in Transmission and
Distribution2
Growth-enabling rebased dividend plan
Networks Renewables Thermal Other
£12.5bn net capex1
~40% ~40%
~20%
…AND THE PLATFORM FOR GROWTH TO 2031 & BEYOND
…DELIVERING ACCELERATED GROWTH AT ATTRACTIVE RETURNS INTO 2026…
FULLY-FUNDED ENHANCED INVESTMENT PLAN…
SummaryDeliveryFive Year PlanStrategyNet Zero
AccelerationInterim Results
1 All capex presented includes investments in development pipeline and is net of project finance development expenditure refunds2 After modelling assumption of 25% minority interest disposal of Transmission and Distribution during FY243 Underlying business, assumes 2% CPI inflation p.a. Distribution based on RIIO-ED2 Draft Business plan submission, subject to final submission and Ofgem determination4 Dividend rebased at 60p in 23/24, targeting at least 5% annual growth thereafter to March 2026

Strategic Update – SSE’s Net Zero Acceleration Programme
A BOLD FIVE-YEAR INVESTMENT PLAN
31

0
2
4
6
8
10
12
20/21 25/26
£bn
SSE Ownership Minority Interest
5 - 7% p.a.Adjusted EPS CAGR
~4.5xnet debt to
EBITDA ratio
1.5 degreealigned carbonemissions plan
Group Targets
0
2
4
6
8
10
12
14
Previous 5yr Plan 2026 Growth Plan
£bn
0
2
4
6
8
20/21 25/26
GW
Offshore Wind Onshore Wind Hydro
A BOLD FIVE-YEAR INVESTMENT PLAN
32
~10% Electricity networks gross RAV CAGR2
£12.5bn net capex investment1 +4GW net installed renewable capacity
Summary of plan to 2026
+65%
Dividend certainty to 2026
~2x
1 Assumes 25% minority interest disposal of Transmission and Distribution in April 20232 Underlying business, assuming consistent ownership percentage over five-year plan3 All capex presented is net of project finance development expenditure refunds4 Dividend rebased at 60p in 23/24, targeting at least 5% annual growth thereafter to March 2026
>£3.50Total dividend per share across five-year plan4
£7.5bn ~£9bn
Sustainable development pipeline
>15GW
SummaryDeliveryFive Year PlanStrategyNet Zero
AccelerationInterim Results

Transmission
Distribution Renewables
Transmission
Distribution
Renewables
Thermal
Other
ACCELERATING INVESTMENT IN NET ZERO
33
£12.5bn Net Capex
Optimising capital allocation between net zero-focused businesses
~40% ~40%
~20%1 After modelling assumption of 25% minority interest disposal of Transmission and Distribution during FY242 All capex presented is net of project finance development expenditure refunds
Previous five-year plan to 2025 New five-year plan to 2026
+65% total spendrepresenting a £1bn p.a. increase
>2.5x renewablescapex versus previous plan
An optimum mixof regulated and unregulated
£7.5bn Net Capex
~10%
SummaryDeliveryFive Year PlanStrategyNet Zero
AccelerationInterim Results

HIGH PROPORTION OF PLAN IS COMMITTED
34
Majority of five-year planned capital investment is committed, with visibility over uncommitted
+1% cumulative increase in inflation over the five-year plan would impact capex by <£200m
0
1
2
3
4
5
6
7
8
Renewables Transmission Distribution Thermal Other Total
Committed vs uncommitted capex by division to FY26
Committed Uncommitted
~60% COMMITTED
~£7.5bn of investment plan is already committed, through previous investment plan
~40% UNCOMMITTED
~£5bn of incremental capex is expected to be committed through
the five-year investment plan
£bn
SummaryDeliveryFive Year PlanStrategyNet Zero
AccelerationInterim Results

INVESTMENT CRITERIA AND PARTNERSHIPS
35
STRATEGIC FIT
FINANCIALLY ATTRACTIVE
SUSTAINABLE INVESTOR
COMFORT AND EXECUTION
RISK
SSE INVESTMENT CRITERIA ANDPARTNERSHIP FRAMEWORK
Returns
• Simple framework, applied to support decision making process for capital investments, divestments and partnerships
• Expands investment and partnership appraisal beyond pure hurdle rate metrics
• Ensures capital investment decisions are consistent with strategy, and where SSE can clearly create most value
• Partnering spreads risk and financial exposure on large-scale projects/businesses
• Partnering also avoids non-earning net debt during project development, and higher gearing, through project financing
Disciplined capital investment criteria with efficient use of partnerships for risk management
FinancingRisk
ExecutionRisk
Earnings
Net zeroStakeholders
Culture
StrategyCore skills
Synergies
All investments are assessed for consistency with, and profitability in, a net zero scenario
SummaryDeliveryFive Year PlanStrategyNet Zero
AccelerationInterim Results

FY21 FY22 FY23 FY24 FY25 FY26 FY27 FY28 FY29 FY30 FY31
Electricity networks RAV growth (stylised)
PLAN TARGET
ASSET DISPOSALS – MINORITY NETWORKS SALEAsset recycling to fund value creation for the Group
36
Minority disposal would create greater long-term value for the Group• Unlocks premium value in regulated
networks businesses• Provides additional capacity to diversify
growth by taking balanced risk across number of significant capital projects
• Strong long-term growth characteristics make minority stake particularly attractive to alternative investors
• Retaining majority stake ensures control whilst retaining balance sheet stability
• Maintains exposure to high quality core asset businesses
1 Distribution based on RIIO-ED2 Draft Business plan submission, subject to final submission and Ofgem determination. Including ~£200m transfer from Transmission. After modelling assumption of 25% minority interest disposal of Transmission and Distribution during FY24.
Forecast networks RAV growth from 2021 to 2031 in excess of 50%, after 25% divestment
SummaryDeliveryFive Year PlanStrategyNet Zero
AccelerationInterim Results

DIVIDEND CERTAINTY TO 2026
37
A rebased dividend to enable significant growth across the Group
FY22 and FY23 RPI increases each year, as per previous dividend plan
FY24 Dividend rebase to 60p per share
FY25 and FY26 Growth of at least 5% per annum from new base
Total dividend of at least £3.50 over the five-year plan
Scrip dividend capped at 25%
Post FY26, aiming for mid single digit dividend growth per annum
SummaryDeliveryFive Year PlanStrategyNet Zero
AccelerationInterim Results

MAINTAINING A STRONG CREDIT RATINGBusiness mix, funding plans and dividend aligned with investment grade credit rating
38
STRONG INVESTMENT GRADE RATING
CREDIT TARGETS
Credit ratios comfortably above those required for an investment grade credit rating
S&P BBB+FFO / debt at or above
18% threshold
Investment plan underpinned by strong investment grade credit rating
MOODY’S Baa1RCF / debt at or above “low teens” threshold
• Aligned with 4.5x target net debt to EBITDA ratio1
• Supported by rebased dividend to FY26
• Moody’s rating remains at Baa1, updated from negative to stable outlook 17 November
1 Net debt to EBITDA ratio reflects SSE’s set principles and methodology, including appropriate adjustments for assumed Minority Interests
SummaryDeliveryFive Year PlanStrategyNet Zero
AccelerationInterim Results

TARGETED RETURNS IN HIGH QUALITY ASSETS
39
Common capabilities across the Group drive favourable project returns
At least 10%Equity returns on Joint Venture projects, excluding developer profits
100-400 bpsSpread to WACC on unlevered projects2
300-500 bpsSpread to WACC on unlevered projects2, given investment in new technologies
7-9% Return on equity (RoE)1
Note: All returns indicated are post tax nominal returns1 Assumes CPI inflation of 2% p.a. and actual gearing ratio of 65%2 Spreads to WACC reflect balance of merchant risk and construction risk specific to each project
All investments are assessed for consistency with, and profitability in, a net zero scenario
SummaryDeliveryFive Year PlanStrategyNet Zero
AccelerationInterim Results

VISIBILITY OF GROWTH IN OPERATIONAL EARNINGS
40
Earnings growth supports organic investment and progressive shareholder returns
• Five-year plan optimises capital allocation between businesses, balancing risk and financial exposure between large-scale projects and different technologies
1 After modelling assumption of 25% minority interest disposal of Transmission and Distribution during FY242 Includes developer profits
FY21 FY26
Target Group adjusted EPS(after Minority Interest)1
Forecast average adjusted EBITDA by business to FY261
5 – 7% CAGR
~60% of EBITDA is underpinned by index-linked revenue streams
Transmission
Distribution
Renewables
Thermal
~35% ~50%2
~15%
SummaryDeliveryFive Year PlanStrategyNet Zero
AccelerationInterim Results

0
2
4
6
8
10
12
14
16
18
20
Net Capex Dividends Interest & Tax Cash requirement Operationalcashflow (inc.
developer profits)
Asset disposals Net Debt
£bn
Transmission Capex Distribution Capex Renewables Capex Other Capex
• ~ 90% of capex invested into low-carbon infrastructure in net zero-aligned businesses
FULLY-FUNDED PLAN FOR ACCELERATED GROWTH
41
Sources and uses of cash for 2026 investment plan provide optimal pathway for SSE
c.60%
c.10%
• Completion of SGN sale• Minority Transmission and
Distribution stake• Potential for residual non-
core asset disposals
ASSET DISPOSALS
• Normal refinancing with minimal incremental debt issuance
• In line with target 4.5x net debt to EBITDA ratio5
FULLY-FUNDED PLAN
NET ZERO FOCUS
£12.5bn1, 2
~ £3bn3
< £3bn ~ £18bn
~ 65%
~ 25% ~ 10%4
1 After modelling assumption of 25% minority interest disposal of Transmission and Distribution during FY242 Capex is presented net of project finance development expenditure refunds which primarily occur for Renewables projects3 Including scrip dividend assumption4 Net debt includes assumed Minority Interest debt relating to Transmission and Distribution5 Net debt to EBITDA ratio reflects SSE’s set principles and methodology, including appropriate adjustments for assumed Minority Interests
SummaryDeliveryFive Year PlanStrategyNet Zero
AccelerationInterim Results

42
Strategic Update – SSE’s Net Zero Acceleration Programme
DELIVERING ACCELERATED GROWTH

2
Pipeline under construction / due FID3
50%
Pipeline tobe constructed
30%
Future pipelinedevelopment
15%
Maintenance5%
~4GW
~8GW~1.4GW
SSE RENEWABLES – ACCELERATING INVESTMENTFive-year investment plan to 2026
43
Updated £5bn capex plan1 Earnings profileCapacity additions2
2.6GW
FY21 FY26
Developer profits Operational earnings
Adjusted EBITDA
+£3bn on previous
plan
1 All capex presented is net of project finance development expenditure refunds2 Capacity under construction or due FID reflect ownership as at FY21 and includes Seagreen 1 (527MW), Dogger Bank A & B (480MW each), Dogger Bank C (600MW) and Viking (443MW). FY26 Target of ~8GW would be unaffected by expected sale of a c.120MW stake in Dogger Bank C completing during FY22.
11-12% CAGR
SummaryDeliveryFive Year PlanStrategyNet Zero
AccelerationInterim Results

SSE RENEWABLES – ACCELERATING GROWTHLeading capacity and output growth across the next decade
44
Maintaining > 15 GW pipeline
which delivers> 1GW net
additions p.a.
Targetingfivefold output to50TWh
Trebling renewables capacity to> 13 GW
SeagreenDogger Bank ASeagreen 1A
Viking
Dogger Bank BYellow River
Dogger Bank CStrathy South
Cloiche
Arklow Bank
Berwick BankCoire Glas
North Falls
4
> 13
4
> 13
0
10
20
30
40
50
0
2
4
6
8
10
12
14
FY21 FY22 FY23 FY24 FY25 FY26 FY27 FY28 FY29 FY30 FY31
Out
put (
TWh)
Cap
acity
(GW
)
Additions from FY21 Secured Pipeline Additions from Future Prospects Forecast Output
FY21~4 GW capacity~11 TWH output
FY31>13 GW capacity~50 TWH output
Timing for additions from FY21 Secured Pipeline (> 100 MW)
~4GW
>13GW
~8GW
* Additions from Future Prospects total ~2.7GW for the period to 2031. Existing future prospects totalling >10GW are detailed on slide 46, but exclude any in-flight or future auction processes such as ScotWind, Thor or NY Bight.
SummaryDeliveryFive Year PlanStrategyNet Zero
AccelerationInterim Results

SSE RENEWABLES – GROWING THE PIPELINEA superior pipeline with focus on opportunities to enhance growth
45
• 2.6GW is currently in construction or due FID• Remaining 1.4GW will come from combination of:
• Existing secured pipeline (2.4GW consented & ~4.9GW requiring consent at FY21); and
• Future prospects secured and constructed
• > 10 GW future prospects in development (slide 46)
• Domestically, extension of existing sites combined with 10GW ScotWind auction will add to pipeline
• Internationally, East Asia, North West Europe and United States are active options for growth (slide 48)
0
5
10
15
Offshore Onshore Pumped Storage FY21 SecuredPipeline
Constructedby FY26
To BeSecured Additions
FY26 SecuredPipeline
GW
In Construction Consented Requiring Consent
40% already in FY21
~107.1 1.2
1.5
GROW AND SUSTAIN PIPELINE AT > 15GW by FY26~ 10GW SECURED PIPELINE AT FY21
60%additions to be secured
~4
> 9 > 15
~ 4GW CONSTRUCTED BY FY26 > 9GW TO BE SECURED ADDITIONS TO FY26 PIPELINE
~4GW > 9GW
Note – Secured pipeline comprises development projects where land leases or seabed rights are held by SSE. Contained within the secured pipeline is a mix of under construction, consented and requiring consent projects as detailed on slide 46.
SummaryDeliveryFive Year PlanStrategyNet Zero
AccelerationInterim Results

MW
Other GB ~250
Other ROI ~250
Other NI ~50
Total ~550
MW
Viking 443
Gordonbush Ext.2 38
Lenalea 15
Total 496
MW
Yellow River 105
Tangy 57
Total 162
MW
Strathy South3 208
Cloiche 155
Other ~200
Total ~563
MW MW
Coire Glas 1,500
MW MW
Other GB 75
MW
GB 1,025
ROI 196
Total ~1,221
MW
Pumped storage 1,500
MW
Braymore Point 800
Celtic Sea Array 800
Japan 8,000
Future auctions TBC
Total 9,600
MW
Dogger Bank A 480
Dogger Bank B 480
Dogger Bank C4 600
Seagreen 1 527
Total 2,087
MW
Arklow Bank 23 520
Seagreen 1A 176
Total 696
MW
Berwick Bank 4,100
North Falls 252
Total 4,352
MW
GB 6,615
ROI 520
Total 7,135
SSE RENEWABLES –PIPELINE AND PROSPECTSHigh quality pipeline options, with opportunities to sustainably grow into the next decade
46
ON
SHO
RE
1.9G
W o
pera
tiona
lO
FFSH
OR
E0.
5GW
ope
ratio
nal
FUTURE PROSPECTS1DUE FID OR IN CONSTRUCTION CONSENTED REQUIRING CONSENT
TOTAL: >10GWTOTAL: 2.6GW TOTAL: 2.4GW TOTAL: ~4.9GW
Note – Table above reflects ownership and development status as at FY21 as well as the recently announced acquisition of a Japanese development platform1Future prospects comprise named development areas where some form of development activity is under way and therefore excludes any future or in-flight auction processes such as ScotWind, Thor or NY Bight. Future prospect additions on slide 44 total ~2.7GW for the period to 2031. 2Entered commercial operation in Aug 21 3Partially consented 4600MW reflects 50% equity stake. A 10% equity stake sale is expected to complete by Q1 2022, reducing share to 480MW.
Hyd
ro1.
5GW
ope
ratio
nal
SECURED PIPELINE
TOTAL: ~10GW
SummaryDeliveryFive Year PlanStrategyNet Zero
AccelerationInterim Results

SSE RENEWABLES – OFFSHORE DEVELOPMENTOffshore wind options under development and deliverable within the next 10 years
47
Project 2021 2022 2023 2024 2025 2026 2027 2028 2029 2030 2031Seagreen 1A360MW
Berwick Bank *Up to 4,100MW
North FallsUp to 504MW
Arklow Bank 2520MW
Braymore800MW
Celtic Seas800MW
ScotWind (CES)
Thor 800-1,000MW
Japan 1400MW
Japan 2400MW
ConstructionDevelopment
Development Construction
Development Construction
Development Construction
Development Construction
Development Construction
DevelopmentBid
Development ConstructionBid
SEAB
ED S
ECU
RED
–SE
EKIN
G C
ON
SEN
TFU
TUR
E PR
OSP
ECTS
Target commercial operations date
Target first energy
Key
Construction phase
Development phaseTarget consent achieved
Bid phase
Target FID
Construction
ConstructionDevelopment
ConstructionDevelopment
Notes – Capacities stated above reflect SSE’s current ownership percentage. Early stage auctions are excluded from the chart* Following the merger of Berwick Bank and Marr Bank offshore wind farms into a single wind farm - Berwick Bank Wind Farm – in September 2021, the project is in the process of being redesigned ahead of an expected planning application submission in Spring 2022. Timeline indicated above is therefore subject to change.
SummaryDeliveryFive Year PlanStrategyNet Zero
AccelerationInterim Results

SSE RENEWABLES – INTERNATIONAL EXPANSIONCarefully selected international markets are providing attractive opportunities to grow pipeline
48
United StatesOffshore Wind• Incorporation of North American subsidiary• Pre-qualified for NY Bight Auction• Auction anticipated between Nov 21 – Feb 22
East AsiaOffshore Wind• Joint Ownership Company formed with Pacifico Energy• 10GW (gross) acquisition of early stage development options• Expected to start entering bid rounds before or in mid-2020s
Strong growth in regions SSER is exploring
North West EuropeOffshore Wind• Auction entry in North-West Europe (e.g. Denmark)• Acciona partnership to enter new markets in Poland and Iberia
Onshore Wind• Entry options via local development platforms
0
25
50
75
100
125
2021 2026 2031
Cum
ulat
ive
inst
alle
d ca
paci
ty /
GW
North West Europe(excl. UK, RoI)US
East Asia(excl. China)
0
100
200
300
400
500
2021 2026 2031
>7x>1.5x
Source: Onshore wind – BNEF NEO 2020; Offshore wind – BNEF 1H 2021 Offshore Wind Market Outlook
SummaryDeliveryFive Year PlanStrategyNet Zero
AccelerationInterim Results

Market Policy Outlook
• Structure: Energy sector liberalisation completed in 2016 and unbundling concluded in 2020, plans to abolish regulated electricity rates
• Policy goals: Late 2020 Japan legislated 2050 net zero target, now awaiting publication of route map
• Ambitious decarbonisation path required: In 2020, 76% of supply came from fossil-fuels with >17GW of nuclear being decommissioned
• Energy security: Japan imports c90% of energy sources. Utility-scale domestic production of offshore wind and ‘green H2’ strategic policy aim
Offshore Wind Outlook• Revenue support: First offshore wind auction closed mid-2021, with Feed-in-
Tariff capped at ¥29k/MWh (c£190/MWh), annual auctions expected
50 Hz
60 Hz
SSE RENEWABLES: INVESTMENT INTO JAPANAttractive early development opportunities as Japan reduces nuclear reliance
49
0
10
20
30
40
50
2020 2030 2040
GW
Government targets for offshore wind installed capacity
10
30 - 45
1GW p.a.
3.5GW p.a.
Offshore Wind Development Platform
• 10 GW gross (8GW net) portfolio of early stage development opportunities, comprising over 15 sites focused in the Tokyo, Tohoku, Kyushu and West Japan regions
• Mixture of fixed and floating wind sites• Local development team of c20 employees, which will be
complimented by SSE employees• Most advanced sites aiming to enter bid rounds in the mid-2020s
Kyushu
West Japan
Tokyo
Tohoku
Market policy outlook
Offshore wind outlook
Acquired offshore wind development platform
SummaryDeliveryFive Year PlanStrategyNet Zero
AccelerationInterim Results

SSE RENEWABLES – HYDRO OPTIONSCurrent portfolio plus pumped storage development at Coire Glas
50
Nature’s battery• UK Government highlighted importance of long duration storage in
Smart Systems and Flexibility plan• Coire Glas could be UK’s largest pumped storage project
• Consented 1.5GW site provides 30GWh of storage potential
• £1.2-£1.5bn estimated capital expenditure
• Critical flexibility provides grid stability, reduces wind curtailment and displaces fossil fuel-fired plant – requires revenue certainty but no subsidy
• Operational by the end of the decade, assuming clarity on government policy
Loch Ness, site of Foyers Hydro Scheme
Decades of clean, flexible power• 84 hydro stations with 1,459MW capacity, including 300MW of pumped
storage and 750MW of flexible hydro.
• Historically strong performance in Balancing Market
• ~£50m to be invested in repowering Tummel Bridge station, extending operational life by over 40 years and increasing capacity from 34MW to 40MW
Loch Lochy - lower reservoir for Coire Glas site
SummaryDeliveryFive Year PlanStrategyNet Zero
AccelerationInterim Results

• “First-of-a-kind” CCS-CCGTs at Keadby (East Coast Cluster) and Peterhead (Acorn project)
• Hydrogen blending potential at Keadby 2• Net capex investment to FY26 of ~£600m
• “First-of-a-kind” Hydrogen-CCGT at Keadby• Potential for hydrogen storage at Aldborough• Development of further CCS and hydrogen
projects across UK and Ireland
SSE THERMAL – CRITICAL FLEXIBILITY AND H2 OPTIONSLeading in low-carbon thermal with attractive growth optionality
51
CCUS
H2
Peterhead CCS
KeadbyCCS / Hydrogen
Atwick & Aldborough Gas Storage
CCS projects
Hydrogen projects
Potential development sites
• Critical flexibility gives security of supply and stability of price in wind-dominated system
• Improves group earnings stability via capacity contracts and natural hedge against lower wind output / higher prices
• Gas Storage holds ~40% of the UK’s conventional underground gas capacity
SummaryDeliveryFive Year PlanStrategyNet Zero
AccelerationInterim Results
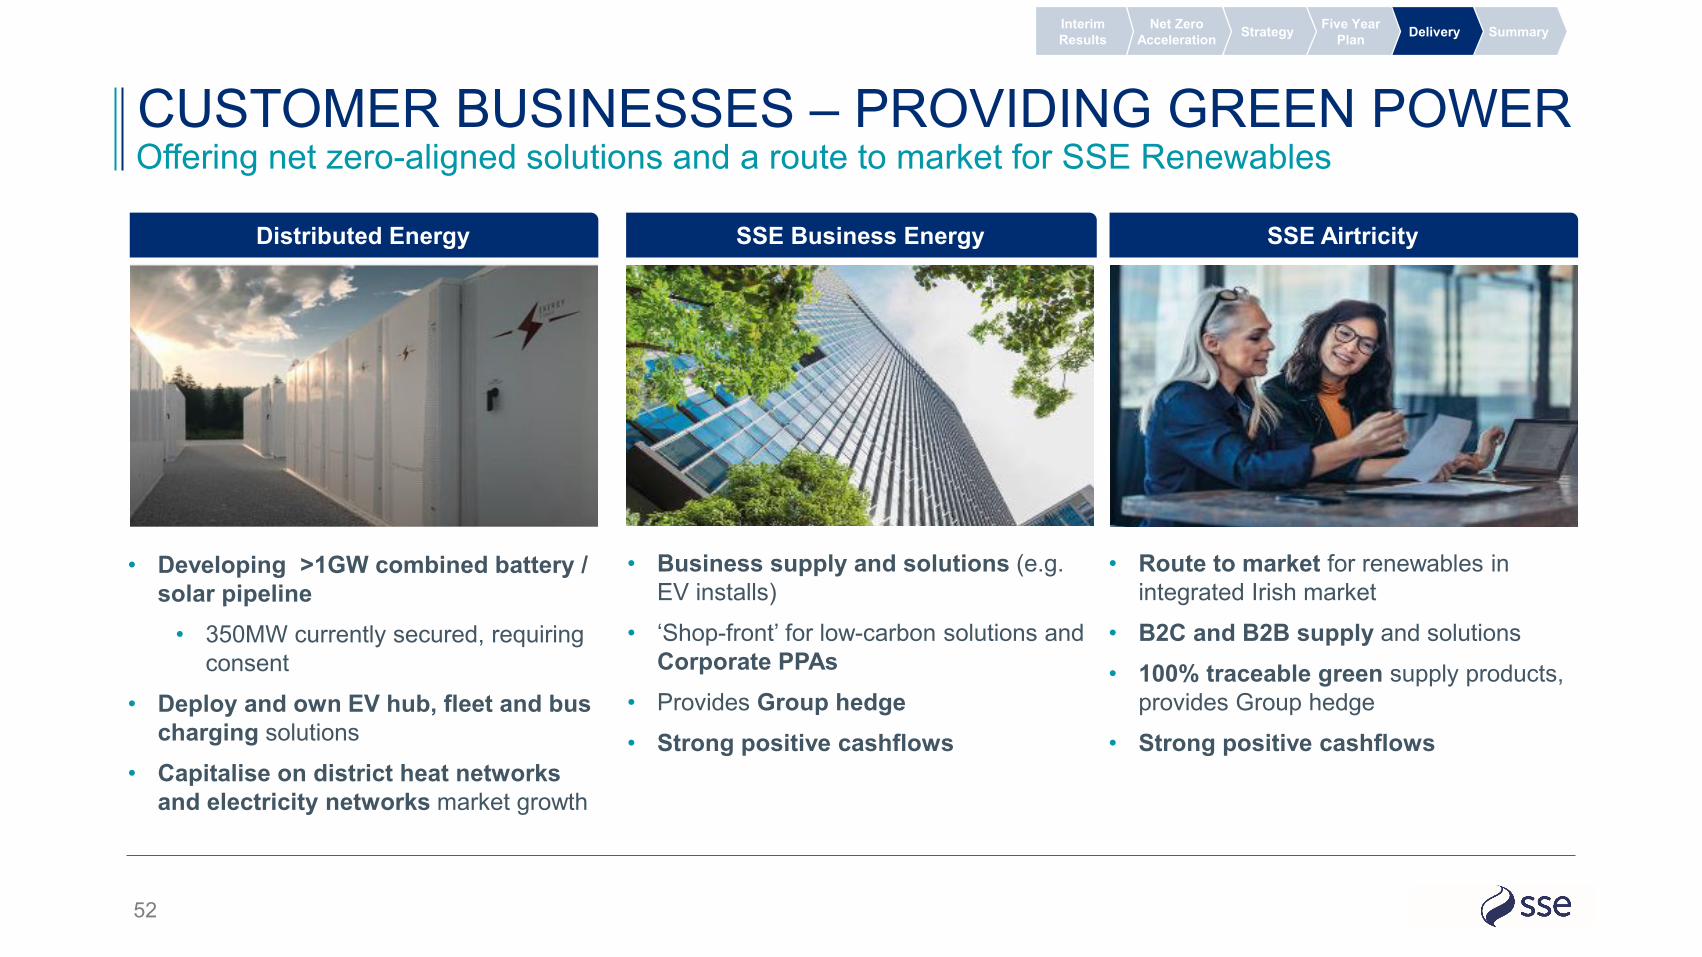
CUSTOMER BUSINESSES – PROVIDING GREEN POWEROffering net zero-aligned solutions and a route to market for SSE Renewables
52
SSE Business EnergyDistributed Energy SSE Airtricity
• Developing >1GW combined battery / solar pipeline
• 350MW currently secured, requiring consent
• Deploy and own EV hub, fleet and bus charging solutions
• Capitalise on district heat networks and electricity networks market growth
• Business supply and solutions (e.g. EV installs)
• ‘Shop-front’ for low-carbon solutions and Corporate PPAs
• Provides Group hedge• Strong positive cashflows
• Route to market for renewables in integrated Irish market
• B2C and B2B supply and solutions• 100% traceable green supply products,
provides Group hedge• Strong positive cashflows
SummaryDeliveryFive Year PlanStrategyNet Zero
AccelerationInterim Results

0
2
4
6
8
10
12
14
16
18
20
FY21 FY22 FY23 FY24 FY25 FY26 FY27 FY28 FY29 FY30 FY31Transmission Distribution Potential upside
SSE NETWORKS – TRANSMISSION AND DISTRIBUTIONRegulated electricity networks are key enablers of net zero
53
8-9% gross CAGR
£15-18bn RAV by 2031
(gross)
Index-linked earnings growth
>£5bn investment1
required during five years to 2026 (net)
1 Assumes 25% minority interest disposal of Transmission and Distribution during FY24. Distribution based on RIIO-ED2 Draft Business plan submission, subject to final submission and Ofgem determination. Including ~£200m transfer from Transmission. Transmission includes an assumed c£1bn of totex allowed under uncertainty mechanisms. Inflation assumption 3% RPI/2% CPIH.
SummaryDeliveryFive Year PlanStrategyNet Zero
AccelerationInterim Results

FY21 FY26SSE Ownership Minority Interest
SSEN TRANSMISSION – A NETWORK FOR NET ZEROExceptional RAV growth expected through RIIO-T2 to enable net zero
54
5-year Transmission capex to FY26
Net capex of >£3bn1
Includes ~£1bn (net) investment in:
• Skye reinforcement project
• Eastern HVDC project
• North Argyll project
Prev. plan to FY25 New plan to FY26
Avg. Transmission capex p.a.
£m
1 Assumes 25% minority interest disposal of Transmission during FY24.2 Source: National Grid Future Energy Scenarios, Leading the Way, FES 20213 Including ~£200m transfer to Distribution. Subject to generator commitment, planning and Ofgem determination
Key projects to FY26 Exceptional RAV growth to FY26
Expected CAGR (gross) of c.12%• Potential for 14GW+ capacity connected
by 20262
• Gross RAV expected to reach £6bn by FY263
• Represents 30% increase in net RAV3
SSEN Transmission RAV Forecast3
1
c.12%gross CAGR>10%
SummaryDeliveryFive Year PlanStrategyNet Zero
AccelerationInterim Results

Expected CAGR (gross) of 9-11%• Gross RAV expected to reach £8-10bn
by 20312
• Could see a path for gross RAV to reach £12bn by 2031, in the event of acceleration of reinforcement expenditure2, 3
SSEN TRANSMISSION – RIIO-T3 AND BEYONDHighly attractive long-term growth trajectory in line with renewables growth
55
1 Source: National Grid Future Energy Scenarios2 Including ~£200m transfer to Distribution. Subject to generator commitment, planning, levels of load investment required in the period, plus Ofgem determination 3 Subject to acceleration of ScotWind and onshore buildout
Forecast RAV growth to FY31
FY21 FY26 FY31SSE Ownership Minority Interest
SSEN Transmission RAV Forecast
9 - 11% gross CAGR
• Installed renewable capacity forecast to increase materially out to 2050 • ScotWind expected to add 10GW of offshore wind• Significant further onshore wind required to meet net zero targets
• Potential for second HVDC link and possible island links
Expected 2050 generation increased across all scenarios in the past 12 months
05
101520253035404550
2020 2025 2030 2035 2040 2045 2050
GW
Forecast Total Generation Connected (SSEN Transmission Area)1
Leading The Way FES21 Consumer Transformation FES21 System Transformation FES21 Steady Progression FES21
SummaryDeliveryFive Year PlanStrategyNet Zero
AccelerationInterim Results

SSEN DISTRIBUTION – ENABLING ELECTRIFICATION Significant RAV growth from net zero investment connecting and electrifying the UK
56
1 After modelling assumption of 25% minority interest disposal of Transmission and Distribution during FY242 Based on RIIO-ED2 Draft Business plan submission, subject to final submission and Ofgem determination. Including ~£200m transfer from Transmission
Net capex planned of c.£2bn1,2:• Network resilience investment
• Service delivery investment
• Net zero investment
Previous plan to FY25 New plan to FY26*
Avg. Distribution capex p.a.
>15%
£m
5-year Distribution capex to FY26 Significant RAV growth to FY262
Expected CAGR (gross) of c.8%• Significant network investment driving RAV
growth
• Gross RAV expected to reach £5.5bn by 20262
FY21 FY26SSE Ownership Minority Interest
Distribution RAV Forecast2
c.8%gross CAGR
Diverse and unique geographies
SummaryDeliveryFive Year PlanStrategyNet Zero
AccelerationInterim Results

7 - 8%gross CAGR
-5
5
15
25
35
45
55
0
0.2
0.4
0.6
0.8
1
1.2
1.4
1.6
1.8
2
2020 2025 2030 2035Heat pump capacity (GW) EV charging (GW) Consumer Transformation FES20Steady Progression FES20 System Transformation FES20
SSEN DISTRIBUTION – SUSTAINABLE GROWTHDistribution will be a key enabler of the accelerating electrification of heat and transport
57
Forecast load spend vs EV and heat pump capacity (SSEN Distribution area)
Forecast RAV growth to FY311
Expected CAGR (gross) of 7 - 8%• Expected to reach £7-8bn gross by 2031,
subject to RIIO-ED2 regulatory determination and required future load spend1
FY21 FY26 FY31SSE Ownership Minority Interest
SSEN Distribution RAV forecast
• Connected EV charging and heat pump capacity forecast to increase materially into the 2030s
• Potential for a five- to ten-fold increase in annual load spend between now and 2038, depending on the scenario
1 Based on RIIO-ED2 Draft Business plan submission, subject to final submission and Ofgem determination. Including ~£200m transfer from Transmission.2Consumer Transformation FES 20203Includes extrapolated cost estimates beyond 2028
Load
exp
endi
ture
(Lin
e, £
bn)
Cap
acity
(Bar
, GW
)
2 2
3
3
3
SummaryDeliveryFive Year PlanStrategyNet Zero
AccelerationInterim Results

58
Strategic Update – SSE’s Net Zero Acceleration Programme
SUMMARY

COMMITMENT TO SUSTAINABLE LONG-TERM GROWTH Investment plan delivers optimal platform for growth to 2031
59
• Fully-funded, £12.5bn investment plan to FY26 for accelerated growth to net zero• Optimised capex maximises Total Shareholder Returns and sustains credit rating• Dividend >350p / share across five years, with aim for mid single digit growth after
FY21 FY26 FY31 -
10
20
30
40
50
FY21 FY26 FY31
TWh
Targeting fivefold renewable output to
50TWh p.a.
8 – 9% gross RAV CAGR, to reach
£11-13bn net RAV
Maintain > 15GW pipeline, delivering
>1GW net additions p.a.
0
3
6
9
12
15
18
FY21 Renewable Low-carbonflexible
FY31
GW
inst
alle
d
Meet 1.5° celsiusscience-based carbon targets
£11 -13 bn (net)
SummaryDeliveryFive Year PlanStrategyNet Zero
AccelerationInterim Results

> 350p / share 4
rebased dividend across five years
4.5x net debt/EBITDA
Strong credit rating
SSE PLC: NET ZERO ACCELERATION PROGRAMMEThe optimal pathway to maximise shareholder value and growth into the 2030s
60
£11-13bn net networks RAV2
1.5° celsiusScience-based carbon targets
> 3 GWNet low-carbon
flexible thermal and distributed generation
> 13 GWNet installed renewables capacity
0
5
10
20/21 25/26
£bn
SSE Ownership Minority Interest
+4GW net capacity
5-7%Adjusted EPS CAGR
~10%gross RAV CAGR3
> 15GW pipeline
RENEWABLES ELECTRICITY NETWORKS
0
2
4
6
8
20/21 25/26
GW
Offshore Wind Onshore Wind Hydro
£7.4bn ~£9bn
~2x
Minority stake sale in Transmission and
Distribution2
Growth-enabling rebased dividend plan
Networks Renewables Thermal Other
£12.5bn net capex1
~40% ~40%
~20%
…AND THE PLATFORM FOR GROWTH TO 2031 & BEYOND
…DELIVERING ACCELERATED GROWTH AT ATTRACTIVE RETURNS INTO 2026…
FULLY-FUNDED ENHANCED INVESTMENT PLAN…
SummaryDeliveryFive Year PlanStrategyNet Zero
AccelerationInterim Results
1 All capex presented includes investments in development pipeline and is net of project finance development expenditure refunds2 After modelling assumption of 25% minority interest disposal of Transmission and Distribution during FY243 Underlying business, assumes 2% CPI inflation p.a. Distribution based on RIIO-ED2 Draft Business plan submission, subject to final submission and Ofgem determination4 Dividend rebased at 60p in 23/24, targeting at least 5% annual growth thereafter to March 2026

APPENDIX

SSE’S ESG CREDENTIALSAiming for leading ESG performance
62
ESG Rating: AAAIn the top 8% of 139 global
utilities
Score: A-Scored as ‘Leadership’ for
climate change
Included in the index series since 2001
Included in the index since 2018
In the top decile for disclosure in the WDI
Score: Top decile
Scored as ‘Advanced’ ESG Score: 63/100
69th percentile ranking within the Electric Utilities industry
56/100
*Copyright ©2021 Sustainalytics. All rights reserved. This ESG ratings and indices performance table contains information developed by Sustainalytics (sustainalytics.com). Such information and data are proprietary of Sustainalytics and/or its third party suppliers (Third Party Data) and are provided for informational purposes only. They do not constitute an endorsement of any product or project, nor an investment advice and are not warranted to be complete, timely, accurate or suitable for a particular purpose. Their use is subject to conditions available at sustainalytics.com/legal-disclaimers.
In the 21st percentile in Electric Utilities subindustry
ESG Risk Rating*: 30.1 IncludedIncluded
Oct 2020 Sep 2021 Feb 2021 Nov 2020
Jun 2021Jan 2021 Mar 2021 Apr 2021

Previous plan announced in May 2020 is ahead of schedule• Cash proceeds from disposal of non-core
assets expected to exceed £2.7bn by end of financial year
• c.95% of £7.5bn capex to FY2025 committed, with c.80% investment in Renewables and Networks
• Net debt to EBITDA of 4.6x at March 2021, within lower end of a 4.5 to 5 times range from 2021-2025.
• Credit Ratings of BBB+ stable outlook (S&P) and Baa1 negative outlook (Moody’s), comfortably above investment grade
• FY20/21 dividend of 81p, in line with 2018-23 dividend plan
DELIVERING ON OUR PREVIOUS INVESTMENT PLANBreadth and quality of growth options mean acceleration required
63
KEY OBJECTIVES
REMUNERATE SHAREHOLDERS
PROMOTE LONG TERM SUCCESS
Sustain SSE’s ability to pay dividends on which pensioners and savers depend for income
Contribute to green economic recovery and create value through the transition to net zero
EFFECTIVE FINANCIAL MANAGEMENT
MANAGING CASH OUTFLOW
SECURING VALUE FROM DISPOSALS
COMPREHENSIVE PLAN

Technology Geography Net Capacity (MW)
Scotland 235
England 252
Total Offshore Wind 487
Scotland 1,180
England 68
Northern Ireland 122
Republic of Ireland 568
Total Onshore Wind 1,938
Pumped Storage 300
Conventional Hydro 1,159
Total Hydro 1,459
Total renewable generation capacity 3,884
SSE RENEWABLES – CURRENT OPERATIONSDiversity of key assets across geographies and technologies
64 Note: All capacities are net.
Greater Gabbard
Beatrice
Map of operational clusters

• Development commenced pre 2003 and was for many years the world’s largest offshore project in development
• World’s largest offshore wind farm at completion
• Currently developing North Falls as an extension project
• Scotland’s largest operational offshore wind farm
• World’s deepest installation of fixed foundations and largest offshore windfarm to use jacket foundations at completion
• Multi-contracting strategy • Completed £100m under budget
• World’s largest and deepest deployment of suction caisson jacket foundations
• Multi-contracting strategy across four work packages
• Unique financing strategy maximizes returns and external financing on partial CfD
• Will be world’s largest offshore wind farm• First deployment of the world’s largest
wind turbine, GE’s 13 MW Haliade-X• Awarded world’s largest cabling contract• First UK project to use HVDC grid connection• Multi-contracting strategy across >20 main
construction contracts for phases A&B
SSE RENEWABLES – LEADER IN OFFSHORE WINDLeading construction of more offshore wind than anyone else in the world
65
588MW operational since 2019Depth of up to 55m; Distance from shore >10km
1,075MW in constructionDepth of up to 62m; Distance from shore >30km
3,600MW in construction or due FID Depth of up to 63m; Distance from shore >130km
Development, construction & operations lead Development, construction & operations lead Development, construction & operations lead Development & construction lead
Depth of up to 34m; Distance from shore >20km504MW operational since 2012
~£1.5bn investment made on-balance sheet
~£2.5bn investment • Off-balance sheet funding refinanced in 2019• Gearing increased post construction allowing
equity release via dividends
~£3bn investment • Inc. £500m on offshore transmission link • Project financed with gearing of ~42%
~£6bn investment in phases A&B• Inc. ~1.7bn on offshore transmission link • Project financed with gearing of 65-70% for
generation assets
• Double ROC contract for 100% of output • CfD for 100% of output at £140/MWh1 • CfD for 42% of output at £41.61/MWh1 • CfD for 100% of output at £39.65/MWh1 (for phase A) and £41.61/MWh1 (for B & C)
1 In 2012 prices
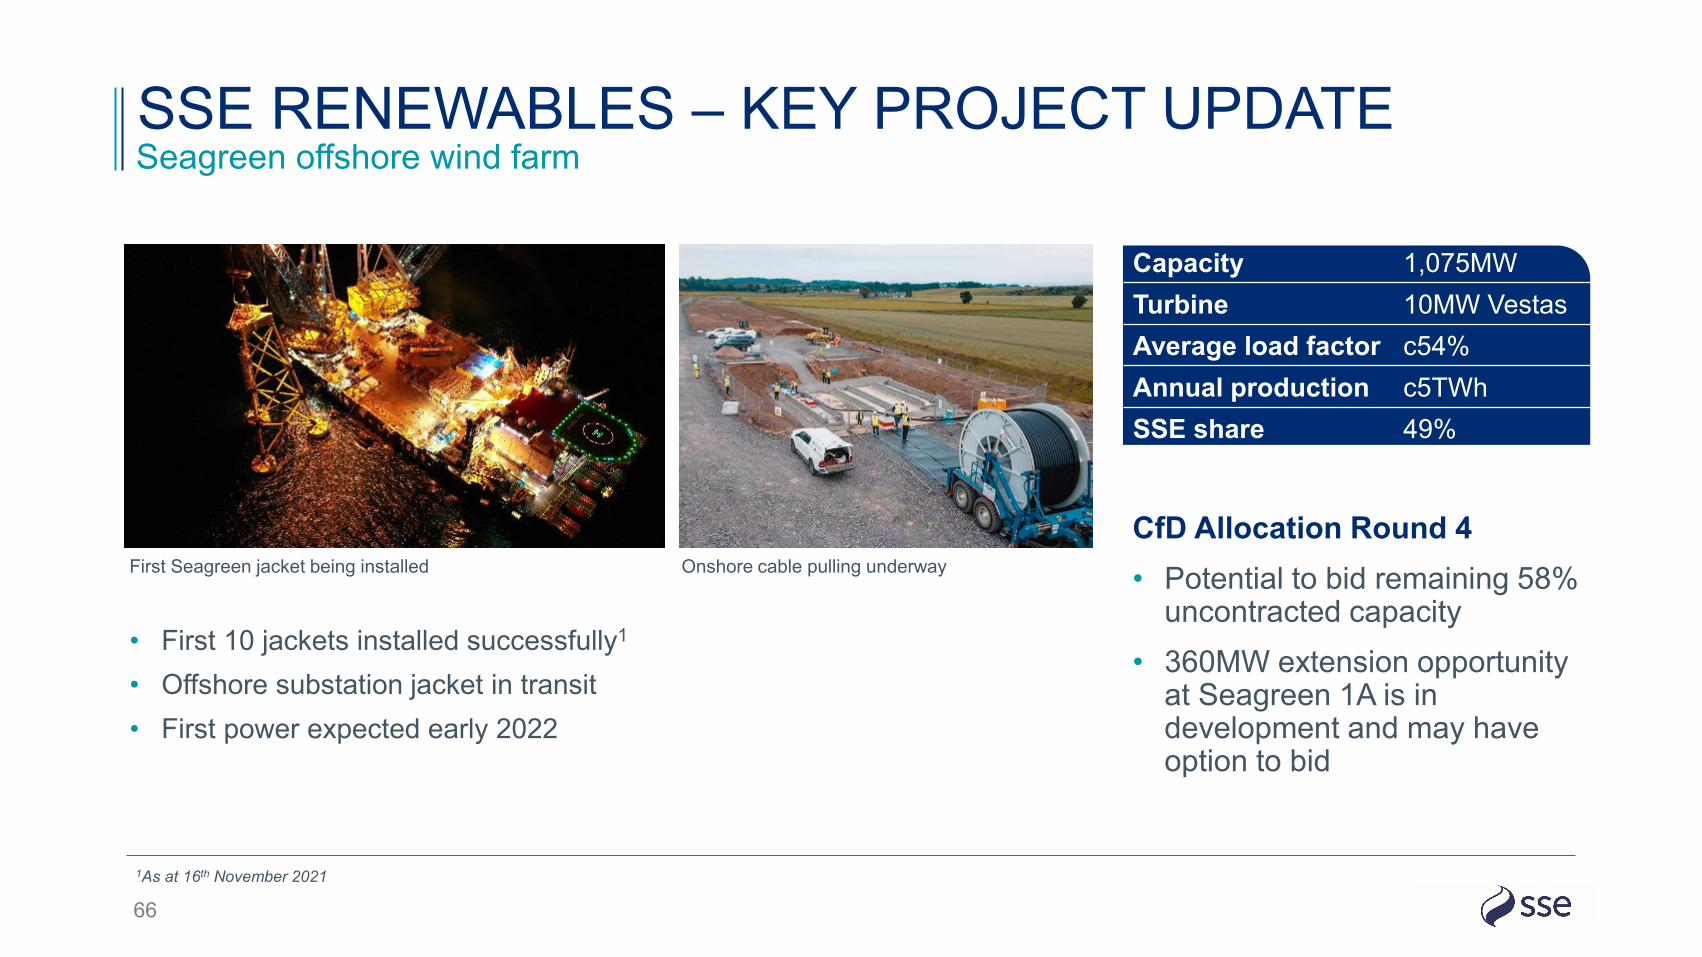
CfD Allocation Round 4• Potential to bid remaining 58%
uncontracted capacity• 360MW extension opportunity
at Seagreen 1A is in development and may have option to bid
SSE RENEWABLES – KEY PROJECT UPDATESeagreen offshore wind farm
66
Capacity 1,075MWTurbine 10MW Vestas Average load factor c54%Annual production c5TWhSSE share 49%
First Seagreen jacket being installed Onshore cable pulling underway
• First 10 jackets installed successfully1
• Offshore substation jacket in transit• First power expected early 2022
1As at 16th November 2021

Onshore cables for Dogger Bank A and B arriving for installation
• Progressing onshore construction of cabling and substation for phases A and B
• First offshore works commencing in Q2 2022 with installation of the HVDC export cables for Dogger Bank A.
Dogger Bank C financial close expected by end of 2021 calendar year
SSE RENEWABLES – KEY PROJECT UPDATEDogger Bank offshore wind farm
67
Capacity 3,600MWTurbine 13 & 14MW GEAverage load factor c57%Annual production c18TWhSSE share 40%
Turbine testing facility in Blyth

SSE RENEWABLES – KEY PROJECT UPDATEViking onshore wind farm
68
Cement pouring and smoothing at Viking turbine foundation
Construction is progressing well with work on civils and DC substation continuing, turbines in early 2023 and completion planned for autumn 2024.• 60km out of 70km of access roads completed1
• 47 of the 103 turbine bases in construction, with 13 complete1
Capacity 443MWTurbine 4.3MW Vestas Average load factor c48%Annual production Almost 2TWhSSE share 100%
Construction of Viking wind farm access road
1As at 9th November 2021

SSE RENEWABLES – PROJECT ASSUMPTIONSAssumed future ownership percentages used as basis for slides 43 - 47
69
Technology Project Gross Capacity (MW)
Current SSE ownership
Assumed future SSE ownership
Net CapacityAdditions (MW)
Viking 443 100% 100% 443
Yellow River 105 100% 100% 105
Strathy South 208 100% 100% 208
Cloiche 155 100% 100% 155
Other <100MW 310 100% 100% 310
Total Onshore Wind 1,221 100% 100% 1,221Seagreen 1,075 49% 49% 527
Dogger Bank A & B 2,400 40% 40% 960
Dogger Bank C 1,200 50% 40% 480
Seagreen 1A 360 49% 49% 176
Arklow 520 100% 50% 260
Berwick Bank Up to 4,100 100% 40% 1,640
North Falls Up to 504 50% 50% 252
Total Offshore Wind Up to 10,159 70% 42% 4,295
Corie Glas 1,500 100% 50% 750
Total Hydro 1,500 100% 50% 750
Total Renewables Additions Assumed from Secured Pipeline 6,266
Developer profits are consistently included within adjusted EBITDA and EPS metrics and this remains part of future plans. FY21 EPS of 87.5p (the base year for the EPS CAGR on SL40) included £226m of developer profits. Modelling currently assumes any developer profits in FY26 are lower than the £226m achieved in the FY21 base year.

SSEN DISTRIBUTION - RIIO-ED2 DRAFT PLANPowering Communities to Net Zero
70
Ambitious stakeholder-led plan to build net zero resilience and enable local electrification• £4.1bn in baseline investment (gross) proposed from 2023 to 2028
• an increase of around 36% on equivalent ED1 period
• If agreed, RAV of SSEN Distribution would grow to over £6bn (gross) by 2028 • Plan is flexible, with an additional £900m of regulatory uncertainty mechanisms to support further acceleration

RECONCILIATION OF GROSS TO NET CAPEXImpact of partnerships, project financing1 and minority interests2
71
1 Assumes 65% gearing on Project Financing on Offshore Wind projects2 Assumes 25% minority interest disposal of Transmission and Distribution in April 2023
• Gross capex represents SSE’s gross consolidated share of capex invested in each business, based on current SSE ownership and including any capex funded by project financing within Joint Ventures.
• Capex metrics included within this presentation consistently includes investments in, or acquisitions of, development platforms and is presented net of project finance devex refunds.
Renewables Transmission Distribution Other