timing of ceo stock option grants and corporate ... › facbios › file › huanglu_2010.pdftiming...
TRANSCRIPT

Timing of CEO Stock Option Grants and Corporate Disclosures: New
Evidence from post-SOX and post-Backdating-Scandal Era
Wenli Huang
School of Management
Boston University
Hai Lu
Rotman School of Management
University of Toronto
Current version: September, 2010
We are grateful for comments received from Russell Craig, Luann Lynch, David Maber, Krish Menon,
Grace Pownall, Gordon Richardson, Katsiaryna Salavei, Igor Semenenko, Kumar Sivakumar, Shyam
Sunder, Franco Wong, and workshop participants at Boston University, the University of Toronto, and
the participants of the annual conferences of American Accounting Association, Canadian Academic
Accounting Association, European Accounting Association, Financial Management Association, Asian
Finance Association, and Northern Finance Association. We gratefully acknowledge the financial support
from the Social Sciences and Humanities Research Council of Canada and the CMA/Canadian Academic
Accounting Association. All errors are our own.
1
Timing of CEO Stock Option Grants and Corporate Disclosures: New
Evidence from post-SOX and post-Backdating-Scandal Era
ABSTRACT
Extant studies provide two additional explanations other than backdating for the abnormal
stock returns around CEO option grants - timing of option grants and timing of corporate
disclosures. We examine the effect of the Sarbanes-Oxley Act of 2002 (SOX), the stock option
backdating scandal, and the new compensation disclosure rules of 2006 on these opportunistic
timing behaviors. We find no evidence of opportunistic timing relative to scheduled option
grants in the pre-SOX, post-SOX, and post-Scandal periods. However, timing behaviors for
unscheduled option grants persist in the post-SOX period. In addition, we distinguish timing of
option grants from timing of news disclosures by categorizing earnings announcements into
fixed and variable dates and find the persistence of both behaviors. We also analyze option
grants to independent directors and find no evidence of timing behaviors in all three sample
periods. Overall, our results suggest that, while SOX mitigates backdating, it does not affect
opportunistic timing behaviors related to CEO option grants, however, the backdating scandal
combined with the subsequent compensation disclosure rules have deterred these behaviors.
JEL Classification: M41; M52; K22; G38
Key words: Backdating; Stock Options; Timing; Disclosures; Regulations; Sarbanes-Oxley Act
Data availability: All data are available from sources identified in the text.

1
Timing of CEO Stock Option Grants and Corporate Disclosures: New
Evidence from post-SOX and post-Backdating-Scandal Era
1. Introduction
Economic theory predicts that managers often act strategically and in their best interests.
Extant studies in finance and accounting literature document that abnormal stock returns are
negative before CEO stock option grants and positive afterward. This asymmetric trough pattern
of stock returns is attributed to three types of opportunistic behavior: (1) opportunistic timing of
option grants relative to future anticipated stock returns (Yermack 1997), (2) opportunistic
timing of corporate disclosures around option grants (Aboody and Kasznik 2000; Chauvin and
Shenoy 2001), and (3) backdating of option grant dates (Lie 2005; Narayanan and Seyhun 2008).
To maximize their compensation, managers may have a pecking order based on the potential
costs associated with each behavior. Option backdating, which could be at the top of the pecking
order, has received a great deal of attention from regulators, academics, and the public. Heron
and Lie (2009) estimate that 13.6% of option grants to top executives from 1996 to 2005 were
backdated or otherwise manipulated. This estimate indicates that opportunistic behaviors are
widespread although only a small set of firms were implicated for backdating practice. It also
raises interesting questions: Do opportunistic timing behaviors (both (1) and (2)) co-exist with
backdating? Have the disclosure-related regulations affected the use of such timing? In this
study, we attempt to address these questions by examining the effects of the Sarbanes-Oxley Act
of 2002 (hereinafter SOX), option grant backdating scandal, and subsequent executive
compensation disclosure rules on these opportunistic behaviors.

2
The earlier work on the asymmetric stock return patterns around option grants focus on
managers influencing their stock option compensation by manipulating the timing of the grants
and the timing of corporate information disclosures. Yermack (1997) shows that stock option
awards between 1992 and 1994 were often followed by positive abnormal returns. He interprets
the results as evidence that CEOs opportunistically time option awards before the disclosure of
favorable corporate news1. Aboody and Kasznik (2000) investigate voluntary disclosures around
scheduled option grants from 1992 to 1996 and find evidence consistent with managers timing
their information release by delaying good news and rushing forward bad news.2 More recently,
Lie (2005) and Narayanan and Seyhun (2008) propose the backdating explanation, i.e., managers
set the option grant date retroactively to an earlier date when the stock price was lower than on
the date when the option was awarded. Backdating has attracted a great amount of attention
from the media, regulators, and investors (e.g., Maremont 2005; Cox 2006; Forelle and Bandler
2006; Stecklow 2006) and has inspired many academic studies examining the scandal from
various perspectives3, including the link between backdating and corporate governance
(Bebchuk, Grinstein, and Peyer 2009; Bizjak, Lemmon, and Whitby 2009; Collins, Gong, and Li
2009), the economic impact of backdating (Narayanan, Schipani, and Seyhun 2007; Cheng,
Crabtree, and Smith 2008; Bernile and Jarrell 2009), the prevalence of backdating (Heron and
Lie 2007, 2009; Narayanan and Seyhun 2008; Bebchuk et al.. 2009), and the backdating of stock
option exercises (e.g., Cicero 2006; Dhaliwal, Erickson, and Heitzman 2009).
1 The practice of granting an option before the release of positive corporate news is often referred to as spring-
loading. Another practice, called bullet-dodging, is the practice of delaying a grant until after the negative news has
been released. 2 Heron and Lie (2007) shows that when the definition of scheduled option grants is tightened the trough pattern of
stock price largely disappears. 3 Lie was listed as a Time 100 and also awarded the notable contribution to accounting literature for his finding of
backdating.

3
Regulators have been continuously responding to these opportunistic behaviors and
introducing different disclosure rules. Under the Sarbanes-Oxley Act, effective August 29, 2002,
managers are required to report to the SEC within two business days the receipt of option grants
in Form 4 while in the pre-SOX period managers can report grants on the 10th
day of the month
following the grants (Form 4) or within 45 days after the firm’s fiscal year end (Form 5). This
shortened reporting window is expected to significantly increase the transparency of option
grants and reduce the possibility of management strategic behaviors. However, Heron and Lie
(2007, 2009) continue to document the mitigated but persistent abnormal returns around option
grants in the post-SOX period. Once backdating becomes more difficult after the enactment of
SOX, would managers resort to other forms of manipulation such as opportunistic timing of
corporate disclosures around option grants or vise versa? This is an unanswered question. In
addition, since Lie (2005) presented the first evidence on option grant backdating, the SEC and
the Department of Justice have implicated nearly 200 firms (Forelle and Scannell 2006). In
response to the widespread revelation of fraudulent stock option practices, the SEC adopted a set
of new disclosure rules on executive compensation in December 2006. It is unclear how SOX
and the subsequent disclosure regulations affect the interplay of these opportunistic behaviors
related to stock option grants. The issue is of importance to regulators and investors and has
generated growing concerns as to the effectiveness of the regulations.
[Insert Table 1 here]
Table 1 presents the timeline of our sample periods and the three managerial actions related
to option grants that have been identified in the literature. We partition the entire sample period
from January 1996 to December 2008 into three periods: pre-SOX, post-SOX, and post-Scandal.
We highlight the possibility of each opportunistic behavior in each period. We hypothesize that
while backdating is largely eliminated, the other two behaviors remain in the post-SOX and post-

4
Scandal periods. In our main analysis, we conduct three sets of analyses to test this hypothesis.
First, we examine the difference in returns in the 30 trading-day window before and after
scheduled and unscheduled option grants in all three periods. We do not observe a statistically
significant return difference for scheduled option grants. This is consistent with the finding in
Heron and Lie (2007). Following Bebchuk et al. (2009), we identify a set of option grants as
Lucky option grants, which is defined as those options awarded on the day with the lowest stock
price within the grant month. Lucky grants are most likely to be the backdated grants.4 For
Unlucky unscheduled option grants, we find that the asymmetric stock return pattern around
grant dates are persistent in both post-SOX and post-Scandal periods, suggesting that the
opportunistic timing practice still exists.
Second, we examine whether the market asymmetrically responds to several common
corporate events occurring within the quarter of the option grants. These corporate disclosures
include earnings announcements, conference calls, management forecasts, and M&A
announcements. We find that for scheduled option grants the three-day market response to
information events occurring before the grants is the same as the reponse to those events
occurring after the grants in all three periods. In contrast, for Unlucky unscheduled option grants
in the post-SOX period, these corporate events are likely to be bad news (i.e., negative market
response) before grant dates and good news (i.e., positive market response) after grant dates. The
evidence suggests that managers either time option grants in alignment with various news events
or time the news events themselves.
Third, to further explore the timing practice, we compare stock options awarded to CEOs
with those awarded to independent directors. Bebchuk et al. (2009) show that directors also
4 The logic is that it is possible to time the grant date on one of the days with low price but it is highly unlikely that
managers can award a grant exactly on the day with the lowest price.

5
receive Lucky grants, suggesting that backdating is prevalent among director grants. Their study
leads us to ask whether directors could still entrench themselves through the timing practice of
option grants once the backdating practice is no longer viable. We argue that independent
directors have less influence on or control over the timing of corporate disclosures; hence, we
expect that the timing of option grants in alignment with news disclosures is less severe for stock
options awarded to independent directors. The result provides support for our expectation – in
contrast to CEO option grants, for director grants, we find no evidence of bad (good) news
before (after) the grants for director grants.
In additional analysis, we take advantage of a natural setting in quarterly earnings
announcements; namely, some announcement dates are fixed while others are variable. We show
that there exists return differences between the half quarter before and after option grant dates for
both fixed and variable earnings announcements. However, the difference is higher in the
quarters with variable earnings announcements. This result indicates that variability of earnings
announcement dates gives managers more flexibility to engage in the timing practice to their
advantage, which generates stronger abnormal returns than those associated with fixed
announcement dates.
Finally, to further understand the consequence of timing manipulation associated with
option grants, we conduct additional analysis and find that investors can extract information from
option grant signals and earn 5.6% (2.3%) abnormal returns on a portfolio formed and held for
three months following the grants in the post-SOX (post-Scandal) period. We interpret the result
as evidence that opportunistic timing behavior in the post-SOX period has significant economic
consequences. We cautiously interpret the decreasing magnitude in the post-Scandal period as
evidence that increased public scrutiny and transparency during this period have effectively
deterred the opportunities for executive enrichment associated with option grants.

6
Taken together, our findings strongly suggest that both types of timing behaviors –
opportunistic timing of option grants relative to future stock returns and timing of corporate
disclosures around option grants – continue to exist in the post-SOX period. These timing
practices have significant economic consequences and were not mitigated until after the
revelation of the backdating scandal.
This paper makes several contributions to the literature on executive compensation and
corporate disclosures. First, our study adds to our understanding of the managerial incentives for
stock option malpractices and highlights the regulatory effect on these behaviors. While several
recent studies (e.g., Heron and Lie 2007, 2009; Narayanan and Seyhun 2008) conclude that
backdating was mitigated effectively by SOX after 2002, our study is the first to document that
SOX does not seem to have curtailed the opportunities for managers to game the timing of option
grants and corporate disclosures. Second, using the unique setting of fixed and variable earnings
announcement dates, we document that managers time the release of news events related to
unscheduled option grants. Thus, our study complements Aboody and Kasznik (2000) that shows
the timing of corporate voluntary disclosures for scheduled grants. Third, our study also extends
Bebchuk et al. (2009) by documenting that opportunistic timing does not exist for director option
grants. Our result may partially explain why the trough pattern of stock returns around director
grants is much less prevalent than that of CEO option grants. Finally, our results indicate that the
incidence of timing manipulation affects the true inference of the prevalence of backdating both
pre- and post-SOX. Once backdating becomes less likely, managers turn to opportunistic
timing. The effect of opportunistic timing is economically significant.
The remainder of the paper proceeds as follows. Section 2 describes the data and sample.
Sections 3 outlines the research design and presents the primary findings. Section 4 and 5
provide additional analyses. Section 6 concludes.
7
2. Data and Sample Selection
We focus our analysis on CEOs because they have significant influence over firms’ stock
option practices and disclosure policies. We define an individual as a CEO if he or she is
identified as either CEO or President in the Thomson Financial Insider database, which includes
all insider activities filed with the SEC between 1996 and 2008. We extracted earnings
announcement dates and financial information from Standard and Poor’s Compustat and the
information on stock returns from the Center for Research in Securities Prices (CRSP). In
addition, we obtain information on other corporate events from the following databases: First
Call (management forecasts), BestCalls.com (conference calls), SDC (merger and acquisition
announcements), IRRC Directors database (annual board meeting dates). These databases cover
our full sample period except for BestCalls.com, where the data is available from January 1999
to December 2007.
Consistent with Bebchuk et al. (2009), we construct our at-the-money CEO option grants in
the following procedure:
(1) We keep the grants in Thomson Financial Insider Filings database that have a cleanse
indicator of R, H, and C.
(2) For grants with varying vesting or maturity dates, Thomson Financial reports them as
multiple records. We collapse such grants for each CEO that occur on the same day with a
valid exercise price into one grant to reduce the impact of the weight carried by different
vesting schedules.
(3) We eliminate the grants in months where the firms went ex-dividend and require returns to
be available for the entire month of the grant dates.
(4) We also check whether the exercise price of the grant is the same or close enough – i.e.,
where the price difference is less than 1% - to the closing price of the reported grant date, or

8
to the closing price of one day before or after the grant. The date with the nearest closing
price to the exercise price is then defined as the grant date.
Unlike Bebchuk et al. (2009), who exclude scheduled option grants from their sample as they
focus on unscheduled option grants to identify Lucky grants, we investigate both scheduled and
unscheduled grants. Although it is unlikely that firms can opportunistically time scheduled
grants, it is still likely for firms to time information release around scheduled grants. Hence,
keeping both scheduled and unscheduled grants allows us to address both types of timing
behaviors. We define a grant as scheduled if it occurs within a day of the one-year anniversary
of the prior grant or the annual board meeting date, and unscheduled otherwise.5
These screens yield a sample of 24,703 CEO option grants from January 1, 1996 to
December 31, 2008. We further classify this sample into three subsamples: (i) Pre-SOX sample
(13,294 grants) from January 1, 1996 to August 28, 2002; (ii) Post-SOX sample (6,297 grants)
from August 29, 2002 to November 10, 2005; and (iii) Post-Scandal sample (5,113 grants) from
November 11, 2005 to December 31, 2008.
In additional analysis, we also investigate option grant behaviors for independent directors
as a benchmark against those for CEOs. To that end, we apply the same screening procedure
described above to extract the option grants to independent directors, who are identified in the
Thomson Financial database as directors (role code D) and not defined as having any other roles
in the firms.
5 Aboody and Kasznik (2000) categorize a grant as scheduled if it occurs within a one-week anniversary of a prior
grant. Heron and lie (2007, 2009) have detailed discussion of using one-day versus one-week window as the
classification criteria for scheduled and unscheduled grants. Our classification scheme is similar to that employed in
Heron and Lie (2007) that classifies a grant as scheduled if it is dated within one-day of the one-year anniversary of
a prior grant. Besides this scheme, Heron and Lie (2009) also use a second scheme that classifies a grant as
scheduled if it is followed by a grant that is dated within one-day of the one-year anniversary of a prior grant. Thus,
the unscheduled grants classified in our paper might capture some scheduled grants by Heron and Lie’s second
scheme. This would not be a concern since it works against our findings.
9
Table 2 presents the monthly distribution of unscheduled and scheduled CEO option grants
for the three subsample periods. In general, the frequency of grants at the beginning of the
calendar year is greater than that in the rest of the year. There is no significant difference
between award time of unscheduled and scheduled grants except that scheduled grants also
appear to be frequent in May, following the usual annual board meeting time. We do not find any
significant changes in the distributions over the three sample periods. However, the percentage
of scheduled option grants increases over time, calculated as 8.8%, 11.3%, and 12.3% in the pre-
SOX, post-SOX, and post-Scandal periods, respectively.
[Insert Table 2 Here]
3. Empirical Analysis
Prior studies document three explanations for the abnormal stock return patterns around
CEO option grants: (1) the opportunistic timing of option grants (Yermack 1997), (2) the
opportunistic timing of corporate news disclosures (Aboody and Kasznik 2000), and (3) the
backdating of option grants (Lie 2005; Narayanan and Seyhun 2008). Heron and Lie (2007)
conclude that the new two-day filing requirement under SOX has effectively curtailed option
backdating. However, their study does not explicitly isolate backdating from other forms of grant
manipulation; it is, therefore, difficult to assess whether managers continue to exercise their
discretion and influence to strategically grant stock options after SOX. We attempt to provide
insights into these issues. We begin by investigating stock returns around scheduled and
unscheduled option grants in Section 3.1. We separate Lucky and Unlucky option grants in an
attempt to examine to what extent the three types of opportunistic behaviors are affected by
regulatory changes across the sample period. In Section 3.2, we examine managerial choices of
timing important corporate news events such as earnings announcements, conference calls,
management forecasts, and merger and acquisition (M&As) announcements. This analysis rests
10
on the assumption that managers have inside information about the nature (i.e., good or bad
news) of these events and thus can game the timing of the news release or/and option grants.6
Finally, in Section 3.3, we extend our analysis to option grants to independent directors. Bebchuk
et al. (2009) identify an association between backdated option grants to directors and those to
CEOs, suggesting that these directors indeed benefit from firms’ backdating practice. A natural
question to ask is: Do independent directors benefit from alternative timing – timing
(unscheduled) grants relative to news disclosures, timing disclosures around option grants, or
both? The answer to this question adds to our understanding of the circumstances under which
each type of opportunistic behavior is more likely to occur. Although directors generally have
inside information on the nature of the news events, they may have less control over the precise
timing of news release. Thus, we argue that lacking foreknowledge of such timing makes it
difficult for directors to time their option grants to align with news disclosure, much less timing
the disclosure itself around option grants.
3.1 Tests on Stock Returns around Option Grants
The purpose of the stock return test is to document whether the trough pattern of stock
returns around grant date exists and persists in the post-SOX and post-Scandal periods. The
analysis is applied to Lucky and Unlucky, scheduled and unscheduled groups separately because
the abnormal return pattern around the grant date, if any, could be driven by different forces for
different grants. First of all, for scheduled option grants, neither backdating nor opportunistic
timing of option grants is likely to occur, and any Lucky scheduled grant is simply a result of
random selection. Second, for Unlucky scheduled grants, the abnormal pattern of stock returns
around the grant date can be attributed to the opportunistic timing of news disclosures. Third, for
unscheduled option grants, all three explanations for the abnormal return pattern could be
6 For M&A events, we only consider those firms who are the acquirers.

11
possible in the pre-SOX period; whereas in the post-SOX and post-Scandal periods, backdating
is largely eliminated and hence only the two timing explanations are possible. Table 1 presents
the details of the possibility of each opportunistic behavior under different scenarios. The four
cells in the bottom right corner – the overlap of the last two columns and last two rows – are the
focus of our analysis.
[Insert Table 3 here]
Table 3 presents the results. We calculate the cumulative abnormal returns for the window
of 30 trading days before and after the option grant date. The abnormal returns are the difference
between raw returns and value-weighted market returns. In the absence of backdating or
opportunistic timing of option grants and news disclosures, there should be no statistical
difference between the cumulative abnormal returns in the window from day -30 to day -1,
CAR(-30, -1), and those in the window from day 1 to day 30, CAR(1, 30), where day 0 is the
option grant date.7 We find that the number of Lucky scheduled option grants is very small,
accounting for only about 4.9-6.8% of scheduled grants. This percentage range is close to 4.5%,
the random probability of a grant being lucky assuming 22 trading days in a month. Given the
definition of Lucky scheduled option grants, it is not surprising to observe negative (positive)
abnormal returns before (after) this type of grant. However, for Unlucky scheduled option grants,
we find no difference between CAR (1, 30) and CAR(-30,-1) in all three sample periods. This
finding indicates that the timing of corporate news events is not significant for scheduled grants
in our sample period, which is consistent with the assertion in Heron and Lie (2007) that once
scheduled option grants are redefined as one day instead of one week before or after the grant in
7 Heron and Lie (2009) calculate the difference using raw returns. Under the assumption that the difference should
be centered on zero, they are able to infer the fraction of option grants that are backdated or manipulated. We use the
difference in CAR to further take care of the effect of return seasonality— for example, the January effect. This
control is important because February is the month with the largest number of option grants. We also exclude day 0,
the option grant date, in return comparison. All results are robust when we replace day (-30,-1) with day (-29, 0).

12
the prior year, the abnormal returns largely disappear. This conclusion is further supported by
our test based on the timing of corporate news events in the next subsection 3.2.
The results for unscheduled grants, shown in the last three columns of Table 3, reveal
several interesting patterns. First, the percentage of Lucky unscheduled grants decreases
monotonically from 11.5% pre-SOX to 5.1% post-Scandal. Second, the difference between CAR
(1, 30) and CAR (-30,-1) in all three sample periods is significant for Unlucky grants, although
the magnitude decreases from 6.78% pre-SOX to 1.50% post-Scandal. This finding suggests that
the trough pattern of stock returns is most prevalent before SOX, possibly driven by all three
types of timing games. Under the tightened reporting requirement of SOX, backdating is
presumed to largely disappear, especially after the revelation of backdating practice, the
subsequent investigations launched by the SEC and the U.S. Justice Department, and the
introduction of new disclosure rules. Hence, we can attribute the significant difference in returns
in the post-Scandal period to opportunistic timing of either option grants or corporate events.
In summary, our evidence confirms prior findings which show that SOX regulation curbs
the opportunity for backdating. However, more importantly, it also suggests that, after SOX,
executives are still tempted to manipulate the timing of either grant dates or corporate disclosures
associated with the unscheduled option grants.
3.2. Timing of Option Grants and Corporate News Events
A necessary condition for the opportunistic timing hypothesis is that bad news usually
precedes option grants and/or good news follows option grants. In this subsection, we investigate
how CEOs strategically align the option grant date with announcements of several corporate
events that are shown to have affected stock returns and are available in public databases (Ecker,
Francis, Olsson, and Schipper 2006). These events include: (1) earnings announcements, (2)
conference calls, (3) management forecasts, and (4) mergers & acquisitions (M&A).
13
Specifically, we examine whether firms grant options before (after) good (bad) news. We use
three-day cumulative abnormal returns (denoted as CAR3d) around the event dates to classify
whether a specific event is good or bad news. We conjecture that if firms time option grants
strategically to increase potential option value, the likelihood of observing good news (positive
CAR3d) after the option grants would be higher than that before the grants. Thus, the CAR3d for
the events in the half quarter after the option grants is expected to be higher than that in the half
quarter before option grants. We examine the above prediction for each type of corporate events.
[Insert Table 4 here]
Panel A of Table 4 presents the difference in CAR3d between the two windows. The finding
for scheduled grants is straight forward – the market responses to various news events disclosed
in the half quarter after option grants are not significantly stronger than those disclosed before
option grants; except for M&A announcements in the post-SOX period, which is significant at
0.1 level.8 Given that it is unlikely for firms to manipulate grant dates (through either backdating
or timing) for scheduled option grants, the no difference result supports the assertion that in the
sample period we examine from 1996 to 2008, the timing of corporate news events is not
significant for scheduled grants, consistent with the finding in Heron and Lie (2007).
In contrast, we find strong evidence of such opportunistic behavior for unscheduled grants.
The last three columns of Table 4, Panel A show that, in both pre-SOX and post-SOX periods,
the news disclosed is negative in the half quarter before option grant dates and positive
afterward,9 with the difference in CAR3d being significantly positive for all four events. Note
that this difference becomes indistinguishable from zero in the post-Scandal period, except for
conference calls which is still marginally significant. The collective evidence from unscheduled
8 Although the difference is significant for conference calls in the pre-SOX period and management forecasts in the
post-Scandal period, the sign is opposite to that predicted. 9 Except for CAR3d for M&A in the post-SOX period which is 0.57% (statistically indifferent from zero).

14
grants suggest that firms time option grants in response to important corporate events in a
strategic manner in both the pre- and post-SOX periods. The results are, thus, consistent with our
view that SOX regulations do not curtail the strategic timing of option grants or timing of news
events.
In theory, under the SEC’s rule of two-day filing requirement introduced in SOX, it is
almost impossible to backdate option grants for such a short look-back period. However, Heron
and Lie (2007) and Narayanan and Seyhun (2008) find some evidence that that it took more than
two business days for some firms to file their option grants with the SEC. They suggest that
backdating may continue in the post-SOX period among some firms.10
To further explore the
regulatory effect on firms’ grant behavior, we separate unscheduled option grants into Lucky and
Unlucky grant groups and test whether the pattern we observe in Panel A of Table 4 is persistent
after excluding those Lucky grants from unscheduled grants. Based on Bebchuk et al.’s
argument, excluding Lucky grants should largely rule out the possibility of backdating. An
immediate implication for our analysis is that, if the difference in market response to news events
is still significant for Unlucky unscheduled grants, it should be produced by timing behaviors.
Panel B of Table 4 presents our analysis. Indeed, the last three columns show that the differential
market responses persist among Unlucky unscheduled option grants for both the pre- and post-
SOX periods, supporting the timing hypothesis. Interestingly, for Lucky unscheduled option
grants, the pattern extends even into the post-Scandal period. The evidence suggests that, for a
small number of option grants falling into the days with the lowest stock price within a month,
the timing of grants or information events emerge. The pattern is robust across all three sample
periods, but the number of such grants decreases.
10
While Narayanan and Seyhun (2008) suggest that almost all dating games will lead to a reporting lag, they also
recognize that the strategic timing mechanism can potentially generate the link between the reporting lag and the
trough pattern of stock returns around grant dates post-SOX.
15
3.3. Option Grants to Independent Directors
The opportunistic timing hypothesis requires that option grant recipients have significant
influence and control over when to release corporate news, which will then enable them to time
the information release relative to option grants, or to align the grants with information release.
To the extent that independent directors are outsiders of the firm, they do not exercise control
over operating activities such as news releases. Thus, we expect that it is less likely to find
evidence in supporting timing hypothesis for the grants awarded to independent directors. As a
benchmark analysis, we analyze independent director grants in this subsection to contrast those
with CEO grants in Section 3.2.
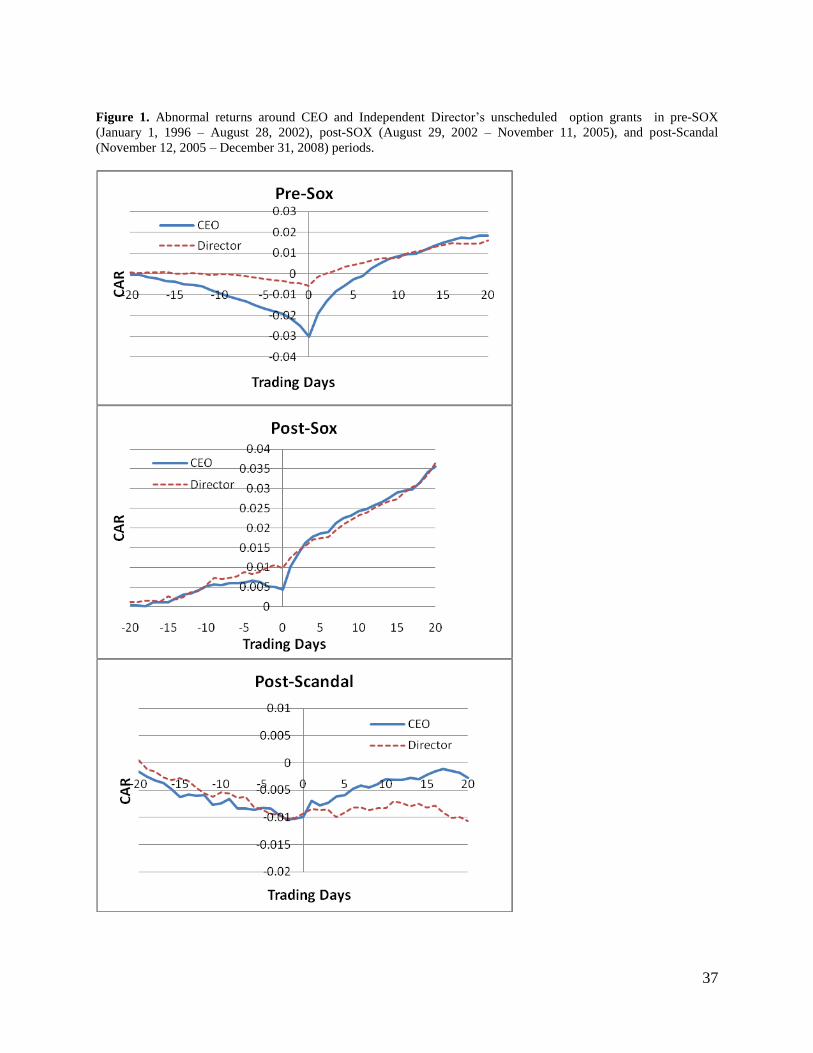
[Insert Figure 1 here]
Figure 1 presents the cumulative abnormal returns in the month before and after grant
dates for unscheduled option grants. Visual examination indicates the evidence is largely
consistent with our expectations: in the pre-SOX period, the trough pattern for CEO is stronger
than that for directors; in the post-SOX period, the dip is still observable for CEO grants but is
no longer observable for director grants; in the post-Scandal period, the returns following CEO
grants show an upward trend while the returns following director grants remain flat.
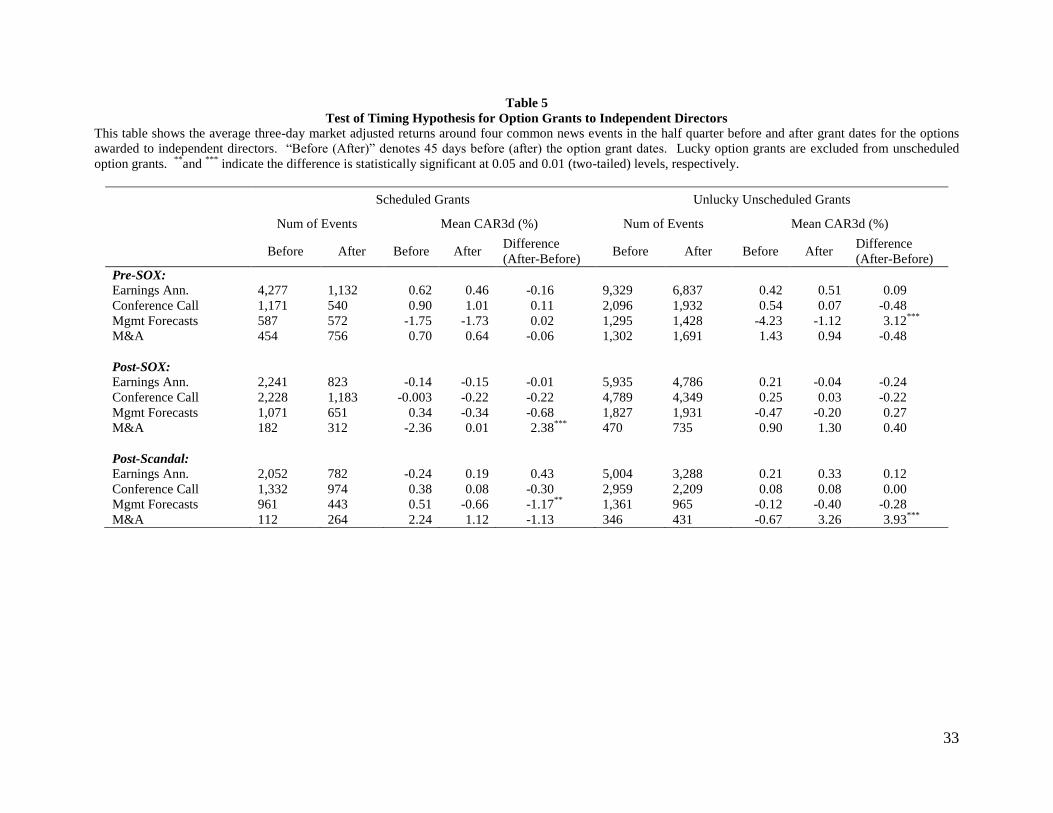
[Insert Table 5 here]
To gain additional insight, we repeat our analysis described in Section 3.2 for director
grants. Table 5 presents the results. The first five columns report the results for scheduled option
grants. Consistent with the results from scheduled option grants for CEOs, we do not find
supporting evidence that the disclosures preceding (following) scheduled grants contain bad
(good) news. Of 12 event-periods, only two show the significant difference in CAR3d, including
the one with negative difference (-1.17%). The last column of Table 5 provides evidence
consistent with our expectations for Unlucky unscheduled grants – that is, timing behaviors do

16
not exist for option grants to independent directors. The difference in CAR3d is significant only
for management forecasts in the pre-SOX and for M&A in the post-Scandal period. This finding
is in contrast to the results presented in the last column of Panel B of Table 4, which shows that,
for all eight event periods in the pre- and post-SOX periods, there is a significant difference in
CAR3d.
In sum, our analysis has thus far suggested that, in the pre- and post-SOX periods, timing
practice with respect to option grants or corporate events is prevalent for unscheduled grants to
CEOs but cannot be identified for unscheduled grants to independent directors. Thus, our
findings extend those in Bebchuk et al. (2009) that backdating exists for both groups.
4. Additional Tests
The analysis in the preceding section documents that (i) there is no obvious evidence
supporting the behavior of timing corporate events for scheduled option grants in all three
periods; and (ii) timing of option grants or corporate events exists among unscheduled option
grants in the post-SOX period but largely weakened in the post-Scandal period. However, our
analyses thus far do not distinguish the timing of option grants from the timing of corporate
events. Our next step is to conduct two further analyses on unscheduled CEO option grants to
shed light on which type of timing is more likely to occur in our sample period. In Section 4.1,
we use the feature of fixed versus variable earnings announcement dates to further distinguish
the timing of information events from the timing of option grants. In Section 4.2, we examine
the relation between backdating and opportunistic timing in a multivariate regression model that
controls for variables associated with the likelihood of backdating.
4.1. Earnings Announcement Based Tests for Unscheduled Option Grants
In order to distinguish the timing of option grants from the timing of information events,
we need to identify a setting where the announcement time of information events is fixed

17
(scheduled). For these fixed-date events, we believe that the opportunistic timing of news
disclosure is eliminated; hence, executives can only time the option grants to align with news
disclosures. In contrast, for events whose announcement date is variable, it may be appealing for
executives to engage in both types of timing to their advantage. Prior studies show that
management would manage earnings around option grants (e.g., Aboody and Kasznik 2000,
McAnally, Srivastava, and Weaver 2008, Baker, Collins, and Reitenga 2009). We investigate
quarterly earnings announcement because it is a mandatory corporate event and for many firms
the announcement date is fixed (Bagnoli, Kross, and Watts 2002). We are thus able to use this
feature to categorize firms’ earnings announcements into two groups - fixed versus variable
earnings announcements. Fixed earnings announcements are defined as those announcements
made within one week (3 days before and after) of the same quarter in the prior year. Based on
our argument, the test for fixed earnings announcement date will enable us to identify the timing
of option grants, whereas the test for variable earnings announcement is a joint test of the timing
of grants and corporate disclosures.
[Insert Table 6 here]
We match each unscheduled option grant with the closest quarterly earnings
announcement (either fixed or variable) and examine the difference between CAR (-30,-1) and
CAR (1, 30), where day 0 is the option grant date. Panel A of Table 6 presents the results.
Several observations are note worthy. Although for both types of earnings announcements in all
three periods the difference between CAR (-30,-1) and CAR (1, 30) is statistically significant,
there are significant differences across different groups and over time. The difference is the
largest in the pre-SOX period, with 7.8% and 10.50% for the quarters with fixed and variable
earnings announcements, respectively. For the quarters with variable earnings announcement,
executives can strategically time earnings announcements to accommodate the option grant or

18
simply backdate the grants; hence it is not surprising that the difference in CAR is 2.7% higher
than that in the quarters with fixed earnings announcements. This pattern persists in the post-
SOX and post-Scandal periods - the difference in CAR between fixed and variable earnings
announcement quarters is 1.55% and 2.62% in the post-SOX and post-Scandal period,
respectively. In these two periods, particularly the latter, backdating is highly unlikely. Thus, the
difference is CAR for fixed earnings announcements is primarily driven by the timing of option
grants, while the difference in CAR for variable earnings announcements is jointly driven by the
timing of option grants and earnings announcements.11
In sum, the evidence presented in Panel A of Table 6 suggests that: first, the timing of
option grants and the timing of corporate events jointly exist among unscheduled CEO option
grants; second, these practices persist in the post-Scandal period; and finally, these practices are
more prevalent when event dates for corporate disclosure are variable.
We further explore whether the market responses to earnings announcements before and
after option grants are different. Panel B of Table 6 shows that there is a significant difference in
CAR3d in the pre-SOX period for both fixed and variable earnings announcements. However,
the difference disappears in the post-SOX period but again shows up in post-Scandal period for
fixed earnings announcements (0.83%). While it is premature to conclude that the timing of
option grants dominates in the post-Scandal period, the evidence is at least consistent with
previous findings that the timing hypothesis persists after backdating is eliminated.
4.2. Multivariate Analysis of Lucky Grants
Following Bubchuk et al. (2009), we use an important assumption; namely, that Lucky
grants proxy for backdated grants in our main tests. In this subsection, we conduct multivariate
11
Using the post-Scandal period as the example, 1.03% is the effect of timing of option grants which is significant
by itself, while 3.65% is the joint effect of timing of option grants and timing of the earnings announcements.

19
analysis to seek further support for this assumption. In particular, we are interested in testing
whether Lucky grants are associated with several factors that are known to be associated with
option backdating or repricing documented in prior literature (e.g., Carter and Lynch 2001;
Walker 2006; Bebchuk et al. 2009). Furthermore, we examine the relation between Lucky grants
and information events within the three sample periods. We estimate the following logistic
regression model for each period:
FixedEAWSJfirmsVolatilityFirmSizeSchedulesLuckyGrant543210
AMstsMgmtForecaCallConference &876 , (2)
where LuckyGrants = indicator variable, ―1‖ for option grants awarded on the day with the
lowest stock price within the month, and ―0‖ otherwise.
Schedule = indicator variable, ―1‖ if the option is awarded within one day of the anniversary date
of the prior year’s grant date or within one day of annual board meeting date, and ―0‖ otherwise.
FirmSize = firm’s market value at the option grant date.
Volatility = historical volatility of stock returns within the year preceding the option grant date.
WSJfirms = indicator variable, ―1‖ if a firm is among the 136 firms reported on the Wall Street
Journal Website that were implicated by the SEC or the Department of Justice for backdating
practice, and ―0‖ otherwise.12
FixedEA = indicator variable, ―1‖ if earnings announcement is made within three day before or
after the anniversary date of the same quarter of the prior year, and ―0‖ otherwise.
ConferenceCall, MgmtForecasts, and M&A = the number of conference calls, management
forecasts, and M&A announcements, respectively, in the half quarter before and after option
grant dates.
12
See the ―Perfect Payday: Option Scorecard‖ at www.wsj.com for the list of affected companies.
20
If Lucky grants dummy is an effective proxy for backdated grants, based on the prior
literature we make the following predictions on the signs of the coefficients: First, we expect the
coefficient for SCHEDULE to be negative because the scheduled grants are less likely to be
backdated. Second, a negative coefficient on FirmSize and a positive coefficient on Volatility are
consistent with the prior findings that backdating is more likely to occur in smaller and more
volatile firms. Third, a significantly positive coefficient for WSJ firms is expected. These firms
have been caught for backdating and hence are more likely to be associated with Lucky grants
dummy. We include FixedEA variable to control for the effect of fixed earnings announcements,
but we do not have a clear prediction for the sign on this variable.
We also include three voluntary disclosure events in the regressions: Conference Call, Mgmt
forecasts, and M&A.13
If the Lucky grants dummy is an effective proxy for backdated grants, we
would expect an insignificant relation between Lucky grants and these information events. In
particular, when the opportunities for backdating are significantly reduced and firms resort
instead to the timing manipulation via grants dates or information events, option grant dates
should be less likely to systematically fall into the days with the lowest stock prices.
[Insert Table 7 here]
Table 7 highlights the predictions (column 2) and presents the results from the logistic
regression. In the pre-SOX period, the results are consistent with all the predictions. In the post-
SOX period, Schedule and FirmSize variables are no longer significant, but Volatility and WSJ
firms variables remain significant. The significant WSJ firms variable is consistent with the
argument in Heron and Lie (2007) and Narayanan and Seyhun (2008) that backdating was
mitigated but was not completely eliminated after SOX. However, this variable is no longer
13
Earnings announcement is not included because it is a mandatory event, i.e., each firm has to announce earnings
once each quarter.

21
significant in the post-Scandal period, supporting the view that backdating was eliminated due to
the public revelation of the scandal and the implementation of new compensation disclosure
rules. In the post-Scandal period, Schedule is marginally significant. Volatility is significant but
in opposite sign, suggesting that option grants are less likely to fall into the days with the lowest
stock price for high volatility firms.
Turning to the three voluntary disclosure events and examining the association of these
events with Lucky grants, we find several interesting patterns. More specifically, the coefficient
on Conference Call is significantly negative across all three sample periods, suggesting that
option grants are unlikely to fall into the days with the lowest stock price in the presence of
conference calls within the quarter. With regard to the coefficients of Mgmt forecasts and M&A,
both of them are significantly positive in the pre-SOX period, suggesting that executives may
have backdated their options to a date that coincided with the announcements of management
forecasts and M&A events. Interestingly, the coefficients of Mgmt forecasts and M&A became
insignificant in the post-SOX period and significantly negative in the post-Scandal period,
suggesting that, when there is no or little room for backdating, option grants are less likely to fall
into the days with the lowest stock prices in the presence of management forecasts and M&A
announcements within the quarter.
Overall, the evidence presented in this subsection gives us further support that the Lucky
grants dummy variable used in this paper effectively captures option grants that are attributed to
backdating. Hence, the separation of Lucky and Unlucky grants provides us a reasonable
benchmark to distinguish the backdating hypothesis from the timing hypothesis.
5. Economic Impact of Option Grant Signals
While we have demonstrated that the opportunistic timing of option grants or corporate
disclosures persists in the post-SOX period, an important question remains: Does the
22
opportunistic timing have any significant economic consequence?14
To answer the question, we
examine whether investors could earn abnormal returns had they learned about the option grants.
In the pre-SOX period, executives receiving option grants could report to the SEC in either Form
4, which was due on the 10th
day of the month following the grants, or Form 5, which was not
due until 45 days after the firm’s fiscal year end. With such a long reporting window, it would be
difficult for investors to use the grant dates to make abnormal profit. However, the new two-day
filing rule under SOX allows investors to learn about the option grants in a timely manner.
Consequently, the timing of option grants may signal abnormally high stock returns in the period
subsequent to the date of option grants or the date of SEC filing. We test whether investors can
earn a significant alpha from a portfolio formed on option grant signals after controlling for
Fama-French three factors (Fama and French 1992) and Carhart momentum factor (Carhart
1997). To reduce the dilution effect of scheduled option grants, we focus on unscheduled
grants.15
Two portfolios are formed - one is formed on the day following the grants and the other
formed on the next day of the SEC filings. This separation is motivated by the fact that investors
only learn about the grants after insiders file the transactions to the SEC. There may be abnormal
returns between option grant dates and the SEC filing dates, particularly for those grants
violating the 2-day SEC filing rule. Both portfolios are held for three months.
[Insert Table 8 here]
Table 8 presents the results from the calendar-time Fama-French-Carhart four-factor
regressions. For the portfolio formed after the option grant dates, the alpha (daily abnormal
returns) is significantly positive at 9.4 and 3.8 basis points, respectively, in the post-SOX and
14
Bebchuk et al. (2009) examine the economic significance from the CEO’s perspective. They find that the gain to
CEOs from lucky grants due to opportunistic timing exceeded on average 20% of the reported value of the grant,
and increased the CEO’s total reported compensation for the year by more than 10% on average. 15
Unreported analysis indicates the alpha is insignificant for scheduled grants in both post-SOX and post-Scandal
periods,

23
post-Scandal periods. In other words, investors can earn approximately 5.6% and 2.3% abnormal
returns within three months following the option grants in the two periods. The signs for other
factors are as expected. However, for the portfolio formed and held for three months starting the
day following the SEC filing, the alpha is no longer significant. The difference in alpha between
the two portfolios held for different windows suggests that, in the short period between the
option grant date and the SEC filing date, there are significant abnormal returns. Thus, our
finding complements the analyses in Heron and Lie (2007) and Narayanan and Seyhun (2008)
which show that a few firms violate the two-day filing rule due to the practice of backdating or
opportunistic timing.
Since Lie (2005) presented the first evidence on option grant backdating, the SEC and the
Department of Justice had implicated 136 firms as of December 2006. Hundreds of articles on
the backdating scandal have appeared in the media. The SEC eventually adopted new disclosure
rules for executive compensation. More specifically, the new rules pertaining to option grants
require companies to disclose the following: (1) the grant date fair value under the Statement of
Financial Accounting Standard No. 123 R (SFAS 123R); (2) the SFAS 123R grant date; (3) the
closing market price on the grant date if it is greater than the exercise price of the option; (4) the
date the compensation committee or full board of directors took action to grant the option if that
date is different than the grant date; and (5) a complete quantitative and narrative disclosure of a
company’s executive compensation plans and goals.16
No evidence of significant alpha in the post-Scandal period suggests that, indeed, the timing
of option grants is greatly mitigated or largely eliminated in the post-Scandal period. From the
results displayed in Panel B of Table 8, we infer that investors can no longer profit from option
grants after the scandal and the introduction of new disclosure rules. We interpret these results,
16
For details of the final rule, see the SEC’s website at http://www.sec.gov/rules/final/2006/33-8732a.pdf.

24
together with the findings in previous sections, as evidence that increased transparency and
public scrutiny following the scandal and the new disclosure rules curb executives’ willingness
to engage in these opportunistic behaviors.
6. Concluding Remarks
Prior studies attribute the asymmetric trough patterns of stock returns around option grant
dates to three types of managerial behaviors: (1) opportunistic timing of option grants relative to
future anticipated stock returns, (2) opportunistic timing of corporate disclosures around option
grants, and (3) backdating of option grant dates. Our study supports the assertion that SOX has
curtailed option backdating. More importantly, we present the first direct evidence that the
opportunistic timing of option grants and corporate disclosures continue to take place even under
the new regulatory rules of SOX up until the revelation of the backdating scandal in November
2005 and the new compensation disclosure rules in 2006. Our results are consistent with the
argument that once the opportunity for backdating is greatly diminished, opportunistic timing
becomes more attractive and serves as an alternative device for executives to manipulate the
market expectations around grant dates via news disclosures. While Bebchuk et al. (2009) focus
on backdating and identify a set of Lucky unscheduled grants resulting from backdating, we
focus on the timing explanations. Our analysis has established that the timing of option grants
and the timing of information events persist not only after SOX but also after the revelation of
the scandal. This makes our study unique among other recent studies that attribute the pattern of
stock returns around option grant dates post-SOX to the option grant dating game. We find no
opportunistic timing for scheduled option grants in our sample period, but both types of timing
exist for unscheduled option grants.

25
Our study contributes to the executive compensation literature by providing new evidence
on how CEOs strategically behave to increase personal gains from their stock option
compensation. While we do not directly investigate to what extent these manipulation activities
destroy shareholder value, our findings suggest that investors could have earned abnormal
returns by holding the portfolio for three months following option grants in the post-SOX period.
We contribute also to the disclosure literature by highlighting the effect of regulatory restrictions
on corporate disclosure behavior and executive stock option practice. Our findings suggest that
SOX cannot stop executives from strategically reporting bad news before the option grant date
and good news afterward. However, the timing manipulation has recently been mitigated by the
increased public scrutiny and new compensation disclosure rules.
A caveat of our analysis for the post-backdating-scandal period is that the effect of new
disclosure rules may be confounded by corporate climate change resulting from the backdating
scandal. While we caution our readers that whether this effect is temporary or permanent
warrants further attention, we conclude that the new disclosures rules, combined with the
tightened public scrutiny, have achieved what SOX regulations did not achieve in terms of
discouraging top management’s opportunistic timing behaviors.

26
References
Aboody, D., and R. Kasznik, 2000. CEO stock option awards and the timing of corporate
voluntary disclosures. Journal of Accounting and Economics 29: 73–100.
Bagnoli, M., W. Kross, and S. Watts, 2002. The information in management’s expected earnings
report date: A day late, a penny short. Journal of Accounting Research 40: 1275-1296.
Baker, T., D. Collins, A. Reitenga, 2009. Incentives and opportunities to manage earnings
around option grants. Contemporary Accounting Research 26: 649-72.
Bebchuk, L., Y. Grinstein, and U. Peyer. 2009. Lucky CEOs and lucky directors. Journal of
Finance, forthcoming.
Bernile, G., and G. Jarrell. 2009. The impact of the options backdating scandal on shareholders.
Journal of Accounting and Economics 47: 2–26.
Bizjak, J., M. Lemmon, and R. Whitby. 2009. Option backdating and board interlocks. Review of
Financial Studies, 22: 4821-4847.
Carhart, M., 1997. On persistence in mutual fund performance, Journal of Finance 52: 57–82.
Carter, M., L., Lynch, 2001. An examination of executive stock option repricing. Journal of
Financial Economics 61: 207-225.
Chauvin, K., and C. Shenoy. 2001. Stock price decreases prior to executive stock option grants.
Journal of Corporate Finance 7: 53-76.
Cheng, X, A. Crabtree, and D. Smith. 2008. The effects of backdating on earnings response
coefficients. Working paper, University of Nebraska-Lincoln.
Cicero, D. 2006. Timing and backdating of executive stock option exercises— Before and after
the Sarbanes-Oxley Act. Working paper, University of Georgia.
Collins, D., G. Gong, and H. Li. 2009. Corporate governance and backdating of executive stock
options. Contemporary Accounting Research 26: 403–445.
Dhaliwal, D., M. Erickson, and S. Heitzman. 2009. Taxes and the backdating of stock option
exercise dates. Journal of Accounting and Economics 47: 27-49.
Ecker, F., J. Francis, P. Olsson, and K. Schipper, 2006. The effect of the amount and
configuration of news on inferences about firm-specific events. Working paper, Duke
University.
Fama, E., and K. French, 1992. The cross-section of expected stock returns. Journal of Finance
47: 427–465. .

27
Forelle, C., and J. Bandler. 2006. The perfect payday—Some CEOs reap millions by landing
stock options when they are most valuable; Luck—Or something else?‖ Wall Street Journal,
March 18, A1.
Forelle, C., and K. Scannell. 2006. Revisiting executive-pay law. Wall Street Journal, September
6, C1.
Heron R., and E. Lie. 2007. Does backdating explain the stock price pattern around executive
stock option grants? Journal of Financial Economics 83: 271–295.
Heron R., and E. Lie. 2009. What fraction of stock option grants to top executives have been
backdated or manipulated? Management Science 55: 513–525.
Lie, E. 2005. On the timing of CEO stock option awards. Management Science 51: 802–812.
Maremont, M. 2005. Authorities probe improper backdating of options—Practice allows
executives to bolster their stock gains: A highly beneficial pattern. Wall Street Journal,
November 11, A1.
McAnally, M., A. Srivastava, and C. Weaver, 2008. Executive stock options, missed earnings
targets, and earnings management. The Accounting Review 83: 185-216.
Narayanan, M., C. Schipani, and H. Seyhun. 2007. The economic impact of backdating of
executive stock options. Michigan Law Review 105: 1597–1641.
Narayanan, M., and H. Seyhun. 2008. The dating game: Do managers designate option grant
dates to increase their compensation? Review of Financial Studies 21:1907–1945.
Stecklow, S. 2006. Option study becomes required reading. Wall Street Journal, May 30, B1.
Walker, D. 2006. Some observations on the stock options backdating scandal of 2006. Working
paper, Boston University.
Yermack, D., 1997. Good timing: CEO stock option awards and company news announcements.
The Journal of Finance 52, 449–475.

28
TABLE 1
Timeline of Option Grant Events and Possible Managerial
Actions Identified in the Literature
Thomson Financial
database starts on
Jan. 1, 1996).
SOX became
effective on Aug.
29, 2002.
Wall Street Journal
published the first
article on backdating
on Nov. 11, 2005.
Sample period ends on
Dec 31, 2008. ( New
disclosure rules were
adopted in Dec. 2006)
Time
Pre-Sox
Post-Sox
Post-Scandal
Backdating
Lie (2005)
Heron and Lie
(2007)
Nanayanan and
Seyhun (2008)
Heron and Lie (2007;
2009)
Theoretically
infeasible due to
media attention and
new regulations
Timing of option
grants
Yermack (1997)
Possible
Possible
Timing of news
disclosures
Aboody and
Kasznik (2000)
Possible
Possible

29
TABLE 2
Monthly Distribution of CEO Option Grants
Panel A. Unscheduled option grants
Pre-SOX Post-SOX Post Scandal
Number % total Number % total Number % total
January 1,404 13.8 427 10.8 264 8.7
February 1,231 16.1 506 12.8 504 16.5
March 850 9.7 391 9.9 356 11.7
April 897 8.6 279 7.0 201 6.6
May 839 8.7 313 7.9 245 8.0
June 655 5.6 249 6.3 205 6.7
July 803 7.5 293 7.4 170 5.6
August 668 5.2 264 6.7 227 7.4
September 482 4.5 269 6.8 135 4.4
October 792 6.4 316 8.0 165 5.4
November 729 5.7 293 7.4 215 7.0
December 1,011 8.4 361 9.1 365 12.0
Total 10,361 100 3,961 100 3,052 100
Panel B: Scheduled option grants
Pre-SOX Post-SOX Post Scandal
Number % total Number % total Number % total
January 156 15.6 85 16.8 58 13.1
February 103 10.3 82 16.2 70 15.8
March 57 5.7 46 9.1 54 12.2
April 145 14.5 40 7.9 26 5.9
May 180 17.9 63 12.5 52 11.7
June 53 5.3 13 2.6 23 5.2
July 48 4.8 33 6.5 17 3.8
August 31 3.1 21 4.2 28 6.3
September 37 3.7 27 5.3 15 3.4
October 55 5.5 28 5.5 24 5.4
November 65 6.5 18 3.6 33 7.4
December 73 7.3 50 9.9 44 9.9
Total 1,003 100 506 100 444 100

30
TABLE 3
Cumulative Abnormal Returns around Option Grant Dates
The table shows the cumulative abnormal returns around option grant dates for scheduled and unscheduled grants in
the three periods, pre-SOX, post-SOX, and Post-Scandal. For each period, grants are further categorized as Lucky
and Unlucky grants. Grants are defined as Lucky if they are awarded on the date with the lowest stock price within
the month, and Unlucky otherwise. CAR(-30,-1) and CAR(1,30) are the cumulative abnormal returns in the 30-
trading-day window before and after option grant date, respectively, where day 0 is the grant date. Abnormal returns
(in percentage) are calculated as the difference between raw returns and value-weighted market returns. Scheduled
option grants are those granted either within one day of the one-year anniversary of prior grants or within one day of
annual board meeting date (Heron and Lie 2007; Bebchuk et al. 2009). **
, and ***
indicate that the difference is
statistically significant at 0.05 and 0.01 (two-tailed) levels, respectively.
Scheduled Unscheduled
# of
Grants
%
CAR
(-30,-1)
CAR
(1,30)
Difference # of
Grants
%
CAR
(-30,-1)
CAR
(1,30)
Difference
Pre-SOX:
Lucky 84 6.8% 2.42 8.70 6.28** 1,384 11.5% -8.47 21.27 29.75***
Unlucky 1,151 93.2% 1.10 0.94 -0.15 10,648 88.5% -2.52 4.27 6.78***
Post-SOX:
Lucky 38 4.9% -2.44 6.32 8.76*** 391 7.1% -2.61 14.78 17.27***
Unlucky 731 95.1% 1.34 1.19 -0.13 5,128 92.9% 1.16 3.03 1.87***
Post-Scandal:
Lucky 40 5.5% -3.04 7.36 10.39*** 224 5.1% -6.07 8.82 14.89***
Unlucky 687 94.5% 0.44 -0.59 -1.03 4,146 94.9% -1.00 0.51 1.50***

31
TABLE 4
Test of Timing of News Events or Option Grants
This table shows the average three-day market adjusted returns around four common news events in the half quarter before and after option grant dates. ―Before
(After)‖ denotes 45 days before (after) the option grant dates. Panel A presents the results for scheduled and unscheduled option grants, respectively. Panel B
presents the results from separating lucky unscheduled grants from unlucky unscheduled grants. *,
**, and
*** indicate the difference is statistically significant at
0.1, 0.05, and 0.01 (two-tailed) levels, respectively.
Panel A: Full Sample (Scheduled + Unscheduled)
Scheduled Option Grants Unscheduled Option Grants
Num of Events Mean CAR3d (%) Num of Events Mean CAR3d (%)
Before After Before After Difference
(After-Before) Before After Before After
Difference
(After-Before)
Pre-SOX:
Earnings Ann. 666 337 0.50 1.34 0.84 5,152 4,978 -0.34 1.65 1.99***
Conference Call 211 142 1.74 0.05 -1.69* 1,505 1,524 -1.36 1.54 2.90
***
Mgmt Forecasts 237 148 -0.83 -0.54 0.29 1,603 1,369 -5.16 0.80 5.95***
M&A 165 200 1.50 0.62 -0.88 1,566 1,709 -0.27 1.71 1.98***
Post-SOX:
Earnings Ann. 465 284 0.74 1.15 0.41 2,847 2,493 -0.43 0.83 1.26***
Conference Call 489 320 0.36 0.53 0.16 2,761 2,556 -0.75 1.08 1.83***
Mgmt Forecasts 340 236 0.64 0.02 -0.62 1,674 1,357 -1.32 0.64 1.96***
M&A 73 82 0.10 1.26 1.16* 463 498 0.57 1.54 0.97
**
Post-Scandal:
Earnings Ann. 503 226 0.59 -0.04 -0.64 2,661 1,650 -0.40 -0.06 0.35
Conference Call 378 287 0.47 -0.26 -0.73 2,022 1,477 -0.10 0.37 0.47*
Mgmt Forecasts 355 190 1.03 -0.92 -1.95***
1,290 738 0.12 0.21 0.09
M&A 70 79 0.79 0.45 -0.34 377 368 1.69 1.02 -0.67

32
(Table 4 Continued)
Panel B: Unscheduled Option Grants (Lucky Grants + Unlucky Grants)
Lucky Unscheduled Grants Unlucky Unscheduled Grants
Num of Events Mean CAR3d (%) Num of Events Mean CAR3d (%)
Before After Before After Difference
(After-Before) Before After Before After
Difference
(After-Before)
Pre-SOX:
Earnings Ann. 528 606 -1.94 3.21 5.15***
4,624 4,372 -0.16 1.44 1.60***
Conference Call 134 187 -2.86 3.50 6.36***
1,371 1,337 -1.21 1.26 2.48***
Mgmt Forecasts 170 192 -4.62 3.81 8.43***
1,433 1,177 -5.22 0.30 5.52***
M&A 147 167 -0.22 1.80 2.02* 1,419 1,542 -0.27 1.70 1.98
***
Post-SOX:
Earnings Ann. 174 195 -1.22 3.72 4.95***
2,673 2,298 -0.38 0.58 0.96***
Conference Call 175 190 -1.90 3.84 5.73***
2,586 2,366 -0.67 0.85 1.53***
Mgmt Forecasts 91 84 -1.00 2.33 3.33***
1,583 1,273 -1.34 0.52 1.86***
M&A 29 19 0.26 2.49 2.22 434 479 0.59 1.50 0.91*
Post-Scandal:
Earnings Ann. 139 96 -3.14 1.89 5.02***
2,522 1,554 -0.25 -0.18 0.08
Conference Call 84 76 -2.26 1.75 4.01***
1,938 1,401 -0.003 0.29 0.30
Mgmt Forecasts 65 52 -3.49 -0.16 3.34**
1,225 686 0.31 0.24 -0.08
M&A 9 10 0.20 1.92 1.72 368 358 1.72 1.00 -0.73
33
Table 5
Test of Timing Hypothesis for Option Grants to Independent Directors
This table shows the average three-day market adjusted returns around four common news events in the half quarter before and after grant dates for the options
awarded to independent directors. ―Before (After)‖ denotes 45 days before (after) the option grant dates. Lucky option grants are excluded from unscheduled
option grants. **
and ***
indicate the difference is statistically significant at 0.05 and 0.01 (two-tailed) levels, respectively.
Scheduled Grants Unlucky Unscheduled Grants
Num of Events Mean CAR3d (%) Num of Events Mean CAR3d (%)
Before After Before After Difference
(After-Before) Before After Before After
Difference
(After-Before)
Pre-SOX:
Earnings Ann. 4,277 1,132 0.62 0.46 -0.16 9,329 6,837 0.42 0.51 0.09
Conference Call 1,171 540 0.90 1.01 0.11 2,096 1,932 0.54 0.07 -0.48
Mgmt Forecasts 587 572 -1.75 -1.73 0.02 1,295 1,428 -4.23 -1.12 3.12***
M&A 454 756 0.70 0.64 -0.06 1,302 1,691 1.43 0.94 -0.48
Post-SOX:
Earnings Ann. 2,241 823 -0.14 -0.15 -0.01 5,935 4,786 0.21 -0.04 -0.24
Conference Call 2,228 1,183 -0.003 -0.22 -0.22 4,789 4,349 0.25 0.03 -0.22
Mgmt Forecasts 1,071 651 0.34 -0.34 -0.68 1,827 1,931 -0.47 -0.20 0.27
M&A 182 312 -2.36 0.01 2.38***
470 735 0.90 1.30 0.40
Post-Scandal:
Earnings Ann. 2,052 782 -0.24 0.19 0.43 5,004 3,288 0.21 0.33 0.12
Conference Call 1,332 974 0.38 0.08 -0.30 2,959 2,209 0.08 0.08 0.00
Mgmt Forecasts 961 443 0.51 -0.66 -1.17**
1,361 965 -0.12 -0.40 -0.28
M&A 112 264 2.24 1.12 -1.13 346 431 -0.67 3.26 3.93***

34
TABLE 6
Unscheduled CEO Option Grants with Fixed and Variable Earnings Announcement Dates
Panel A shows the cumulative abnormal returns (in percentage) around unscheduled option grants in the quarters
with fixed and variable earnings announcement dates. Fixed earnings announcements (EA) are defined as those
announcements made within one week (3 days before and after) of the same quarter in previous year. CAR(-30,-1)
and CAR(1,30) are the cumulative abnormal returns in the 30-trading-day window before and after option grant
date, which is day 0, respectively. Panel B presents the three-day cumulative abnormal returns (in percentage)
around fixed and variable earnings announcements disclosed within the windows of half quarter before and after
option grant date. **
and ***
indicate the difference is statistically significant at 0.05 and 0.01 (two-tailed) levels,
respectively.
Panel A: CAR in the windows of thirty trading days before and after option grants
Num of Grants CAR (-30,-1) CAR (1,30) Difference
Pre-SOX:
Fixed EA 5,467 -2.60 5.19 7.80***
Variable EA 5,146 -3.61 6.89 10.50***
Post-SOX:
Fixed EA 2,734 1.81 4.03 2.22***
Variable EA 2,343 0.11 3.88 3.77***
Post-Scandal:
Fixed EA 2,215 -0.89 0.14 1.03**
Variable EA 1,798 -2.03 1.63 3.65***
Panel B. CAR3d (in %) around fixed and variable earnings announcements
Within half quarter
before grants
Within half quarter
after grants
Difference
(After – Before)
Pre-SOX:
Fixed EA -0.11 0.43 0.54***
Variable EA 0.17 0.79 0.63**
Post-SOX:
Fixed EA 0.39 0.36 -0.03
Variable EA 0.39 0.67 0.28
Post-Scandal:
Fixed EA -0.01 0.82 0.83***
Variable EA 0.29 0.64 0.35

35
TABLE 7
Logistic Regression of Lucky Grants
This table presents the logistic regression of Lucky Grants. Dependent variable is ―1‖ if the grant is ―Lucky‖, ―0‖
otherwise. Lucky grants are defined for those grants awarded at the date with the lowest stock price within the
month. Schedule: Indicator variable, ―1‖ if the option is awarded within one day of the anniversary date of the prior
year’s grant date or within one day of annual board meeting date, and ―0‖ otherwise. Fixed EA: Indicator variable,
―1‖ if earnings announcement is made three days before or after the anniversary date of the same quarter of prior
year, and ―0‖ otherwise. Firm size: The logarithm of the firm’s market value at the option grant date. Volatility:
Historical volatility of stock returns within the year preceding the option grant date. WSJ firms: 136 firms listed on
the Wall Street Journal website as the firms implicated by the SEC or the Justice Department due to option grant
backdating. The information events include the number of conference call, management forecasts, and M&A
announcements within 45-day window before and after option grants. *,
**, and
*** indicate the 0.1, 0.05, and 0.01
(two-tailed) significance levels, respectively.
Predicted
sign (if
backdated)
Pre-SOX Post-SOX Post-Scandal
Coeff p-value Coeff p-value Coeff p-value
Intercept -0.22 0.27 -3.16***
<.0001 -1.38 ***
0.007
Schedule -0.39***
0.0002 -0.12 0.39 -0.33* 0.08
Firm Size -0.16***
<.0001 0.02 0.47 -0.04 0.27
Volatility + 0.26***
0.001 0.65***
<.0001 -1.24***
<.0001
WSJ firms + 1.43***
<.0001 0.70***
<.0001 -0.26 0.54
Fixed EA ? -0.016 0.73 0.43***
<.0001 -0.06 0.59
Info Events:
Conference Call ? -0.24***
<.0001 -0.15**
0.02 -0.30***
0.001
Mgmt forecasts ? 0.23***
<.0001 -0.04 0.57 -0.40***
0.0003
M&A ? 0.22***
<.0001 0.005 0.95 -0.50***
0.001

36
TABLE 8
Portfolio Analysis
The table presents calendar-time Fama-French-Carhart four-factor regressions for the portfolio formed on the next
day following either the option grant date or the SEC filing date. The portfolios were held for three months. The
dependent variable is the portfolio equal-weighted daily excess return, over the risk-free rate. MKT, SML, HML and
UMD are the market, size, book-to-market, momentum factors, respectively (Fama and French 1993; Carhart 1997). * and
*** indicate the 0.1 and 0.01 (two-tailed) significance levels, respectively.
Panel A. Post-SOX
Following option grant date Following the SEC filing date
Coefficient t-statistic Coefficient t-statistic
Alpha 0.00094* 7.96
*** 0.00033 0.59
MKT 0.955***
70.88 1.14***
18.23
SML 0.767***
30.43 1.24***
10.44
HML 0.165***
4.38 0.40***
2.94
UMD 0.179***
8.66 0.43***
5.57
Panel B. Post-Scandal
Following option grant date Following the SEC filing date
Coefficient t-statistic Coefficient t-statistic
Alpha 0.00038 1.79* 0.00021 0.38
MKT 0.889***
58.05 0.86***
20.79
SML 0.612***
18.63 0.57***
6.70
HML 0.0004 0.01 0.16 1.59
UMD 0.156***
6.53 0.09***
1.57
37
Figure 1. Abnormal returns around CEO and Independent Director’s unscheduled option grants in pre-SOX
(January 1, 1996 – August 28, 2002), post-SOX (August 29, 2002 – November 11, 2005), and post-Scandal
(November 12, 2005 – December 31, 2008) periods.