timoshenko beam effects in lateral-mode microcantilever
TRANSCRIPT
Marquette Universitye-Publications@MarquetteCivil and Environmental Engineering FacultyResearch and Publications
Civil and Environmental Engineering, Departmentof
11-1-2013
Timoshenko Beam Effects in Lateral-modeMicrocantilever-based Sensors in LiquidsJoshua A. SchultzMarquette University
Stephen M. HeinrichMarquette University, [email protected]
Fabien JosseMarquette University, [email protected]
Nicholas J. NigroMarquette University, [email protected]
Isabelle DufourUniversité de Bordeaux
See next page for additional authors
Accepted version. Micro & Nano Letters, Vol. 8, No. 11 (November 2013): 762-765. DOI. © 2013Institution of Engineering and Technology. Used with permission.

AuthorsJoshua A. Schultz, Stephen M. Heinrich, Fabien Josse, Nicholas J. Nigro, Isabelle Dufour, Luke A. Beardslee,and Oliver Brand
This article is available at e-Publications@Marquette: https://epublications.marquette.edu/civengin_fac/66

NOT THE PUBLISHED VERSION; this is the author’s final, peer-reviewed manuscript. The published version may be accessed by following the link in the citation at the bottom of the page.
Micro & Nano Letters, Vol 8, No. 11 (November 2013): pg. 762-765. DOI. This article is © Institution of Engineering and Technology and permission has been granted for this version to appear in e-Publications@Marquette. Institution of Engineering and Technology does not grant permission for this article to be further copied/distributed or hosted elsewhere without the express permission from Institution of Engineering and Technology.
1
Timoshenko Beam Effects in Lateral-
Mode Microcantilever-Based Sensors
in Liquids
Joshua A. Schultz Department of Civil, Construction and Environmental Engineering
Marquette University
Milwaukee, WI
Stephen M. Heinrich Department of Civil, Construction and Environmental Engineering
Marquette University
Milwaukee, WI
Fabien Josse Department of Electrical and Computer Engineering
Marquette University
Milwaukee, WI
Nicholas J. Nigro Department of Mechanical Engineering
Marquette University
Milwaukee, WI
Isabelle Dufour CNRS, IMS Laboratory, Université de Bordeaux
Talence, France

NOT THE PUBLISHED VERSION; this is the author’s final, peer-reviewed manuscript. The published version may be accessed by following the link in the citation at the bottom of the page.
Micro & Nano Letters, Vol 8, No. 11 (November 2013): pg. 762-765. DOI. This article is © Institution of Engineering and Technology and permission has been granted for this version to appear in e-Publications@Marquette. Institution of Engineering and Technology does not grant permission for this article to be further copied/distributed or hosted elsewhere without the express permission from Institution of Engineering and Technology.
2
Luke A. Beardslee School of Electrical and Computer Engineering
Georgia Institute of Technology
Atlanta, GA
Oliver Brand School of Electrical and Computer Engineering
Georgia Institute of Technology
Atlanta, GA
Recent experimental and analytical research has shown that higher in-fluid
quality factors (Q) are achieved by actuating microcantilevers in the lateral
flexural mode, especially for microcantilevers having larger width-to-length
ratios. However, experimental results show that for these geometries the
resonant characteristics predicted by the existing analytical models differ from
the measurements. A recently developed analytical model to more accurately
predict the resonant behaviour of these devices in viscous fluids is described.
The model incorporates viscous fluid effects via a Stokes-type fluid resistance
assumption and ‘Timoshenko beam’ effects (shear deformation and rotatory
inertia). Unlike predictions based on Euler-Bernoulli beam theory, the new
theoretical results for both resonant frequency and Q exhibit the same trends
as seen in the experimental data for in-water measurements as the beam
slenderness decreases. An analytical formula for Q is also presented to
explicitly illustrate how Q depends on beam geometry and on beam and fluid
properties. Beam thickness effects are also examined and indicate that the
analytical results yields good numerical estimates of Q for the thinner (5 μm)
specimens tested, but overestimate Q for the thicker (20 μm) specimens, thus
suggesting that a more accurate fluid resistance model should be introduced
in the future for the latter case.
1. Introduction and motivation
Dynamic-mode microcantilevers are well suited to biological and
chemical sensing applications. However, these applications often
necessitate liquid-phase sensing, introducing significant fluid-induced
inertial and dissipative forces which reduce resonant frequencies (ƒres)
and quality factors (Q) and, thus, adversely affect the sensitivity and
the limit of detection. In an effort to mitigate these effects,
unconventional resonant modes of microcantilevers have been
investigated, one of which is the lateral flexural mode [1–4]. (The

NOT THE PUBLISHED VERSION; this is the author’s final, peer-reviewed manuscript. The published version may be accessed by following the link in the citation at the bottom of the page.
Micro & Nano Letters, Vol 8, No. 11 (November 2013): pg. 762-765. DOI. This article is © Institution of Engineering and Technology and permission has been granted for this version to appear in e-Publications@Marquette. Institution of Engineering and Technology does not grant permission for this article to be further copied/distributed or hosted elsewhere without the express permission from Institution of Engineering and Technology.
3
lateral flexural mode refers to bending vibrations in the plane of
the microcantilever shown in Figure 1, as opposed to the more
‘natural’ out-of-plane vibrations.) Recent analytical [2, 3] and
experimental [4] research has shown that higher in-fluid Q is
achieved by employing this mode, which reduces the viscous
energy dissipation in the fluid as compared with the transverse
(out-of-plane) mode. In particular, both the theoretical and the
experimental results show that the lateral-mode designs offering
the most promise in liquids are those for which the microbeams
are relatively short and wide. However, such geometries may
violate the assumptions employed in Euler-Bernoulli (EB) beam
theory because of the large width-to-length ratio. This is
exhibited in the deviation between the EB predictions and the
experimental data for ƒres and Q for short, wide cantilevers, for
which the EB theory overestimates the results [4].
To understand the behaviour of the lateral-mode devices in a
better manner, a model that accounts for both fluid effects and
‘Timoshenko beam’ (TB) effects (shear deformation and rotatory
inertia) is warranted. Recently, a TB/Stokes fluid resistance model
was introduced by Schultz et al. [5] and was implemented in a
primarily theoretical study to investigate the effects of the excitation
method and detection scheme on the dynamic response of lateralmode
microcantilevers [6]. However, in the latter study only a
limited amount of experimental validation was performed; moreover,
the appropriate specification of material input parameters to
the model received minimal attention and the efficacy of the
model with respect to cantilever thickness was not examined. To
be useful for optimisation of the sensor geometries, the proposed
model (or an appropriate extension) must be applicable over a
sufficiently wide range of geometric parameters, including cantilever
thickness. These issues are therefore the focus of the present
Letter. More specifically, two methods of selecting material property
input to the model are examined and discussed, and observations
are made based on comparisons of model predictions and
liquid-phase (water) experimental data. Recommendations based
on these comparisons are made for future theoretical work.

NOT THE PUBLISHED VERSION; this is the author’s final, peer-reviewed manuscript. The published version may be accessed by following the link in the citation at the bottom of the page.
Micro & Nano Letters, Vol 8, No. 11 (November 2013): pg. 762-765. DOI. This article is © Institution of Engineering and Technology and permission has been granted for this version to appear in e-Publications@Marquette. Institution of Engineering and Technology does not grant permission for this article to be further copied/distributed or hosted elsewhere without the express permission from Institution of Engineering and Technology.
4
2. Assumptions
The major assumptions employed in the model
are: (i) viscous dissipation in the fluid is the dominant loss
mechanism; (ii) the cross-section is rectangular and relatively thin
(thickness h ≪ width b), hence the fluid resistance associated
with the pressure on smaller faces is negligible compared with
the fluid’s shear resistance on larger faces; and (iii) the shear
stress exerted by the fluid on the beam is approximated by local
application of the classical solution of Stokes’s second problem
for harmonic motion of an infinite rigid plate in a viscous fluid.
3. Boundary value problem
By modelling the microcantilever as a TB (e.g. [7]) with
distributed Stokes-type fluid resistance [2, 3], two fourth-order partial
differential equations (PDEs) which govern the total deflection, �̅�, and
the rotation angle of the crosssection, 𝜑, may be derived [8]. (The
overbars denote the dimensionless quantities.) Separation of the
variables leads to two ordinary differential equations (ODEs) for the
spatially dependent deflection and rotation fields, �̅�(ξ) and Φ(ξ),
where ξ = x/L is a normalised coordinate and i is the imaginary unit
�̅�′′′′ + λ3 (r2 + s2)[λ + (1 – i)ζ]�̅�′′
― λ3[λ + (1 ― i)ζ]{1 ― r2s2λ3[λ + (1 ― i)ζ]}�̅� = 0 (1)
Φ′′′ + λ3(r2 +s2)[λ + (1 ― i)ζ]Φ′′
― λ3[λ +(1 ― i)ζ]{1 ― r2s2λ3[λ + (1 ― i)ζ]}Φ = 0, (2)
Quantities �̅� and Φ are, respectively, the complex amplitudes of the
total beam deflection (bending plus shear) and the rotation angle.
The ODEs (and the corresponding PDEs) involve four independent
dimensionless parameters: 𝑟, 𝑠, 𝜆 and 𝜁. The TB parameters, r and s,
are defined as the rotational inertia parameter, r2 ≡ I/AL2, and the

NOT THE PUBLISHED VERSION; this is the author’s final, peer-reviewed manuscript. The published version may be accessed by following the link in the citation at the bottom of the page.
Micro & Nano Letters, Vol 8, No. 11 (November 2013): pg. 762-765. DOI. This article is © Institution of Engineering and Technology and permission has been granted for this version to appear in e-Publications@Marquette. Institution of Engineering and Technology does not grant permission for this article to be further copied/distributed or hosted elsewhere without the express permission from Institution of Engineering and Technology.
5
shear deformation parameter, s2 ≡ EI/kAGL2, where A and I are
the cross-section’s area and second moment of area, E and G are
the effective Young’s modulus and shear modulus, k = 5/6 is the
shear coefficient and L is the beam length. Parameters λ and ζ are
the frequency and the fluid resistance parameters, which are
related to the fundamental system parameters by
λ ≡ (12𝜌𝑏 𝐿4𝜔2
𝐸𝑏2 )
¼
(3)
ζ ≡ 𝐿
ℎ𝑏½ (
48𝜌f 2 η2
𝐸𝜌𝑏3 )
¼
(4)
where ρb is the beam density and ρf and η are the fluid density and
viscosity. Parameter ω is the driving/response frequency (rad/s), so
that λ is a dimensionless excitation/response frequency. (The
corresponding excitation/response frequency, ƒ, in Hz is given by ƒ =
ω/2π.) The imposed boundary conditions correspond to
electrothermal harmonic excitation via integrated heating resistors
near the base of the cantilever (Figure 1) and are given by Schultz [8]
�̅�(0) = 0 (5)
Φ(0) = θ0 (6)
Φ′(1) = 0 (7)
�̅�′(1) ― Φ(1) = 0 (8)
where θ0 represents the amplitude of the ‘effective support rotation’
imparted by the heating resistors [3].

NOT THE PUBLISHED VERSION; this is the author’s final, peer-reviewed manuscript. The published version may be accessed by following the link in the citation at the bottom of the page.
Micro & Nano Letters, Vol 8, No. 11 (November 2013): pg. 762-765. DOI. This article is © Institution of Engineering and Technology and permission has been granted for this version to appear in e-Publications@Marquette. Institution of Engineering and Technology does not grant permission for this article to be further copied/distributed or hosted elsewhere without the express permission from Institution of Engineering and Technology.
6
4. Results and discussion
The boundary value problem defined by (1,2) and (5)–(8) was solved
analytically and the results expressed in terms of two ‘output signals’:
total tip displacement and bending tip displacement, corresponding
respectively to the optical and piezoresistive detection methods [8].
Both ƒres and Q were extracted from the theoretical beam response and
were found to be insensitive to the output signal type for fluid
resistance values in the range 0 ≤ ζ ≤ 0.3, which includes values
associated with all the specimens tested [5].
Given the importance of Q in liquid-phase microcantilever
resonator applications, a surface-fitting procedure was applied to the
theoretical results to obtain the following analytical formula,
which explicitly shows how Q depends on the system parameters
Q ≈ 0.7124 hb ½
( E𝜌𝑏
3 )
¼
L 𝜌ƒ2η2
X [1 ― 0.0789 (𝑏
𝐿)
2.529 ―0.0721 (
𝑏
𝐿)
1.578 (
𝐸
𝐺)
0.823
]
(9)
The bracketed expression represents a correction factor associated
with TB effects, which reduces the EB result [2] appearing in
front of the correction factor. The results of (9) are within 2.0%
of those generated by the current analytical model over the following
practical ranges of parameters: ζ ∈ [0, 0.05], r ∈ [0, 0.2] and √𝐸/𝑘𝐺
∈ [ [0, 3].
To generate numerical results from the current TB model it is
necessary to specify the values of the effective elastic properties of the
microbeam (E and G). Owing to the composite nature of the
cantilevers modelled in this study (Si base layer plus several
passivation layers [8]), it is problematic to specify appropriate values
of these effective moduli; therefore one method that was utilized to
specify these values was based on fitting the in-vacuum resonant

NOT THE PUBLISHED VERSION; this is the author’s final, peer-reviewed manuscript. The published version may be accessed by following the link in the citation at the bottom of the page.
Micro & Nano Letters, Vol 8, No. 11 (November 2013): pg. 762-765. DOI. This article is © Institution of Engineering and Technology and permission has been granted for this version to appear in e-Publications@Marquette. Institution of Engineering and Technology does not grant permission for this article to be further copied/distributed or hosted elsewhere without the express permission from Institution of Engineering and Technology.
7
frequency results of the present model to in-air experimental data,
assuming that the air resistance has a negligible effect on ƒres. The
fitting procedure was formulated in such a manner that the fitting
parameters were taken to be C1 ≡ √𝐸/12𝜌𝑏 and C2 ≡ √𝐸/𝑘𝐺.
(Since k = 5/6 and the beam density is typically known, the
determination of C1 and C2 is equivalent to determining E and G.)
Relevant device geometries and the fitting procedure are described
elsewhere [6, 8]. The values of C1 and C2 as determined by the
fitting method are shown in Table 1 along with the back-calculated
values of E, assuming that ρb = 2330 kg/m3 (silicon). These values
were then used as input to the model when making comparisons
between the theoretical in-water results and the in-water test data
(the comparison of the main interest in this study). A second
method for specifying the C2 value was to choose C2 = 2 for all
cases as this is the ‘textbook value’ based on a standard (100)
silicon wafer with the microcantilever oriented along the [110]
axis, that is, E = 169 GPa and G = 50.9 GPa [9]. This second
method for specifying C2 was motivated by the fact that the first
method yielded values for E/G that seemed to be unrealistically
large for a structure that is primarily silicon.
Table 1 shows that E obtained from the C1 values follows a
decreasing trend as the thickness increases. A possible explanation for
this behaviour is that, as the actual stiffness of the beam increases
(via increasing thickness), the effects of support compliance may
be increasing. (Support compliance in these types of structures
has been modelled in detail and the results support this hypothesis
[10, 11].) Consequently, the overall system has a decreasing stiffness
which is indirectly accounted for here through a reduced
value of E.
The results shown in Figures 2 and 3 for the thinnest specimen
set (nominal thickness hnom = 5 μm) indicate that the model is capable
of matching the experimental data quite well for both ƒres
and Q for lateral-mode microcantilevers at higher b/L ratios (i.e.
for the high-Q devices for which the EB models prove inadequate).

NOT THE PUBLISHED VERSION; this is the author’s final, peer-reviewed manuscript. The published version may be accessed by following the link in the citation at the bottom of the page.
Micro & Nano Letters, Vol 8, No. 11 (November 2013): pg. 762-765. DOI. This article is © Institution of Engineering and Technology and permission has been granted for this version to appear in e-Publications@Marquette. Institution of Engineering and Technology does not grant permission for this article to be further copied/distributed or hosted elsewhere without the express permission from Institution of Engineering and Technology.
8
However, these Figures are based on the C2 values of Table 1
which, as indicated above, are most probably underestimating the
actual shear modulus G. Consequently, the second method of
generating the theoretical results, based on specifying C2 = 2 (with C1
as given in Table 1), was used. These results are compared in
Figures 4 and 5 with the same dataset (hnom = 5 μm) as in Figures 2
and 3. Although the model still simulates the qualitative softening
trend of the data for the ‘stubbier’ specimens, the magnitude
of the softening is significantly underestimated, unlike in Figures 2 and
3. The likely reason is that the larger C2 values used in the earlier
Figures are indirectly incorporating the influence of support flexibility,
whereas the approach used to generate Figures 4 and 5 does not.
To examine the influence of cantilever thickness on resonant
characteristics, comparisons of the theoretical predictions and
experimental data were also performed for the case of hnom = 20 μm,
again using C2 = 2. Figures 6 and 7 illustrate that, while the current
theory accurately models the trends in both ƒes and Q at higher b/L
ratios, there is a tendency for the current model to overestimate
Q more for the thicker specimens. This is probably associated with a
breakdown of the assumption that the effect of fluid pressure on the
smaller faces of the beam is negligible. As the thickness increases, the
pressure effects will become more important and should be
incorporated into future modelling efforts.
Over the practical ranges of the system parameters considered,
the theoretical results indicate that the TB effects can account for a
reduction in ƒres and Q of up to ∼ 40 and ∼ 25%, respectively, but
have effects of less than 2% when L/b > 10. The improved frequency
estimates are smaller than the EB results because the TB model has
lower stiffness (because of shear deformation) and greater mass
(because of rotatory inertia), thereby causing a departure from the
linear EB frequency results (Figures 2, 4 and 6). Similar conclusions
apply to the Q comparisons among the experimental data and the TB
and EB models (Figures 3, 5 and 7), although the departure from
linearity is of smaller magnitude than for the frequency results.
NOT THE PUBLISHED VERSION; this is the author’s final, peer-reviewed manuscript. The published version may be accessed by following the link in the citation at the bottom of the page.
Micro & Nano Letters, Vol 8, No. 11 (November 2013): pg. 762-765. DOI. This article is © Institution of Engineering and Technology and permission has been granted for this version to appear in e-Publications@Marquette. Institution of Engineering and Technology does not grant permission for this article to be further copied/distributed or hosted elsewhere without the express permission from Institution of Engineering and Technology.
9
In summary, the TB model presented here for lateral-mode
cantilevers captures the trends in liquid-phase experimental data more
accurately than the existing EB models. In addition, an analytical
equation has been presented to explicitly show the relationship
between Q and the geometric and material parameters of the
microcantilever/fluid system, which may serve as an aid in both
preliminary design and device optimisation. In particular, the present
model has important implications from the sensors design standpoint
since the ability to accurately relate resonant frequency and Q to
design and fluid parameters is a critical first step in understanding
how to design for desired levels of performance (i.e. sensitivity
and limit of detection). Ongoing modelling efforts involve more
complete parametric studies on both resonant characteristics and
sensor performance metrics. Generalisations of the model to
incorporate the effects of support compliance and more complex
beam/fluid interaction are also being pursued for applications involving
thicker lateral-mode devices.
5. Acknowledgment
This work is supported in part by NSF grant nos ECCS-0824017
and ECCS-1128992.
6 References
[1] Sharos L.B., Raman A., Crittenden S., Reifenberger R.: ‘Enhanced mass
sensing using torsional and lateral resonances in microcantilevers’,
Appl. Phys. Lett., 2004, 84, pp. 4638–4640
[2] Heinrich S.M., Maharjan R., Beardslee L., Brand O., Dufour I., Josse F.:
‘An analytical model for in-plane flexural vibrations of thin cantilever-
based sensors in viscous fluids: applications to chemical sensing in
liquids’. Proc. Int. Workshop on Nanomechanical Cantilever Sensors,
Banff, Canada, 2010, p. 2
[3] Heinrich S.M., Maharjan R., Dufour I., Josse F., Beardslee L.A., Brand O.:
‘An analytical model of a thermally excited microcantilever vibrating
laterally in a viscous fluid’. Proc. IEEE Sensors, Conf., 2010, Waikoloa,
Hawaii, pp. 1399–1404
[4] Beardslee L.A., Josse F., Heinrich S.M., Dufour I., Brand O.: ‘Geometrical
considerations for the design of liquid-phase biochemical sensors using

NOT THE PUBLISHED VERSION; this is the author’s final, peer-reviewed manuscript. The published version may be accessed by following the link in the citation at the bottom of the page.
Micro & Nano Letters, Vol 8, No. 11 (November 2013): pg. 762-765. DOI. This article is © Institution of Engineering and Technology and permission has been granted for this version to appear in e-Publications@Marquette. Institution of Engineering and Technology does not grant permission for this article to be further copied/distributed or hosted elsewhere without the express permission from Institution of Engineering and Technology.
10
a cantilever’s fundamental in-plane mode’, Sens. Actuators B, 2012,
164, pp. 7–14
[5] Schultz J.A., Heinrich S.M., Josse F., ET AL.: ‘Timoshenko beam effects in
lateral-mode microcantilever-based sensors in liquids’. Proc. Int.
Workshop on Nanomechanical Sensing, Stanford, CA, USA, 2013, pp.
143–144
[6] Schultz J.A., Heinrich S.M., Josse F., ET AL.: ‘Timoshenko beam model for
lateral vibration of liquid-phase microcantilever-based sensors’. Proc.
SEM 2013 Annual Conf. and Exposition on Experimental and Applied
Mechanics, Lombard, IL, USA, 2013, p. 10
[7] Timoshenko S., Young D.H.: ‘Vibration problems in engineering’ (Van
Nostrand, New York, 1955, 3rd edn) [8] Schultz J.A.: ‘Lateral-mode
vibration of microcantilever-based sensors in viscous fluids using
Timoshenko beam theory’. Doctoral Dissertation, Marquette University,
Milwaukee, WI, USA, 2012
[9] Hopcroft M.A., Nix W.D., Kenny T.W.: ‘What is the Young’s modulus of
silicon?’, J. Microelectromech. Syst., 2010, 19, pp. 229–238
[10] MacBain J.C., Genin J.: ‘Effect of support flexibility on the fundamental
frequency of vibrating beams’, J. Franklin Inst., 1973, 296, pp. 259–
273
[11] Maharjan R.: ‘Effect of support compliance on the resonant behavior of
microcantilever-based sensors in viscous fluids’. Doctoral Dissertation,
Marquette University, Milwaukee, WI, USA, 2013
Figure 1 Microcantilever with heating resistors near support to excite lateral
(in-plane) bending [4]

NOT THE PUBLISHED VERSION; this is the author’s final, peer-reviewed manuscript. The published version may be accessed by following the link in the citation at the bottom of the page.
Micro & Nano Letters, Vol 8, No. 11 (November 2013): pg. 762-765. DOI. This article is © Institution of Engineering and Technology and permission has been granted for this version to appear in e-Publications@Marquette. Institution of Engineering and Technology does not grant permission for this article to be further copied/distributed or hosted elsewhere without the express permission from Institution of Engineering and Technology.
11
Table 1 C1 and C2 based on fitting the in-vacuum model to the in-air
frequency data (E obtained from C1)
Figure 2 Resonant frequency comparison (in water, h = 7.02 μm, C2 =
4.423): current model, EB model and experimental data
NOT THE PUBLISHED VERSION; this is the author’s final, peer-reviewed manuscript. The published version may be accessed by following the link in the citation at the bottom of the page.
Micro & Nano Letters, Vol 8, No. 11 (November 2013): pg. 762-765. DOI. This article is © Institution of Engineering and Technology and permission has been granted for this version to appear in e-Publications@Marquette. Institution of Engineering and Technology does not grant permission for this article to be further copied/distributed or hosted elsewhere without the express permission from Institution of Engineering and Technology.
12
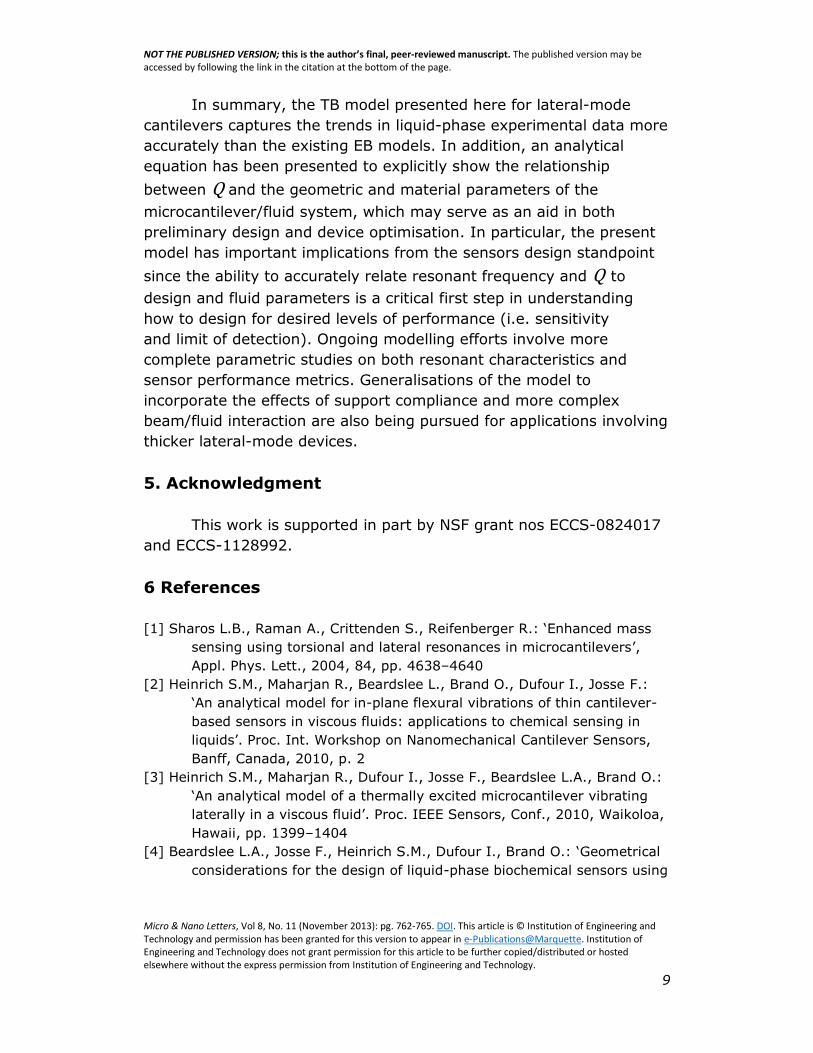
Figure 3 Quality factor comparison (in water, h = 7.02 μm, C2 = 4.423):
current model, EB model and experimental data from [4]
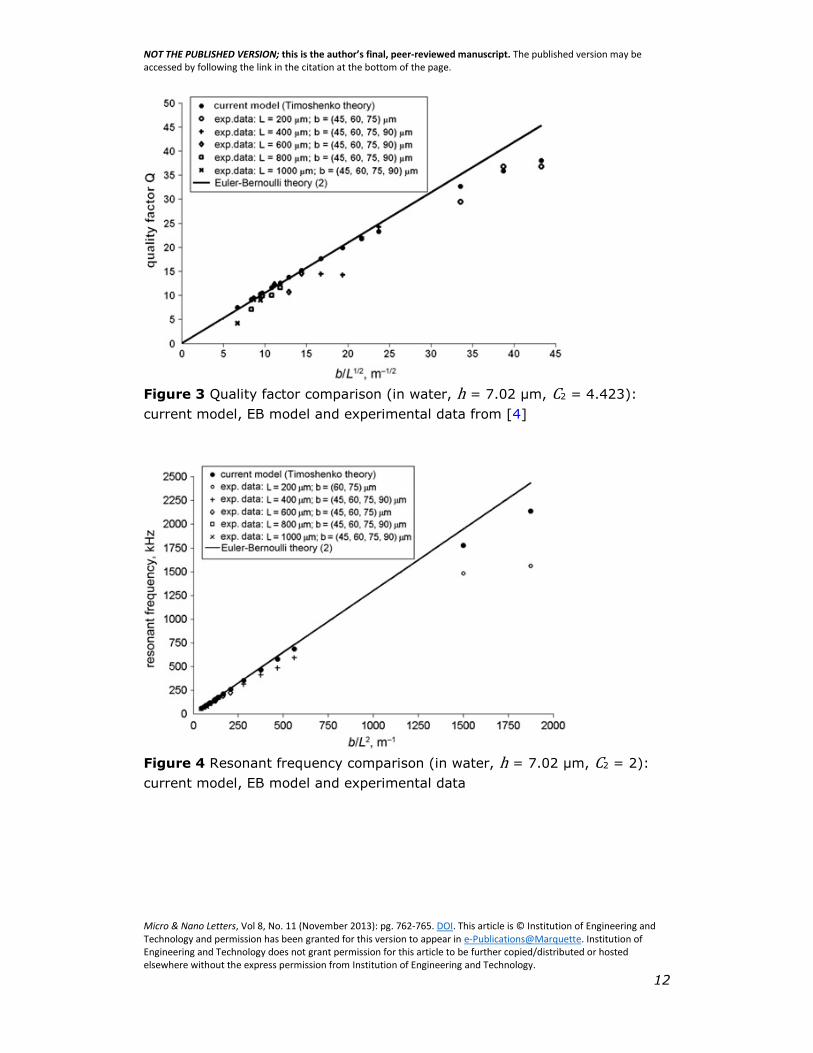
Figure 4 Resonant frequency comparison (in water, h = 7.02 μm, C2 = 2):
current model, EB model and experimental data

NOT THE PUBLISHED VERSION; this is the author’s final, peer-reviewed manuscript. The published version may be accessed by following the link in the citation at the bottom of the page.
Micro & Nano Letters, Vol 8, No. 11 (November 2013): pg. 762-765. DOI. This article is © Institution of Engineering and Technology and permission has been granted for this version to appear in e-Publications@Marquette. Institution of Engineering and Technology does not grant permission for this article to be further copied/distributed or hosted elsewhere without the express permission from Institution of Engineering and Technology.
13
Figure 5 Quality factor comparison (in water, h = 7.02 μm, C2 = 2):
current model, EB model and experimental data from [4]
Figure 6 Resonant frequency comparison (in water, h = 22.34 μm, C2 = 2):
current model, EB model and experimental data
NOT THE PUBLISHED VERSION; this is the author’s final, peer-reviewed manuscript. The published version may be accessed by following the link in the citation at the bottom of the page.
Micro & Nano Letters, Vol 8, No. 11 (November 2013): pg. 762-765. DOI. This article is © Institution of Engineering and Technology and permission has been granted for this version to appear in e-Publications@Marquette. Institution of Engineering and Technology does not grant permission for this article to be further copied/distributed or hosted elsewhere without the express permission from Institution of Engineering and Technology.
14
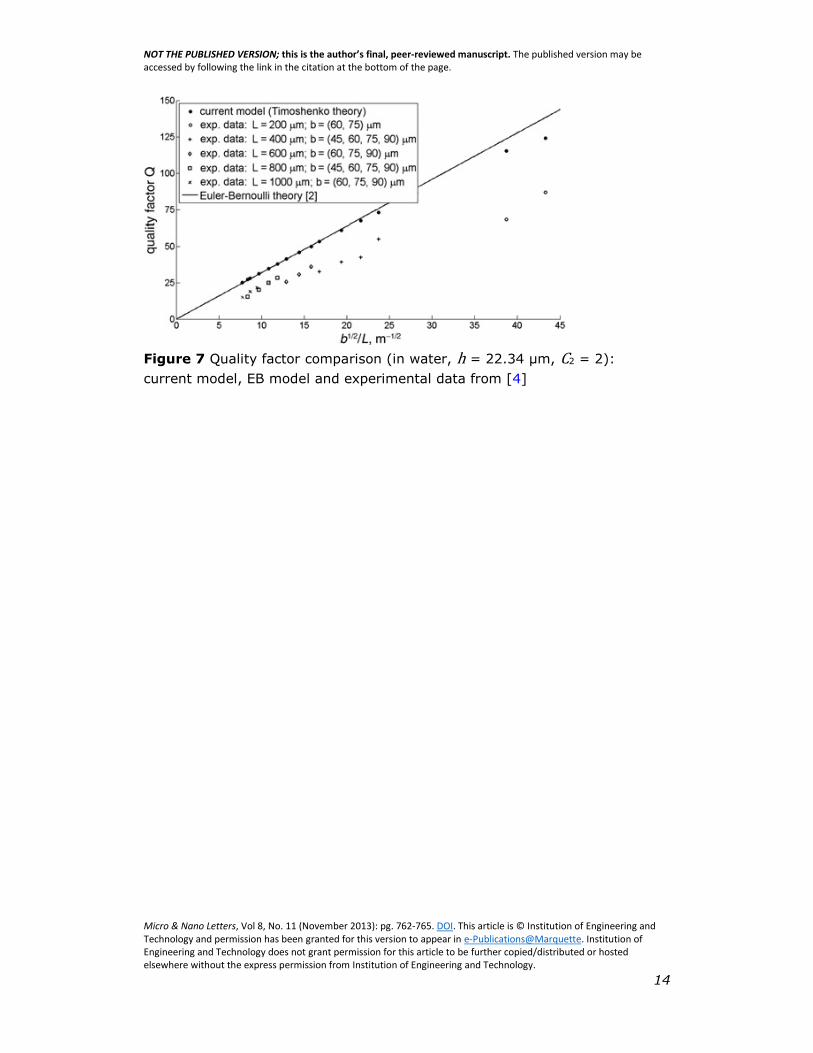
Figure 7 Quality factor comparison (in water, h = 22.34 μm, C2 = 2):
current model, EB model and experimental data from [4]