timss - boston college · timss 2003 was an ambitious and demanding study, involving complex...
TRANSCRIPT

International Association for the Evaluation of Educational Achievement
TIMSS & PIRLS International Study CenterLynch School of Education, Boston College
TIMSSTIMSS 2003 User Guide for the International Database
Edited by:
Michael O. Martin
Contributors:Alka AroraJuliane BarthSteven J. ChrostowskiDana DiaconuEbru ErberberPierre FoyJoseph GaliaEugenio J. GonzalezIeva JohansoneMarc JoncasIsaac LiIna V. S. MullisOliver NeuschmidtMaria Jose RamirezMilena Taneva

© Copyright 2005 International Association for the Evaluation of Educational Achievement (IEA)
TIMSS 2003 User Guide for the International Database / Edited by Michael O. Martin
Publisher: TIMSS & PIRLS International Study Center Lynch School of Education Boston College
Library of Congress Catalog Card Number: 2005921005
ISBN: 1-889938-36-X
For more information about TIMSS contact: TIMSS & PIRLS International Study Center Lynch School of Education Boston College Chestnut Hill, MA 02467 United States
Tel: +1-617-552-1600 Fax: +1-617-552-1203 Email: [email protected] website: timss.bc.edu
Boston College is an equal opportunity, affirmative action employer. Printed and bound in the United States.

Table Of Contents
1 Overview of the TIMSS 2003 International Database ...... 1-1
1.1 Introduction ................................................................................. 1-1
1.2 Participants in TIMSS 2003 ............................................................ 1-3
1.3 The TIMSS 2003 Mathematics and Science Assessment ...................... 1-6
1.4 TIMSS 2003 Background Questionnaires .......................................... 1-8
1.5 TIMSS 2003 Student Populations .................................................... 1-9
1.6 Analyzing the TIMSS 2003 Data .....................................................1-10
1.7 Study Management and Organization .............................................1-10
2 Working With the TIMSS 2003 Data ................................ 2-1
2.1 The TIMSS 2003 Assessment Frameworks ....................................... 2-1
2.3 TIMSS 2003 Mathematics and Science Achievement Scores ...............2-11
2.4 The TIMSS 2003 Background Questionnaires ...................................2-16
2.5 Working with TIMSS 2003 Questionnaire Data .................................2-33
2.6 Using Sampling Weights in Analyzing the TIMSS 2003 Data ...............2-45
2.7 Using the Jackknife to Estimate Sampling and Imputation Variance ....2-49
3 Content and Format of Database Files ............................. 3-1
3.1 Overview ..................................................................................... 3-1
3.2 The Data Files .............................................................................. 3-2
3.3 Codebook Files ............................................................................3-27
3.4 Data Almanacs ............................................................................3-31
3.5 Program Files ..............................................................................3-35
3.6 Test-Curriculum Matching Analysis Data Files ...................................3-36
3.7 Item Information Files ..................................................................3-37
4 Performing Analyses with the TIMSS Data Using SPSS .... 4-1
4.1 Overview ..................................................................................... 4-1
4.2 Contents of the TIMSS 2003 Database DVD ...................................... 4-1
4.3 Creating SPSS System Files ............................................................ 4-4
4.4 Scoring the Items ......................................................................... 4-6

4.5 Joining Files ................................................................................4-10
4.6 Basic Analyses with the TIMSS Data: Means, Percentages, Regression
Coefficients and their JRR Standard Errors ......................................4-11
4.7 Replicating Analyses from the TIMSS 2003 International Reports:
Student-Level ..............................................................................4-34
4.8 Performing Analyses with Teacher-Level Variables ............................4-44
4.9 Performing Analyses with School-Level Variables ..............................4-51
5 Performing Analyses with the TIMSS Data Using SAS ...... 5-1
5.1 Overview ..................................................................................... 5-1
5.2 Contents of the TIMSS 2003 Database DVD ...................................... 5-1
5.3 Creating SAS Data Files ................................................................. 5-4
5.4 Scoring the Items ......................................................................... 5-6
5.5 Converting Files ............................................................................ 5-9
5.6 Joining Files ................................................................................5-11
5.7 Basic Analyses with the TIMSS Data: Means, Percentages, Regression
Coefficients and Their JRR Standard Errors ......................................5-13
5.8 Replicating Analyses from the TIMSS 2003 International Reports:
Student-Level ..............................................................................5-34
5.9 Performing Analyses with Teacher-Level Variables ............................5-44
5.10 Performing Analyses with School-Level Variables ..............................5-51
A Acknowledgements ......................................................... A-1
A.1 Funding Agencies .......................................................................... A-1
A.2 Management and Operations .......................................................... A-1
A.3 TIMSS 2003 Advisory Committees and Task Forces ............................ A-4
Table Of Contents (...Continued)
TIMSS 2003 International Database User Guide 1-1
1 Overview of the TIMSS 2003 International Database
1.1 Introduction
To facilitate secondary analyses aimed at improving mathematics and science education, the TIMSS 2003 International Database makes available to researchers, analysts, and other users the data collected and processed by IEA’s TIMSS 2003 project. This database comprises student achievement data in mathematics and science as well as student, teacher, school, and curricular background data for the 48 countries that participated in TIMSS 2003 at the eighth grade and 26 countries that participated in TIMSS 2003 at the fourth grade. The database includes data from over 360,000 students, about 25,000 teachers, about 12,000 school principals, and the National Research Coordinators of each country. All participating countries gave the IEA permission to release their national data.
IEA, the International Association for the Evaluation of Educational Achievement, has been conducting international comparative studies of student achievement in school subjects for more than 40 years. When it collected data for the first time in 1994-95, TIMSS (known then as the Third International Mathematics and Science Study) was the largest and most complex international study of student achievement ever conducted, including both mathematics and science at third, fourth, seventh and eighth grades, and the final year of secondary school. In 1999, TIMSS (by now renamed the Trends in International Mathematics and Science Study) again assessed eighth-grade students in both mathematics and science to measure trends in student achievement since 1995.
TIMSS 2003, the third data collection in the TIMSS cycle of studies, was administered at the eighth and fourth grades. For countries that participated in previous assessments, TIMSS 2003 provides three-cycle trends at the eighth grade (1995, 1999, 2003) and data over two points in time at the fourth grade (1995 and 2003). In countries new to the study, the 2003 results can help policy makers and practitioners assess their comparative standing and gauge the rigor and effectiveness of their mathematics and science programs.1
At the heart of the TIMSS 2003 International Database are the student achievement scores in mathematics and science, together with responses of students, teachers, and principals to the background questionnaires. Student
1 See Mullis, Martin, Gonzalez, and Chrostowski (2004) for results in mathematics and Martin, Mullis, Gonzalez, and Chrostowski (2004) for results in science.
TIMSS 2003 International Database User Guide1-2
achievement scores and student questionnaire responses have been merged to facilitate secondary analyses. More specifically, the database includes the following for each country for which internationally comparable data are available:
• Students’ responses to each of the mathematics and science items administered in the study
• Student achievement scores in mathematics and science
• Students’ responses to the student questionnaires
• Teachers’ responses to the teacher questionnaires
• Principals’ responses to the school questionnaires
• National Research Coordinators’ responses to the curriculum questionnaires.
This user guide describes the content and format of the data in the TIMSS 2003 International Database. Chapter 2 details aspects of the study that determine the structure and content of the database, and describes some of the database variables that were constructed to analyze and report the results of the study. Chapter 3 documents in detail the data files in the database, discusses the appropriate use of the files and variables, and draws attention to special considerations that arise from the complex design of the assessment. Chapters 4 and 5, present examples of analyses of the TIMSS 2003 data using, respectively, the SPSS and SAS statistical software systems.
The user guide is accompanied by three supplementary volumes: Supplement 1 comprises the international version of each of the TIMSS 2003 background questionnaires, Supplement 2 describes any national adaptations to the questions in each questionnaire, and Supplement 3 describes in detail how indices and other derived variables were constructed for reporting the TIMSS data.
TIMSS 2003 was an ambitious and demanding study, involving complex designs and procedures for assessing students’ mathematics and science achievement, drawing student samples, and analyzing and reporting the data. In order to work effectively with the TIMSS data it is necessary to have an understanding of these characteristics of the study, which are described fully in the TIMSS 2003 Technical Report (Martin, Mullis, & Chrostowski, 2004). It is intended, therefore, that this user guide be used in conjunction with the technical report. Whereas the user guide describes the organization and content of the database, the technical report provides the rationale for the techniques used and for the variables created.

TIMSS 2003 International Database User Guide 1-3
1.2 Participants in TIMSS 2003
Exhibit 1.1 lists all the countries that have participated in TIMSS in 1995, 1999, or 2003 at fourth or eighth grade. In all, 67 countries have participated in TIMSS at one time or another. Of the 49 countries that participated in TIMSS 2003, 48 participated at the eighth grade and 26 at the fourth grade. Yemen participated at the fourth but not the eighth grade. The exhibit shows that at the eighth grade, 23 countries also participated in TIMSS 1995 and TIMSS 1999. For these participants, trend data across three points in time are available. Eleven countries participated in TIMSS 2003 and TIMSS 1999 only, while three countries participated in TIMSS 2003 and TIMSS 1995. These countries have trend data for two points in time. Of the 12 new countries participating in the study, 11 participated at eighth grade and 2 at the fourth grade. Of the 26 countries participating in TIMSS 2003 at the fourth grade, 16 also participated in 1995, providing data at two points in time.
Exhibit 1.1 Countries Participating in TIMSS 2003, 1999, and 1995
CountriesGrade 8 Grade 4
2003 1999 1995 2003 1995
Argentina* k k
Armenia k k
Australia k k k k k
Austria k k
Bahrain k
Belgium (Flemish) k k k k
Belgium (French) k
Botswana k
Bulgaria k k k
Canada k k k
Chile k k
Chinese Taipei k k k
Colombia k
Cyprus k k k k k
Czech Republic k k k
Denmark k
Egypt k
England k k k k k
Estonia k
Finland k
France k
Germany k
Ghana k

TIMSS 2003 International Database User Guide1-4
Exhibit 1.1 Countries Participating in TIMSS 2003, 1999, and 1995 (...Continued)
Greece k k
Hong Kong, SAR k k k k k
Hungary k k k k k
Iceland k k
Indonesia k k
Iran, Islamic Rep. of k k k k k
Ireland k k
Israel k k k k
Italy k k k k k
Japan k k k k k
Jordan k k
Korea, Rep. of k k k k
Kuwait k k
Latvia k k k k k
Lebanon k
Lithuania k k k k
Macedonia, Rep. of k k
Malaysia k k
Moldova, Rep. of k k k
Morocco k k k
Netherlands k k k k k
NewZealand k k k k k
Norway k k k k
Palestinian Nat’l Auth.
k
Philippines k k k
Portugal k k
Romania k k k
Russian Federation k k k k
SaudiArabia k
Scotland k k k k
Serbia k
Singapore k k k k k
Slovak Republic k k k
Slovenia k k k k k
South Africa k k k
Spain k
Sweden k k
Switzerland k

TIMSS 2003 International Database User Guide 1-5
Exhibit 1.1 Countries Participating in TIMSS 2003, 1999, and 1995 (...Continued)
Syrian Arab Republic**
k
Thailand k k k
Tunisia k k k
Turkey k
United States k k k k k
Yemen** k
Benchmarking Participants
BasqueCountry, Spain
k
IndianaState, US k k k
OntarioProvince, Can.***
k k k k k
QuebecProvince, Can.***
k k k k k
* Argentina administered the TIMSS 2003 data collection one year late, and did not score and process its data in time for inclusion in this report.
** Because the characteristics of their samples are not completely known, achievement data for Syrian Arab Republic and Yemen are presented in Appendix F of the International reports.
*** Ontario and Quebec participated in TIMSS 1999 and 1995 as part of Canada.
Following the success of the TIMSS 1999 benchmarking initiative in the United States,2 in which 13 states and 14 school districts or district consortia administered the TIMSS 1999 assessment and compared their students’ achievement to student achievement world wide, TIMSS 2003 included an international benchmarking program, whereby regions of countries could participate in the study to compare to international standards. TIMSS 2003 included four benchmarking participants at the eighth grade: the Basque Country of Spain, the U.S. state of Indiana, and the Canadian provinces of Ontario and Quebec. Indiana, Ontario, and Quebec participated also at the fourth grade. Having also participated in 1999, Indiana has data at two points in time at eighth grade. Ontario and Quebec participated also in 1995 and 1999, and so have trend data across three points in time at both grade levels.
Assessment Dates
TIMSS 2003 was administered near the end of the school year in each country. In countries in the Southern Hemisphere (where the school year typically ends in November or December) the assessment was conducted in October or November 2002. In the Northern Hemisphere, the school year typically ends in June; so in these countries the assessment was conducted in April, May, or June 2003.
2 See Mullis, Martin, Gonzalez, O’Connor, Chrostowski, Gregory, Garden, and Smith (2001) for the results of the benchmarking in mathematics and Martin, Mullis, Gonzalez, O’Connor, Chrostowski, Gregory, Smith, and Garden (2001) for the results in science.
TIMSS 2003 International Database User Guide1-6
1.3 The TIMSS 2003 Mathematics and Science Assessment
As described in the TIMSS Assessment Frameworks and Specifications 2003 (Mullis, Martin, Smith, Garden, Gregory, Gonzalez, Chrostowski, and O’Connor, 2003), the TIMSS 2003 assessment of student achievement in mathematics and science was designed to measure trends in student achievement in mathematics and science at eighth and fourth grades. The assessment has ambitious coverage goals, reporting not only overall mathematics and science achievement scores, but also scores in important content areas in these subjects.
The mathematics and science assessment frameworks for TIMSS 2003 were framed by two organizing dimensions or aspects, a content domain and a cognitive domain. There were five content domains in mathematics (number, algebra,3 measurement, geometry, and data) and five in science (life science, chemistry, physics, earth science, and environmental science)4 that defined the specific mathematics and science subject matter covered by the assessment. The cognitive domains, four in mathematics (knowing facts and procedures, using concepts, solving routine problems, and reasoning) and three in science (factual knowledge, conceptual understanding, and reasoning and analysis) defined the sets of behaviors expected of students as they engaged with the mathematics and science content. Student achievement was reported in terms of performance in each content area as well as in mathematics and science overall.
The TIMSS 2003 eighth-grade assessment contained 383 items, 194 in mathematics and 189 in science (Smith Neidorf & Garden, 2004). The fourth-grade assessment contained 313 items, 161 in mathematics and 152 in science. Between one-third and two-fifths of the items at each grade level were in constructed-response format, requiring students to generate and write their own answers. The remaining questions used a multiple-choice format. In scoring the items, correct answers to most questions were worth one point. However, responses to some constructed-response questions (particularly those requiring extended responses) were evaluated for partial credit, with a fully correct answer being awarded two points. The total number of score points available for analysis thus somewhat exceeds the number of items.
Not all of the items in the TIMSS 2003 assessment were newly developed for 2003. To ensure reliable measurement of trends over time, the assessment included also items that had been used in the 1995 and 1999 assessments. For example, of the 426 score points available in the entire 2003 eighth-grade mathematics and science assessment, 47 came from items used also in 1995, 102 from items used also in 1999, and 267 from items used for the first time in 2003. At fourth grade, 70 score points came from 1995 items, and the remaining 267 from new 2003 items.
3 At the fourth grade, the algebra content domain was called Patterns and Relationships.4 At the fourth grade, there were just three content domains in science – Life Science, Physical Science, and Earth
Science.

TIMSS 2003 International Database User Guide 1-7
With the large number of mathematics and science items, it was not possible for every student to respond to all items. To ensure broad subject-matter coverage without overburdening individual students, TIMSS 2003, as in the 1995 and 1999 assessments, used a matrix-sampling technique that assigned each assessment item to one of a set of item blocks, and then assembled student test booklets by combining the item blocks according to a balanced design. Each student took one booklet containing both mathematics and science items. There were 12 student booklets at each grade level, with six blocks of items in each booklet.
Student Achievement Scores
Because the test booklet completed by each student contained only a subset of the mathematics and science items in the whole assessment item pool, each student essentially responded to just a part of the assessment, which posed a challenge in terms of determining individual student achievement scores. As described in Gonzalez, Galia, and Li (2004), TIMSS used a sophisticated psychometric scaling technique (known as item response theory scaling with conditioning and multiple imputation) to derive estimates for each student of the scores they would have received had they completed the entire assessment. These imputed student achievement scores were then used in analyzing and reporting the data.
Each student record in the TIMSS 2003 International Database contains imputed scores in mathematics and science, as well as in each of the content areas – number, algebra, measurement, geometry, and data in mathematics, and life science, chemistry, physics, earth science, and environmental science in science. Because each imputed score is a prediction based on limited information, it almost certainly includes some small amount of error. To allow analysts judge the effect of the imputation on their analyses, the TIMSS database provides five separate imputed estimates (known as “plausible values”) for each score. Accordingly, an analysis may be replicated as many as five times, using a different score each time, and the results compared to judge the impact of the imputation process. The database also includes software that enables analysts using the SAS or SPSS software systems to combine the results of the five replications into a single result and to compute standard errors that incorporate both sampling and imputation error.
The TIMSS mathematics and science achievement scales were designed to provide reliable measures of student achievement spanning 1995, 1999, and 2003. The metric of the scale was established originally with the 1995 assessment. Treating equally all the countries that participated in 1995 at the eighth grade, the TIMSS scale average over those countries was set at 500 and the standard deviation at 100. The same applied for the fourth-grade assessment. Subsequently, the results from 1999 and 2003 were linked to the 1995 data so

TIMSS 2003 International Database User Guide1-8
that the scores from the three assessments were on the same scale and may be compared for analytic purposes (see Gonzalez, Galia, & Li, 2004).
1.4 TIMSS 2003 Background Questionnaires
By gathering information about students’ educational experiences together with their mathematics and science achievement on the TIMSS assessment, it is possible to identify factors or combinations of factors related to high achievement. As in previous assessments, TIMSS in 2003 administered a broad array of questionnaires to collect data on the educational context for student achievement. For this assessment, a concerted effort was made to streamline and upgrade the questionnaires. The TIMSS 2003 contextual framework (Mullis, et al., 2003) articulated the goals of the questionnaire data collection and laid the foundation for the questionnaire development work. All of the questionnaire data are included in the TIMSS 2003 International Database.
The four types of background questionnaires used to collect information regarding the contexts in which students learn mathematics and science are described below:
• The curriculum questionnaire, completed by the National Research Coordinators with the assistance of their curriculum experts, requested information on the intended national curriculum in mathematics and science. Four versions of this questionnaire were administered: fourth-grade mathematics, fourth-grade science, eighth-grade mathematics, and eighth-grade science.
• The school questionnaire asked school principals or headmasters to provide information about the school contexts for the teaching and learning of mathematics and science. There were separate versions for fourth grade and eighth grade.
• The teacher questionnaire, completed by the mathematics and science teachers of sampled students, collected information about the teachers’ preparation and professional development, their pedagogical activities, and the implemented curriculum. At fourth grade there was one questionnaire that addressed both mathematics and science, and at eighth grade there were separate versions for mathematics teachers and science teachers.
• The student questionnaire, completed by the fourth- and eighth-grade students who were tested, sought information about the students’ home backgrounds and their experiences in learning mathematics and science. There were separate versions for fourth and eighth grades, and at eighth grade there were different versions for countries where eighth-grade

TIMSS 2003 International Database User Guide 1-9
science is taught as a single subject and countries where it is taught as separate subjects (i.e., biology, chemistry, physics, and earth science).
The contents of the TIMSS 2003 main survey questionnaires are described in the TIMSS 2003 Technical Report (see Chrostowski, 2004). The international version of each of the TIMSS 2003 background questionnaires is described in Supplement 1 of this User Guide, and the documentation of the national adaptations to each questionnaire in Supplement 2. The indices and variables other than indices derived from the student, teacher, and school questionnaires, along with detailed descriptions and analysis notes, are provided in Supplement 3.
1.5 TIMSS 2003 Student Populations
TIMSS 2003 had as its intended target populations all students at the end of their eighth and fourth years of formal schooling in the participating countries. However, for comparability with previous TIMSS assessments, the formal definition for the eighth-grade population specified all students enrolled in the upper of the two adjacent grades that contained the largest proportion of 13-year-old students at the time of testing. This grade level was intended to represent eight years of schooling, counting from the first year of primary or elementary schooling, and was indeed the eighth grade in most countries.
Similarly, for the fourth-grade population, the formal definition specified all students enrolled in the upper of the two adjacent grades that contained the largest proportion of 9-year-olds. This grade level was intended to represent four years of schooling, counting from the first year of primary or elementary schooling, and was the fourth grade in most countries.
In each country, representative samples of students were selected using a two-stage sampling design. Although countries could, with prior approval, adapt the sampling design to local circumstances, in general countries selected at least 150 schools at the first stage using probability-proportional-to-size sampling. Countries could incorporate in their sampling design important reporting variables (for example, urbanicity or school type) as stratification variables. At the second stage, one or two classes (fourth- or eighth-grade as appropriate) were randomly sampled in each school. Generally, this resulted in a sample size of at least 4,000 students per country. Some countries opted to include more schools and classes, enabling additional analyses, which resulted in larger sample sizes.
Because TIMSS utilizes a complex sampling design, it is necessary to apply sampling weights when conducting analyses of the data. The sampling weights reflect the probability of selection of each school and student, take into account any stratification or disproportional sampling of subgroups, and include

TIMSS 2003 International Database User Guide1-10
adjustments for non-response (Joncas, 2004). All of the required sampling weights have been merged with the appropriate files and are included in the international database.
1.6 Analyzing the TIMSS 2003 Data
Because statistics generated from the international database are estimates of national performance based on samples of students, rather than the values that could be calculated if every student in every country had answered every question, it is important to have a way of quantifying the uncertainty associated with these statistics. In TIMSS, the jackknife procedure is used to provide a robust estimate of the standard error of each statistic presented in the International Reports. The TIMSS jackknife standard errors include both an error component due to sampling variation and an error component due to variation among the five plausible values generated for each student. The standard errors may be used to create confidence intervals for statistics computed from the TIMSS data.
The TIMSS 2003 international database includes a set of program macros in both SAS and SPSS that enable analysts to apply the jackknife algorithm to a range of analyses of school, teacher, and student variables.
1.7 Study Management and Organization
TIMSS 2003 was conducted under the auspices of the IEA. The study was directed by Michael O. Martin and Ina V.S. Mullis of the TIMSS & PIRLS International Study Center at Boston College, Lynch School of Education, where they also direct IEA’s Progress in International Reading Literacy Study (PIRLS). The International Study Center was responsible for the design, development, and implementation of the study – including developing the assessment framework, assessment instruments, and survey procedures; ensuring quality in data collection; and analyzing and reporting the study results. Staff at the International Study Center worked closely with the organizations responsible for particular aspects of the study, the representatives of participating countries, and the TIMSS advisory committees.
In the IEA Secretariat, Hans Wagemaker, Executive Director, was responsible for overseeing fundraising and country participation. The IEA Secretariat also managed the ambitious translation verification effort conducted for the field test and main assessment and recruited international quality control monitors in each country. The IEA Data Processing Center (DPC) was responsible for processing and verifying the data from the participating countries and for constructing the international database. Working closely with the Data
TIMSS 2003 International Database User Guide 1-11
Processing Center, Statistics Canada was responsible for collecting and evaluating the sampling documentation from each country and for calculating the sampling weights. Educational Testing Service in Princeton, New Jersey provided consultation on psychometric issues as well as technical support and software for scaling the achievement data. The Project Management Team, comprising the study directors and representatives from the International Study Center, IEA Secretariat and DPC, Statistics Canada, and Educational Testing Service, met regularly throughout the study to discuss the study’s progress, procedures, and schedule.
Each participating country appointed a National Research Coordinator (NRC) and a national center responsible for all aspects of TIMSS 2003 within that country. The TIMSS & PIRLS International Study Center, in collaboration with the IEA Secretariat, DPC, and Statistics Canada, organized meetings of the NRCs several times a year to review study materials and procedures, and to provide training in student sampling, constructed-response item scoring, and data entry and database construction, and the use of the international database.
The TIMSS & PIRLS International Study Center was supported in its work by a number of advisory committees. The International Expert Panel in Mathematics and Science played a crucial role in developing the TIMSS 2003 frameworks and specifications for the assessment. The Mathematics and Science Item Development Task Forces coordinated the work of the National Research Coordinators in developing and reviewing the mathematics and science achievement items. The Science and Mathematics Item Review Committee reviewed and revised successive drafts of the achievement items and was an integral part of the scale anchoring process. The Questionnaire Item Review Committee revised the TIMSS context questionnaires for the 2003 assessment.
References
Chrostowski, S.J. (2004), “Developing the TIMSS 2003 Background Questionnaires” in M.O. Martin, I.V.S. Mullis, and S.J. Chrostowski (eds.), TIMSS 2003 Technical Report, Chestnut Hill, MA: Boston College.
Gonzalez, E.J., Galia, J., and Li, I. (2004), “Scaling Methods and Procedures for the TIMSS 2003 Mathematics and Science Scales” in M.O. Martin, I.V.S. Mullis, and S.J. Chrostowski (eds.), TIMSS 2003 Technical Report, Chestnut Hill, MA: Boston College
Joncas, M. (2004), “TIMSS 2003 Sampling Weights and Participation Rates” in M.O. Martin, I.V.S. Mullis and S.J. Chrostowski (eds.), TIMSS 2003 Technical Report, Chestnut Hill, MA: Boston College.

TIMSS 2003 International Database User Guide1-12
Mullis, I.V.S., Martin, M.O., Gonzalez, E.J., O’Connor, K.M., Chrostowski, S.J., Gregory, K.D., Garden, R.A., and Smith, T.A. (2001), Mathematics Benchmarking Report TIMSS 1999 – Eighth Grade: Achievement for U.S. States and Districts in an International Context. Chestnut Hill, MA: Boston College.
Mullis, I.V.S., Martin, M.O., Smith, T.A., Garden, R.A., Gregory, K.D., Gonzalez, E.J., Chrostowski, S.J, and O’Connor, K.M. (2003), TIMSS Assessment Frameworks and Specifications 2003 (2nd Edition). Chestnut Hill, MA: Boston College.
Mullis, I.V.S., Martin, M.O., Gonzalez, E.J., and Chrostowski, S.J. (2004), TIMSS 2003 International Mathematics Report: Findings from IEA’s Trends in International Mathematics and Science Study at the Fourth and Eighth Grades. Chestnut Hill, MA: Boston College.
Martin, M.O., Mullis, I.V.S., Chrostowski, S.J. (eds.), TIMSS 2003 Technical Report, Chestnut Hill, MA: Boston College.
Martin, M.O., Mullis, I.V.S., Gonzalez, E.J., O’Connor, K.M., Chrostowski, S.J., Gregory, K.D., Smith, T.A., and Garden, R.A. (2001), Science Benchmarking Report TIMSS 1999 – Eighth Grade: Achievement for U.S. States and Districts in an International Context. Chestnut Hill, MA: Boston College.
Martin, M.O., Mullis, I.V.S., Gonzalez, E.J., and Chrostowski, S.J. (2004), TIMSS 2003 International Science Report: Findings from IEA’s Trends in International Mathematics and Science Study at the Fourth and Eighth Grades. Chestnut Hill, MA: Boston College.
Smith Neidorf, T.A. and Garden, R.A. (2004), “Developing the TIMSS 2003 Mathematics and Science Assessment and Scoring Guides” in M.O. Martin, I.V.S. Mullis and S.J. Chrostowski (eds.), TIMSS 2003 Technical Report, Chestnut Hill, MA: Boston College.

TIMSS 2003 International Database User Guide 2-1
2 Working With the TIMSS 2003 Data
2.1 The TIMSS 2003 Assessment Frameworks
The development of the TIMSS 2003 assessment was a collaborative process spanning a two-and-a-half-year period and involving mathematics and science educators and development specialists from all over the world. Central to this effort was a major updating and revision of the existing TIMSS assessment frameworks to address changes during the past decade in curricula and the way science is taught. The resulting publication, entitled TIMSS Assessment Frameworks and Specifications 2003, serves as the basis of TIMSS 2003 (Mullis, Martin, Smith, Garden, Gregory, Gonzalez, Chrostowski, and O’Connor, 2003).
As shown in Exhibit 2.1, the mathematics and science assessment frameworks for TIMSS 2003 have two organizing dimensions or aspects, a content domain and a cognitive domain. There are five content domains in mathematics (number, algebra, measurement, geometry, and data) and five in science (life science, chemistry, physics, earth science, and environmental science)1 that define the specific mathematics and science subject matter covered by the assessment. The cognitive domains, four in mathematics (knowing facts and procedures, using concepts, solving routine problems, and reasoning) and three in science (factual knowledge, conceptual understanding, and reasoning and analysis) define the sets of behaviors expected of students as they engage with the mathematics and science content. In science, scientific inquiry was treated as an overarching assessment strand that overlaps all the fields of science and has both content- and skills-based components.
2.2 TIMSS 2003 Mathematics and Science Assessment Booklets
To address the mathematics and science topics specified in the frameworks, the pool of items and tasks included in the TIMSS assessment necessarily was extensive and would require much more testing time than could be allotted for individual students (about seven hours at grade 8 and five and one-half hours at grade 4). Therefore, as in the 1995 and 1999 assessments, TIMSS 2003 used a matrix-sampling technique that involved dividing the entire assessment pool into a set of unique item blocks, distributing these blocks across a set of
1 At fourth grade, there were only three content domains

TIMSS 2003 International Database User Guide2-2
booklets, and rotating the booklets among the students. Each student took one booklet containing both mathematics and science items.2
Block and Booklet Design
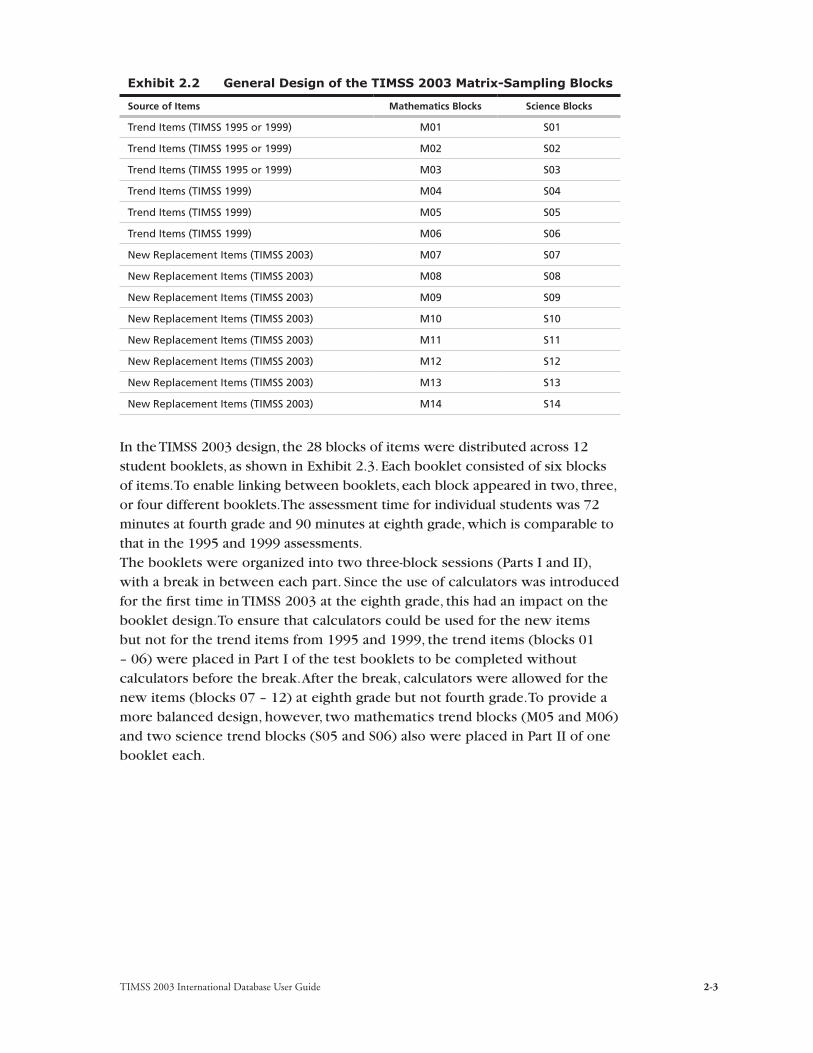
The TIMSS design for 2003 divided the 313 items at fourth grade and 383 items at eighth grade into 28 item blocks at each grade, 14 mathematics blocks labeled M01 through M14, and 14 science blocks labeled S01 through S14. Each block contained mathematics items exclusively or science items exclusively. This general block design, shown in Exhibit 2.2, was the same for both grades, although the assessment time was 12 minutes for each fourth-grade block and 15 minutes for each eighth-grade block. At the eighth grade, six blocks in each subject (blocks 01 – 06) contained secure items from 1995 and 1999 to measure trends and eight blocks (07 – 14) contained new items developed for TIMSS 2003. Since fourth grade was not included in the 1999 assessment, trend items from 1995 only were available, and these were placed in the first three blocks. The remaining 11 blocks contained items new in 2003.
2 See Mullis et al. (2003) for more information on the assessment booklet design.
Exhibit 2.1 The Content and the Cognitive Domains of the Mathematics and Science Frameworks
Mathematics Science
Content Domain Content Domain
Grade 8 Number
Algebra
Measurement
Geometry
Data
Grade 8 Life Science
Chemistry
Physics
Earth Science
Environmental Science
Grade 4 Number
Patterns and Relationships*
Measurement
Geometry
Data
Grade 4**
Life Science
Physical Science
Earth Science
Cognitive Domain Cognitive DomainKnowing Facts and Procedures
Using Concepts
Solving Routine Problems
Reasoning
Factual Knowledge
Conceptual Understanding
Reasoning and Analysis
* At fourth grade, the algebra content domain is called patterns and relationships.** At the fourth grade, there are only three content areas in science, namely life science, physical science, and
earth science.
TIMSS 2003 International Database User Guide 2-3
Exhibit 2.2 General Design of the TIMSS 2003 Matrix-Sampling Blocks
Source of Items Mathematics Blocks Science Blocks
Trend Items (TIMSS 1995 or 1999) M01 S01
Trend Items (TIMSS 1995 or 1999) M02 S02
Trend Items (TIMSS 1995 or 1999) M03 S03
Trend Items (TIMSS 1999) M04 S04
Trend Items (TIMSS 1999) M05 S05
Trend Items (TIMSS 1999) M06 S06
New Replacement Items (TIMSS 2003) M07 S07
New Replacement Items (TIMSS 2003) M08 S08
New Replacement Items (TIMSS 2003) M09 S09
New Replacement Items (TIMSS 2003) M10 S10
New Replacement Items (TIMSS 2003) M11 S11
New Replacement Items (TIMSS 2003) M12 S12
New Replacement Items (TIMSS 2003) M13 S13
New Replacement Items (TIMSS 2003) M14 S14
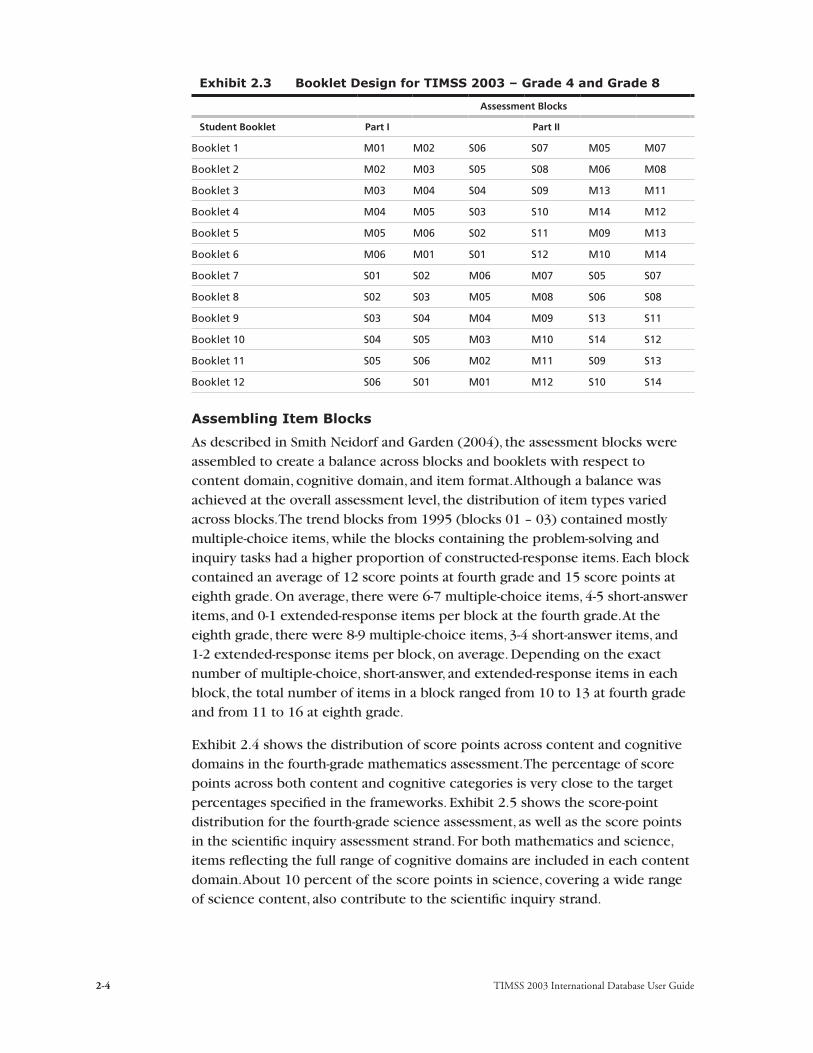
In the TIMSS 2003 design, the 28 blocks of items were distributed across 12 student booklets, as shown in Exhibit 2.3. Each booklet consisted of six blocks of items. To enable linking between booklets, each block appeared in two, three, or four different booklets. The assessment time for individual students was 72 minutes at fourth grade and 90 minutes at eighth grade, which is comparable to that in the 1995 and 1999 assessments.The booklets were organized into two three-block sessions (Parts I and II), with a break in between each part. Since the use of calculators was introduced for the first time in TIMSS 2003 at the eighth grade, this had an impact on the booklet design. To ensure that calculators could be used for the new items but not for the trend items from 1995 and 1999, the trend items (blocks 01 – 06) were placed in Part I of the test booklets to be completed without calculators before the break. After the break, calculators were allowed for the new items (blocks 07 – 12) at eighth grade but not fourth grade. To provide a more balanced design, however, two mathematics trend blocks (M05 and M06) and two science trend blocks (S05 and S06) also were placed in Part II of one booklet each.
TIMSS 2003 International Database User Guide2-4
Exhibit 2.3 Booklet Design for TIMSS 2003 – Grade 4 and Grade 8
Assessment Blocks
Student Booklet Part I Part II
Booklet 1 M01 M02 S06 S07 M05 M07
Booklet 2 M02 M03 S05 S08 M06 M08
Booklet 3 M03 M04 S04 S09 M13 M11
Booklet 4 M04 M05 S03 S10 M14 M12
Booklet 5 M05 M06 S02 S11 M09 M13
Booklet 6 M06 M01 S01 S12 M10 M14
Booklet 7 S01 S02 M06 M07 S05 S07
Booklet 8 S02 S03 M05 M08 S06 S08
Booklet 9 S03 S04 M04 M09 S13 S11
Booklet 10 S04 S05 M03 M10 S14 S12
Booklet 11 S05 S06 M02 M11 S09 S13
Booklet 12 S06 S01 M01 M12 S10 S14
Assembling Item Blocks
As described in Smith Neidorf and Garden (2004), the assessment blocks were assembled to create a balance across blocks and booklets with respect to content domain, cognitive domain, and item format. Although a balance was achieved at the overall assessment level, the distribution of item types varied across blocks. The trend blocks from 1995 (blocks 01 – 03) contained mostly multiple-choice items, while the blocks containing the problem-solving and inquiry tasks had a higher proportion of constructed-response items. Each block contained an average of 12 score points at fourth grade and 15 score points at eighth grade. On average, there were 6-7 multiple-choice items, 4-5 short-answer items, and 0-1 extended-response items per block at the fourth grade. At the eighth grade, there were 8-9 multiple-choice items, 3-4 short-answer items, and 1-2 extended-response items per block, on average. Depending on the exact number of multiple-choice, short-answer, and extended-response items in each block, the total number of items in a block ranged from 10 to 13 at fourth grade and from 11 to 16 at eighth grade.
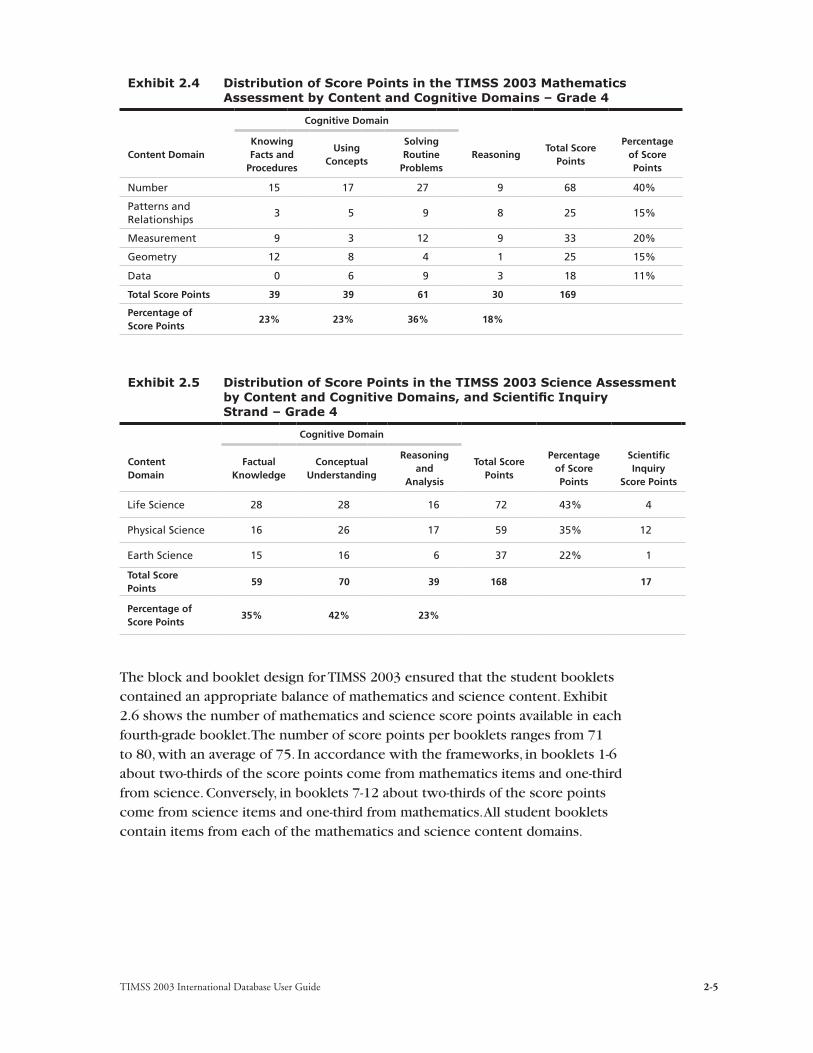
Exhibit 2.4 shows the distribution of score points across content and cognitive domains in the fourth-grade mathematics assessment. The percentage of score points across both content and cognitive categories is very close to the target percentages specified in the frameworks. Exhibit 2.5 shows the score-point distribution for the fourth-grade science assessment, as well as the score points in the scientific inquiry assessment strand. For both mathematics and science, items reflecting the full range of cognitive domains are included in each content domain. About 10 percent of the score points in science, covering a wide range of science content, also contribute to the scientific inquiry strand.
TIMSS 2003 International Database User Guide 2-5
Exhibit 2.4 Distribution of Score Points in the TIMSS 2003 Mathematics Assessment by Content and Cognitive Domains – Grade 4
Cognitive Domain
Content DomainKnowing Facts and
Procedures
Using Concepts
Solving Routine
ProblemsReasoning
Total Score Points
Percentage of Score Points
Number 15 17 27 9 68 40%
Patterns and Relationships
3 5 9 8 25 15%
Measurement 9 3 12 9 33 20%
Geometry 12 8 4 1 25 15%
Data 0 6 9 3 18 11%
Total Score Points 39 39 61 30 169
Percentage of Score Points
23% 23% 36% 18%
Exhibit 2.5 Distribution of Score Points in the TIMSS 2003 Science Assessment by Content and Cognitive Domains, and Scientific Inquiry Strand – Grade 4
Cognitive Domain
Content Domain
Factual Knowledge
Conceptual Understanding
Reasoning and
Analysis
Total Score Points
Percentage of Score Points
Scientific Inquiry
Score Points
Life Science 28 28 16 72 43% 4
Physical Science 16 26 17 59 35% 12
Earth Science 15 16 6 37 22% 1
Total Score Points
59 70 39 168 17
Percentage of Score Points
35% 42% 23%
The block and booklet design for TIMSS 2003 ensured that the student booklets contained an appropriate balance of mathematics and science content. Exhibit 2.6 shows the number of mathematics and science score points available in each fourth-grade booklet. The number of score points per booklets ranges from 71 to 80, with an average of 75. In accordance with the frameworks, in booklets 1-6 about two-thirds of the score points come from mathematics items and one-third from science. Conversely, in booklets 7-12 about two-thirds of the score points come from science items and one-third from mathematics. All student booklets contain items from each of the mathematics and science content domains.

TIMSS 2003 International Database User Guide2-6
Exhibit 2.6 Maximum Number of Score Points in TIMSS 2003 in Each Booklet by Mathematics and Science Content Domain – Grade 4
Booklet
Content Domain 1 2 3 4 5 6 7 8 9 10 11 12
Mathematics
Number 19 18 23 17 21 20 5 7 10 11 11 8
Patterns and Relationships
6 6 6 8 6 5 7 3 4 2 3 6
Measurement 12 13 7 9 11 12 6 8 2 3 5 6
Geometry 4 7 7 9 4 7 2 3 5 6 4 3
Data 8 5 6 5 4 3 4 3 2 2 4 2
Total in Mathematics 49 49 49 48 46 47 24 24 23 24 27 25
Science
Life Science 13 10 13 13 9 11 18 22 19 21 29 24
Physical Science 6 9 10 8 7 10 12 14 20 25 14 17
Earth Science 8 10 4 4 9 7 18 16 11 7 10 9
Total in Science 27 29 27 25 25 28 48 52 50 53 53 50
Total Overall 76 78 76 73 71 75 72 76 73 77 80 75
Exhibit 2.7 shows the distribution of score points across content and cognitive domains in the TIMSS 2003 eighth-grade mathematics assessment. The percentage of score points is close to the target percentages for nearly all content and cognitive categories. Exhibit 2.8 shows the distribution of score points across content and cognitive domains in the eighth-grade science assessment, as well as the number of score points in each content domain that also pertain to the scientific inquiry assessment strand. The percentages of score points in the content and cognitive domains of the science assessment also are close to their targets. As with the fourth-grade assessment, items reflecting a range of cognitive domains are included in each of the mathematics and science content domains at the eighth grade. About 14 percent of the score points in science, covering a range of science content, also contribute to the scientific inquiry strand.

TIMSS 2003 International Database User Guide 2-7
Exhibit 2.7 Distribution of Score Points in the TIMSS 2003 Mathematics Assessment by Content and Cognitive Domains – Eighth Grade
Cognitive Domain
Content DomainKnowing Facts and
Procedures
Using Concepts
Solving Routine
ProblemsReasoning
Total Score Points
Percentage of Score Points
Number 15 11 27 7 60 28%
Algebra 13 12 10 18 53 25%
Measurement 9 2 15 8 34 16%
Geometry 7 8 10 9 34 16%
Data 1 6 14 13 34 16%
Total Score Points 45 39
7655 215
Percentage of Score Points
21% 18% 35% 26%
Exhibit 2.8 Distribution of Score Points in the TIMSS 2003 Science Assessment by Content and Cognitive Domains and Scientific Inquiry Strand – Eighth Grade
Cognitive Domain
Content DomainFactual
KnowledgeConceptual
Understanding
Reasoning and
Analysis
Total Score Points
Percentage of Score Points
Scientific Inquiry
Score Points
Life Science 24 24 17 65 31% 8
Chemistry 7 16 11 34 16% 6
Physics 7 23 19 49 23% 9
Earth Science 12 13 8 33 16% 1
Environmental Science
9 4 17 30 14% 6
Total Score Points
59 80 72 211 30
Percentage of Score Points
28% 38% 34%
Exhibit 2.9 shows the maximum number of score points in mathematics, science, and overall and the distribution of score points across the mathematics and science content domains for each booklet in the eighth-grade assessment. The total score points in each booklet ranged from 90 to 97, with an average of 94. As at the fourth grade, about two-thirds of score points are from mathematics items in booklets 1-6, and about two-thirds of score points are from science

TIMSS 2003 International Database User Guide2-8
Exhibit 2.9 Maximum Number of Score Points in TIMSS 2003 in Each Booklet by Mathematics and Science Content Domain – Eighth Grade
Booklet
Content Domain 1 2 3 4 5 6 7 8 9 10 11 12
Mathematics
Number 19 22 19 14 25 17 11 10 8 7 8 7
Algebra 12 12 15 22 7 15 4 6 9 6 7 9
Measurement 13 7 11 13 11 5 4 8 8 4 5 4
Geometry 8 11 11 7 14 10 5 4 5 4 5 5
Data 11 8 6 8 4 12 8 3 2 8 5 6
Total Mathematics 63 60 62 64 61 59 32 31 32 29 30 31
Science
Life Science 10 12 7 7 9 10 20 19 18 23 21 23
Chemistry 6 4 5 6 4 5 10 10 11 8 10 10
Physics 6 8 9 6 7 9 17 11 13 19 14 13
Earth Science 4 5 3 5 8 5 9 12 11 7 7 10
Environmental Science
6 4 9 4 4 3 7 10 11 11 8 8
Total Science 32 33 33 28 32 32 63 62 64 68 60 64
Total Overall 95 93 95 92 93 91 95 93 96 97 90 95
items in booklets 7-12. Each booklet covers the full range of mathematics and science content domains.
Item Release Policy
TIMSS 2003 is the third assessment in a series of regular four-year TIMSS studies, providing trend data from 1995 and 1999. As in previous assessments, the design for TIMSS 2003 and beyond (2007, 2011, etc.) provides for retaining some of the items for the measurement of trend and releasing some items into the public domain. In TIMSS 2003, half of the 14 assessment blocks in each subject were released after the assessment results for 2003 were published. The released blocks included all three mathematics and three science blocks containing trend items from 1995 (blocks M01 – M03, S01 – S03), one mathematics and one science block of trend items from 1999 (blocks M04 and S04)3 and three blocks of new mathematics and science items and tasks developed for 2003 (blocks M09, M10, and M13; S09, S10, and S13). For TIMSS 2007, new items will be developed to take the place of the released items, and the release policy for future assessments will ensure that item blocks are cycled out after three assessments.
3 At fourth grade, these blocks contain new 2003 items.
TIMSS 2003 International Database User Guide 2-9
Scoring of Constructed-Response Items
In the TIMSS 2003 assessment, constructed-response items made up more than 40 percent of the total assessment time. Scoring guide development for the constructed-response items was a considerable effort and an integral part of the test development process for TIMSS 2003.
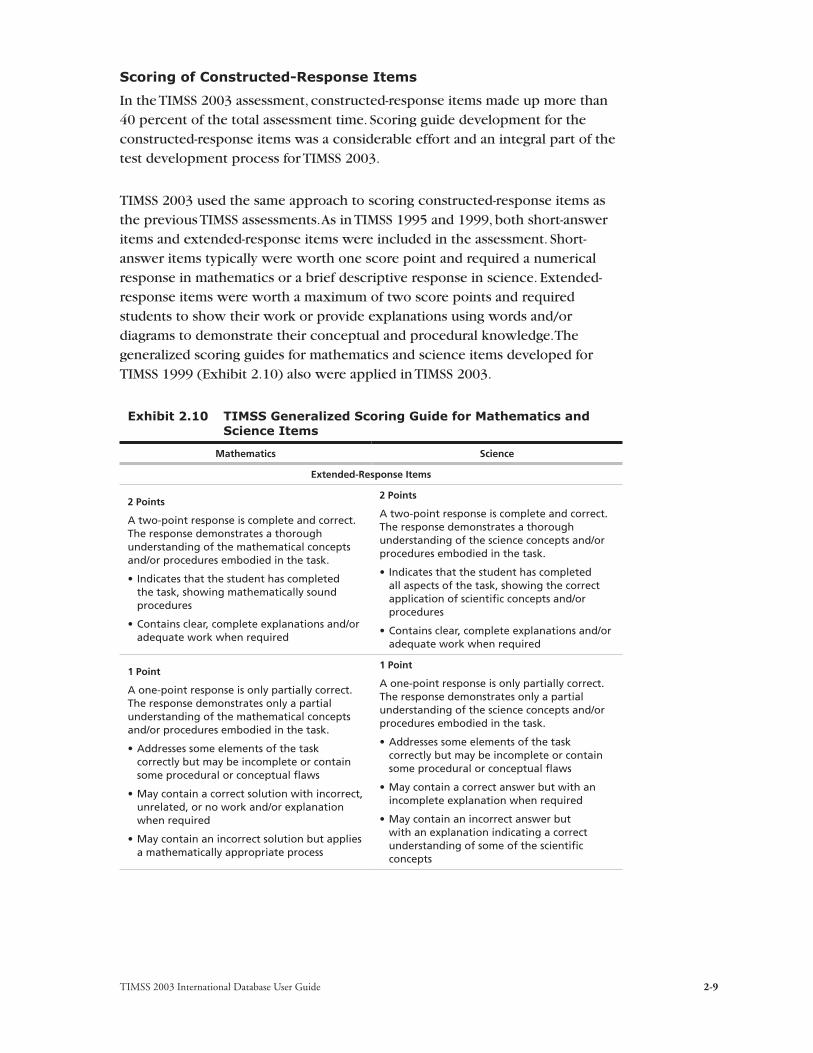
TIMSS 2003 used the same approach to scoring constructed-response items as the previous TIMSS assessments. As in TIMSS 1995 and 1999, both short-answer items and extended-response items were included in the assessment. Short-answer items typically were worth one score point and required a numerical response in mathematics or a brief descriptive response in science. Extended-response items were worth a maximum of two score points and required students to show their work or provide explanations using words and/or diagrams to demonstrate their conceptual and procedural knowledge. The generalized scoring guides for mathematics and science items developed for TIMSS 1999 (Exhibit 2.10) also were applied in TIMSS 2003.
Exhibit 2.10 TIMSS Generalized Scoring Guide for Mathematics and Science Items
Mathematics Science
Extended-Response Items
2 Points
A two-point response is complete and correct. The response demonstrates a thorough understanding of the mathematical concepts and/or procedures embodied in the task.
• Indicates that the student has completed the task, showing mathematically sound procedures
• Contains clear, complete explanations and/or adequate work when required
2 Points
A two-point response is complete and correct. The response demonstrates a thorough understanding of the science concepts and/or procedures embodied in the task.
• Indicates that the student has completed all aspects of the task, showing the correct application of scientific concepts and/or procedures
• Contains clear, complete explanations and/or adequate work when required
1 Point
A one-point response is only partially correct. The response demonstrates only a partial understanding of the mathematical concepts and/or procedures embodied in the task.
• Addresses some elements of the task correctly but may be incomplete or contain some procedural or conceptual flaws
• May contain a correct solution with incorrect, unrelated, or no work and/or explanation when required
• May contain an incorrect solution but applies a mathematically appropriate process
1 Point
A one-point response is only partially correct. The response demonstrates only a partial understanding of the science concepts and/or procedures embodied in the task.
• Addresses some elements of the task correctly but may be incomplete or contain some procedural or conceptual flaws
• May contain a correct answer but with an incomplete explanation when required
• May contain an incorrect answer but with an explanation indicating a correct understanding of some of the scientific concepts

TIMSS 2003 International Database User Guide2-10
Exhibit 2.10 TIMSS Generalized Scoring Guide for Mathematics and Science Items (…Continued)
Mathematics Science
0 Points
A zero-point response is completely incorrect, irrelevant, or incoherent.
0 Points
A zero-point response is seriously inaccurate or inadequate, irrelevant, or incoherent.
Short-Answer Items
1 Point
A one-point response is correct. The response indicates that the student has completed the task correctly.
1 Point
A one-point response is correct. The response indicates that the student has completed the task correctly.
0 Points
A zero-point response is completely incorrect, irrelevant, or incoherent.
0 Points
A zero-point response is completely incorrect, irrelevant, or incoherent.
Each constructed-response item had its own scoring guide that utilized a two-digit scoring scheme to provide diagnostic information. The first digit designated the correctness level of the response: 2 for a two-point response, 1 for a 1-point response, and 7 for an incorrect response. The second digit, combined with the first, represented a diagnostic code used to identify specific types of approaches, strategies, or common errors and misconceptions. A second digit of 0-5 was used for pre-defined international codes at each correctness level, while a second digit of 9 corresponded to “other” types of responses that fell within the appropriate correctness level but did not fit any of the pre-defined international codes. A special code (99) was used for completely blank responses. In addition to the international codes, second digit codes of 7 and 8 were available for use by national centers to monitor specific responses not already captured by the internationally-defined codes. The general TIMSS two-digit scoring scheme is summarized in Exhibit 2.11.
Exhibit 2.11 TIMSS Two-Digit Scoring Scheme for Constructed-Response Items
Two- Point Items One-Point Items
Correctness Level
International Code(s)Correctness Level
International Code(s)
Correct Responses
20 – 25:
29:
category/method #1 - #5
other correct method
Correct Responses10 – 15:
19:
category/method #1- #5
other correct method
Partial Responses
10 – 15:
19:
category/method #1- #5
other partial method
Incorrect Responses70 – 75:
79:
misconception/error #1- #5
other error
Incorrect Responses
70 – 75:
79:
misconception/error #1 - #5
other error
Blank 99
Blank 99

TIMSS 2003 International Database User Guide 2-11
2.3 TIMSS 2003 Mathematics and Science Achievement Scores
Because of its complex assessment design, with each student responding only to the items in a single booklet and not the entire assessment, TIMSS relies primarily on item response theory (IRT) scaling methods to measure trends in students’ mathematics and science achievement (Martin, et al., 2004; Gonzalez, Galia, & Li, 2004). The IRT analyses provide common mathematics and science scales on which student performance across countries and over time may be compared.
In TIMSS 2003, the mathematics and science results were summarized using a family of 2-parameter and 3-parameter IRT models for dichotomously-scored items (right or wrong), and generalized partial credit models for items with 0, 1, or 2 available score points. The IRT scaling method produces a score by averaging the responses of each student to the items that he or she took in a way that takes into account the difficulty and discriminating power of each item. As with any method of scaling student achievement, measurement is most reliable when a student responds to a large number of items, and is less reliable when the number of items is small. In the matrix-sampling approach adopted by TIMSS, with each student responding to a limited number of items, and given TIMSS’ ambitious reporting goals – scales for two subjects (mathematics and science) and for five content domains in each subject – each student may respond to just a few items related to a particular scale.
To improve reliability, the TIMSS scaling methodology draws on information about students’ background characteristics as well as their responses to the achievement items. This approach, known as “conditioning,” enables reliable scores to be produced even though individual students responded to relatively small subsets of the total mathematics or science item pool. Rather than estimating student scores directly, TIMSS combines information about item characteristics, student responses to the items that they took, and student background information to estimate student achievement distributions.
Having determined the overall achievement distribution, TIMSS estimates each student’s achievement on the entire assessment conditional on the student’s responses to the items that they took and the student’s background characteristics. Because there is some error inherent in this imputation process, TIMSS draws five such estimates, or “plausible values,” for each student on each of the scales. Each student, therefore, has five estimates of his or her achievement on the TIMSS mathematics and science scales. Analyses may be replicated with each of the five plausible values to assess the impact of imputation error. Additionally, the SAS and SPSS macros that accompany the TIMSS 2003 international database may be used to combine the results from the five replicated analyses to compute various statistics and their standard errors.

TIMSS 2003 International Database User Guide2-12
The TIMSS mathematics and science achievement scales were designed to provide reliable measures of student achievement spanning 1995, 1999, and 2003. The metric of the scale was established originally with the 1995 assessment. Treating equally all the countries that participated in 1995 at the eighth grade, the TIMSS scale average over those countries was set at 500 and the standard deviation at 100. The same applied for the fourth-grade assessment. Since the countries varied in size, each country was weighted to contribute equally to the mean and standard deviation of the scale. The average and standard deviation of the scale scores are arbitrary and do not affect scale interpretation. To preserve the metric of the original 1995 scale, the 1999 eighth-grade assessment was scaled using students from the countries that participated in both 1995 and 1999. Then students from the countries that tested in 1999 but not 1995 were assigned scores on the basis of the scale.
At the eighth grade, TIMSS developed the 2003 scale in the same way as in 1999, preserving the metric first with students from countries that participated in both 1999 and 2003, and then assigning scores on the basis of the scale to students tested in 2003 but not the earlier assessment. At fourth grade, because there was no assessment in 1999, the 2003 and 1995 data were linked directly together using students from countries that participated in both assessments, and the students tested in 2003 but not 1995 were assigned scores on the basis of the scale.
In addition to the scales for mathematics and science overall, TIMSS created IRT scales for each of the mathematics and science content domains for the 2003 data. These included number, algebra, measurement, geometry, and data in mathematics; and life science, chemistry, physics, earth science, and environmental science in science.4 However, insufficient common items were used in 1995 and 1999 to establish reliable IRT content area scales for trend purposes.
Achievement Scores in the Student Files
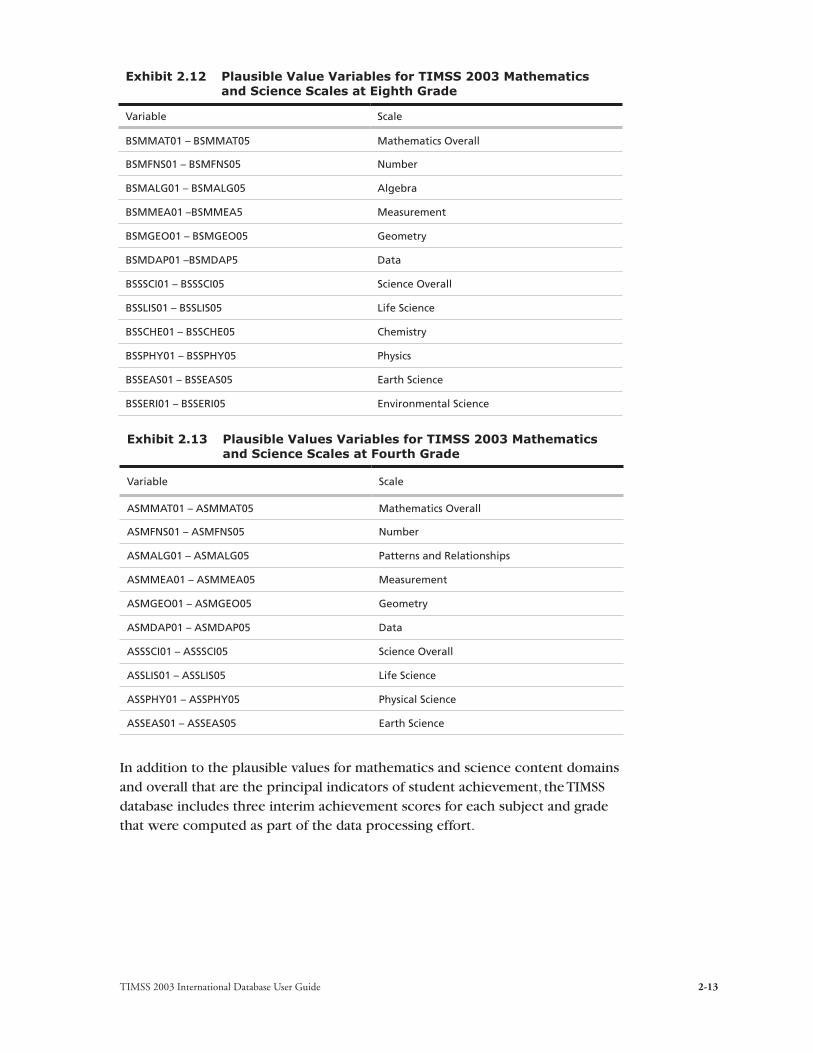
The principal measures of student achievement in mathematics and science contained in the TIMSS 2003 international database are the plausible values described above. As shown in Exhibits 2.12 and 2.13, the first letter of the variable name identifies the student population. Eighth-grade variables begin with the letter “B” and fourth-grade variables with the letter “A.” This convention has been followed with other background and derived variables and files included in the database.
4 At fourth grade there are just three science content scales: life science, physical science, and earth science.
TIMSS 2003 International Database User Guide 2-13
Exhibit 2.12 Plausible Value Variables for TIMSS 2003 Mathematics and Science Scales at Eighth Grade
Variable Scale
BSMMAT01 – BSMMAT05 Mathematics Overall
BSMFNS01 – BSMFNS05 Number
BSMALG01 – BSMALG05 Algebra
BSMMEA01 –BSMMEA5 Measurement
BSMGEO01 – BSMGEO05 Geometry
BSMDAP01 –BSMDAP5 Data
BSSSCI01 – BSSSCI05 Science Overall
BSSLIS01 – BSSLIS05 Life Science
BSSCHE01 – BSSCHE05 Chemistry
BSSPHY01 – BSSPHY05 Physics
BSSEAS01 – BSSEAS05 Earth Science
BSSERI01 – BSSERI05 Environmental Science
Exhibit 2.13 Plausible Values Variables for TIMSS 2003 Mathematics and Science Scales at Fourth Grade
Variable Scale
ASMMAT01 – ASMMAT05 Mathematics Overall
ASMFNS01 – ASMFNS05 Number
ASMALG01 – ASMALG05 Patterns and Relationships
ASMMEA01 – ASMMEA05 Measurement
ASMGEO01 – ASMGEO05 Geometry
ASMDAP01 – ASMDAP05 Data
ASSSCI01 – ASSSCI05 Science Overall
ASSLIS01 – ASSLIS05 Life Science
ASSPHY01 – ASSPHY05 Physical Science
ASSEAS01 – ASSEAS05 Earth Science
In addition to the plausible values for mathematics and science content domains and overall that are the principal indicators of student achievement, the TIMSS database includes three interim achievement scores for each subject and grade that were computed as part of the data processing effort.

TIMSS 2003 International Database User Guide2-14
Raw Scores
ASMSCPT, BSMSCPT
Number of raw score points obtained by the student on the mathematics items, for fourth and eighth grades.
ASSSCPT, BSSSCPT
Number of raw score points obtained by the student on the science items, for fourth and eighth grades.
After the achievement items were scored (1 for correct, 0 for incorrect for multiple choice items; 0, 1, or 2 points in the case of the constructed-response items), raw scores were computed by adding the number of points obtained by each student over all the items in the student’s test book. Because the raw score is dependent on the number of items in the student’s test book, and since this number varies from test book to test book, the raw scores are not comparable across booklets, and so are of limited utility. Their main value in the database is as a validity check for analysts who wish to apply a different scoring approach to the TIMSS items. Raw scores for the individual students can be found in the Student Background and Student Achievement data files.
Standardized Raw Scores
ASMSTDR, BSMSTDR
Standardized mathematics raw score, for fourth and eighth grades.
ASSSTDR, BSSSTDR
Standardized science raw score, for fourth and eighth grades.
Because of the difficulty in making any comparisons across the test booklets using only the number of raw score points obtained on a set of items, raw scores were standardized by booklet to provide a simple score that could be used in comparisons across booklets in the same year in preliminary analyses. The standardized score was computed so that the weighted mean score within each booklet in a country was equal to 50, and the weighted standard deviation was equal to 10. The standardized raw scores for the individual students can be found in the Student Background and Student Achievement data files.

TIMSS 2003 International Database User Guide 2-15
National Rasch Scores
ASMNRSC, BSMNRSC
National Rasch Mathematics Score.
ASSNRSC, BSSNRSC
National Rasch Science Score.
The national Rasch scores were computed to facilitate preliminary item analyses that were conducted prior to the TIMSS 2003 IRT scaling. Their main purpose was to provide a preliminary measure of overall mathematics or science achievement that could be used as a criterion variable in studies of item discrimination. The national Rasch scores were standardized to have a mean score of 150 and a standard deviation of 10 within each country. Because each country has the same mean score and dispersion, these scores are not useful for international comparisons.
National Rasch scores can be found in the Student Background and Student Achievement data files.
International Benchmarks of Achievement
To help users of the TIMSS achievement results understand what performance on the TIMSS mathematics and science achievement scales means in terms of the mathematics and science students know and can do, TIMSS identified four points on the scales to serve as international benchmarks. As shown in Exhibit 2.14, the benchmark scores are 625, 550, 475, and 400, corresponding to the Advanced International Benchmark, the High International Benchmark, the Intermediate International Benchmark, and the Low International Benchmark, respectively. TIMSS used a technique known as scale anchoring to summarize and describe student achievement at these four points on the mathematics and science scales. The TIMSS 2003 International Mathematics and Science Reports (Mullis, et al., 2004; Martin, et al., 2004) present the results of this scale anchoring, and report the percentage of students in each country reaching each of the international benchmarks.
To facilitate analysts in using the international benchmarks in secondary analysis, the TIMSS 2003 international database contains a set of variables indicating
Exhibit 2.14 TIMSS 2003 International Benchmarks for Eighth and Fourth Grade Mathematics and Science
Scale Score International Benchmark
625 Advanced International Benchmark
550 High International Benchmark
475 Intermediate International Benchmark
400 Low International Benchmark

TIMSS 2003 International Database User Guide2-16
which international benchmark the student reached. There is a benchmark variable for each plausible value for each of mathematics and science at fourth and eighth grades. The benchmark variables are as follows:
ASMIBM01-5; BSMIBM01-5
International Mathematics Benchmarks reached at fourth and eighth grades, for each of the five plausible values.
ASSIBM01-5: BSSIBM01-5
International Science Benchmarks reached at fourth and eighth grades, for each of the five plausible values.
The following codes are used for the benchmark variables:
Code 1 Student performed below the Low International Benchmark.
Code 2 Student performed at or above the Low International Benchmark, but below the Intermediate International Benchmark.
Code 3 Student performed at or above the Intermediate International Benchmark but below the High International Benchmark.
Code 4 Student performed at or above the High International Benchmark but below the Advanced International Benchmark.
Code 5 Student performed at or above the Advanced International Benchmark.
2.4 The TIMSS 2003 Background Questionnaires
For a fuller appreciation of what the TIMSS achievement results mean and how they may be used to improve student learning in mathematics and science, it is important to understand the contexts in which students learn. Therefore, TIMSS collected extensive information about the contexts for learning mathematics and science by administering a range of background questionnaires. Four types of background questionnaires were used in TIMSS 2003 to gather information at various levels of the educational system: (i) curriculum questionnaires addressed issues of system-wide curriculum design and support and curricular emphasis in mathematics and science; (ii) a school questionnaire asked school principals/headmasters of the students tested to provide information about curricular and instructional arrangements, school resources, and school climate; (iii) teacher questionnaires asked mathematics and science teachers of the students tested about their preparation to teach, their teaching activities and approaches, their attitudes toward teaching the subject matter, and the

TIMSS 2003 International Database User Guide 2-17
curriculum that is implemented in the classroom; and (iv) a questionnaire for the students tested sought information about their home backgrounds, their attitudes toward learning mathematics and science, and their experiences in learning these subjects.
The questionnaires were based on the contextual framework included in the TIMSS Assessment Frameworks and Specifications 2003 (Mullis et al., 2003). The contextual framework specifies the major characteristics of the educational and social contexts to be studied and identifies the areas to be addressed in the background questionnaires. Questionnaires were developed at both the fourth and eighth grades.
• The curriculum questionnaire addressed issues of the intended national curriculum in mathematics and science. Four versions of this questionnaire were administered: fourth-grade mathematics, fourth-grade science, eighth-grade mathematics, and eight-grade science.
• The school questionnaire asked school principals or headmasters to provide information about the school contexts for the teaching and learning of mathematics and science. There were separate versions for fourth grade and eighth grade.
• The teacher questionnaire collected information about the teachers’ preparation and professional development, their pedagogical activities, and the implemented curriculum. At fourth grade there was one questionnaire that addressed both mathematics and science, and at eighth grade there were separate versions for mathematics teachers and science teachers.
• The student questionnaire sought information about the students’ home backgrounds and their experiences in learning mathematics and science. There were separate versions for fourth grade and eighth grade, and at eighth grade there were different versions for countries where eighth-grade science is taught as a single integrated subject and countries where it is taught as separate subjects (i.e., biology, chemistry, physics, earth science).
The fourth- and eighth-grade curriculum questionnaires for mathematics and science were addressed to National Research Coordinators, who were asked to supply information about their nation’s mathematics and science curricula in the target grades, drawing on the expertise of curriculum specialists in their countries. The curriculum questionnaires were designed to collect basic information about the organization of and support for the intended mathematics

TIMSS 2003 International Database User Guide2-18
and science curriculum in each country, and whether the mathematics and science topics included in the TIMSS 2003 assessment were included in the country’s intended curriculum through the target grade. The four versions of the curriculum questionnaire were the same in structure and very similar in content, with the mathematics and science versions tailored to the subject matter and grade level wherever necessary. One notable difference was that the eighth-grade science curriculum questionnaire included a question asking whether eighth-grade science was taught as a single integrated subject or as separate science subjects.
Some of the central questions addressed in the curriculum questionnaire included:
• Is there a national curriculum in mathematics/science at the target grade?
• Does the country administer public examinations in mathematics/science that have consequences for individual students?
• What methods are used to support and monitor implementation of the national mathematics/science curriculum?
• How does the national curriculum address the issue of students with different levels of ability?
• What aspects of the teaching and learning of mathematics/science are emphasized in the national curriculum?
• What are the requirements for becoming a mathematics/science teacher, and is there a process to license or certify teachers?
• Are the topics included in the TIMSS 2003 assessment included in the national curriculum, and if so, for what proportion of students, and at what grades are the topics intended to be taught?
The complete contents of the TIMSS 2003 mathematics and science curriculum questionnaires at fourth and eighth grades are described in Exhibit 2.15.

TIMSS 2003 International Database User Guide 2-19
Exhibit 2.15 Content of the TIMSS 2003 Mathematics and Science Curriculum Questionnaires at the Eighth and Fourth Grades
Item Number
Item Content Description
Mathematics Grade 8
Mathematics Grade 4
Science Grade 8
Science Grade 4
1 1 1 1 National curriculum
Whether the country has a national mathematics/science curriculum at the target grade, the year introduced, and whether under revision
- - 2 - Separate sciences
Whether science is taught as separate subjects by eighth grade, and the specific subjects and grades taught
2 2 3 2 Public examinations
Whether the country administers public examinations in mathematics/science that have consequences for individual students, the authority that administers such examinations, and the grades at which they are given
3 3 4 3 Methods used to help implement the national curriculum
Whether the country uses various methods to help monitor implementation of the national mathematics/science curriculum at the target grade
4 4 5 4 Specification of instructional time
Whether the national curriculum specifies the percentage of instructional time intended to be devoted to mathematics/science at various grades, and the percentage of time designated
5 5 6 5 Differentiation of the curriculum
How the national mathematics/science curriculum at the target grade addresses the issue of students with different levels of ability
6 6 7 6 Emphasis on approaches and processes
How much emphasis the national mathematics/science curriculum at the target grade places on various approaches and processes
7 7 - - Policy on calculator use
Whether the national mathematics curriculum contains statements/policies on the use of calculators at the target grade, and a brief description of such policies
- - 8 7 Policy on emphasis given scientific inquiry
Whether the national science curriculum contains statements/policies about the emphasis that should be placed on scientific inquiry at the target grade, and a brief description of such policies

TIMSS 2003 International Database User Guide2-20
Exhibit 2.15 Content of the TIMSS 2003 Mathematics and Science Curriculum Questionnaires at the Eighth and Fourth Grades (…Continued)
Item Number
Item Content Description
Mathematics Grade 8
Mathematics Grade 4
Science Grade 8
Science Grade 4
8 8 9 8 Policy on computer use
Whether the national mathematics/science curriculum contains statements/policies on the use of computers at the target grade, and a brief description of such policies
9 9 10 9 Preparation of teachers in how to teach the intended curriculum
Whether mathematics/science teachers at the target grade receive specific preparation in how to teach the intended curriculum as part of their pre-service or in-service education, and a brief description of such preparation
10 10 11 10 Teaching requirements
Whether mathematics/science teachers at the target grade must fulfill various requirements in order to teach
11 11 12 11 Licensure process
Whether there is a process to license or certify mathematics/science teachers at the target grade, and what entity licenses the teachers
12 12 13 12 The teaching of the TIMSS topics
Whether the TIMSS mathematics/science topics are included in the national curriculum through the target grade, the proportion of students intended to be taught the topics, and the grade(s) at which the topics are intended to be taught
The fourth- and eighth-grade school questionnaires were to be completed by the school principal or headmaster of each school sampled for the study. They were designed to collect information concerning some of the major factors thought to influence student achievement in mathematics and science. The fourth- and eighth-grade versions of the school questionnaire are nearly identical, although two of the questions are tailored to the appropriate grade. The school questionnaire was designed to be completed in about 30 minutes.
Some of the main questions addressed in the school questionnaire were:
• What is the school climate like?
• What are the school’s expectations of parents?

TIMSS 2003 International Database User Guide 2-21
• How does the school organize mathematics/science instruction for students with different levels of ability?
• How difficult was it to fill mathematics/science teaching vacancies, and were any incentives used to recruit or retain teachers?
• What types of professional development activities did mathematics/science teachers engage in?
• How safe is the school environment?
• Is the school’s capacity to provide instruction affected by a shortage of various resources?
• What is the availability of computers for educational purposes in the school, and how many have access to the Internet?
The complete contents of the TIMSS 2003 school questionnaires at fourth and eighth grades are described in Exhibit 2.16.
Exhibit 2.16 Content of the TIMSS 2003 School Questionnaires at the Eighth and Fourth Grades
Item Number
Item Content DescriptionGrade 8 Grade 4
1 1 Grade levels Grade range of the school
2 2 Enrollment Total school enrollment in all grades and in the target grade
3 3 Community size Size of the community in which the school is located
4 4 Absenteeism Percentage of students absent from school on a typical school day
5 5 Stability/ mobility of student body
Percentage of students enrolled at the beginning of the school year who were still enrolled at the time of testing, and percentage of students who enrolled after the beginning of the school year
6 6 Students’ background Percentage of students who come from economically disadvantaged or affluent homes, and percentage of students whose native language is the language of the test
7 7 School climate Principal’s perception of teachers’ job satisfaction and expectations for student achievement; of parental support and involvement; and of students’ regard for school property and desire to do well in school
8 8 Principal’s experience Number of years as a principal of this school
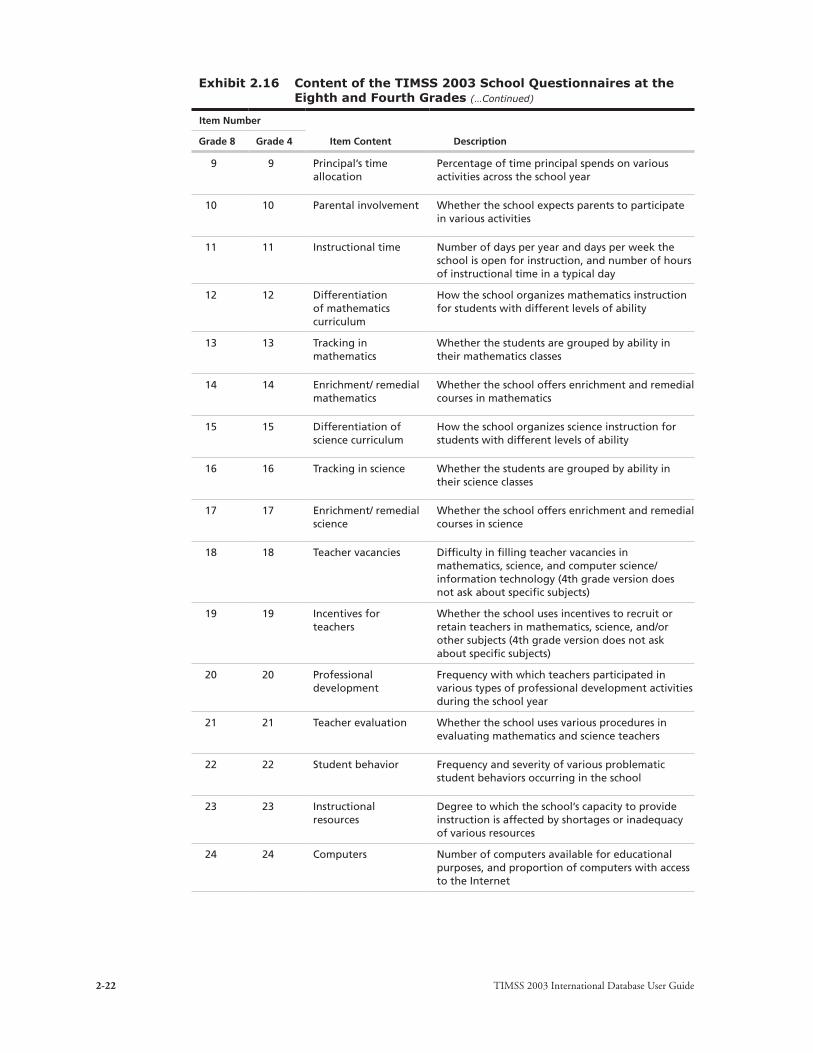
TIMSS 2003 International Database User Guide2-22
Exhibit 2.16 Content of the TIMSS 2003 School Questionnaires at the Eighth and Fourth Grades (…Continued)
Item Number
Item Content DescriptionGrade 8 Grade 4
9 9 Principal’s time allocation
Percentage of time principal spends on various activities across the school year
10 10 Parental involvement Whether the school expects parents to participate in various activities
11 11 Instructional time Number of days per year and days per week the school is open for instruction, and number of hours of instructional time in a typical day
12 12 Differentiation of mathematics curriculum
How the school organizes mathematics instruction for students with different levels of ability
13 13 Tracking in mathematics
Whether the students are grouped by ability in their mathematics classes
14 14 Enrichment/ remedial mathematics
Whether the school offers enrichment and remedial courses in mathematics
15 15 Differentiation of science curriculum
How the school organizes science instruction for students with different levels of ability
16 16 Tracking in science Whether the students are grouped by ability in their science classes
17 17 Enrichment/ remedial science
Whether the school offers enrichment and remedial courses in science
18 18 Teacher vacancies Difficulty in filling teacher vacancies in mathematics, science, and computer science/information technology (4th grade version does not ask about specific subjects)
19 19 Incentives for teachers
Whether the school uses incentives to recruit or retain teachers in mathematics, science, and/or other subjects (4th grade version does not ask about specific subjects)
20 20 Professional development
Frequency with which teachers participated in various types of professional development activities during the school year
21 21 Teacher evaluation Whether the school uses various procedures in evaluating mathematics and science teachers
22 22 Student behavior Frequency and severity of various problematic student behaviors occurring in the school
23 23 Instructional resources
Degree to which the school’s capacity to provide instruction is affected by shortages or inadequacy of various resources
24 24 Computers Number of computers available for educational purposes, and proportion of computers with access to the Internet

TIMSS 2003 International Database User Guide 2-23
Exhibit 2.16 Content of the TIMSS 2003 School Questionnaires at the Eighth and Fourth Grades (…Continued)
Item Number
Item Content DescriptionGrade 8 Grade 4
25 25 Technology support Whether there is anyone available to help teachers use information and communication technology for teaching and learning, and description of that person
The teacher questionnaires were designed to gather information about the classroom contexts for the teaching and learning of mathematics and science, and about the implemented curriculum in these subjects. For each participating school at the fourth grade, there was one teacher questionnaire addressed to the classroom teacher of the sampled class. At eighth grade, for each sampled school a single mathematics class was sampled for the TIMSS 2003 assessment. The mathematics teacher of that class was asked to complete a mathematics teacher questionnaire, and the science teacher(s) of the students in that class was asked to complete a science teacher questionnaire, which paralleled that for the mathematics teacher. Although the general background questions were essentially the same for all versions, questions pertaining to instructional practices, content coverage, and teachers’ views about teaching the subject matter were tailored toward mathematics or science. Many questions, such as those related to classroom characteristics and activities, and homework and assessment, were answered with respect to the specific classes of the sampled TIMSS students. Because the fourth- and eighth-grade versions of the teacher questionnaire were designed to be similar in length, and because the fourth-grade version included questions about both mathematics and science, some questions had to be eliminated or shortened in the fourth-grade version.
Some of the primary questions addressed in the teacher questionnaire were:
• What is teachers’ educational background, and do they have a teaching license or certificate?
• How many years of pre-service teacher training did teachers have, and how many years have they been teaching?
• How ready do teachers feel they are to teach various topics at the target grade?
• What types of professional development have teachers participated in?
• What is the teaching load of teachers, and how do they spend their time both during and outside the formal school day (eighth grade only)?
• What are teachers’ attitudes toward teaching the subject matter, and their perceptions regarding school climate and school safety?

TIMSS 2003 International Database User Guide2-24
• What instructional activities are provided to the students in the TIMSS class, and how do the students spend their time during their mathematics and science lessons?
• Do various student- and resource-related factors limit how teachers instruct the students in the TIMSS class (eighth grade only)?
• What percentages of time are devoted to the various mathematics and science content areas in teaching the TIMSS class?
• When have the students in the TIMSS class been taught the topics included in the TIMSS 2003 assessment?
• Do students have calculators available to them, and how do they use them (mathematics only)?
• Do students have computers available to them, and how do they use them?
• How much homework is assigned to students?
• How often are students given a test or examination, and what types of questions are included (eighth grade only)?
The TIMSS 2003 teacher questionnaires were designed to take about 45 minutes to complete. The complete contents of the TIMSS 2003 teacher questionnaires are described in Exhibit 2.17 for the eighth grade and in Exhibit 2.18 for the fourth grade.
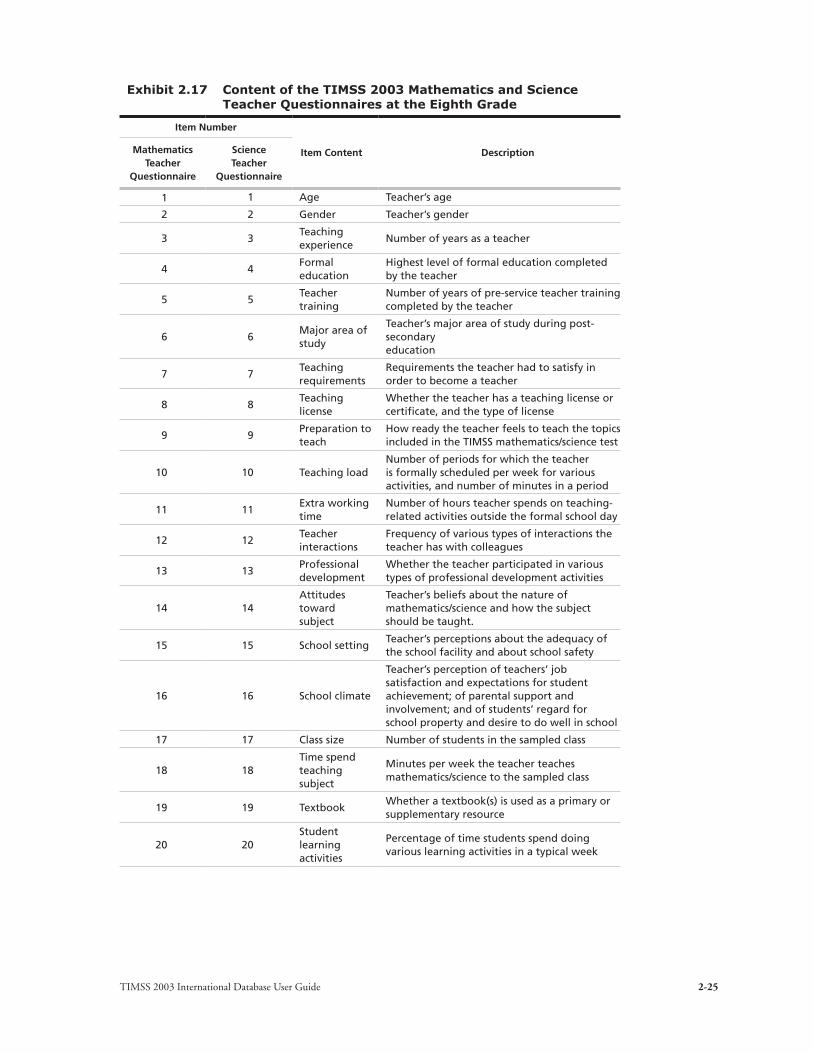
TIMSS 2003 International Database User Guide 2-25
Exhibit 2.17 Content of the TIMSS 2003 Mathematics and Science Teacher Questionnaires at the Eighth Grade
Item Number
Item Content DescriptionMathematics Teacher
Questionnaire
Science Teacher
Questionnaire
1 1 Age Teacher’s age
2 2 Gender Teacher’s gender
3 3Teaching experience
Number of years as a teacher
4 4Formal education
Highest level of formal education completed by the teacher
5 5Teacher training
Number of years of pre-service teacher training completed by the teacher
6 6Major area of study
Teacher’s major area of study during post-secondary education
7 7Teaching requirements
Requirements the teacher had to satisfy in order to become a teacher
8 8Teaching license
Whether the teacher has a teaching license or certificate, and the type of license
9 9Preparation to teach
How ready the teacher feels to teach the topics included in the TIMSS mathematics/science test
10 10 Teaching loadNumber of periods for which the teacher is formally scheduled per week for various activities, and number of minutes in a period
11 11Extra working time
Number of hours teacher spends on teaching-related activities outside the formal school day
12 12Teacher interactions
Frequency of various types of interactions the teacher has with colleagues
13 13Professional development
Whether the teacher participated in various types of professional development activities
14 14Attitudes toward subject
Teacher’s beliefs about the nature of mathematics/science and how the subject should be taught.
15 15 School settingTeacher’s perceptions about the adequacy of the school facility and about school safety
16 16 School climate
Teacher’s perception of teachers’ job satisfaction and expectations for student achievement; of parental support and involvement; and of students’ regard for school property and desire to do well in school
17 17 Class size Number of students in the sampled class
18 18Time spend teaching subject
Minutes per week the teacher teaches mathematics/science to the sampled class
19 19 TextbookWhether a textbook(s) is used as a primary or supplementary resource
20 20Student learning activities
Percentage of time students spend doing various learning activities in a typical week

TIMSS 2003 International Database User Guide2-26
Exhibit 2.17 Content of the TIMSS 2003 Mathematics and Science Teacher Questionnaires at the Eighth Grade (…Continued)
Item Number
Item Content DescriptionMathematics Teacher
Questionnaire
Science Teacher
Questionnaire
21 21Content-related activities
Frequency with which the teacher asks students to do various content-related activities in mathematics/science
22 22Factors limiting teaching
Extent to which the teacher perceives various student and resource factors to limit teaching
23 23Emphasis on content areas
Percentage of time spent on mathematics/science content areas over the course of the year
24 24Topic coverage
When the students were taught the TIMSS mathematics/science topics, by content area
25 -Calculator use policy
Whether the students are permitted to use calculators during mathematics lessons
26 -Calculator availability
Proportion of students that have access to calculators during mathematics lessons
27 -Graphing calculator availability
Proportion of students that have access to graphing calculators during mathematics lessons
28 - Calculator useFrequency with which the students use calculators for various learning activities
29 -Calculators in test/exams
How often the students are allowed to use calculators during tests or examinations
30 25Computer availability
Whether the students have access to computers during mathematics/science lessons and whether computers have access to Internet
31 26 Computer useFrequency with which the students use computers for various learning activities
32 27 HomeworkWhether the teacher assigns mathematics/science homework
33 28Frequency of homework
How often the teacher assigns mathematics/science homework
34 29Amount of homework
Number of minutes it would take an average student to complete a mathematics/science homework assignment
35 30Type of homework
Frequency with which the teacher assigns various types of homework
36 31Use of homework
How often the teacher uses mathematics/science homework for various purposes
37 32 AssessmentFrequency with which the teacher gives a mathematics/science test or examination
38 33Question format
Item formats the teacher typically uses in mathematics/science tests or examinations

TIMSS 2003 International Database User Guide 2-27
Exhibit 2.17 Content of the TIMSS 2003 Mathematics and Science Teacher Questionnaires at the Eighth Grade (…Continued)
Item Number
Item Content DescriptionMathematics Teacher
Questionnaire
Science Teacher
Questionnaire
39 34Type of questions
Types of questions the teacher uses in mathematics/ science tests or examinations
Exhibit 2.18 Content of the TIMSS 2003 Teacher Questionnaire at the Fourth Grade
Item Number
Item Content Description
1 Age Teacher’s age
2 Gender Teacher’s gender
3 Teaching experience Number of years as a teacher
4 Formal education Highest level of formal education completed by the teacher
5 Teacher trainingNumber of years of pre-service teacher training completed by the teacher
6 Major area of studyTeacher’s major area of study during post-secondary education
7Teaching requirements
Requirements the teacher had to satisfy in order to become a teacher
8 Teaching licenseWhether the teacher has a teaching license or certificate, and the type of license
9 School climate
Teacher’s perception of teachers’ job satisfaction and expectations for student achievement; of parental support and involvement; and of students’ regard for school property and desire to do well in school
10 School settingTeacher’s perceptions about the adequacy of the school facility and about school safety
11 Teacher interactionsFrequency of various types of interactions the teacher has with colleagues
12Preparation to teach mathematics
How ready the teacher feels to teach the topics included in the TIMSS mathematics test
13Professional development in mathematics
Whether the teacher participated in various types of professional development activities for mathematics teaching
14Mathematics class size
Number of students in the sampled class for mathematics, and number of those in the fourth grade
15Time spend teaching mathematics
Minutes per week the teacher teaches mathematics to the sampled class
16Mathematics textbook
Whether a textbook(s) is used as a primary or supplementary resource in teaching mathematics
17Student learning activities in mathematics
Percentage of time students spend doing various learning activities in a typical week of mathematics lessons

TIMSS 2003 International Database User Guide2-28
Exhibit 2.18 Content of the TIMSS 2003 Teacher Questionnaire at the Fourth Grade (…Continued)
Item Number
Item Content Description
18 Calculator use policyWhether the students are permitted to use calculators during mathematics lessons
19 Calculator availabilityProportion of students that have access to calculators during mathematics lessons
20 Calculator useFrequency with which the students use calculators for various learning activities
21Calculators in test/exams
How often the students are allowed to use calculators during tests or examinations
22Computer availability for mathematics
Whether the students have access to computers during mathematics lessons and whether computers have access to the Internet
23Computer use in mathematics
Frequency with which the students use computers for various learning activities in mathematics
24Mathematics content-related activities
Frequency with which the teacher asks students to do various content-related activities in mathematics
25Emphasis on mathematics content areas
Percentage of time spent on mathematics content areas over the course of the year
26Mathematics topic coverage
When the students were taught the TIMSS mathematics topics, by content area
27Mathematics homework
Whether the teacher assigns mathematics homework
28Frequency of mathematics homework
How often the teacher assigns mathematics homework
29Amount of mathematics homework
Number of minutes it would take an average student to complete a mathematics homework assignment
30Preparation to teach science
How ready the teacher feels to teach the topics included in the TIMSS science test
31Professional development in science
Whether the teacher participated in various types of professional development activities for science teaching
32 Science class sizeNumber of students in the sampled class for science, and number of those in the fourth grade
33Time spend teaching science
Minutes per week the teacher teaches science to the sampled class
34 Science textbookWhether a textbook(s) is used as a primary or supplementary resource in teaching science
38Student learning activities in science
Percentage of time students spend doing various learning activities in a typical week of science lessons
35Computer availability for science
Whether the students have access to computers during science lessons and whether computers have access to the Internet
36Computer use in science
Frequency with which the students use computers for various learning activities in science
37Science content-related activities
Frequency with which the teacher asks students to do various content-related activities in science
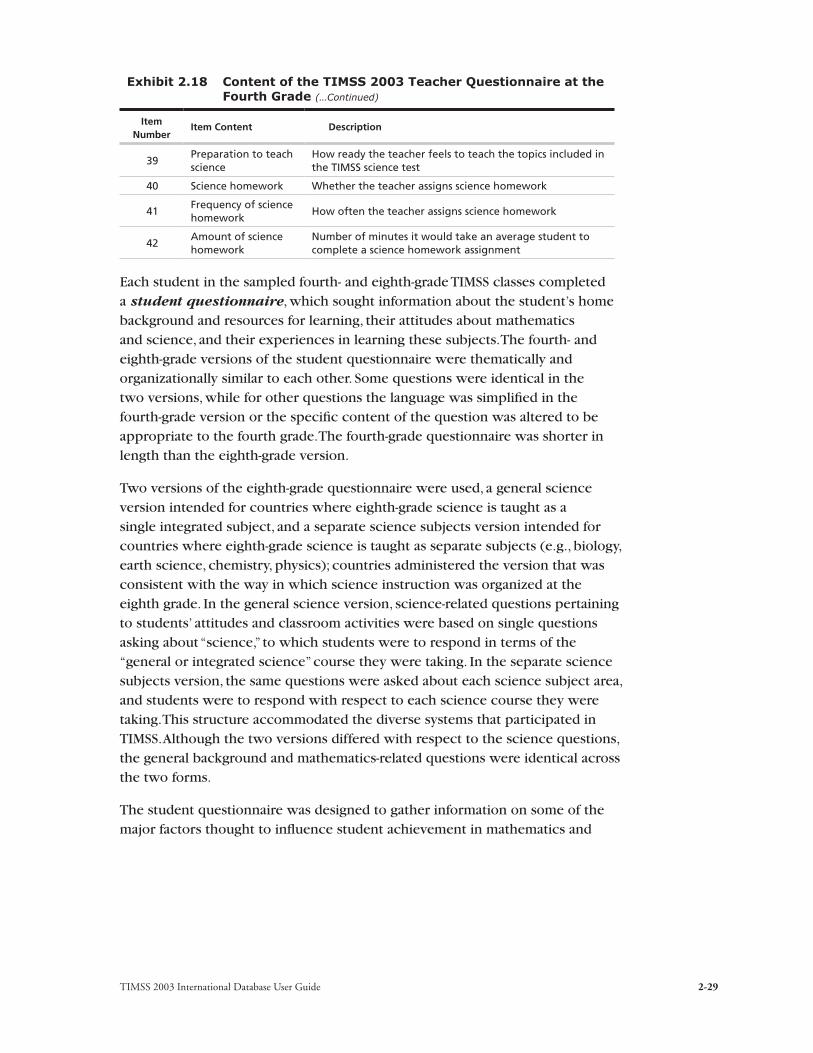
TIMSS 2003 International Database User Guide 2-29
Exhibit 2.18 Content of the TIMSS 2003 Teacher Questionnaire at the Fourth Grade (…Continued)
Item Number
Item Content Description
39Preparation to teach science
How ready the teacher feels to teach the topics included in the TIMSS science test
40 Science homework Whether the teacher assigns science homework
41Frequency of science homework
How often the teacher assigns science homework
42Amount of science homework
Number of minutes it would take an average student to complete a science homework assignment
Each student in the sampled fourth- and eighth-grade TIMSS classes completed a student questionnaire, which sought information about the student’s home background and resources for learning, their attitudes about mathematics and science, and their experiences in learning these subjects. The fourth- and eighth-grade versions of the student questionnaire were thematically and organizationally similar to each other. Some questions were identical in the two versions, while for other questions the language was simplified in the fourth-grade version or the specific content of the question was altered to be appropriate to the fourth grade. The fourth-grade questionnaire was shorter in length than the eighth-grade version.
Two versions of the eighth-grade questionnaire were used, a general science version intended for countries where eighth-grade science is taught as a single integrated subject, and a separate science subjects version intended for countries where eighth-grade science is taught as separate subjects (e.g., biology, earth science, chemistry, physics); countries administered the version that was consistent with the way in which science instruction was organized at the eighth grade. In the general science version, science-related questions pertaining to students’ attitudes and classroom activities were based on single questions asking about “science,” to which students were to respond in terms of the “general or integrated science” course they were taking. In the separate science subjects version, the same questions were asked about each science subject area, and students were to respond with respect to each science course they were taking. This structure accommodated the diverse systems that participated in TIMSS. Although the two versions differed with respect to the science questions, the general background and mathematics-related questions were identical across the two forms.
The student questionnaire was designed to gather information on some of the major factors thought to influence student achievement in mathematics and
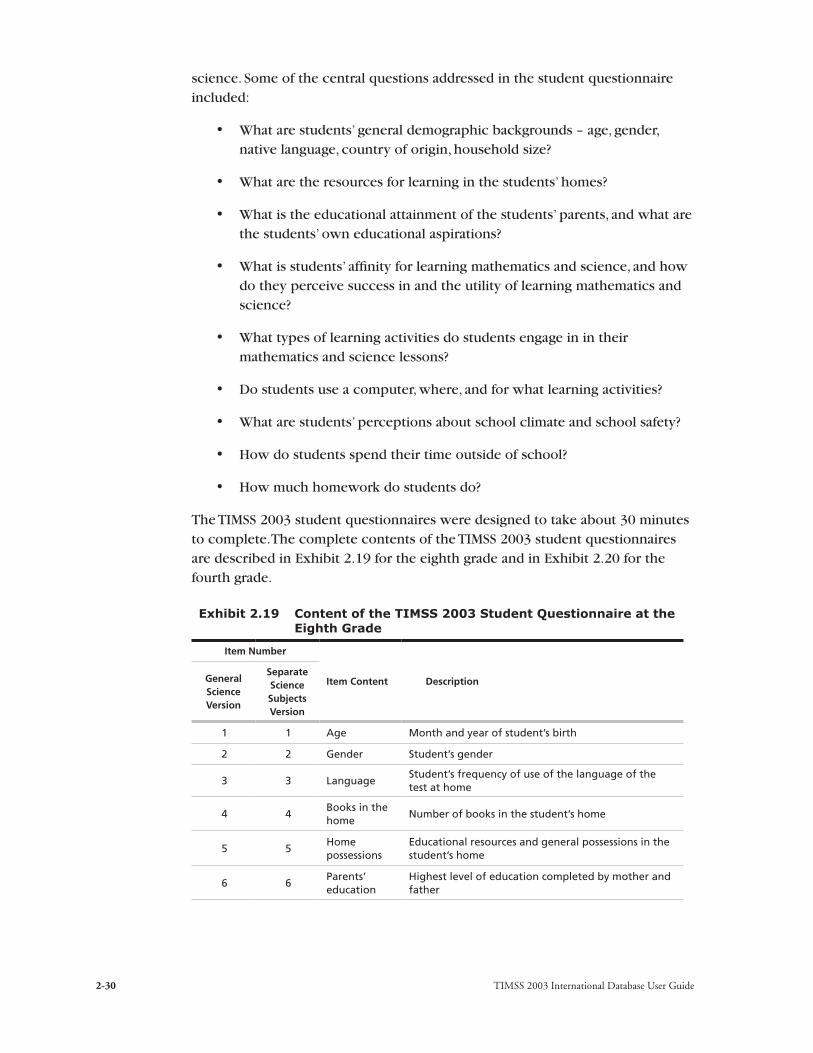
TIMSS 2003 International Database User Guide2-30
science. Some of the central questions addressed in the student questionnaire included:
• What are students’ general demographic backgrounds – age, gender, native language, country of origin, household size?
• What are the resources for learning in the students’ homes?
• What is the educational attainment of the students’ parents, and what are the students’ own educational aspirations?
• What is students’ affinity for learning mathematics and science, and how do they perceive success in and the utility of learning mathematics and science?
• What types of learning activities do students engage in in their mathematics and science lessons?
• Do students use a computer, where, and for what learning activities?
• What are students’ perceptions about school climate and school safety?
• How do students spend their time outside of school?
• How much homework do students do?
The TIMSS 2003 student questionnaires were designed to take about 30 minutes to complete. The complete contents of the TIMSS 2003 student questionnaires are described in Exhibit 2.19 for the eighth grade and in Exhibit 2.20 for the fourth grade.
Exhibit 2.19 Content of the TIMSS 2003 Student Questionnaire at the Eighth Grade
Item Number
Item Content DescriptionGeneral Science Version
Separate Science Subjects Version
1 1 Age Month and year of student’s birth
2 2 Gender Student’s gender
3 3 LanguageStudent’s frequency of use of the language of the test at home
4 4Books in the home
Number of books in the student’s home
5 5Home possessions
Educational resources and general possessions in the student’s home
6 6Parents’ education
Highest level of education completed by mother and father

TIMSS 2003 International Database User Guide 2-31
Exhibit 2.19 Content of the TIMSS 2003 Student Questionnaire at the Eighth Grade (…Continued)
Item Number
Item Content
DescriptionGeneral Science Version
Separate Science Subjects Version
7 7Educational expectations
Level of education the student expects to complete
8 8Liking mathematics
How much the student likes and feels competent at mathematics
9 9Valuing mathematics
Importance and value the student attributes to mathematics
10 10Learning activities in mathematics
Frequency with which student does various learning activities in mathematics lessons
11 - Liking scienceHow much the student likes and feels competent at science
12 -Valuing science
Importance and value the student attributes to science
13 -Learning activities in science
Frequency with which student does various learning activities in science lessons
- 11 Study biology Whether the student is studying biology this year
- 12Liking biology
How much the student likes and feels competent at biology
- 13Valuing biology
Importance and value the student attributes to biology
- 14Learning activities in biology
Frequency with which student does various learning activities in biology lessons
- 15Study earth science
Whether the student is studying earth science this year
- 16Liking earth science
How much the student likes and feels competent at earth science
- 17Valuing earth science
Importance and value the student attributes to earth science
- 18Learning activities in earth science
Frequency with which student does various learning activities in earth science lessons
- 19Study chemistry
Whether the student is studying chemistry this year
- 20Liking chemistry
How much the student likes and feels competent at chemistry
- 21Valuing chemistry
Importance and value the student attributes to chemistry
- 22Learning activities in chemistry
Frequency with which student does various learning activities in chemistry lessons

TIMSS 2003 International Database User Guide2-32
Exhibit 2.19 Content of the TIMSS 2003 Student Questionnaire at the Eighth Grade (…Continued)
Item Number
Item Content
DescriptionGeneral Science Version
Separate Science Subjects Version
- 23 Study physics Whether the student is studying physics this year
- 24 Liking physicsHow much the student likes and feels competent at physics
- 25Valuing physics
Importance and value the student attributes to physics
- 26Learning activities in physics
Frequency with which student does various learning activities in physics lessons
14 27 ComputersWhether student uses a computer, where uses it, and frequency with which student uses a computer for various educational activities
15 28School climate
Student’s affinity for school, and perception of other students’ motivation in school and teachers’ expectations and care of students
16 29Safety in school
Whether the student experienced being the object of problematic behaviors by other students
17 30Out-of-school activities
Frequency with which student does various non-academic activities and homework outside of school
18 31Extra lessons/tutoring
Frequency of extra lessons or tutoring in mathematics and science
19 32Mathematics homework
Frequency and amount of mathematics homework
20 32Science homework
Frequency and amount of science homework
21 33Persons living in home
Number of people living at home
22 34Parents born in country
Whether mother and father were born in country
23 35Student born in country
Whether student was born in country, and if not age at which student emigrated

TIMSS 2003 International Database User Guide 2-33
Exhibit 2.20 Content of the TIMSS 2003 Student Questionnaire at the Fourth Grade
Item Number
Item Content Description
1 Age Month and year of student’s birth
2 Gender Student’s gender
3 Language Student’s frequency of use of the language of the test at home
4Books in the home
Number of books in the student’s home
5 Home possessionsEducational resources and general possessions in the student’s home
6Liking mathematics
How much the student likes and feels competent at mathematics
7Learning activities in mathematics
Frequency with which student does various learning activities in mathematics lessons
8 Liking science How much the student likes and feels competent at science
9Learning activities in science
Frequency with which student does various learning activities in science lessons
10 ComputersWhether student uses a computer, where uses it, and frequency with which student uses a computer for various educational activities
11 School climateStudent’s affinity for school, and perception of other students’ motivation in school and teachers’ expectations and care of students
12 Safety in schoolWhether the student experienced being the object of problematic behaviors by other students
13Out-of-school activities
Frequency with which student does various non-academic activities and homework outside of school
14 Extra lessonsFrequency of extra lessons or tutoring in mathematics and science
15Mathematics homework
Frequency and amount of mathematics homework
16Science homework
Frequency and amount of science homework
17Persons living in home
Number of people living at home
18Parents born in country
Whether mother and father were born in country
19Student born in country
Whether student was born in country, and if not age at which student emigrated
2.5 Working with TIMSS 2003 Questionnaire Data
Student Questionnaire Data
In general, working with the data from the student questionnaire is fairly straight-forward. For example, most of the exhibits in the TIMSS 2003 international reports (Mullis, et al., 2004; Martin, et al., 2004) present weighted percentages of students in each country for each response category, together with the mean

TIMSS 2003 International Database User Guide2-34
achievement (mathematics or science) of those students. International averages are also displayed for each category.
Teacher Questionnaire Data
Because the assignment of the teacher questionnaires was based on participating students, teacher responses do not necessarily represent all of the teachers of the target grade in each of the TIMSS countries. Rather, they represent teachers of the representative samples of students assessed. It is important to note that when using the TIMSS data, the student is always the unit of analysis, even when information from the teacher questionnaires is being reported. Using the student as the unit of analysis makes it possible to describe the instruction received by representative samples of students. Although this approach may provide a different perspective from that obtained by simply collecting information from teachers, it is consistent with the TIMSS goals of illuminating students’ educational contexts and performance.
In most countries, students at fourth grade are taught all subjects by a single classroom teacher. Following this model, there was a single teacher questionnaire for teachers of fourth-grade students, comprising a section on teacher background characteristics and attitudes, a section on mathematics instruction, and a section on science instruction.
At the eighth-grade level, mathematics and science are not generally taught by the same teachers. Accordingly, there was a questionnaire for mathematics teachers and another for science teachers, the two questionnaires having some general questions in common but using different subject matter related questions. The procedure was to sample a mathematics class from each participating school, administer the test to those students, and ask the mathemat-ics and science teachers of those students to complete a teacher questionnaire. In countries with different teachers for each of the science subjects, this included all science teachers of the students in the sampled classes.
The teacher questionnaires were divided into two sections: Section A asked about teachers’ general background and Section B asked class-specific questions about instructional practices. Where teachers taught more than one mathematics or science class to the sampled students, they were to complete only one Section A but a separate Section B for each class taught. Thus, the information about instruction was tied directly to the students tested and the specific mathematics and science classes in which they were taught.
The data obtained from the science teachers can be used in two ways. Some of the general information can be used together for all science teachers in each country. The data for information specific to the science subject, such as preparation to teach the sciences, instructional time in the sciences, and

TIMSS 2003 International Database User Guide 2-35
emphasis on experiments, should most likely be treated separately both for the general/integrated science and for the separate science subject area teachers. Tracking information provided by schools has been included in the database (ITCOURSE) and can be used to identify teachers by the type of course taught to the sampled students - mathematics, physics, biology, chemistry, earth science, or integrated science.
Another consequence of the TIMSS design was that since students were usually taught mathematics and science by different teachers and sometimes were taught one subject by more than one teacher, they had to be linked to more than one teacher for reporting purposes. When a student is taught a subject by more than one teacher, the student’s sampling weight is distributed among those teachers. The student’s contribution to student population estimates thus remains constant regardless of the number of teachers. This is consistent with the policy of reporting attributes of teachers and their classrooms in terms of the percentages of students taught by teachers with these attributes. Some analyses of this type might involve computing the sum or determining the highest value reported across all of a student’s teachers for one subject area. The composite values obtained can then be used to produce the reported student-weighted statistics (e.g., total instructional time in the subjects and the degree of content coverage in mathematics or science).
School Questionnaire Data
The principals of the participating schools in TIMSS completed questionnaires on the school contexts in which the learning and teaching of mathematics and science occurred. Although schools constituted the first stage of sampling and were chosen randomly, the TIMSS school sample was designed to optimize the student sample, not to provide an optimal sample of schools.5 The school sample in most countries is relatively small, about 150 schools at each grade level, and because schools generally were sampled with probabilities proportional to size, large schools tend to occur in the sample more frequently than in the school population. It is possible to analyze the school data in isolation using the school weights described later in this chapter, but in general the school-level data are most usefully studied as attributes of school context for the students and using the student as the unit of analysis.
Summary Indices and Derived Variables from Questionnaire Data
As described by Ramirez and Arora (2004), TIMSS 2003 collected data on many hundreds of variables from the students, teachers, principals, and NRCs that participated in the study. The purpose of these data is to help policymakers, curriculum specialists, researchers, and others better understand the performance of their educational systems. In addition to the data on the original
5 See Foy and Joncas (2004) for a description of the TIMSS 2003 sampling design.
TIMSS 2003 International Database User Guide2-36
questions asked in the various questionnaires, TIMSS created a range of indices and derived variables that summarized the data in ways that highlighted the relationship with mathematics and science achievement.
For example, a three-level index of Good School and Class Attendance was constructed from principals’ ratings of the extend to which three student behaviors – arriving late at school, absenteeism, and skipping classes – were a problem in the school. Students were assigned to the high level of the index if their principal reported that all three behaviors were not a problem. Students were assigned the low level of the index if their principal indicated that two or more of the behaviors were a serious problem or two behaviors were a minor problem and a third a serious problem. Students whose principals reported other combinations of responses were assigned to the medium category.
The international version of each of the TIMSS 2003 background questionnaires is described in Supplement 1 of this User Guide, and the documentation of the national adaptations to each questionnaire in Supplement 2. The indices and other derived variables are listed in Exhibits 2.21 to 2.24 below, for the eighth and fourth grades, respectively. Detailed descriptions and analysis notes for the derived variables are provided in Supplement 3.

TIMSS 2003 International Database User Guide 2-37
Exhibit 2.21 Summary Indices in TIMSS 2003 International Database for the Eighth Grade
Variable Name Description Levels
bsdmhw Index of Time Students Spend Doing Mathematics Homework (TMH)
1=high, 2=medium, 3=low
bsdmscl Index of Students’ Self-Confidence in Learning Mathematics (SCM)
1=high, 2=medium, 3=low
bsdmsv Index of Students’ Valuing Mathematics (SVM)
1=high, 2=medium, 3=low
bsdgpss Index of Students’ Perception of Being Safe in the Schools (SPBSS)
1=high, 2=medium, 3=low
bsdshw Index of Time Students Spend Doing Science Homework (TSH)
1=high, 2=medium, 3=low
bsdbhw Index of Time Students Spend Doing Life Science Homework (TSH)
1=high, 2=medium, 3=low
bsdehw Index of Time Students Spend Doing Earth Science Homework (TSH)
1=high, 2=medium, 3=low
bsdchw Index of Time Students Spend Doing Chemistry Homework (TSH)
1=high, 2=medium, 3=low
bsdphw Index of Time Students Spend Doing Physics Homework (TSH)
1=high, 2=medium, 3=low
bsdssv Index of Students Valuing Science (SVS) 1=high, 2=medium, 3=low
bsdbsv Index of Students Valuing Life Science (SVB)
1=high, 2=medium, 3=low
bsdesv Index of Students Valuing Earth S (SVE) 1=high, 2=medium, 3=low
bsdcsv Index of Students Valuing Chemist (SVC) 1=high, 2=medium, 3=low
bsdpsv Index of Students Valuing Physics (SVP) 1=high, 2=medium, 3=low
bsdsscl Index of Students’ Self-Confidence in Learning Science (SCS)
1=high, 2=medium, 3=low
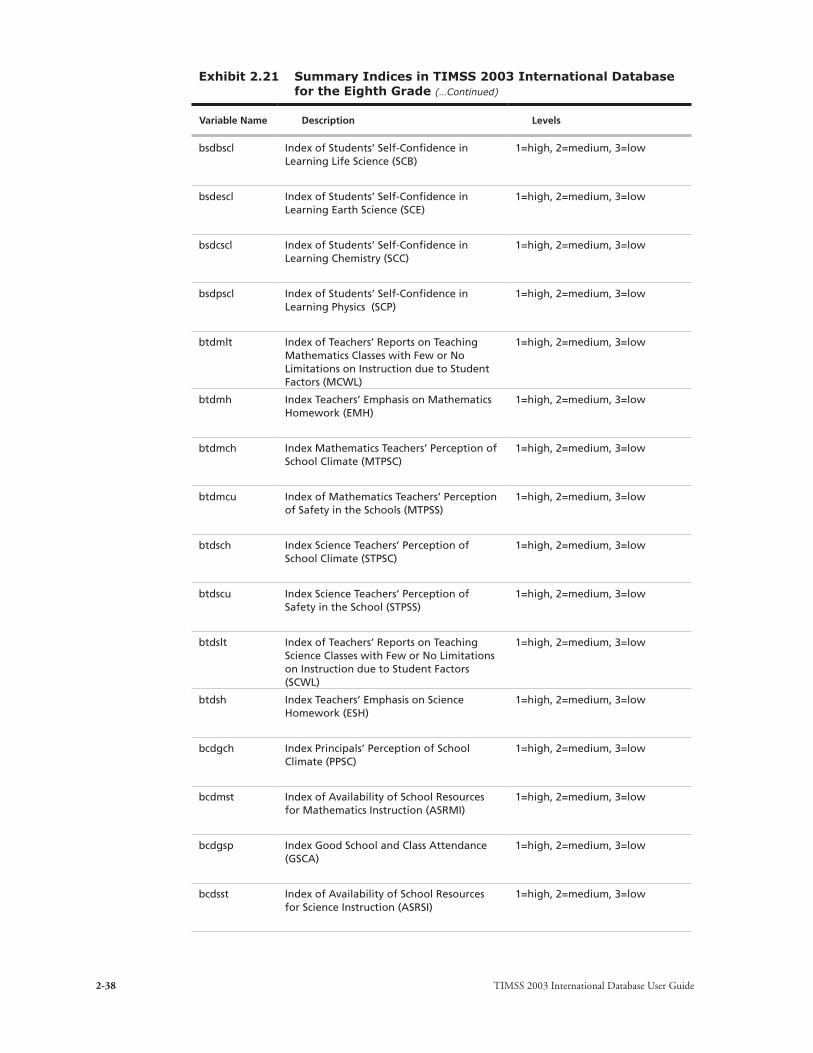
TIMSS 2003 International Database User Guide2-38
Exhibit 2.21 Summary Indices in TIMSS 2003 International Database for the Eighth Grade (…Continued)
Variable Name Description Levels
bsdbscl Index of Students’ Self-Confidence in Learning Life Science (SCB)
1=high, 2=medium, 3=low
bsdescl Index of Students’ Self-Confidence in Learning Earth Science (SCE)
1=high, 2=medium, 3=low
bsdcscl Index of Students’ Self-Confidence in Learning Chemistry (SCC)
1=high, 2=medium, 3=low
bsdpscl Index of Students’ Self-Confidence in Learning Physics (SCP)
1=high, 2=medium, 3=low
btdmlt Index of Teachers’ Reports on Teaching Mathematics Classes with Few or No Limitations on Instruction due to Student Factors (MCWL)
1=high, 2=medium, 3=low
btdmh Index Teachers’ Emphasis on Mathematics Homework (EMH)
1=high, 2=medium, 3=low
btdmch Index Mathematics Teachers’ Perception of School Climate (MTPSC)
1=high, 2=medium, 3=low
btdmcu Index of Mathematics Teachers’ Perception of Safety in the Schools (MTPSS)
1=high, 2=medium, 3=low
btdsch Index Science Teachers’ Perception of School Climate (STPSC)
1=high, 2=medium, 3=low
btdscu Index Science Teachers’ Perception of Safety in the School (STPSS)
1=high, 2=medium, 3=low
btdslt Index of Teachers’ Reports on Teaching Science Classes with Few or No Limitations on Instruction due to Student Factors (SCWL)
1=high, 2=medium, 3=low
btdsh Index Teachers’ Emphasis on Science Homework (ESH)
1=high, 2=medium, 3=low
bcdgch Index Principals’ Perception of School Climate (PPSC)
1=high, 2=medium, 3=low
bcdmst Index of Availability of School Resources for Mathematics Instruction (ASRMI)
1=high, 2=medium, 3=low
bcdgsp Index Good School and Class Attendance (GSCA)
1=high, 2=medium, 3=low
bcdsst Index of Availability of School Resources for Science Instruction (ASRSI)
1=high, 2=medium, 3=low

TIMSS 2003 International Database User Guide 2-39
Exhibit 2.22 Derived Variables Other Than Indices in TIMSS 2003 International Database for the Eighth Grade
Derived Variable Name
Description Levels
bsdgedup Highest Level of Education of Either Parent
1=Finished University or Equivalent or Higher
2=Finished Post-Secondary Vocational/Technical Education but Not University
3=Finished Upper Secondary Schooling
4=Finished Lower Secondary Schooling
5=Finished Some Primary or Lower Secondary or Did Not Go to School
6=Do Not Know
bsdgasp Students’ Educational Aspirations Relative to Parents’ Educational Level
1=Finish University and Either Parent Went to University or Equivalent
2=Finish University but Neither Parent Went to University or Equivalent
3=Not Finish University Regardless of Parents’ Education
4=Do Not Know Regardless of Parents’ Education
bsdgcavl Use of Computer 1=Use Computer Both at Home and School
2=Use Computer at Home but Not at School
3=Use Computer at School but Not at Home
4=Use Computer Only at Places Other Than Home and School
5=Do Not Use Computers at All
btdmstud Class Size for Mathematics Instruction
1=1-24 Students
2=25-32 Students
3=33-40 Students
4=41 or More Students
btdmtonu Summary of Students Taught Number Mathematics Topics
Min 0, max 10
btdmtoal Summary of Students Taught Algebra Mathematics Topics
Min 0, max 6
btdmtome Summary of Students Taught Measurement Mathematics Topics
Min 0, max 8
btdmtoge Summary of Students Taught Geometry Mathematics Topics
Min 0, max 13
btdmtoda Summary of Students Taught Data Mathematics Topics
Min 0, max 8
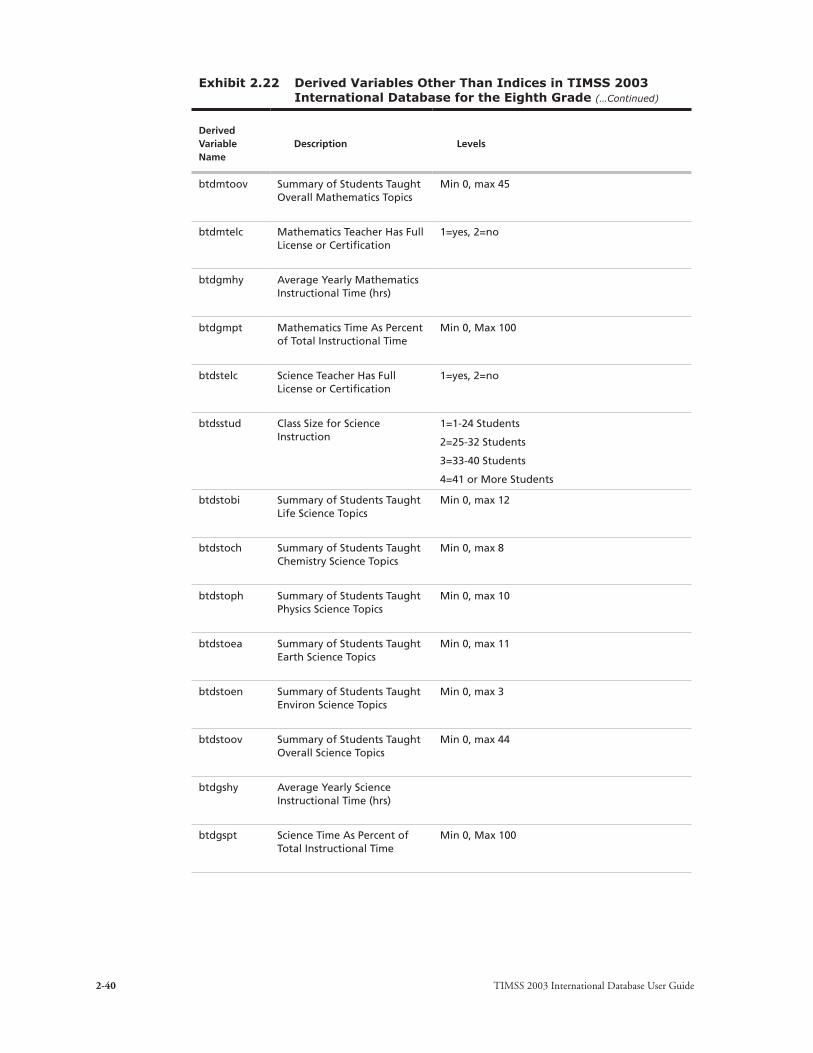
TIMSS 2003 International Database User Guide2-40
Exhibit 2.22 Derived Variables Other Than Indices in TIMSS 2003 International Database for the Eighth Grade (…Continued)
Derived Variable Name
Description Levels
btdmtoov Summary of Students Taught Overall Mathematics Topics
Min 0, max 45
btdmtelc Mathematics Teacher Has Full License or Certification
1=yes, 2=no
btdgmhy Average Yearly Mathematics Instructional Time (hrs)
btdgmpt Mathematics Time As Percent of Total Instructional Time
Min 0, Max 100
btdstelc Science Teacher Has Full License or Certification
1=yes, 2=no
btdsstud Class Size for Science Instruction
1=1-24 Students
2=25-32 Students
3=33-40 Students
4=41 or More Students
btdstobi Summary of Students Taught Life Science Topics
Min 0, max 12
btdstoch Summary of Students Taught Chemistry Science Topics
Min 0, max 8
btdstoph Summary of Students Taught Physics Science Topics
Min 0, max 10
btdstoea Summary of Students Taught Earth Science Topics
Min 0, max 11
btdstoen Summary of Students Taught Environ Science Topics
Min 0, max 3
btdstoov Summary of Students Taught Overall Science Topics
Min 0, max 44
btdgshy Average Yearly Science Instructional Time (hrs)
btdgspt Science Time As Percent of Total Instructional Time
Min 0, Max 100
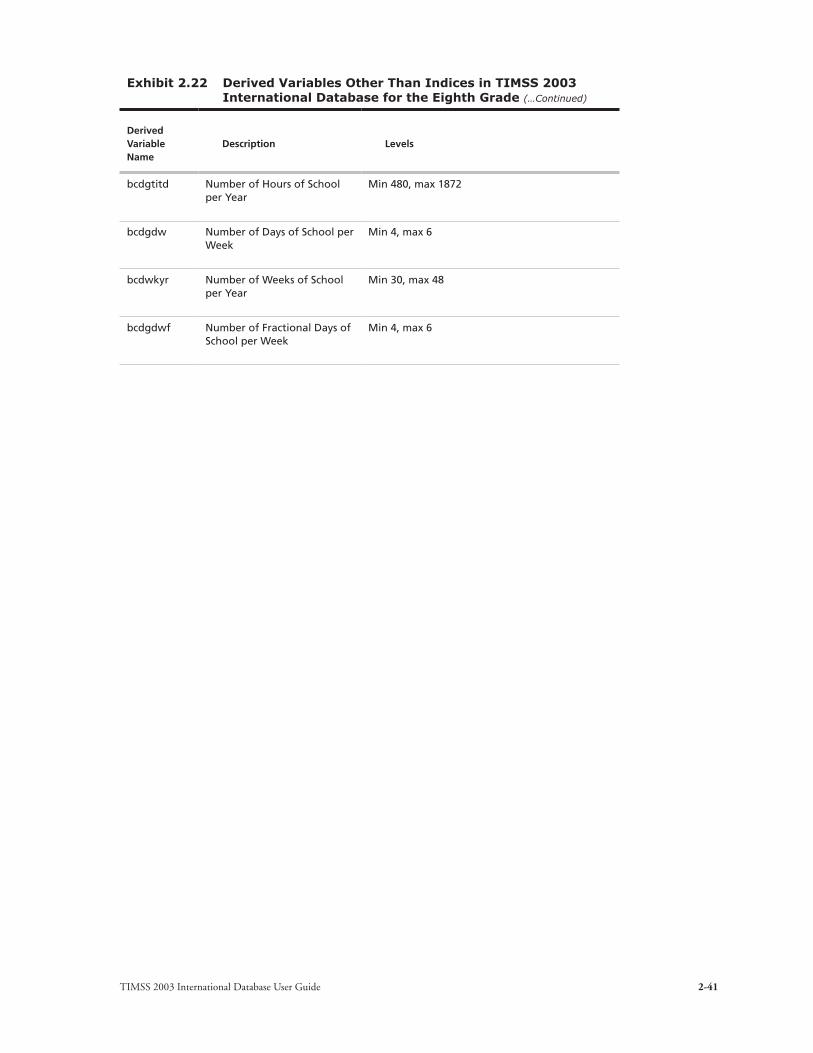
TIMSS 2003 International Database User Guide 2-41
Exhibit 2.22 Derived Variables Other Than Indices in TIMSS 2003 International Database for the Eighth Grade (…Continued)
Derived Variable Name
Description Levels
bcdgtitd Number of Hours of School per Year
Min 480, max 1872
bcdgdw Number of Days of School per Week
Min 4, max 6
bcdwkyr Number of Weeks of School per Year
Min 30, max 48
bcdgdwf Number of Fractional Days of School per Week
Min 4, max 6

TIMSS 2003 International Database User Guide2-42
Exhibit 2.23 Summary Indices in TIMSS 2003 International Database for the Fourth Grade
Variable Name Description Levels
asdmhw Index of Time Students Spend Doing Mathematics Homework (TMH)
1=high, 2=medium, 3=low
asdmscl Index of Students’ Self-Confidence in Learning Mathematics (SCM)
1=high, 2=medium, 3=low
asdgpss Index of Students’ Perception of Being Safe in the Schools (SPBSS)
1=high, 2=medium, 3=low
asdshw Index of Time Students Spend Doing Science Homework (TSH)
1=high, 2=medium, 3=low
asdsscl Index of Students’ Self-Confidence in Learning Science (SCS)
1=high, 2=medium, 3=low
atdmh Index of Teachers’ Emphasis on Mathematics Homework (EMH)
1=high, 2=medium, 3=low
atdgch Index of Mathematics Teachers’ Perception of School Climate (TPSC)
1=high, 2=medium, 3=low
atdgcu Index of Mathematics Teachers’ Perception of Safety in the Schools (TPSS)
1=high, 2=medium, 3=low
atdsh Index Teachers’ Emphasis on Science Homework (ESH)
1=high, 2=medium, 3=low
acdgch Index of Principals’ Perception of School Climate (PPSC)
1=high, 2=medium, 3=low
acdmst Index of Availability of School Resources for Mathematics Instruction (ASRMI)
1=high, 2=medium, 3=low
acdgsp Index of Good School and Class Attendance (GSCA)
1=high, 2=medium, 3=low
acdsst Index of Availability of School Resources for Science Instruction (ASRSI)
1=high, 2=medium, 3=low

TIMSS 2003 International Database User Guide 2-43
Exhibit 2.24 Derived Variables Other Than Indices in TIMSS 2003 International Database for the Fourth Grade
Derived Variable Name
Description Levels
asdgcavl Use of Computer 1=Use Computer Both at Home and School
2=Use Computer at Home but Not at School
3=Use Computer at School but Not at Home
4=Use Computer Only at Places Other Than Home and School
5=Do Not Use Computers at All
atdmstud Class Size for Mathematics Instruction 1=1-19 Students
2=20-26 Students
3=27-32 Students
4=33 or More Students
atdmtanu Summary of Students Taught Number Mathematics Topics
Min 0, max 12
atdmtape Summary of Students Taught Patterns, Equations, Relationships Mathematics Topics
Min 0, max 6
atdmtame Summary of Students Taught Measure Mathematics Topics
Min 0, max 6
atdmtage Summary of Students Taught Geometry Mathematics Topics
Min 0, max 11
atdmtada Summary of Students Taught Data Mathematics Topics
Min 0, max 7
atdmtaov Summary of Students Taught Overall Mathematics Topics
Min 0, max 42
atdmprep Preparation to Teach Mathematics 1=Education with Specialization in Mathematics
2=Mathematics
3= Education with Specialization in Science
4=Science
5= Education with Specialization in Language/Reading or in Other Subject
6=Other
atdgtelc Have Full Teaching License or Certificate 1=yes, 2=no
atdgmhy Average Yearly Mathematics Instructional Time (hrs)
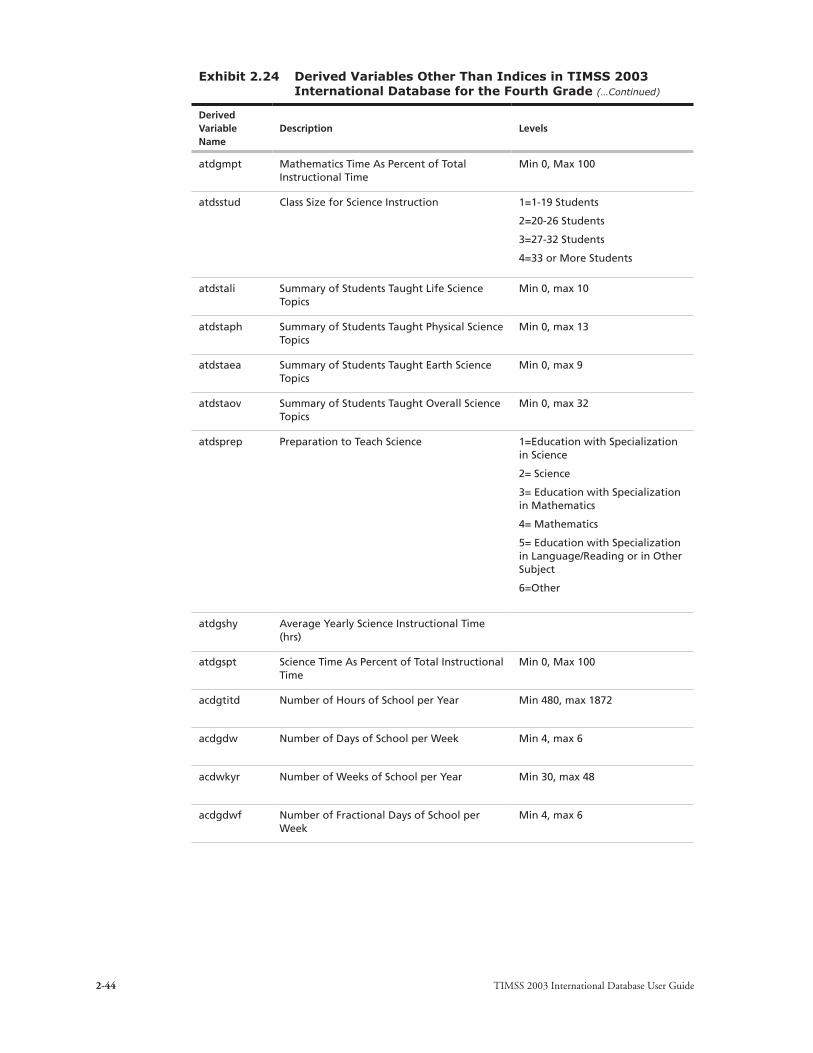
TIMSS 2003 International Database User Guide2-44
Exhibit 2.24 Derived Variables Other Than Indices in TIMSS 2003 International Database for the Fourth Grade (…Continued)
Derived Variable Name
Description Levels
atdgmpt Mathematics Time As Percent of Total Instructional Time
Min 0, Max 100
atdsstud Class Size for Science Instruction 1=1-19 Students
2=20-26 Students
3=27-32 Students
4=33 or More Students
atdstali Summary of Students Taught Life Science Topics
Min 0, max 10
atdstaph Summary of Students Taught Physical Science Topics
Min 0, max 13
atdstaea Summary of Students Taught Earth Science Topics
Min 0, max 9
atdstaov Summary of Students Taught Overall Science Topics
Min 0, max 32
atdsprep Preparation to Teach Science 1=Education with Specialization in Science
2= Science
3= Education with Specialization in Mathematics
4= Mathematics
5= Education with Specialization in Language/Reading or in Other Subject
6=Other
atdgshy Average Yearly Science Instructional Time (hrs)
atdgspt Science Time As Percent of Total Instructional Time
Min 0, Max 100
acdgtitd Number of Hours of School per Year Min 480, max 1872
acdgdw Number of Days of School per Week Min 4, max 6
acdwkyr Number of Weeks of School per Year Min 30, max 48
acdgdwf Number of Fractional Days of School per Week
Min 4, max 6
TIMSS 2003 International Database User Guide 2-45
2.6 Using Sampling Weights in Analyzing the TIMSS 2003 Data
An important characteristic of the TIMSS studies, and one that has crucial implications for data analysis, is that they use data from carefully-drawn random samples of schools, classes, and students to make inferences about the mathematics and science achievement of the fourth- and eighth-grade student populations in the participating countries (see Foy and Joncas, 2004). For analyses based on these sample data to accurately reflect populations attributes, it is necessary that they take the design of the sample into account. This is accomplished in part by assigning a sampling weight to each respondent in the sample, and weighting the respondent by its sampling weight in all analyses. The sampling weight properly accounts for the sample design, takes into account any stratification or disproportional sampling of subgroups, and includes adjustments for non-response (see Joncas, 2004).
Because the students within each country were selected using probability sampling procedures, the probability of each student being selected as part of the sample is known. The sampling weight is the inverse of this selection probability. In a properly selected and weighted sample, the sum of the weights for the sample approximates the size of the population. In TIMSS, the sum of the sampling weights of all students in a country is an estimate of the size of the fourth- or eighth-grade student population in that country. The student sampling weight, known as TOTWGT in the international database, must be used whenever student population estimates are required. The use of TOTWGT ensures that the various subgroups that constitute the sample are properly and proportionally represented in the computation of population estimates, and that the sample size will be inflated to approximate the size of the population.
Although TOTWGT has desirable properties, it also has drawbacks for some analyses. Because TOTWGT sums to the student population size in each country, analyses using TOTWGT that combine countries will have more students from larger countries and fewer from smaller countries, which may not be desirable for some purposes. For cross-country analyses in which each country should be treated equally, TIMSS provides SENWGT, a transformation of TOTWGT that results in a sample size of 500 in each country. Additionally, since TOTWGT inflates sample sizes to approximate the population size, software systems that use sample size to compute significance tests will give misleading results for analyses weighted by TOTWGT. To avoid this problem, TIMSS provides HOUWGT, a transformation of TOTWGT that ensures that the weighted sample corresponds to the actual sample size in each country. SENWGT and HOUWGT are described more fully below.
TIMSS 2003 International Database User Guide2-46
Sampling Weights Included in the Student Data Files
Each student’s sampling weight (TOTWGT) is a composite of six factors: three weighting factors corresponding to the stages of the sampling design (school, class, and student – WGTFAC1, WGTFAC2, and WGTFAC3), and three adjustment factors for non-participation at each of these stages – WGTADJ1, WGTADJ2, and WGTADJ3, as described below. The variables described in this section are included in both the Student Background and Student Achievement files (see next chapter). The meaning and interpretation of the weights in each of these files is the same.
WGTFAC1 School Weighting Factor
This variable is the inverse of the probability of selection for the school where the student is enrolled.
WGTADJ1 School Non-participation Adjustment
This is an adjustment that is applied to WGTFAC1 to account for non-participating schools in the sample. Multiplying WGTFAC1 by WGTADJ1 gives the sampling weight for the school, adjusted for non-participation.
WGTFAC2 Class Weighting Factor
This is the inverse of the probability of selection of the classroom within the school.
WGTADJ2 Classroom Non-participation Adjustment
This is an adjustment that is applied to WGTFAC2 to account for non-participating classrooms or classrooms where student participation was less than 50 percent. Multiplying WGTFAC2 by WGTADJ2 gives the second-stage sampling weight, adjusted for non-participation.
WGTFAC3 Student Weighting Factor
This is the inverse of the probability of selection of an individual student within a sampled classroom. In the usual TIMSS case, where entire classrooms were sampled intact, the value was set to one for all students in the classroom. In a few countries, however, students were sampled within classrooms as a third sampling stage: in these cases the value of WGTFAC3 was greater than one.

TIMSS 2003 International Database User Guide 2-47
WGTADJ3 Student Weighting Adjustment
This is an adjustment applied to the variable WGTFAC3 to account for non-participating students in the sampled classroom. Multiplying WGTFAC3 by WGTADJ3 gives the student-within-classroom sampling weight, adjusted for non-participation.
TOTWGT Total Student Weight
TOTWGT is obtained by multiplying the variables WGTFAC1, WGTADJ1, WGTFAC2, WGTADJ2, WGTFAC3, and WGTADJ3 for each student. The sum of these weights within a sample provides an estimate of the size of the population.
A key property of a sampling weight is that the same population estimates for means and proportions (although not the total or the number of units) will be obtained from any weighting variable that is proportional to the original weight (TOTWGT). For example, the sampling weights for a large country could be divided by a constant to make them smaller, and the weights of a smaller country could be multiplied by a constant to make them bigger. Regardless of which constant is used within a country, the weighted estimates of the means and proportions obtained from each of these proportional transformations of the weights will be exactly the same.
SENWGT Senate Weight
The SENWGT sampling weight is TOTWGT multiplied by 500 divided by the sum of the weights over all students in the target grade in each country. This results in a sample size of 500 in each country. SENWGT may be used in cross-country analyses in which each country should be treated equally. When SENWGT is used as the sampling weight for international estimates, the contribution of each country is the same, regardless of the size of the population.
HOUWGT House Weight
The HOUWGT sampling weight is TOTWGT multiplied by the ratio of the sample size (the number of students, n) in each country divided by the sum of the weights over all students in the target grade. HOUWGT may be used when the actual sample size is required for performing significance tests. Although some statistical computer software packages allow the sample size to be used as the divisor in the computation of standard errors, others will use the sum of the weights, which results in severely deflated standard errors for the statistics if TOTWGT is used as the weighting variable. HOUWGT
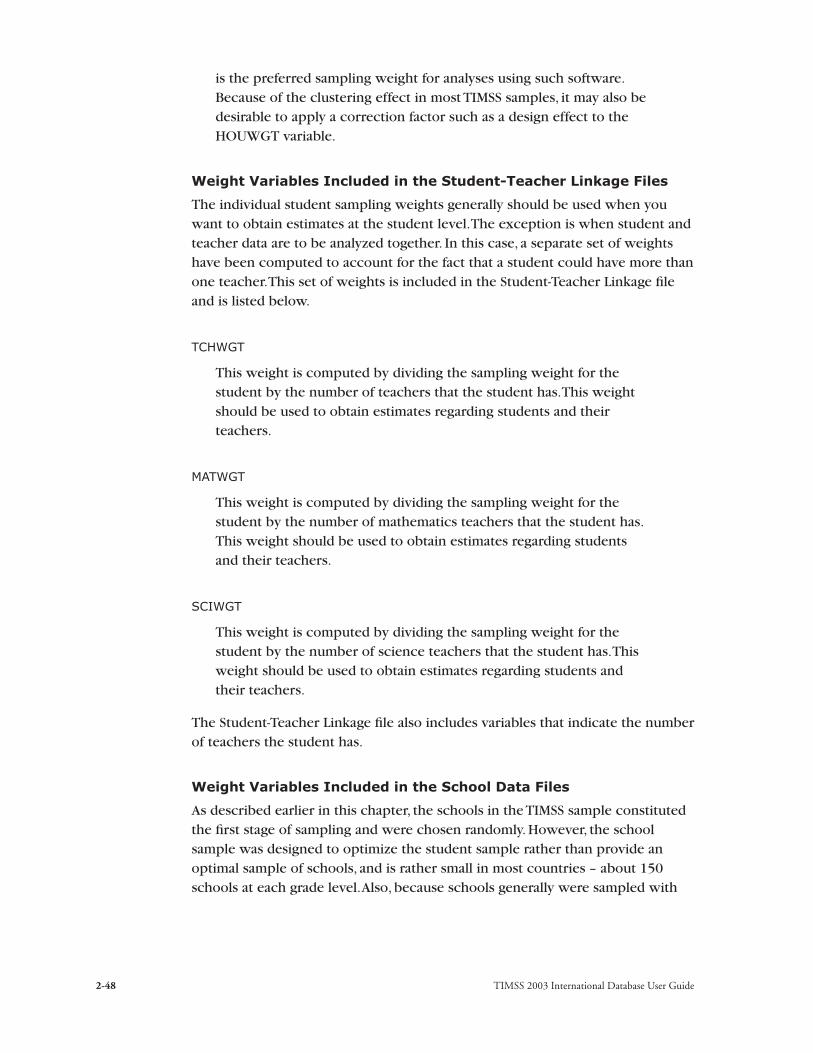
TIMSS 2003 International Database User Guide2-48
is the preferred sampling weight for analyses using such software. Because of the clustering effect in most TIMSS samples, it may also be desirable to apply a correction factor such as a design effect to the HOUWGT variable.
Weight Variables Included in the Student-Teacher Linkage Files
The individual student sampling weights generally should be used when you want to obtain estimates at the student level. The exception is when student and teacher data are to be analyzed together. In this case, a separate set of weights have been computed to account for the fact that a student could have more than one teacher. This set of weights is included in the Student-Teacher Linkage file and is listed below.
TCHWGT
This weight is computed by dividing the sampling weight for the student by the number of teachers that the student has. This weight should be used to obtain estimates regarding students and their teachers.
MATWGT
This weight is computed by dividing the sampling weight for the student by the number of mathematics teachers that the student has. This weight should be used to obtain estimates regarding students and their teachers.
SCIWGT
This weight is computed by dividing the sampling weight for the student by the number of science teachers that the student has. This weight should be used to obtain estimates regarding students and their teachers.
The Student-Teacher Linkage file also includes variables that indicate the number of teachers the student has.
Weight Variables Included in the School Data Files
As described earlier in this chapter, the schools in the TIMSS sample constituted the first stage of sampling and were chosen randomly. However, the school sample was designed to optimize the student sample rather than provide an optimal sample of schools, and is rather small in most countries – about 150 schools at each grade level. Also, because schools generally were sampled with

TIMSS 2003 International Database User Guide 2-49
probabilities proportional to size, large schools tend to occur in the sample more frequently than in the school population. Despite these concerns, it is possible to conduct analyses at the school level using the TIMSS data, provided the SCHWGT variable is used as a sampling weight.
SCHWGT School-level Weight
The school sampling weight SCHWGT is the inverse of the probability of selection of the school, multiplied by its corresponding non-participation adjustment factor. It is the product of WGTFAC1 and WGTADJ1.
2.7 Using the Jackknife to Estimate Sampling and Imputation Variance
When analyzing data from complex designs such as TIMSS, it is important to compute realistic error variance estimates for the statistics of interest. In TIMSS, this error variance comes from two sources: the sampling process and the imputation process.
Estimating Sampling Variance
The TIMSS 2003 sampling design applied a stratified multistage cluster-sampling technique to the problem of selecting efficient and accurate samples of students while working with schools and classes. This design capitalized on the structure of the student population (i.e., students grouped in classes within schools) to derive student samples that permitted efficient and economical data collection. Unfortunately, however, such a complex sampling design complicates the task of computing standard errors to quantify sampling variability, as the computational formulas derived from assumptions of simple random sampling generally underestimate the true variability in the data. To avoid this problem, TIMSS uses the jackknife repeated replication technique (JRR) (Wolter, 1985), one of a class of techniques that estimates sampling error through repeated resampling of the ogiginally-sampled data. The jackknife was chosen by TIMSS because it is computationally straightforward and provides approximately unbiased estimates of the sampling errors of means, totals, and percentages.
The variation on the JRR technique used in TIMSS 2003 is described in Johnson and Rust (1992). It assumes that the primary sampling units, or PSUs (these are almost always schools in TIMSS) can be paired in a manner consistent with the sample design, with each pair regarded as members of a pseudo-stratum for variance estimation purposes. When used in this way, the JRR technique appropriately accounts for the combined effect of the between- and within-PSU contributions to the sampling variance. The JRR approach entails systematically

TIMSS 2003 International Database User Guide2-50
assigning pairs of schools to sampling zones, and randomly selecting one of these schools to have its contribution doubled and the other to have its contribution zeroed, so as to construct a number of “pseudo-replicates” of the original sample (also known as “jackknife” replicates). The statistic of interest is computed once for the entire original sample, and once again for each pseudo-replicate sample. The variation between the estimates for each of the replicate samples and the original sample estimate is the jackknife estimate of the sampling error of the statistic.
The following variables capture the information necessary to estimate correct standard errors using the JRR technique:
JKZONE
The variable JKZONE identifies the sampling zone to which the student’s school is assigned. Zones typically contain two schools (PSUs), and because the basic TIMSS sampling plan calls for 150 schools, TIMSS uses 75 sampling zones in total. The JKZONE variable was constructed by the TIMSS sampling consultants at Statistics Canada. Working through each country’s list of sampled schools, they assigned the first and second schools to the first sampling zone, the third and fourth schools to the second zone, and so on. Where a country had more than 150 schools, zones were expanded to accommodate the extra schools, as necessary. The JKZONE variable is included in both Student Background and Student Achievement data files.
JKREP
The variable JKREP identifies the school (PSU) within each zone. It can have a value of either 0 or 1. The values were randomly assigned so that they can be used to indicate the school to have its weights zeroed (records with JKREP=0) and the school to have its weights doubled (records with JKREP=1) during the jackknife procedure. The JKREP variable is included in both Student Background and Student Achievement data files.
The JRR algorithm used in TIMSS 2003 assumes that there are H sampling zones within each country (where H is 75 or less), each containing two sampled schools selected independently. The JRR variance estimate of a statistic t from the sample for a country is given by the following equation:
� � � � � �� ���
��H
hhjrr StJttVar
1
2

TIMSS 2003 International Database User Guide 2-51
where H is the number of zones in the sample for the country. The term t(S) corresponds to the statistic t for the whole sample (computed using appropriate sampling weights). The element t(Jh) denotes the same statistic using the hth jackknife replicate. This is computed using all cases except those in the hth zone of the sample; for those in the hth zone, all records with JKREP of 0 are ignored, and all records with JKREP of 1 are included twice. In practice, this is accomplished by recoding to zero the sampling weights for the records to be excluded from the replication, and multiplying by two the weights of the records to be included twice.
The computation of the JRR variance estimate for any statistic in TIMSS 2003 required the computation of the statistic up to 76 times for any given country: once to obtain the statistic for the full sample, and up to 75 times to obtain the statistics for each of the jackknife replicates. If a country had a sample of less than 150 schools, there would be less than 75 jackknife replicates.
Estimating Imputation Variance
Because the TIMSS 2003 item pool was far too extensive to be administered in its entirety to any one student, a matrix-sampling design was adopted whereby each student was given a single test booklet containing only a part of the assessment. The results for all of the booklets were then aggregated using item response theory to provide results for the entire assessment. Since each student responded to just a subset of the assessment items, multiple imputation (the generation of “plausible values”) was used to derive reliable estimates of student performance on the assessment as a whole. TIMSS followed the customary procedure of generating five imputations or plausible values for each student and using the variability among them as a measure of this imputation uncertainty, or error.
The procedure for estimating the imputation variance using plausible values is the following (Mislevy, R.J., Beaton, A.E., Kaplan, B., and Sheenan, K.M., 1992). First compute the statistic t, for each set of M plausible values (in TIMSS, M is 5). The statistics tm, where m = 1, 2, …, 5, can be anything estimable from the data, such as a mean, the difference between means, percentiles, and so forth.
Once the statistics are computed, the imputation variance is then computed as:
� � � �Mimp ttVarMVar ,...,11 1��
and is the variance of the M estimates computed using each plausible value.
The standard errors of the mathematics and science proficiency statistics reported by TIMSS include both sampling and imputation variance components. These standard errors were computed using the following formula:
TIMSS 2003 International Database User Guide2-52
� � � � impjrrpv VartVartVar �� 1 where Var
jrr(t
1) is the sampling variance for the first plausible value and Var
imp is
the imputation variance. The standard error is the square root of Var(tpv
).
SAS and SPSS macros that may be used to calculate these jackknife standard errors are provided with the TIMSS 2003 International Database and described later in this user guide.
References
Foy, P. and Joncas, M. (2004), TIMSS 2003 Sampling Design. In M.O. Martin, I.V.S. Mullis, & Chrostowski, S.J. (Eds.) (2004), TIMSS 2003 Technical Report. Chestnut Hill, MA: Boston College.
Joncas, M. (2004), TIMSS 2003 Sampling Weights and Participation Rates. In M.O. Martin, I.V.S. Mullis, & Chrostowski, S.J. (Eds.) (2004), TIMSS 2003 Technical Report. Chestnut Hill, MA: Boston College.
Gonzalez, E. J., Galia, J. & Li, I.(2004), Scaling Methods and Procedures for the TIMSS 2003 Mathematics and Science Scales. In M.O. Martin, I.V.S. Mullis, & Chrostowski, S.J. (Eds.) (2004), TIMSS 2003 Technical Report. Chestnut Hill, MA: Boston College.
Johnson, E. G., and Rust, K.F. (1992). Population references and variance estimation for NAEP data. Journal of Educational Statistics, 17, 175-190
Mislevy, R.J., Beaton, A.E., Kaplan, B., and Sheenan, K.M. (1992). Estimating Population Characteristics from Sparse Matrix Samples of Item Responses, Journal of Educational Measurement, 29, 133-161.
Martin, M.O., Mullis, I.V.S., Chrostowski, S.J. (eds.) (2004), TIMSS 2003 Technical Report, Chestnut Hill, MA: Boston College.
Martin, M.O., Mullis, I.V.S., Gonzalez, E. J., Chrostowski, S.J. (2004). TIMSS 2003 International Science Report: Findings from IEA’s Trends in International Mathematics and Science Study at the Fourth and Eighth Grades. Chestnut Hill, MA: Boston College.
Mullis, I. V. S., Martin, M. O., Gonzalez, E. J., Chrostowski, S. J. (2004). TIMSS 2003 International Mathematics Report: Findings from IEA’s Trends in International Mathematics and Science Study at the Fourth and Eighth Grades. Chestnut Hill, MA: Boston College.

TIMSS 2003 International Database User Guide 2-53
Mullis, I.V.S., Martin, M.O., Smith, T.A., Garden, R.A., Gregory, K.D., Gonzalez, E.J., Chrostowski, S.J., & O’Connor, K.M. (2003), TIMSS Assessment Frameworks and Specifications 2003 (2nd ed.), Chestnut Hill, MA: TIMSS International Study Center, Boston College.
Ramirez, M. J. and Arora, A. (2004), Reporting TIMSS 2003 Questionnaire Data. In M.O. Martin, I.V.S. Mullis, & Chrostowski, S.J. (Eds.) (2004), TIMSS 2003 Technical Report. Chestnut Hill, MA: Boston College.
Smith Neidorf, T.A. and Garden, R. A. (2004), Developing the TIMSS 2003 Mathematics and Science Assessment and Scoring Guides. In M.O. Martin, I.V.S. Mullis, & Chrostowski, S.J. (Eds.) (2004), TIMSS 2003 Technical Report. Chestnut Hill, MA: Boston College.
Wolter, K. M. (1985). Introduction to Variance Estimation. New York: Springer-Verlag.


TIMSS 2003 International Database User Guide 3-1
3 Content and Format of Database Files
3.1 Overview
The TIMSS 2003 international database contains achievement data and student, teacher, and school background data collected in the 49 countries that participated in TIMSS 2003. In total, the database contains responses of over 365,000 students, 38,000 teachers, and 12,000 school principals. This chapter describes the content and format of the database. Following this overview, the chapter is organized in six major sections corresponding to the types of files included in the database. Within each section, the contents of the files are described. These file types are:
Data Files
The TIMSS 2003 data files reflect the result of an extensive series of data management and quality control steps taken to ensure the international comparability, quality, accuracy, and general utility of the database in order to provide a strong foundation for secondary analyses. They contain responses to background questionnaires administered to students, their teachers, and the principals of their schools. As part of the international data files, variables derived for reporting in the international reports are also included. The database also contains student achievement data and scoring reliability data, as well as the responses to national curriculum questionnaires provided by the National Research Coordinators.
Codebook Files
Codebook files document the structure of each of the data files as well as information about the format of the variables in each of the data files.
Data Almanacs
Data Almanac files contain weighted summary statistics for each participating country on each achievement item and each variable in the student, teacher, and school background questionnaires.

TIMSS 2003 International Database User Guide3-2
Program Files
Several program files are provided for use in secondary analyses, including Data Access Control Files for converting the raw data files provided in ASCII format into SAS or SPSS files; SAS and SPSS macro programs for computing statistics from the plausible values discussed in Chapter 2 using the jackknife repeated replication method; and SAS and SPSS macro programs for converting achievement item response codes to score values used in the computation of international scores.
Item Information Files
The Item Information files contain information about the cognitive test items, including item identification, item type, scoring key, number of points, label, and content and cognitive domains.
Test-Curriculum Matching Analysis Files
TIMSS 2003 asked each country to indicate which items on the assessment, if any, were not included in its curriculum. Using these data, Test-Curriculum Matching Analysis (TCMA) files were created that enable each country to compare its performance to that of all the other countries on only those items appropriate for its curriculum. Also, the performance of its students on items judged appropriate for the curricula in other countries can be compared.
The following sections describe each of the file types and how they can be used to access and analyze the TIMSS international data.
3.2 The Data Files
Data files are provided for each country that participated in TIMSS and for which internationally comparable data are available.
There are five basic types of data files in the TIMSS International Database:
• Background files with information from students, their mathematics teachers, their science teachers, and the principals of their schools. These also include student mathematics and science scores (plausible values) on the assessment.
• Achievement files with responses to the items on the TIMSS test
• Constructed-Response Scoring Reliability files
• Student Teacher-Linkage files

TIMSS 2003 International Database User Guide 3-3
• Curriculum Questionnaire files.
These files and the variables contained in each are described below.
Data File and Variable Naming Conventions
Before describing the various data files, this section presents the file and variable-naming conventions used in the TIMSS database. It also describes how the variables are organized in the database.
Data File Naming Convention
The filenames of the data files included with this database consist of an eight character string followed by a three character file extension, and use the following conventions:
• The first character of the files is “B” for the eighth grade and “A” for the fourth grade.
• The second character indicates the source or level of the information in the file:
C indicates a school-level file
T indicates a teacher-level file
S indicates a student-level file
U indicates a curriculum questionnaire file.
• The third character indicates the type of data in the file. The following abbreviations are used:
A Student Achievement Booklets
G General Background Questionnaires (School, Student and Curriculum Questionnaires), and the General Teacher Questionnaire for the fourth grade
M Mathematics Teacher Background Questionnaires
R Constructed-Response Scoring Reliability (scoring reliability sample of student test booklets)
S Science Teacher Background Questionnaires
T Student-Teacher Linkage Files.
• Characters four through six identify the country using a three-character alphanumeric country abbreviation following the ISO coding scheme. Exhibits 3.2 and 3.3 list the ISO codes for each participating country. The Curriculum Questionnaire files use the three-letter combinations

TIMSS 2003 International Database User Guide3-4
MAT and SCI to represent their contents as Mathematics and Science respectively.
• The seventh and eighth characters indicate the study cycle:
M1 stands for the 1995 files
M2 stands for the 1999 files
M3 stands for the 2003 files
• The three-character file extensions used for the data files are as follows:
.RAW indicates ASCII data
.EXP indicates SAS export data
.SAV indicates SPSS data
.XLS indicates Excel format for the Curriculum Questionnaire files.
For each file type, a separate data file is provided for each participating country. For TIMSS 2003 we also have SAS export and SPSS system files (extensions .EXP and .SAV). Files are not provided for countries for which data are not available. There are separate Curriculum Questionnaire files by grade and subject in Excel format, with all contributing countries’ data included. The file names in Exhibit 3.1 illustrate the naming conventions for each of the data files across the three TIMSS survey cycles.

TIMSS 2003 International Database User Guide 3-5
Exhibit 3.1 TIMSS Data Files
File Type1995 Files 1999 Files 2003 Files
Student Achievement Files
BSA<Country>M1,
ASA<Country>M1
BSA<Country>M2 BSA<Country>M3,
ASA<Country>M3
Student Background Files BSG<Country>M1,
ASG<Country>M1
BSG<Country>M2 BSG<Country>M3,
ASG<Country>M3
Teacher Background Files (M is for Mathematics, S is for Science)
BTM<Country>M1,
BTS<Country>M1,
ATG<Country>M1
BTM<Country>M2,
BTS<Country>M2
BTM<Country>M3,
BTS<Country>M3,
ATG<Country>M3
School Background File BCG<Country>M1,
ACG<Country>M1
BCG<Country>M2 BCG<Country>M3,
ACG<Country>M3
Student – Teacher Linkage File
BST<Country>M1,
AST<Country>M1
BST<Country>M2 BST<Country>M3,
AST<Country>M3
Student Achievement Scoring Reliability File
BSR<Country>M1,
ASR<Country>M1
BSR<Country>M2 BSR<Country>M3,
ASR<Country>M3
Curriculum Questionnaire File
BUGMATM3, BUGSCIM3,
AUGMATM3, AUGSCIM3
The three-character abbreviations used for each TIMSS country are listed in Exhibits 3.2 and 3.3, along with a numeric code for each country that is used to identify the country in the data files (see the following section discussing identification variables). Each file that is available within a country is annotated with a “•” in Exhibits 3.2 and 3.3. Although Exhibits 3.2 and 3.3 also show the files available in TIMSS 1995 and 1999, these files are not included in the TIMSS 2003 database.1
1 The TIMSS 1995 and 1999 Databases can be downloaded from www.timss.bc.edu to perform trend analyses.
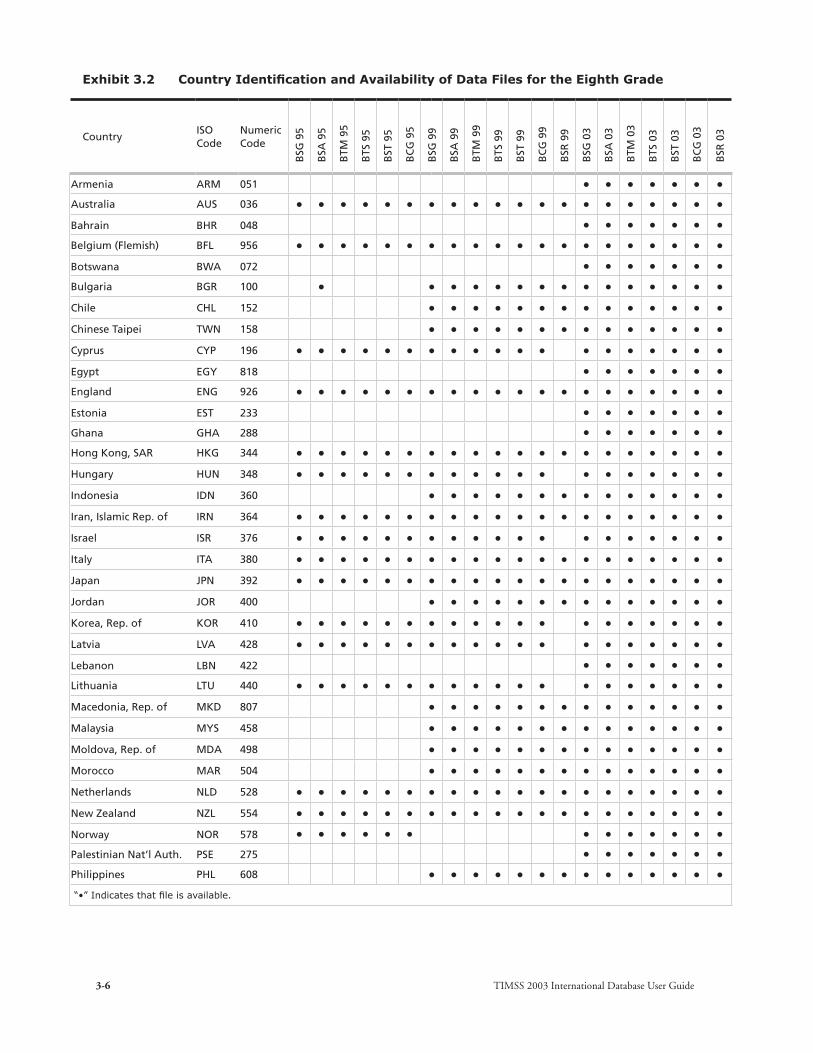
TIMSS 2003 International Database User Guide3-6
Exhibit 3.2 Country Identification and Availability of Data Files for the Eighth Grade
CountryISO Code
Numeric Code
BSG
95
BSA
95
BTM
95
BTS
95
BST
95
BC
G 9
5
BSG
99
BSA
99
BTM
99
BTS
99
BST
99
BC
G 9
9
BSR
99
BSG
03
BSA
03
BTM
03
BTS
03
BST
03
BC
G 0
3
BSR
03
Armenia ARM 051 • • • • • • •Australia AUS 036 • • • • • • • • • • • • • • • • • • • •
Bahrain BHR 048 • • • • • • •Belgium (Flemish) BFL 956 • • • • • • • • • • • • • • • • • • • •
Botswana BWA 072 • • • • • • •Bulgaria BGR 100 • • • • • • • • • • • • • • •
Chile CHL 152 • • • • • • • • • • • • • •
Chinese Taipei TWN 158 • • • • • • • • • • • • • •
Cyprus CYP 196 • • • • • • • • • • • • • • • • • • •
Egypt EGY 818 • • • • • • •England ENG 926 • • • • • • • • • • • • • • • • • • • •
Estonia EST 233 • • • • • • •Ghana GHA 288 • • • • • • •Hong Kong, SAR HKG 344 • • • • • • • • • • • • • • • • • • • •
Hungary HUN 348 • • • • • • • • • • • • • • • • • • •
Indonesia IDN 360 • • • • • • • • • • • • • •
Iran, Islamic Rep. of IRN 364 • • • • • • • • • • • • • • • • • • • •
Israel ISR 376 • • • • • • • • • • • • • • • • • • •
Italy ITA 380 • • • • • • • • • • • • • • • • • • • •
Japan JPN 392 • • • • • • • • • • • • • • • • • • • •
Jordan JOR 400 • • • • • • • • • • • • • •
Korea, Rep. of KOR 410 • • • • • • • • • • • • • • • • • • •
Latvia LVA 428 • • • • • • • • • • • • • • • • • • •
Lebanon LBN 422 • • • • • • •Lithuania LTU 440 • • • • • • • • • • • • • • • • • • •
Macedonia, Rep. of MKD 807 • • • • • • • • • • • • • •
Malaysia MYS 458 • • • • • • • • • • • • • •
Moldova, Rep. of MDA 498 • • • • • • • • • • • • • •
Morocco MAR 504 • • • • • • • • • • • • • •
Netherlands NLD 528 • • • • • • • • • • • • • • • • • • • •
New Zealand NZL 554 • • • • • • • • • • • • • • • • • • • •
Norway NOR 578 • • • • • • • • • • • • •Palestinian Nat’l Auth. PSE 275 • • • • • • •Philippines PHL 608 • • • • • • • • • • • • • • “•” Indicates that file is available.

TIMSS 2003 International Database User Guide 3-7
Exhibit 3.2 Country Identification and Availability of Data Files for the Eighth Grade (...Continued)
CountryISO Code
Numeric Code
BSG
95
BSA
95
BTM
95
BTS
95
BST
95
BC
G 9
5
BSG
99
BSA
99
BTM
99
BTS
99
BST
99
BC
G 9
9
BSR
99
BSG
03
BSA
03
BTM
03
BTS
03
BST
03
BC
G 0
3
BSR
03
Romania ROM 642 • • • • • • • • • • • • • • • • • • •
Russian Federation RUS 643 • • • • • • • • • • • • • • • • • • • •
Saudi Arabia SAU 682 • • • • • • •Scotland SCO 927 • • • • • • • • • • • • •Serbia SCG 891 • • • • • • •Singapore SGP 702 • • • • • • • • • • • • • • • • • • • •
Slovak Republic SVK 201 • • • • • • • • • • • • • • • • • • • •
Slovenia SVN 705 • • • • • • • • • • • • • • • • • • •
South Africa ZAF 710 • • • • • • • • • • •
Sweden SWE 752 • • • • • • • • • • • • •Syrian Arab Republic SYR 760 • • • • • • •Tunisia TUN 788 • • • • • • • • • • • • • •
United States USA 840 • • • • • • • • • • • • • • • • • • • •
Benchmarking Participants
Basque Country, Spain BSQ 3724 • • • • • • •Indiana State, US UIN 11800 • • • • • • • • • • • • •
Ontario Province, Can. COT 9132 • • • • • • • • • • • • • • • • • • •
Quebec Province, Can. CQU 9133 • • • • • • • • • • • • • • • • • • • “•” Indicates that file is available.
Exhibit 3.3 Country Identification and Availability of Data Files for the Fourth Grade
Country ISO Code Numeric Code
ASG
95
ASA
95
ATG
95
AST
95
AC
G 9
5
ASG
03
ASA
03
ATG
03
AST
03
AC
G 0
3
ASR
03
Armenia ARM 051 • • • • • •Australia AUS 036 • • • • • • • • • • •Belgium (Flemish) BFL 956 • • • • • •Chinese Taipei TWN 158 • • • • • •Cyprus CYP 196 • • • • • • • • • • •England ENG 926 • • • • • • • • • • •Hong Kong, SAR HKG 344 • • • • • • • • • • •Hungary HUN 348 • • • • • • • • • • •Iran, Islamic Rep. of IRN 364 • • • • • • • • • • •“•” Indicates that file is available.

TIMSS 2003 International Database User Guide3-8
Exhibit 3.3 Country Identification and Availability of Data Files for the Fourth Grade (...Continued)
Country ISO Code Numeric Code
ASG
95
ASA
95
ATG
95
AST
95
AC
G 9
5
ASG
03
ASA
03
ATG
03
AST
03
AC
G 0
3
ASR
03
Italy ITA 380 • • • • • • • • • • •Japan JPN 392 • • • • • • • • • • •Latvia LVA 428 • • • • • • • • • • •Lithuania LTU 440 • • • • • •Moldova, Rep. of MDA 498 • • • • • •Morocco MAR 504 • • • • • •Netherlands NLD 528 • • • • • • • • • • •New Zealand NZL 554 • • • • • • • • • • •Norway NOR 578 • • • • • • • • • • •Philippines PHL 608 • • • • • •Russian Federation RUS 643 • • • • • •Scotland SCO 927 • • • • • • • • • • •Singapore SGP 702 • • • • • • • • • • •Slovenia SVN 705 • • • • • • • • • • •Tunisia TUN 788 • • • • • •United States USA 840 • • • • • • • • • • •Yemen YEM 887
Benchmarking Participants
Indiana, US UIN 11800 • • • • • •Ontario Province, Can. COT 9132 • • • • • • • • • • •Quebec Province, Can. CQU 9133 • • • • • • • • • • •“•” Indicates that file is available.
All TIMSS data files are provided in ASCII, SAS export, and SPSS format. The Curriculum Questionnaire files are provided in Excel format. All details of the file structure are provided in the codebook files that correspond to each of the data files.2 The use of these codebooks is described later in this chapter.
Background Variable Naming Convention
International background variables obtained from the student, mathematics teacher, science teacher, school and curriculum questionnaires are provided in the corresponding background data files. In general, the background variables are provided for all countries where the data are considered internationally comparable. In a few cases, some slightly modified specific country options
2 The curriculum questionnaire files do not have codebooks.

TIMSS 2003 International Database User Guide 3-9
were retained in the international variables. The Codebook files contain the international background variable names, descriptive labels, response code definitions, formats, and field locations corresponding to each questionnaire item.
In addition to the background variables contained in the questionnaires, a number of derived variables were computed for use in the international report. These derived variables, many of which use data from more than one source, are also included in the International Database for use in secondary analyses. The derived variables can be used to reproduce the values shown in the international report tables by applying the appropriate school, teacher or student filters and weights.
The naming convention for the background variables permits the identification of the survey population and data source based on 7- or 8-character codes. These are the variables that capture the responses given to the survey instruments (background questionnaires). The following convention is followed in naming these variables:
• The first character indicates the population. “B” is used to indicate eighth grade, and “A” is used to indicate fourth grade.
• The second character indicates the type of respondent. The following abbreviations are used:
C School Principal
T Teacher
S Student.
• The third character indicates the type of question. The following abbreviations are used:
B Background Questionnaire
D Derived Variable.
• The fourth character indicates the subject or topic to which a questionnaire item refers. The following abbreviations are used3:
G General Questionnaire Item (not subject specific)
M Questionnaire item related to Mathematics
S Questionnaire item related to General Science (including Environmental Science)
B Questionnaire item related to Biology or Life Science
E Questionnaire Item related to Earth Science
C Questionnaire item related to Chemistry
P Questionnaire item related to Physics. 3 Please note that “B,” “P,” “E,” and “C” are only used in the student background data file for variables
corresponding to questions about separate sciences asked in the separate science version of the student questionnaire.

TIMSS 2003 International Database User Guide3-10
• For Background Questionnaire variables in TIMSS data files, the fifth through eighth characters indicate a question name and are unique to each variable.
The variable names in the curriculum questionnaire files follow a different naming convention. They are identical to their location code, as described in the following section.
Background Variable Location Convention
To help identify the location of the background variables in the corresponding background questionnaire, a convention has been developed that identifies the questionnaire and location within the questionnaire for each variable. This convention is followed in the Data Almanacs and in the description of the variables included in the Supplements to this User Guide (provided on the database DVD). Following this questionnaire convention, each questionnaire has been assigned a unique identification code as shown in Exhibit 3.4. This unique code is followed by the sequence number of the question within the questionnaire. For example, if the location of a variable is indicated as SQ1-06, this refers to the Question 6 in the student background questionnaire.

TIMSS 2003 International Database User Guide 3-11
Exhibit 3.4 Background Questionnaire Variable Location Conventions
Questionnaire Location Code
Student Questionnaire SQ2-*** for 8th grade general science
SQ2S-*** for 8th grade specific science,
SQ1-*** for 4th grade
Teacher Questionnaire TQM2-*** for 8th grade mathematics
TQS2-*** for 8th grade science,
TQ1-*** for 4th grade
School Questionnaire SCQ2-*** for 8th grade,
SCQ1-*** for 4th grade
Curriculum Questionnaire CQM2q*** for 8th grade mathematics,
CQM1q*** for 4th grade mathematics
CQS2q*** for 8th grade science,
CQS1q*** for 4th grade science
*** = the sequential numbering of the question location in the questionnaire.
Achievement Item Naming Convention
The achievement item variable names are based on 7- or 8-character alphanumeric codes according to the general definitions given below.
For the TIMSS test items, the following convention was used:
• The first character indicates the subject of the item. The code “M” is used for Mathematics, and “S” is used for Science.
• The second and third character indicates the assessment year when the item was first used in TIMSS. The code “01” is used for TIMSS 1995, “02” is used for TIMSS 1999, “03” is used for TIMSS 2003. Additionally, the characters “F” and “C” are used in place of the “0” for “free” items and “calculator” items, respectively. The calculator items are described in Sections 2.3 and 2.6 and the “free” items are described in Sections 10.5 and 11.3 of the TIMSS 2003 Technical Report (Martin, Mullis, & Chrostowski, 2004).
• The fourth character indicates the population for which the item was developed originally. The code “2” is used for TIMSS eighth grade, and “1” is used for the fourth grade.

TIMSS 2003 International Database User Guide3-12
• The fifth, sixth, and seventh characters are a sequential item number ranging from 001 and possibly up to 999.
• The eighth character indicates the item part. This was used only for constructed-response items. In general a constructed-response item asked one question, but in a few cases two or three questions were asked. This character was used when more than one question was asked as part of an item. In some cases for analysis purposes two of these questions were collapsed into one variable. The individual parts and the collapsed variables are all included in the database. The following codes were used:
A First question in the item
B Second question in the item
D Derived variables based on combined scores of either parts A and B when appropriate
As an example, the variable M012001A is the eighth grade mathematics item number 001, Part A, first administered in TIMSS 1995; the item S022249D is the eighth grade science item number 249, derived from combining two of the responses to item S022249, and was first administered in TIMSS 1999.
Coding Convention
A series of conventions also were adopted to code the data included in the data files. This section describes such conventions.
Background Item Response Code Values
The values assigned to each of the background item variables depend on the item format and the number of options available. For the multiple-choice items, one-digit numerical values are used to correspond to the response option. This number corresponds to the sequence of the letter in the alphabet. For example, response option A is represented with a 1, response option B with a 2, etc. Constructed-response items such as “number of students in a class” are coded with the actual number given as a response to the question.
Achievement Item Response Code Values
The values assigned to each of the achievement item variables also depend on the item format. For the multiple-choice items, one-digit numerical values of 1-5 are used to correspond to the response options A through E. For these items, the correct response is included as part of the item-variable label in the codebook files and program code is included as part of the database to score these items.

TIMSS 2003 International Database User Guide 3-13
For the constructed-response achievement test items, two-digit numerical codes are used that correspond to the diagnostic scoring rubrics used to determine fully-correct, partially-correct, and incorrect responses for each item. As described in Chapter 1 of the TIMSS 2003 Technical Report (Martin, Mullis, & Chrostowski, 2004)., the correctness score level may be determined by the first digit of these codes (codes 20 through 29 are worth 2 points; 10 through 19 are worth 1 point; and 70 through 79 are worth 0 points).
For some constructed-response items, students are asked to provide an answer with supporting work, or to provide two reasons, examples, consequences, etc. The two parts of the answer (parts A and B) are scored separately. In addition to the score given for each part contained in the part A and part B variables, the total score for the item as a whole is derived. The total score for the item is contained in an associated derived variable, indicated by a final character of D. For example, derived variable S012135D contains the combined score for item parts S012135A and S012135B. For the majority of these items, each item part is worth one point, and the derived variables have the following code values:
Code 20 Full credit (1 point on both parts A and B);
Code 10 Partial credit (1 point on either part A or B);
Code 70 No credit (0 points on both parts A and B).
In addition to the correctness score information, specific missing codes are defined as described in the next section. Since all achievement item variables are included for all students in the achievement files regardless of which test booklet they completed, a “Not Administered” code is given to all items that were not included in the test booklet assigned to each student.4
Missing Code Values
All variable values in the TIMSS international data files are numeric. Some values are reserved for missing data codes. The missing data values often depend on the field width of the variable and the variable type. However, the curriculum questionnaire files employ a single missing code value, -9, to represent all missing data.
Omitted Response Codes (ASCII: 9, 99, 999, … ; SAS: . ; SPSS: 9, 99, 999, …5)
Omitted response codes are used for questions/items that a student, parent, teacher, or school principal should have answered but did not answer. These are coded as “Omitted” in the codebooks. For questionnaire data, no differentiation has been made between items left blank and items with invalid answers, such as checking two or more response options in a categorical question, or unreadable or uninterpretable responses
4 See Chapter 1 for a presentation of the TIMSS test design. 5 In TIMSS 1999 and TIMSS 1995, omitted responses were coded to sysmis in SPSS.

TIMSS 2003 International Database User Guide3-14
to constructed-response questions. In a few cases, data received from a country in an invalid or inconsistent way were also recoded to “Omitted.” For achievement items, an omitted response code was given only in cases in which the item was left blank; a special code was used for invalid answers as described below. The length of the omitted response code given to a variable in the ASCII file depends on the number of characters needed to represent the variable. In all cases the space necessary to represent the variable was filled with 9’s.
Uninterpretable Response Codes (ASCII: 7; SAS: .I; SPSS: 7)
For the multiple-choice achievement test items, separate codes were established to distinguish between totally blank responses (omitted) and uninterpretable or invalid responses. For these items, cases where more than one response option was checked, or where an uninterpretable response was given, were coded with a 7.
Not Administered Codes (ASCII: 8, 98, 998, ... ; SAS: .A ; SPSS: sysmis)
Special codes were given for items that were not administered to distinguish these cases from data that are missing due to non-response. The specific not administered code value given depends on the length of the field for the variable. In general, the “Not Administered” code was used when an item was not administered as part of the questionnaire or test instruments either by design, such as in the case of some of the test items, or unintentionally, such as when the item was left out of the instrument or misprinted. The “Not Administered” codes are used in the following cases:
• Achievement item not assigned to the student – only one of the twelve rotated achievement booklets used in the TIMSS study was assigned to each student. All variables corresponding to items in booklets not assigned a student were coded to “Not Administered.”
• Instrument not received / instrument lost – where a respondent did not receive the instruments assigned to him/her, or the instruments were lost after administration, all items were coded to “Not Administered.”
• Student absent from session – where a student or individual was not present for a particular testing session, all variables referring to that session were coded to “Not Administered.”
• Item left out or misprinted – where a particular question or item (or a whole page) was misprinted or not available to the student, teacher, or principal, the corresponding variables where coded to “Not Administered.”
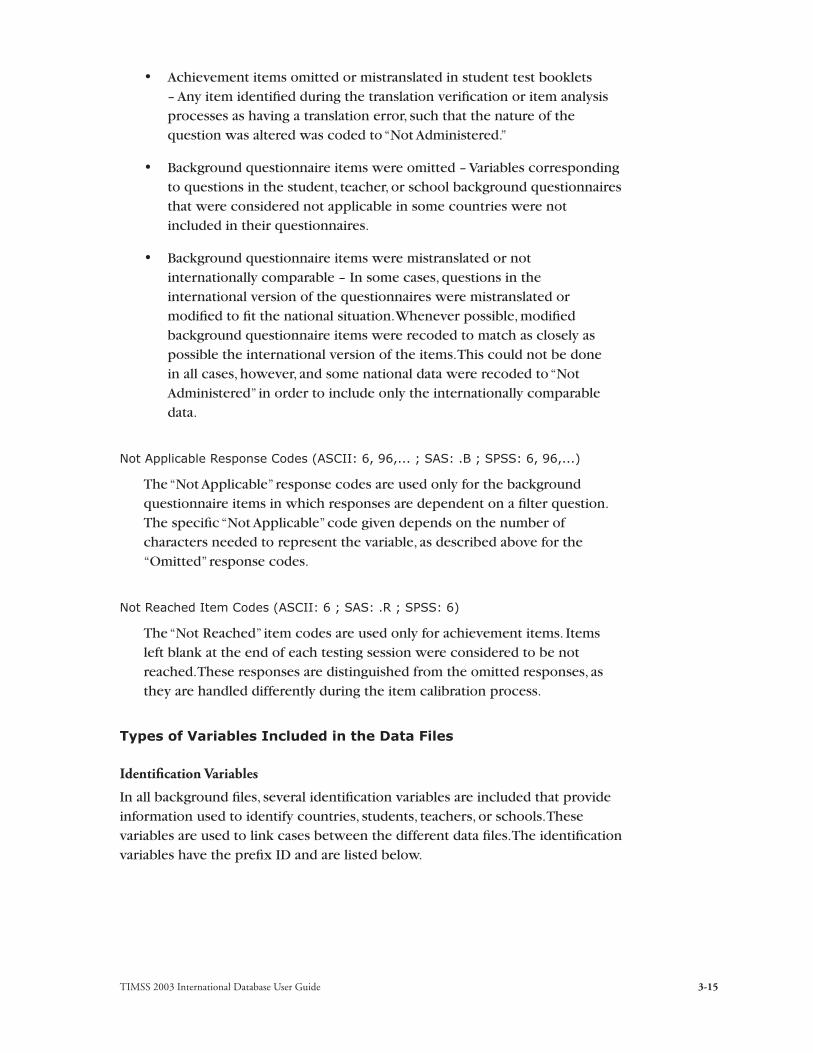
TIMSS 2003 International Database User Guide 3-15
• Achievement items omitted or mistranslated in student test booklets – Any item identified during the translation verification or item analysis processes as having a translation error, such that the nature of the question was altered was coded to “Not Administered.”
• Background questionnaire items were omitted – Variables corresponding to questions in the student, teacher, or school background questionnaires that were considered not applicable in some countries were not included in their questionnaires.
• Background questionnaire items were mistranslated or not internationally comparable – In some cases, questions in the international version of the questionnaires were mistranslated or modified to fit the national situation. Whenever possible, modified background questionnaire items were recoded to match as closely as possible the international version of the items. This could not be done in all cases, however, and some national data were recoded to “Not Administered” in order to include only the internationally comparable data.
Not Applicable Response Codes (ASCII: 6, 96,... ; SAS: .B ; SPSS: 6, 96,...)
The “Not Applicable” response codes are used only for the background questionnaire items in which responses are dependent on a filter question. The specific “Not Applicable” code given depends on the number of characters needed to represent the variable, as described above for the “Omitted” response codes.
Not Reached Item Codes (ASCII: 6 ; SAS: .R ; SPSS: 6)
The “Not Reached” item codes are used only for achievement items. Items left blank at the end of each testing session were considered to be not reached. These responses are distinguished from the omitted responses, as they are handled differently during the item calibration process.
Types of Variables Included in the Data Files
Identification Variables
In all background files, several identification variables are included that provide information used to identify countries, students, teachers, or schools. These variables are used to link cases between the different data files. The identification variables have the prefix ID and are listed below.

TIMSS 2003 International Database User Guide3-16
The identification variables included in student, teacher, and school files are the following:
IDCNTRY
Five-digit country identification code. This variable should always be used as one of the link variables whenever files are linked within and across countries.
IDPOP
Identifies the population. The value is set to 1 for the fourth grade and 2 for the eighth grade.
IDSCHOOL
Identification number that uniquely identifies the school within each country. These codes for the school are not unique across countries. Schools across countries can be uniquely identified only by the IDCNTRY and IDSCHOOL combination.
Additional identification variables in the student files include the following:
IDCLASS
Identification number that uniquely identifies the sampled class within the school. The variable IDCLASS has a hierarchical structure and is formed by concatenating the variable IDSCHOOL and a two- digit sequential number identifying the sampled classroom. Classrooms can be uniquely identified in the database by the combination of IDCNTRY and IDCLASS.
IDSTUD
Identification number that uniquely identifies each sampled student in the country. The variable IDSTUD also has a hierarchical structure and is formed by concatenating the variable IDCLASS and a two-digit sequential number within each classroom. Students can be uniquely identified in the database by the combination of IDCNTRY and IDSTUD.
IDBOOK
Identifies the specific test booklet (1-12) that was administered to the student.

TIMSS 2003 International Database User Guide 3-17
Additional identification variables in the teacher files include the following:
IDTEACH
Identification number that uniquely identifies a teacher within a school. It has a hierarchical structure formed by the combination IDSCHOOL and a two-digit sequential number within each school. Teachers can be uniquely identified in the database by the combination if IDCNTRY and IDTEACH.
IDLINK
This variable uniquely identifies the class for which the teacher answered the questionnaire. The combination of variables IDCNTRY, IDTEACH, and IDLINK uniquely identifies a teacher-class combination in the database.
In the Student Background file, the IDSTUD variable provides a unique identification number to identify each student within each country. Since teachers may teach more than one class, the IDTEACH and IDLINK combinations in the Teacher Background files provide a unique identification for each teacher teaching a specific class. Teacher background variables are linked to appropriate students using the Student-Teacher Linkage file. The variable IDSCHOOL, contained in all three background files, is a unique identification number for each school within a country that may be used to link school background data to corresponding students or teachers.
Linking and Tracking Variables
Information about students, teachers, and schools provided by the survey tracking forms6 is incorporated in the linking and tracking variables. These variables have prefixes of IL or IT.
Linking and tracking variables in the Student Background Files include the following:
ITSEX Gender of each student as stated in the student tracking form.
ITBIRTHM and ITBIRTHY
Month and year of birth of each student as stated in the student tracking forms.
ITDATEM and ITDATEY
Month and year of testing for each student.
ITLANG7 Language of testing for each student. Set to 1 for all countries that tested in a single language.
6 Survey tracking forms are listings of students, teachers, or schools used for sampling and administration purposes.
7 See Supplement 2 for a list of the languages included in each country.

TIMSS 2003 International Database User Guide3-18
For countries that administered the test in more than one language, codes of 1, 2 and 3 were used to correspond to the order of the languages shown in Supplement 2.
ITCOURSE8 Tracking variable indicating the type of course taught by teachers: Mathematics = 1; Physics = 2; Biology = 3; Chemistry = 4; Earth science = 5; Integrated science (including Environmental Science) = 6; Mathematics and Integrated science (for the fourth grade) = 7; Physical Science (which combines Physics & Chemistry)9 = 8; Life Science (which combines Biology & Earth Science)10 = 9; and other country-specific science courses = 10, 11 or 12. This variable was also used to identify teachers for inclusion in separate science panels in the international reports’ exhibits (1999 and 2003 only).
ILRELIAB Linking variable indicating the inclusion status of each student in the reliability file containing double-coded constructed-response items. The following codes are used:
Code 1 Student questionnaire used for reliability analysis
Code 0 Student questionnaire NOT used for reliability analysis
Selection Variables
These variables are used to select cases for particular analyses. In the student files and in the Student-Teacher linkage files the following variables are included:
INTMS03 Students with INTMS03 set to “1” participated in the TIMSS 2003 achievement test and who are part of the TIMSS 2003 international sample. Otherwise this variable is set to zero.
INTMS99 In both the TIMSS 2003 and the TIMSS 1999 data sets, students with INTMS99 set to “1” participated in the TIMSS 1999 achievement test and are part of the TIMSS 1999 international sample. Otherwise this variable is set to zero.
INTMS95 In the TIMSS 2003, TIMSS 1999, and TIMSS 1995
8 See Supplement 2 for a list of the ITCOURSE values used in each country. 9 Student background data are entered and reported in the Physics variables. 10 Student background data are entered and reported in the Biology variables.

TIMSS 2003 International Database User Guide 3-19
data sets, students with INTMS95 set to “1” participated in the TIMSS 1995 achievement test and are part of the TIMSS 1995 international sample. Otherwise this variable is set to zero.
Sampling and Weighting Variables
Several sampling and weighting variables are included in the student data files. These variables are described in the previous chapter and in Chapter 9 of the TIMSS 2003 Technical Report (Martin, Mullis, & Chrostowski, 2004). The variables are the following:
WGTFAC1 School Weighting Factor. This variable is included in the Student and in the School Background data files.
WGTADJ1 School Weighting Adjustment. This variable is included in the Student and in the School Background data files.
WGTFAC2 Class Weighting Factor. This variable is included in the Student Background data files.
WGTADJ2 Class Weighting Adjustment. This variable is included in the Student Background data files.
WGTFAC3 Student Weighting Factor. This variable is included in the Student Background data files.
WGTADJ3 Student Weighting Adjustment. This variable is included in the Student Background data files.
TOTWGT Total Student Weight. This variable is included in the Student Background data files.
SENWGT Student Senate Weight. This variable is included in the Student Background data files.
HOUWGT Student House Weight. This variable is included in the Student Background data files.
TCHWGT Overall Teacher Weight. This variable is included in the Student-Teacher Linkage data files.
MATWGT Mathematics Teacher Weight. This variable is included in the Student-Teacher Linkage data files.
SCIWGT Science Teacher Weight. This variable is included in the Student-Teacher Linkage data files.
SCHWGT School-level Weight. This variable is included in the School Background data file.

TIMSS 2003 International Database User Guide3-20
JKZONE The sampling zone or stratum to which the student’s school is assigned. This variable is included in the School Background, Student Background and Student-Teacher Linkage data files.
JKREP The primary sampling unit to which the student is assigned. This variable is included in the School Background, Student Background and Student-Teacher Linkage data files.
Achievement Variables
Several achievement variables are also included in the Student data files. These variables are described in Chapter 2. The achievement variables included, for both the eighth and fourth grades, are the following:
BSMMAT01-5, ASMMAT01-5 Mathematics Overall: Plausible Values 1-5, fourth and eighth grades
BSMFNS01-5, ASMFNS01-5 Number: Plausible Values 1-5, fourth and eighth grades
BSMALG01-5 Algebra: Plausible Values 1-5, eighth grades
ASMALG01-5 Patterns and Relationships: Plausible Values 1-5, fourth grades
BSMMEA01-5, ASMMEA01-5 Measurement: Plausible Values 1-5, fourth and eighth grades
BSMGEO01-5, ASMGEO01-5 Geometry: Plausible Values 1-5, fourth and eighth grades
BSMDAP01-5, ASMDAP01-5 Data: Plausible Values 1-5, fourth and eighth grades
BSSSCI01-5, ASSSCI01-5 Science Overall: Plausible Values 1-5, fourth and eighth grades
BSSLIS01-5, ASSLIS01-5 Life Science: Plausible Values 1-5, fourth and eighth grades
BSSCHE01-5 Chemistry: Plausible Values 1-5, eighth grades
BSSPHY01-5 Physics: Plausible Values 1-5, eighth grades
ASSPHY01-5 Physical Science: Plausible Values 1-5, fourth grades
BSSEAS01-5, ASSEAS01-5 Earth Science: Plausible Values 1-5, fourth and eighth grades
BSSERI01-5 Environmental Science: Plausible Values 1-5, eighth grades

TIMSS 2003 International Database User Guide 3-21
BSMSCPT, ASMSCPT Number of raw score points obtained on the mathematics items, fourth and eighth grades
BSSSCPT, ASSSCPT Number of raw score points obtained on the science items, fourth and eighth grades
BSMSTDR, ASMSTDR Standardized mathematics raw scores, fourth and eighth grades
BSSSTDR, ASSSTDR Standardized science raw scores, fourth and eighth grades
BSMNRSC, ASMNRSC National Rasch Mathematics Scores, fourth and eighth grades
BSSNRSC, ASSNRSC National Rasch Science Scores, fourth and eighth grades
BSMIBM01-5, ASMIBM01-5 International Mathematics Benchmarks reached with plausible values, fourth and eighth grades
BSSIBM01-5, ASSIBM01-5 International Science Benchmarks reached with plausible values, fourth and eighth grades
TIMSS Background Data Files
There are three different types of TIMSS background files – Student, Teacher, and School. These are described below.
Student Background File
Students who participated in TIMSS were administered a background questionnaire with questions related to home background, school experiences, and attitudes to mathematics and science. The Student Background file contains students’ responses to these questions. It also contains students’ mathematics and science achievement scores (plausible values) to facilitate analyses of relationships between background characteristics and achievement. Two versions of the student questionnaire were administered in TIMSS for the eighth grade. One version was for educational systems where science is taught as an integrated subject (general science version). The other version was for educational systems where the sciences (biology or life science, earth science, physics, chemistry, and environmental science) are taught separately (separate science version).
At the fourth grade, there was a single version of the student questionnaire, tailored toward general science. For eighth-grade students who were administered the general science version, questions that were given only in the separate science version were coded as not administered. For students who were assigned the separate science version, questions that were asked only in the general science version were coded as not administered. The Student

TIMSS 2003 International Database User Guide3-22
Background files also contain a series of identification variables, link variables, sampling variables, achievement variables, and the derived variables that were used for the creation of the international reports.
Teacher Background File
The mathematics and science teachers of the eighth-grade students that were sampled for TIMSS were administered at least one questionnaire with questions pertaining to their background and their teaching practices in the classes of the sampled students. Each teacher was asked to respond to a questionnaire for each class taught that contained sampled students. The Teacher Background files contain one record for each of the classes taught either by a mathematics or a science teacher. If a teacher taught more than one class, they were expected to complete only one part A (general background questions) and a separate part B (class-specific questions) for each class they taught. In some cases, although the teacher was to respond to more than one questionnaire, responses to only one were obtained. In these cases, there were as many records entered in the teacher file as classes were taught by the teacher, and the background information in part A from the complete questionnaire was entered into these teacher records. There were two questionnaires administered in TIMSS for the eighth grade–one for the mathematics teachers and one for the science teachers. The data from these questionnaires are found in separate files. Variable names for questions asked in both questionnaires are the same. At the fourth grade, the situation was more straightforward, with a single teacher questionnaire requesting information on both mathematics and science.
In the Teacher Background data files at both grade levels, each teacher has an unique identification number (IDTEACH) and a Teacher Link Number (IDLINK) that is specific to the class taught by the teacher and to which the information in the data record corresponds. The IDTEACH and IDLINK combination uniquely identifies a teacher teaching a specific class. So, for example, students linked to teachers identified by the same IDTEACH but different IDLINK are taught by the same teacher but in different classes. The Teacher Background files cannot be merged directly with the student data files and they do not contain sampling information or achievement scores. It is important to note that the teachers in the Teacher Background data files do not constitute a representative sample of teachers in a country, but rather are the teachers who taught a representative sample of students. The teacher data should therefore be thought of as attributes of the students to which it is linked, and should be analyzed only in conjunction with the Student-Teacher Linkage file. As well as the responses of the teachers to the background questions, the Teacher Background data files contain the identification and link variables necessary to merge them with schools and students.
TIMSS 2003 International Database User Guide 3-23
School Background File
The principals or administrators of the schools in the TIMSS sample were administered a school background questionnaire with questions about school policy, resources, and environment. The School Background data file contains the responses given to the questions in this questionnaire. That file also contains a series of identification variables, link variables, and sampling variables. The school data files can be merged with the student data files by using the country and school identification variables.
Student Achievement Data Files
Student achievement files contain the student responses to the mathematics and science achievement items in the TIMSS achievement test.
Students who participated in TIMSS were administered one of twelve test booklets with questions in both mathematics and science. Some of these questions were multiple-choice questions and some were constructed-response. The achievement test data files contain the answers to the multiple-choice questions and the codes assigned by the scorers to the student responses for constructed-response questions. Items not included in the students test booklet were coded as “not administered”. The number of the test booklet (1-12) administered to the student is coded in the variable IDBOOK. The student achievement data files also contain a series of identification variables, sampling variables, and achievement scores. The data contained in this file can be linked to the student background data files by using the variables IDCNTRY and IDSTUD.
Scoring Reliability Data Files
The scoring reliability files for fourth and eighth grades contain data that can be used to investigate the within-country reliability of the TIMSS constructed-response item scoring. The scoring reliability files contain one record for each booklet that was double scored during the scoring reliability exercise of the constructed-response items.
For each constructed-response item in the achievement test, the following three variables are included:
• Original Score (two-digit score assigned by the first scorer)
• Second Score (two-digit score assigned by second scorer)
• Response Score Agreement (degree of agreement between the two scorers)
It should be noted that the Second Score data were used only to evaluate the within-country sampling reliability and were not used in computing the achievement scores reflected in the Student Background files and the international reports.

TIMSS 2003 International Database User Guide3-24
Scoring Reliability Variable Naming Convention
The variable names for the Original Score, Second Score, and Agreement Score variables are based on the same general naming system as that for the achievement item variables shown earlier. The second character in the variable name differentiates the three reliability variables:
0 Original Score (e.g. M012001)
R Second Score Variable (e.g. MR12001)
I Agreement Score Variable (e.g. MI12001)
Reliability Score Values
The values contained in both the Original Score and Second Score variables are the two-digit diagnostic codes obtained using the TIMSS scoring rubrics. The Agreement Score variable may have one of three values depending on the degree of agreement between the two scorers:
Code 0 Identical codes (both digits in the original and second scores)
Code 1 Identical score level but different diagnostic code (first digits are the same; second digits are different)
Code 2 Different score level (first digits are different)
In general, the values contained in the Original Scores are identical to those contained in the Student Achievement test files. In some cases, however, the response codes for specific items were recoded after a review of the international item statistics revealed inconsistencies in the original coding guides or showed that the original codes were not functioning as desired. The recoded diagnostic code values were used in computing the achievement scores reflected in the international reports, and the response codes in the Student Achievement test files reflect the recoded values. However, the Original Scores in the scoring reliability files contain the original unrecoded response codes.
In addition to the scoring reliability variables, the reliability files also include identification variables to aid in case identification. Some tracking variables are also included that were used in conducting the scoring reliability study within each country.
Student-Teacher Linkage Files
The Student-Teacher Linkage files for TIMSS contain information required to link the student and teacher files and to compute appropriately weighted teacher-level data for use in student-level analyses.
TIMSS 2003 International Database User Guide 3-25
The Student-Teacher Linkage files contain one entry per student-teacher linkage combination in the data. In many cases, students are linked to more than one mathematics and/or science teacher, and in these cases there will be one record for each student-teacher link. In addition, in some countries many students may also have more than one teacher for each of the two subject areas. For instance, if three teachers are linked to a student, there are three entries in the file corresponding to that student.
Curriculum Questionnaire Files
The Curriculum Questionnaire files for TIMSS contain information provided by the National Research Coordinators of the participating countries on the intended Mathematics and Science curricula at both target grades in their country. There are four curriculum questionnaire files: fourth-grade Mathematics, fourth-grade Science, eighth-grade Mathematics and eighth-grade Science.
The Curriculum Questionnaire files are in Excel format, with each file containing one entry per country.
National Data Issues Affecting the Use of International Data Files
In some cases, resources were not available to resolve database issues for specific countries in time for either the release of the international reports or the production of the international data files for TIMSS 2003. As a result, some international data are modified or not available for some countries. These general database issues as they pertain to the TIMSS 2003 data are documented below on a country-by-country basis. Similar database issues pertaining to the 1995 and 1999 databases are documented in the 1999 User Guide since they impact the ability to perform trend analyses in some cases.
Armenia
In Armenia, the separate science questionnaire was administered to the eighth-grade students. However, there were some general/integrated science teachers answering the science teacher questionnaire. The ITCOURSE values are set to Not Administered for these teachers and the data were not used for the International Report.
Belgium (Flemish)
In Belgium (Flemish), eighth-grade students are enrolled in three science courses (physics, biology, and earth science). In some schools there are natural science and/or scientific work courses. In these cases, national codes 11 and 12 are used for ITCOURSE.

TIMSS 2003 International Database User Guide3-26
Bulgaria
In Bulgaria, there are eighth-grade classes where students study only mathematics and no science. In these cases, dummy records were created for the missing science teachers based on the missing ITCOURSE values for each student. Appropriate weights and student-teacher links were assigned and all background variables were set to Not Administered for the missing science teachers.
Chinese Taipei
In Chinese Taipei, eighth-grade students were asked about physical science, and the data pertain to their physics/chemistry course. There are no biology, or earth science courses. The general/integrated science questionnaire was administered to the eighth grade students.
Cyprus
In Cyprus, the separate science questionnaire was administered to the eighth-grade students. However, there were some general/integrated science teachers answering the science teacher questionnaire. The ITCOURSE values are set to Not Administered for these teachers and the data were not used for the International Report.
Indonesia
In Indonesia, eighth-grade students are enrolled in two science courses (physics and biology) and, therefore, the separate science questionnaire was administered to these students. However, there were some general/integrated science teachers answering the science teacher questionnaire. The ITCOURSE values are set to Not Administered for these teachers and the data were not used for the International Report.
Israel
In Israel, the general/integrated science questionnaire was administered to the eighth-grade students. However, there were some separate science teachers answering the science teacher questionnaire. The student data are entered and reported in the general/integrated science variables.
Lebanon
In Lebanon, eighth-grade biology pertains to life and earth science courses. In this case, code 9 is used for ITCOURSE. The separate science questionnaire was administered to the eighth-grade students. However, there were some separate science teachers answering the science teacher questionnaire. The student data are entered and reported in the separate science variables.

TIMSS 2003 International Database User Guide 3-27
Macedonia
In Macedonia, the separate science questionnaire was administered to the eighth-grade students. However, there were some general/integrated science teachers answering the science teacher questionnaire. The ITCOURSE values are set to Not Administered for these teachers and the data were not used for the International Report.
Moldova
In some schools, there is a combined Biology/Chemistry course. In these cases, a national code 10 is used for ITCOURSE. The separate science questionnaire was administered to the eighth-grade students. However, there were some general/integrated science teachers and some mathematics teachers answering the science teacher questionnaire. The ITCOURSE values are set to Not Administered for these teachers and the data were not used for the International Report.
Morocco
In Morocco, eighth- grade biology pertains to life science (biology/earth science), and eighth-grade physics pertains to physical science (physics/chemistry). In these cases, codes 8 and 9 are used for ITCOURSE. There were some missing ITCOURSE values for science teachers since there is no information available on the science course taught by these teachers.
Philippines
In the Philippines, eighth-grade general/integrated science students study only biology. The student data are entered and reported in the general/integrated science variables.
Slovak Republic
In the Slovak Republic, the separate science questionnaire was administered to the eighth-grade students. However, there were some general/integrated science teachers answering the science teacher questionnaire. The ITCOURSE values are set to Not Administered for these teachers and the data were not used for the International Report.
Sweden
In Sweden, the separate science questionnaire was administered to the eighth-grade students. However, there were some general/integrated science teachers answering the science teacher questionnaire. The student data are entered and reported in the separate science variables.
TIMSS 2003 International Database User Guide3-28
Syrian Arab Republic
The Syrian Arab Republic adopted classroom sampling procedures that did not meet the TIMSS sampling standards, and therefore their data were summarized in appendices of the International Reports.
Yemen
Yemen adopted classroom sampling procedures that did not meet the TIMSS sampling standards, and therefore their data were summarized in appendices of the International Reports.
3.3 Codebook Files
All information related to the structure of the data files as well as the source, format, descriptive labels, and response option codes for all variables are contained in codebook files. One codebook file is provided for each of the data files listed earlier.
The naming convention of the codebook files is as follows:
• The first character of the file name is “B” for eighth grade data and “A” for fourth grade data.
• The second character indicates the source or level of the information in the file:
C indicates a school level file
T indicates a teacher level file
S indicates a student level file
• The third character indicates the subject and/or type of the data in the file. The following abbreviations are used, listed in alphabetical order:
A Student Achievement Files
G General Background Questionnaires (School, Student, and fourth grade Teacher Questionnaires)
M Mathematics Teacher Background Questionnaire
R Constructed-Response Scoring Reliability (scoring reliability sample of Student Test booklets)
S Science Teacher Background Questionnaire
T Student-Teacher Linkage File
• The next three characters identify the file as a codebook and it is always “CBK”.
TIMSS 2003 International Database User Guide 3-29
• The seventh and eighth characters indicate the study cycle
M1 stands for the 1995 achievement files
M2 stands for the 1999 achievement files
M3 stands for the 2003 achievement files
• The three-character file extensions used for the codebook files were the following:
.CDT Codebook in ASCII text format
.SDB Codebook in Dbase format
Accessing the Codebook Files
The codebook file types are included in the database DVD. The ASCII format codebooks can be read and edited with any text editor or word processing software that can read files of their size, and can be printed after some minor formatting. Using a mono-spaced font and a font size and page layout combination that will accommodate 132 characters per line is suggested. The information for each variable is presented in several lines of text. The lines for each variable are properly labeled.
Using the Codebooks
The variables in the codebooks appear ordered by variable name within sections for each codebook type. The major sections of each codebook type are as follows:
Student, Teacher, and School Background File Codebooks
• Identification Variables
• Tracking/Linking Variables
• International Background Variables (in order of questionnaire item location)
• Sampling Variables (Student and School Files only)
• Mathematics and Science Achievement Score Variables (Student Files only)
• Derived Variables
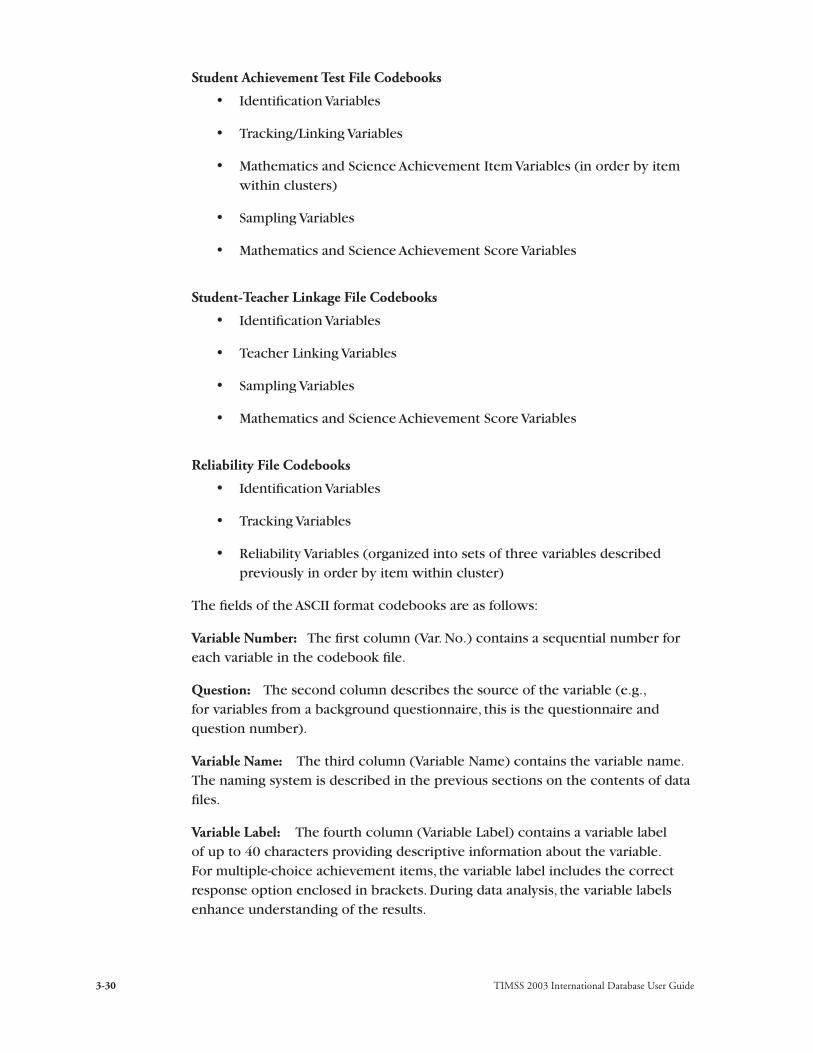
TIMSS 2003 International Database User Guide3-30
Student Achievement Test File Codebooks
• Identification Variables
• Tracking/Linking Variables
• Mathematics and Science Achievement Item Variables (in order by item within clusters)
• Sampling Variables
• Mathematics and Science Achievement Score Variables
Student-Teacher Linkage File Codebooks
• Identification Variables
• Teacher Linking Variables
• Sampling Variables
• Mathematics and Science Achievement Score Variables
Reliability File Codebooks
• Identification Variables
• Tracking Variables
• Reliability Variables (organized into sets of three variables described previously in order by item within cluster)
The fields of the ASCII format codebooks are as follows:
Variable Number: The first column (Var. No.) contains a sequential number for each variable in the codebook file.
Question: The second column describes the source of the variable (e.g., for variables from a background questionnaire, this is the questionnaire and question number).
Variable Name: The third column (Variable Name) contains the variable name. The naming system is described in the previous sections on the contents of data files.
Variable Label: The fourth column (Variable Label) contains a variable label of up to 40 characters providing descriptive information about the variable. For multiple-choice achievement items, the variable label includes the correct response option enclosed in brackets. During data analysis, the variable labels enhance understanding of the results.

TIMSS 2003 International Database User Guide 3-31
Code: The fifth column (Code) contains the codes used for variable values. For variables where numeric data are supplied in response to constructed-response questions, the keyword VALUE is entered in the Code column. For categorical variables, all possible response options are listed. Any missing codes described in Section 3.2 are also included for either non-categorical or categorical variables. For example, for multiple-choice achievement items, the code options are A, B, C, D, and E while for the constructed-response achievement items, the code options are the two-digit numerical codes described in Chapter 2.
Option: The sixth column (Option) includes a textual description of each response option. For variables containing non-categorical data, it contains an explanation of the values contained in the variable.
Location/Format: The seventh column presents the location and format of each variable in the ASCII-format raw data files. The location/format indicates the pattern used to write each value of a non-categorical or categorical variable, with a general structure of XX-YY / <N or C> ZZ .Z.
The numbers preceding the forward slash (/) indicate the location of the variable and refer to its position in the raw data file (starting (XX) - ending (YY) column positions). The <N or C> after the slash identifies the variable as non-categorical (N) or categorical (C). The numeric codes after the forward slash (ZZ.Z) indicates the total number of digits (including the decimal point) and the number of decimal places associated with each variable (e.g. 2.0 = 2 integer digits, 0 decimal places; 6.2 = six total digits: 3 integer digits, decimal point, and two decimal digits).
3.4 Data Almanacs
Data Almanac Files contain weighted summary statistics for each participating country on each achievement item and on each variable in the student, teacher, and school background questionnaires as well as on derived variables based on these questionnaires. Separate data almanacs are included for the background variables and for the achievement item variables. The data almanac files corresponding to each variable type are listed in Exhibit 3.5 and are described in the following sections.
The naming convention of the almanac files is as follows:
• The first character of the files name is “B” for the eighth grade and “A” for the fourth grade.
• The second character indicates the source or level of the information in the file:

TIMSS 2003 International Database User Guide3-32
S indicates a background, student level almanac
I indicates an achievement item almanac
• The third, fourth and fifth characters identify the file as an almanac and they are always “ALM”.
• The sixth and seventh characters identify the information contained in the almanacs. The following codes are used:
1_ Student Background Questionnaire with Mathematics Achievement
2_ Student Background Questionnaire with Science Achievement
3_ School Background Questionnaire with Mathematics Achievement
4_ School Background Questionnaire with Science Achievement
5_ Mathematics Teacher Background Questionnaire with Mathematics Achievement
7_ Science Teacher Background Questionnaire with Science Achievement
9_ Mathematics and Science Teacher Background Questionnaire with Mathematics and Science Achievement (only for the fourth grade)
5M Mathematics Item Almanacs
5S Science Item Almanacs
7M Mathematics Trend Item Almanacs
7S Science Trend Item Almanacs
• The last two characters in the file name indicates the study cycle. The following codes are used:
M1 stands for the 1995 almanac files
M2 stands for the 1999 almanac files
M3 stands for the 2003 almanac files
• Three character file extensions are used to indicate the file type, as follows:
.DOC Almanacs in MS Word format
.LST Almanacs in ASCII format
.PDF Almanacs in PDF format
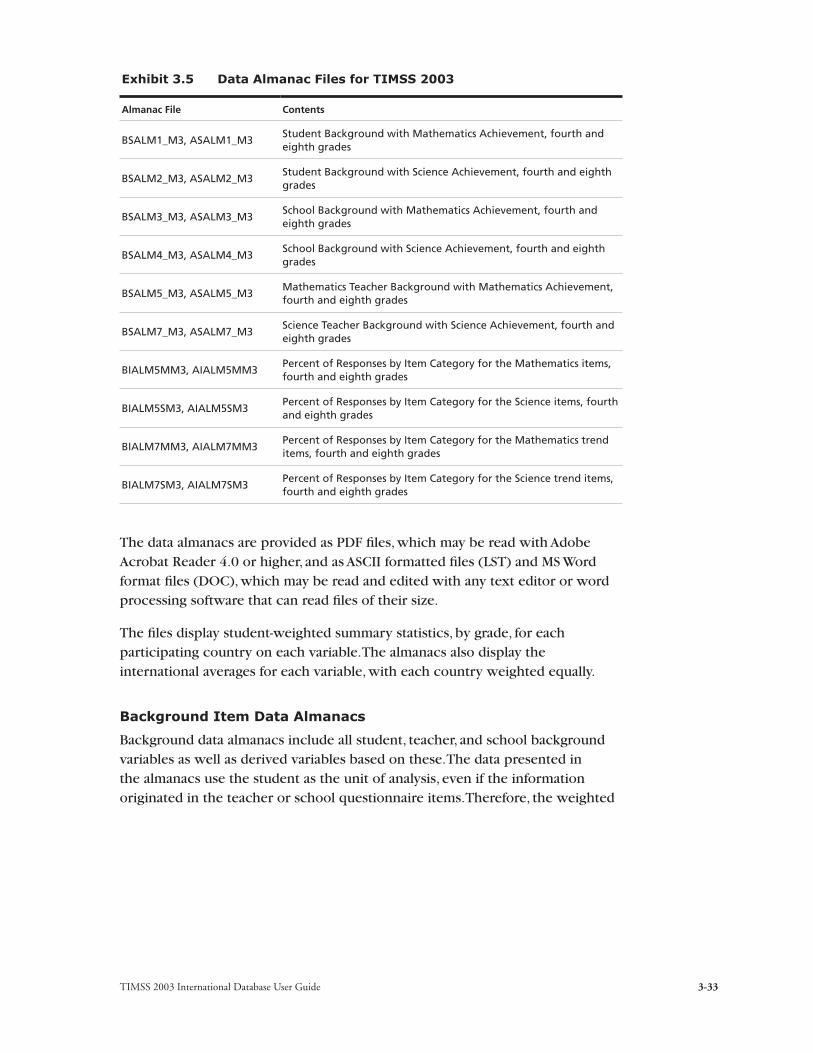
TIMSS 2003 International Database User Guide 3-33
Exhibit 3.5 Data Almanac Files for TIMSS 2003
Almanac File Contents
BSALM1_M3, ASALM1_M3Student Background with Mathematics Achievement, fourth and eighth grades
BSALM2_M3, ASALM2_M3Student Background with Science Achievement, fourth and eighth grades
BSALM3_M3, ASALM3_M3School Background with Mathematics Achievement, fourth and eighth grades
BSALM4_M3, ASALM4_M3School Background with Science Achievement, fourth and eighth grades
BSALM5_M3, ASALM5_M3Mathematics Teacher Background with Mathematics Achievement, fourth and eighth grades
BSALM7_M3, ASALM7_M3Science Teacher Background with Science Achievement, fourth and eighth grades
BIALM5MM3, AIALM5MM3Percent of Responses by Item Category for the Mathematics items, fourth and eighth grades
BIALM5SM3, AIALM5SM3Percent of Responses by Item Category for the Science items, fourth and eighth grades
BIALM7MM3, AIALM7MM3Percent of Responses by Item Category for the Mathematics trend items, fourth and eighth grades
BIALM7SM3, AIALM7SM3Percent of Responses by Item Category for the Science trend items, fourth and eighth grades
The data almanacs are provided as PDF files, which may be read with Adobe Acrobat Reader 4.0 or higher, and as ASCII formatted files (LST) and MS Word format files (DOC), which may be read and edited with any text editor or word processing software that can read files of their size.
The files display student-weighted summary statistics, by grade, for each participating country on each variable. The almanacs also display the international averages for each variable, with each country weighted equally.
Background Item Data Almanacs
Background data almanacs include all student, teacher, and school background variables as well as derived variables based on these. The data presented in the almanacs use the student as the unit of analysis, even if the information originated in the teacher or school questionnaire items. Therefore, the weighted

TIMSS 2003 International Database User Guide3-34
percentages in the teacher and school almanacs reflect the percentage of students to whom the data apply.
There are two types of displays in the background data almanacs, depending on whether data are categorical (have a small number of discrete values) or continuous.
The display for categorical variables includes:
• Sample size (number of students, teachers or schools included in the sample)
• Number of valid cases (counts of students, teachers or schools for whom valid data were obtained)
• Weighted percentages of students corresponding to each valid response option (percentages based only on the students with valid data)
• Weighted percentages of students for whom none of the valid response options were selected (the variable is coded as “Not Administered” or “Omitted”)
• Weighted mean achievement values of students corresponding to each valid response option (means based only on the students with valid data) and for whom none of the valid response options were selected.
In cases where a question was coded Not Applicable because of the response to an earlier filter question, the percentage of students for whom the variable is coded as Not Applicable is also displayed. The percent Not Applicable is based on only the students with valid data. The last line in the almanac displays the international average in each category of response.
The display for continuous variables includes:
• Sample size (number of students, teachers or schools in the sample)
• Number of valid cases (counts of students, teachers or schools with valid data)
• Weighted percentages of students for whom the variable is coded as “Not Administered”, “Not Applicable”, or “Omitted”
• The mean, mode, minimum, maximum, and the 5th , 10th , 25th , 50th , 75th , 90th, and 95th percentiles across students
• The last line in the almanac displays the international averages.

TIMSS 2003 International Database User Guide 3-35
The background data almanacs also display for each variable the question as it was asked, its location in the corresponding questionnaire, and its variable name in the data file.
Achievement Item Data Almanacs
Achievement item data almanacs provide summary statistics for every mathematics and science achievement item included in the assessment. There are two types of displays in the almanacs, depending on whether the item is a multiple-choice item or a constructed-response item. The statistics displayed in these almanacs are defined below:
• N: The number of students to whom the item was administered.
• A, B, C, D and E: Used for multiple-choice items only, these represent the percent of students choosing each one of the response options for the item. Not reached items are included in the denominator for these calculations.
• Scoring Guide Codes (10, 11, 70, 71, etc.): Used for constructed-response items only, these represent the percent of student responses assigned each of the codes in the scoring rubric for the test item. Not reached items are excluded from the denominator for these calculations.
• V1, V2: Used only for the constructed-response items, these indicate the percent of students that scored 1 point or better on the item (V1) and 2 points or better (V2).
• Other Incorrect: Used for multiple-choice items, it indicates the percent of students who omitted or gave an invalid response to the item.
• Diff (Item Difficulty): The percent of students that responded correctly to the item. This was used only for the multiple-choice items.
• Invalid: Used for multiple-choice items only, this indicates the percent of students that gave an invalid response to the item (e.g., multiple selections).
• Not Reached: Indicates the percent of students that did not reach the test item.
• Omit: Indicates the percent of students that omitted the test item.
• Girl (% Right), Boy (% Right): This indicates the percent of girls and boys that obtained the maximum score on the item.

TIMSS 2003 International Database User Guide3-36
3.5 Program Files
These kinds of program files are provided for use in analyses of the TIMSS data files:
• Data Access Control Files
• Jackknife Statistics Program Files
• Scoring Program Files
The Data Access Control files allow a user to convert the ASCII-format raw data files into SAS data sets or SPSS system files. This might prove useful should there be compatibility issues reading the SAS and SPSS data files already provided.
The Jackknife statistics program files are used to compute the statistics as well as the standard errors associated with these statistics, using the jackknife repeated replication method discussed in Chapter 2.
The Scoring Program files allow a user to convert achievement item response codes to the score values used in the computation of international scores. For all program files, two versions are provided: one for SAS programs and one for SPSS programs. The file extension (SAS or SPS) is used to identify the respective SAS and SPSS program files.
Chapters 4 and 5 further describe the SAS and SPSS program files and how they are used, with specific examples from the TIMSS student, teacher, and school data.
3.6 Test-Curriculum Matching Analysis Data Files
TIMSS 2003 developed international tests of mathematics and science that reflect, as far as possible, the various curricula of the participating countries. The subject matter coverage of these tests was reviewed by the TIMSS 2003 Subject Matter Item Replacement Committee, which consisted of mathematics and science educators and practitioners from around the world, and the tests were approved for use by the National Research Coordinators (NRCs) of the participating countries.
Although the tests were developed to represent an agreed-upon framework and were intended to have as much in common across countries as possible, it was inevitable that the match between the TIMSS 2003 test and the science curriculum would not be the same in all countries. To restrict test items to just those topics included in the curricula of all participating countries and covered in the same sequence would severely limit test coverage and restrict the research questions that the study is designed to address. The tests, therefore,
TIMSS 2003 International Database User Guide 3-37
inevitably have some items measuring topics unfamiliar to some students in some countries.
The Test-Curriculum Matching Analysis (TCMA) was conducted to investigate the appropriateness of the TIMSS 2003 science test for the eighth- and fourth-grade students in the participating countries. TCMA also shows how student performance for individual countries varies when based only on the test questions that are judged to be relevant to their own curricula.
To address this issue, TIMSS 2003 asked each country to indicate which items on the tests were included in its curriculum. For each country, TIMSS 2003 computed the average percentage correct on those items only for that country and all other countries. This allowed each country to select only those items on the tests that were included in its curriculum and to compare the performance of their students on those items with that of the students in the other participating countries. However, in addition to comparing the performance of all countries on the set of items chosen by each country, the Test-Curriculum Matching Analysis (TCMA) also shows each country’s performance on the items chosen by each of the other countries. In these analyses, each country was able to see not only the performance of all countries on the items appropriate for its curriculum, but also the performance of its students on items judged appropriate for the curriculum in other countries. The analytical method of the TCMA is described in Beaton and Gonzalez (1997).
The files that contain data indicating the item selection status given by each country, at each grade level are located in the subdirectory called TCMA in the database. The Test Curriculum Matching Analysis files are:
BTCMAMM3.CSV 2003 Mathematics item selection for the eighth grade
BTCMASM3.CSV 2003 Science item selection for the eighth grade
ATCMAMM3.CSV 2003 Mathematics item selection for the fourth grade
ATCMASM3.CSV 2003 Science item selection for the fourth grade
These files are in text format, with their fields separated by commas. The first two records for each file contain the labels for each field in the file. The item variable names are included in the first record. The corresponding item block locations are included in the second record. Each row in the file contains a country’s selection status for all items in the appropriate subject area:
Code 1 Item Included
Code 0 Item Not included

TIMSS 2003 International Database User Guide3-38
3.7 Item Information Files
Item Information files are provided to enable users of the database to readily produce summaries of item characteristics and cross-reference the different item identification numbers (e.g., mathematics and science achievement item block location, original item variable name (1995 or 1999), and new item variable name (2003 permanent ID). The Item Information files include the following information:
• Permanent ID number for the item
• Item Name and Block Location in the corresponding year
• Subject (Mathematics or Science)
• Item Type (Multiple choice or Constructed Response)
• Response Key (correct response option for multiple-choice items only)
• Maximum Points (maximum score points possible on the item)
• Whether the item was used for scaling or not
• Release status for the year
• Number of options
• Content Domain
• Item Label
• Cognitive Domain
There are two Item Information files containing this information for the test items. These files are located in the subdirectory called ITEMS for the corresponding population. The two Item Information files are:
BITINFM3 Item Information for the 2003 Eighth-grade Assessment
AITINFM3 Item Information for the 2003 Fourth-grade Assessment.
These files are in Excel spreadsheet format, with one record for each achievement item part.
TIMSS 2003 International Database User Guide 4-1
4 Performing Analyses with the TIMSS Data Using SPSS
4.1 Overview
This chapter presents some basic examples of analyses that can be performed with the TIMSS 2003 International Database using the sampling weights and achievement scores discussed in previous chapters. It also describes the SPSS programs used to conduct such analyses, and their results. The analyses presented here are simple in nature, and are designed primarily to familiarize you with the different files and their structure, as well as the relevant variables that need to be included in most analyses. The programs compute the percent of students in specified subgroups, the mean mathematics or science achievement in those groups, and the proper standard errors for the percent and mean statistics. Additionally, some examples of linear regression analyses are presented. All of these analyses, based on student, teacher and school data, replicate analyses that are included in the TIMSS 2003 Science International Report. You are invited to compare the results from these analyses to the Exhibits in the reports, and are encouraged to practice analyzing the TIMSS data by trying to replicate the Exhibits that are presented in the international reports.1
In our examples, we use macros written for SPSS that can be used to perform any of the analyses that are described below. These are general procedures that can be used for many purposes, provided you have some basic knowledge of the SPSS macro language. If you have some programming experience in this statistical package, then you will be able to make the necessary modifications to the macros to obtain the desired results.
4.2 Contents of the TIMSS 2003 Database DVD
The DVD that accompanies this User Guide contains the TIMSS 2003 data. It has the following internal file structure:
• A main directory identifying the study (TIMSS2003).
• Within the main directory, there are eight sub-directories.
1 See Mullis, Martin, Gonzalez, and Chrostowski (2004) for results in mathematics and Martin, Mullis, Gonzalez, and Chrostowski (2004) for results in science.

TIMSS 2003 International Database User Guide4-2
DATA: Contains data files in SPSS, SAS and ASCII formats
PROGRAMS: Contains SPSS and SAS programs
CODEBOOKS: Contains codebook files
ALMANACS: Contains data almanacs
TCMA: Contains Test–Curriculum Matching Analysis Data
ITEMS: Contains the Item Information files
CURRICULUM: Contains the Curriculum Questionnaire data
REPORTS : Contains all international reports, this User Guide and its supplements.
The directory names on the DVD and the file names generally follow the DOS naming convention: file names with up to eight characters, followed by a three-character extension (as in FILENAME.EXT). Files with the same names are complementary to each other, and the extension identifies their function or type. The extensions used in the files contained on the DVD are the following.
.SAS SAS Control file or program
.SPS SPSS Control file or program
.RAW ASCII Data file
.SAV SPSS System file
.EXP SAS Export file
.LST Almanac in ASCII format
.DOC Almanac in MS Word format
.PDF Almanac in PDF format
.CDT Codebook in Printout format
.SDB Codebook in Dbase format
.CSV Test Curriculum Matching Analysis file
.XLS Curriculum Questionnaire data and Item Information files in Excel format.
The DATA sub-directory contains the TIMSS data files in ASCII, SAS and SPSS formats. The data files that are in this directory are described in Chapter 3 of this guide. Each file type has two corresponding control files in the PROGRAMS sub-directory. One of these reads the ASCII data file and creates a SAS data set, the other reads the ASCII data file and creates an SPSS system file. This chapter will focus on the files that can be used with SPSS.

TIMSS 2003 International Database User Guide 4-3
The following programs can also be found in the PROGRAMS sub-directory:
ASASCRM3.SPS and BSASCRM3.SPS
These files contain SPSS programs that can be used to convert the response codes to the cognitive items to their corresponding correctness score levels. The use of these programs is described in this chapter.
JOIN.SPS
This SPSS program combines files of the same type from more than one country. The use of this program is described in this chapter.
JACKGEN.SPS
This macro program in SPSS can be used to compute weighted percentages of students within defined groups, and their means on a specified continuous variable. This macro also generates replicate weights and computes jackknife repeated replication (JRR) standard errors for the percentages and mean estimates. The analysis variable can be any continuous variable. The use of this macro programs is described later in this chapter. When computing mean achievement scores based on plausible values, you will need to use the macro JACKPV.SPS.
JACKPV.SPS
This macro program in SPSS can be used to compute weighted percentages of students within defined groups, and their mean achievement scores using the available plausible values. This macro also generates replicate weights and computes the JRR standard errors for the percentages and mean achievement scores. This macro should be used when multiple plausible values are used in the analysis.
JACKREG.SPS
This macro program in SPSS can be used to compute weighted regression coefficients and their standard errors within defined groups. It also computes descriptive statistics on the variables. This macro can be used with any analysis variable, but it does not make use of the five plausible values.

TIMSS 2003 International Database User Guide4-4
JACKREGP.SPS
This macro program in SPSS can be used to compute weighted regression coefficients and their standard errors within defined groups when using plausible values as the achievement scores. It also computes descriptive statistics on the variables.
Each of the four macros above has a corresponding sample program that calls the respective macros and prints out the results. They are discussed later in this chapter.
EXAMPLE1.SPS, EXAMPLE2.SPS, EXAMPLE3.SPS, EXAMPLE4.SPS
These are the programs used in the examples presented later in this chapter.
4.3 Creating SPSS System Files
The DVD contains SPSS control code to read each one of the ASCII data files and create SPSS system files. Each of these control files contains information on the location of each variable in the file, its format, a descriptive label for each variable and its categories (in the case of categorical variables), and code for handling missing data. The control files have been created to facilitate access to the data on a country by country basis. They should be used to create SPSS system files if the SPSS system files provided on the DVD are not compatible for a specific computer platform or configuration.
The command lines in the control files should be edited to produce programs that will create SPSS system files for any specified countries. While most of the program code is functional as provided, you will need to edit input and output directories and the list of desired countries. Performing analyses that require data from more than one country will necessitate adding or appending the respective data files into a larger one. These control files will create separate files for each desired country. These individual country files can then be joined into a single data set using the JOIN program described later in this chapter.
Alternatively, you can access the data and compute the necessary statistics on a country by country basis, reading one file at a time and moving on to the next country’s data. The method you choose will depend greatly on the storage and processing capacity of the computer system you use. For the examples presented in this User Guide, we have combined the data files of individual countries into one large data file that contains all the data for all participating countries. The three-character country identifier for this file is “ALL”.

TIMSS 2003 International Database User Guide 4-5
When creating an SPSS system file of a specific type, you should do the following:
1. Open the SPSS control file for the appropriate file type, for example BSGTMSM3.SPS.
2. In the line that reads “!let !datpath = !unquote("<path>")”, you should enter the path where the raw data are located.
3. In the line that reads “!let !savpath = !unquote("<path>")”, you should enter the path where you want to store the SPSS system file that you will be creating.
4. In the line that reads “create country =” at the end of the file, you should enter the three-character identification code for each country whose data you want to create. If you leave this line unedited, the data for all countries listed will be created.
5. Submit the code for processing. After processing is complete, you will find the SPSS system file(s) in the location you specified in step 3.
In the extract presented in Exhibit 4.1, the Student Background data for Australia, Belgium (Flemish), Bulgaria, England and the United States will be read from the directory “D:\TIMSS2003\Data\Raw_Data\”. Separate SPSS system files for each country will be stored in the directory “D:\TIMSS2003\Data\SPSS_Data\” under the name BSG<country>M3. Only the sections that need to be modified are presented in this exhibit.

TIMSS 2003 International Database User Guide4-6
Exhibit 4.1 Extract from SPSS Control Code for Creating Student Background SPSS System Files
SET DECIMAL = DOT.
define create (country=!charend('/')).
!let !datpath = !unquote("D:\TIMSS2003\Data\Raw_Data\").!let !savpath = !unquote("D:\TIMSS2003\Data\SPSS_Data\").
!do !cty !in(!country).
!let !indata = !concat('"',!datpath,bsg,!cty,'m3.dat"').!let !savdata = !concat('"',!savpath,bsg,!cty,'m3.sav"').
*NOTE: Assignment of variable names.
data list file = !indata
.
.
.
save outfile = !savdata.
!doend!enddefine
create country = AUS BFL BGR ENG USA.
4.4 Scoring the Items
There were several types of items administered as part of the TIMSS tests. There were multiple-choice items, in which the students were asked to select one of four or five options as the correct response. The responses to these items are coded with one digit. The codes used to represent the responses to these items are as follows:
Code 1 Option A
Code 2 Option B
Code 3 Option C
Code 4 Option D
Code 5 Option E
Code 6 Not reached
Code 7 Invalid response (chose more than one of the options available)
Code 8 Not administered
Code 9 No response although the item was administered and was reached (i.e., item was omitted)

TIMSS 2003 International Database User Guide 4-7
There were also constructed-response items where the students were asked to construct a response to a question, rather than choosing an answer from a list of options. The answers to these questions were scored by scorers trained to use the two-digit scoring rubrics described in Chapter 2 of this guide. The first digit of the two-digit code indicates the score given to the question, and the second digit in conjunction with the first provides diagnostic information on the specific answer given by the student. The codes used to represent the responses to these items are the following:
Codes 30 to 39 Three-point answer. Second digit provides diagnostic information.
Codes 20 to 29 Two-point answer. Second digit provides diagnostic information.
Codes 10 to 19 One-point answer. Second digit provides diagnostic information.
Codes 70 to 79 Zero-point answer. Second digit provides diagnostic information.
Code 96 Not reached.
Code 98 Not administered.
The achievement data files contained on the DVD include information on the answers given to each item administered to a student. You might want to work with these item data after they are recoded to the right-wrong format, in the case of multiple-choice items, or to the level of correctness in the case of the constructed-response items. For this purpose, we have included on the DVD two SPSS programs, one for each population, which will allow you to recode the items from the achievement test to their right-wrong or correctness-level format. These programs contain a macro called SCOREIT and the necessary call to this macro so that all the items in the specified file are scored. This program will convert the response option codes for multiple-choice items to dichotomous score levels (0 or 1) based on scoring keys. For the constructed-response items, the two-digit codes will be converted to the corresponding correctness score level (3, 2, 1, 0) based on the value of the first digit, as described in Chapter 2.
Two files are included to provide control code to perform the recodes of the test items in the achievement test file:
ASASCRM3 TIMSS 2003 Fourth Grade Achievement files
BSASCRM3 TIMSS 2003 Eighth Grade Achievement files
When using these programs, you must first consider the recoding scheme that is desired. For example, under certain circumstances you might want to recode the not reached responses as incorrect (codes 6 and 96), whereas under other circumstances you might want to recode these responses as not administered

TIMSS 2003 International Database User Guide4-8
or invalid. In the case of TIMSS, not reached responses were recoded as not administered (and effectively as missing responses) for the purpose of calibrating the items. But the not reached responses were then recoded as incorrect when scoring the item for the individual countries, and for the purpose of calculating the scale scores for the individuals. By default, the scoring program provided with the database recodes the items coded as not reached and those left blank as incorrect responses.
To use the SCOREIT macro, you should adapt the program code in either of the programs ASASCRM3 (fourth grade) or BSASCRM3 (eighth grade). You should do the following:
1. Open the appropriate control file, for example BSASCRM3.SPS.
2. In the line that reads “file = "<path>\BSA<country>M3.sav"”, you should enter the path where the SPSS system file you want to recode is located and the three-character code for the country of interest.
3. In the “save outfile” line at the very end of the program, you should enter the path where you want to store the scored SPSS system file that you will be creating and the three-character code for the country of interest.
4. Submit the code for processing.
Both of these programs recode the items onto themselves, so if you want to preserve the original answers and codes assigned to the questions, then the file with the recoded item variables should be saved under a different file name, or in a different directory. A copy of the program that scores the items in SPSS is presented in Exhibit 4.2.

TIMSS 2003 International Database User Guide 4-9
Exhibit 4.2 Extracted Sections of SPSS Program SCOREIT Used to Convert Cognitive Item Response Codes to Correctness-Score Levels
SET MPRINT=ON.define SCOREIT (Type = !charend(ʻ/ʼ) / Item = !charend(ʻ/ʼ) / RIGHT = !charend(ʻ/ʼ) / nr = !charend(ʻ/ʼ) / na = !charend(ʻ/ʼ) / om = !charend(ʻ/ʼ) / other = !charend(ʻ/ʼ) ).
.
.
.
!enddefine.
* Get the student achievement data .add files /file = “<path>\BSA<country>M3.sav” . SCOREIT Type = MC / Item = <list items where option A is the correct one> / RIGHT = 1 / nr = 6 / na = sysmis / om = 9 / other = 7.
SCOREIT Type = MC / Item = <list items where option B is the correct one> / RIGHT = 2 / nr = 6 / na = sysmis / om = 9 / other = 7.
SCOREIT Type = MC / Item = <list items where option C is the correct one> / RIGHT = 3 / nr = 6 / na = sysmis / om = 9 / other = 7.
SCOREIT Type = MC / Item = <list items where option D is the correct one> / RIGHT = 4 / nr = 6 / na = sysmis / om = 9 / other = 7.
SCOREIT Type = MC / Item = <list items where option E is the correct one> / RIGHT = 5 / nr = 6 / na = sysmis / om = 9 / other = 7. SCOREIT Type = OE / Item = <list open-ended items> / RIGHT = 0 / nr = 96 / na = sysmis / om = 99 / other = 90 .
execute.
* Save the student data .save outfile = “<path>\BSA<country>M3.sav” .

TIMSS 2003 International Database User Guide4-10
4.5 Joining Files
The programs presented until now produce a single SPSS system file per country. The DVD provides a special program called JOIN.SPS that joins individual country files into a single aggregated file. This program facilitates joint analyses for more than one country. This program can only join SPSS system files of the same type, for example BSG files.
To create an SPSS system file with more than one country’s data, you should do the following:
1. Open the control file JOIN.SPS.
2. At the end of the program, you should list all the countries of interest in the parameter “country”.
3. You should specify the file type in the parameter “type”.
4. You should specify the sorting variables in the parameter “sortvar”.
5. You should specify the path where all files are located in the parameter “path”.
6. Submit the code for processing.
An example of the JOIN program is presented in Exhibit 4.3. This example joins all the BSG files for all countries. All individual country files are located in the directory “D:\TIMSS2003\Data\SPSS_Data”. The resulting file will also be located in this directory and will be called BSGALLM3. The resulting file will be sorted by IDCNTRY and IDSTUD.
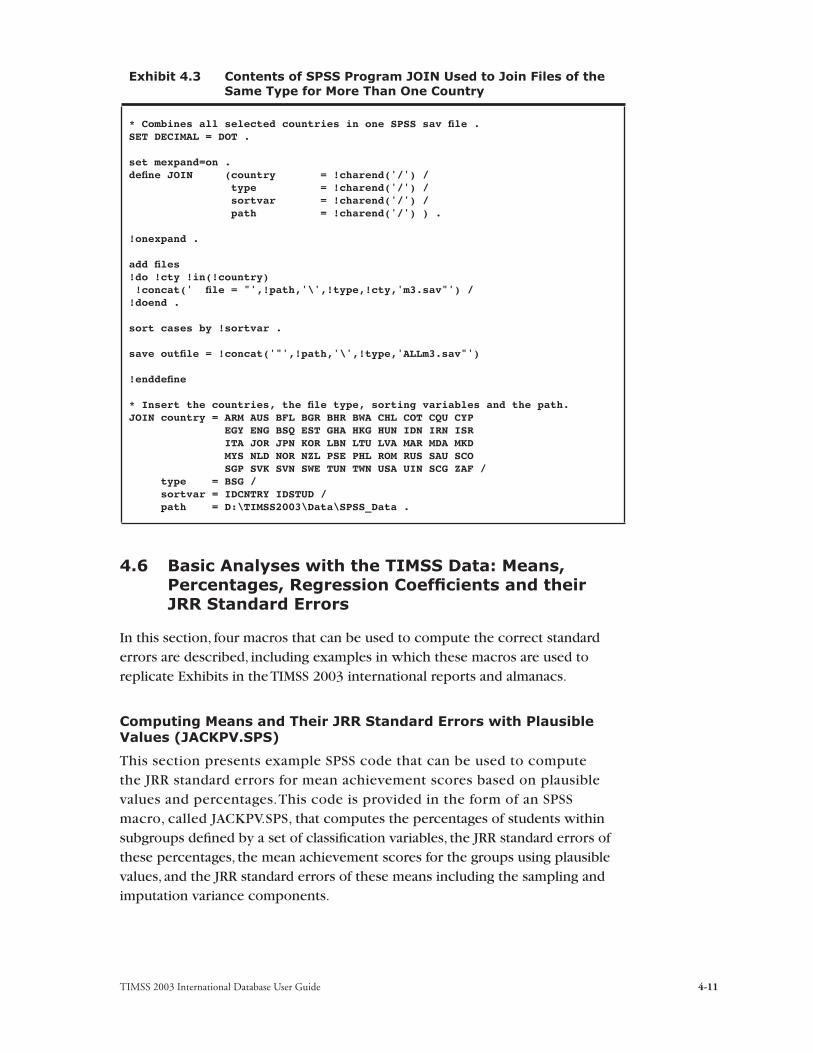
TIMSS 2003 International Database User Guide 4-11
Exhibit 4.3 Contents of SPSS Program JOIN Used to Join Files of the Same Type for More Than One Country
* Combines all selected countries in one SPSS sav file .SET DECIMAL = DOT .
set mexpand=on .define JOIN (country = !charend('/') / type = !charend('/') / sortvar = !charend('/') / path = !charend('/') ) .
!onexpand .
add files !do !cty !in(!country) !concat(' file = "',!path,'\',!type,!cty,'m3.sav"') /!doend .
sort cases by !sortvar .
save outfile = !concat('"',!path,'\',!type,'ALLm3.sav"')
!enddefine
* Insert the countries, the file type, sorting variables and the path.JOIN country = ARM AUS BFL BGR BHR BWA CHL COT CQU CYP EGY ENG BSQ EST GHA HKG HUN IDN IRN ISR ITA JOR JPN KOR LBN LTU LVA MAR MDA MKD MYS NLD NOR NZL PSE PHL ROM RUS SAU SCO SGP SVK SVN SWE TUN TWN USA UIN SCG ZAF / type = BSG / sortvar = IDCNTRY IDSTUD / path = D:\TIMSS2003\Data\SPSS_Data .
4.6 Basic Analyses with the TIMSS Data: Means, Percentages, Regression Coefficients and their JRR Standard Errors
In this section, four macros that can be used to compute the correct standard errors are described, including examples in which these macros are used to replicate Exhibits in the TIMSS 2003 international reports and almanacs.
Computing Means and Their JRR Standard Errors with Plausible Values (JACKPV.SPS)
This section presents example SPSS code that can be used to compute the JRR standard errors for mean achievement scores based on plausible values and percentages. This code is provided in the form of an SPSS macro, called JACKPV.SPS, that computes the percentages of students within subgroups defined by a set of classification variables, the JRR standard errors of these percentages, the mean achievement scores for the groups using plausible values, and the JRR standard errors of these means including the sampling and imputation variance components.
TIMSS 2003 International Database User Guide4-12
The JACKPV.SPS macro operates as follows:
1. Computes a set of replicate weights specified using the parameters NJKZ, JKZ, and JKR.
2. Aggregates or summarizes the data by computing the sum of the weights for each subgroup, the sum of the weights overall, and the weighted sum of a set of plausible values.
3. Computes the percentages of students within each group, their mean achievement scores based on the plausible values, and their respective standard errors. The resulting working file FINAL contains all the computed statistics.
When using this macro, you need to specify a set of classification variables, the name of the plausible values and how many there are, the number of replicate weights to be generated, the variables that contain the jackknife replication information (JKZONE and JKREP), and the sampling weight that is to be used for the analysis. You also need to specify the data file that contains the data to be processed.
You need to know some basic SPSS macro language in order to use JACKPV.SPS. The macro should be included in the program file where it is going to be used. If you are operating in batch mode, then the macro should be included in every batch. If you are using SPSS interactively then the macro should be included once at the beginning of the session and it will remain active throughout the session. If the session is terminated and restarted at a later time the macro should be included once again. Once the macro is included in a specific session, the word “JACKPV” should not be used within that session because doing so will invoke the macro.
The macro is included in the program file by issuing the following command in SPSS:
include "<path>jackpv.sps".
where <path> points to the specific drive and directory where the macro JACKPV.SPS can be found. The macro requires that several parameters be specified when it is invoked. These parameters are:
INFILE The name of the data file that contains the variables necessary for the analysis. If the path location is included as part of the file name, the name of the file has to be enclosed in quotes. It
TIMSS 2003 International Database User Guide 4-13
is important to emphasize that this system file must include only those cases that are of interest in the analysis. If you want to have specific cases excluded from the analysis, for example students with missing data, this should be done prior to invoking the macro.
CVAR This lists the variables that are to be used to classify the students in the data file. This can be a single variable, or a list of variables. The maximum number of variables will depend mostly on the computer resources available to you at the time. It is recommended to always include the variable that identifies the country. At least one variable has to be specified, usually IDCNTRY.
ROOTPV This is the prefix used to identify the set of plausible values for the achievement scale of interest. This corresponds to the first 7 characters of the plausible values variable name. For example, the root of the overall science plausible values is “BSSSCI0,” the root of the geometry plausible values is “BSMGEO0.”
NPV This is the number of plausible values that will be used for the analysis. Generally you will want to use all five plausible values for the analysis, although in some circumstances fewer can be used. You should always use at least two plausible values for any analysis.
JKZ The variable that captures the assignment of cases to sampling zones. The name of this variable in all TIMSS files is JKZONE.
JKR The variable that captures whether the case is to be dropped or have its weight doubled for each set of replicate weights. The name of this variable in all TIMSS files is JKREP.
NJKZ This indicates the number of replicate weights to be generated when computing the JRR standard errors. When conducting analyses using the data from all countries, the value of NJKZ should be set to 75, the maximum possible value. When you are working with the data for only one country, you should set the NJKZ argument to as many replicates as are needed for the country. If

TIMSS 2003 International Database User Guide4-14
the data from two or more countries are being used for an analysis, then the largest number of jackknife zones should be used. When in doubt, NJKZ should be set to 75. The standard errors will always be estimated correctly if more replicate weights than necessary are computed, but will be underestimated if you specify fewer replicate weights than necessary.
WGT The sampling weight to be used, generally TOTWGT when using the student files, or MATWGT, SCIWGT, or TCHWGT when using the teacher files.
The simplest and most straightforward way to invoke the macro is by using the conventional SPSS notation for invoking macros. This involves listing the macro name followed by the list of arguments for the analysis, each separated by a slash. For example, if the macro is invoked using
include "D:\TIMSS2003\Programs\SPSS_Programs\jackpv.sps" .
jackpv infile = BSGALLM3 / cvar = IDCNTRY ITSEX / rootpv = BSMMAT0 / npv = 5 / jkz = JKZONE / jkr = JKREP / njkz = 75 / wgt = TOTWGT .
it will compute the eighth grade mean mathematics achievement scores using five plausible values and their respective standard errors for boys and girls within each country, using the variable TOTWGT as the sampling weight. It will also compute the percentages of boys and girls within each country, and their respective standard errors. The data will be read from the data set BSGALLM3, and the standard errors will be computed based on 75 replicate weights.
The file that contains the results is called FINAL and is saved to the default directory being used by SPSS. The variables that are contained in this results file are:
Classification Variables
All classification variables are kept in the results file. In the example there are two classification variables: IDCNTRY and ITSEX. There is one record for each combination of the categories for these variables.

TIMSS 2003 International Database User Guide 4-15
Weight Variable
Contains the sum of weights within each group defined by the classification variables. In the example this variable is called TOTWGT.
N
Contains the number of valid cases within each group defined by the classification variables. In the example this is the number of boys and girls in each country’s sample.
MNX
Contains the weighted mean achievement scores, based only on the first plausible value, for each group defined by the classification variables.
MNX_SE
Contains the JRR standard errors of the weighted mean achievement scores, based only on the first plausible value. This does not include the imputation error that should be computed when using plausible values.
MNPV
Contains the weighted mean achievement scores, based on all plausible values.
MNPV_SE
Contains the JRR standard errors of the weighted mean achievement scores, based on all plausible values. These standard errors contain both the sampling and the imputation variance components.
PCT
Contains the weighted percentages of students in the groups for the last classification variable listed, within the specific combination of the categories defined by the remaining classification variables. In the example it is the percentage of boys and girls within each country.
PCT_SE
Contains the JRR standard errors of PCT values.

TIMSS 2003 International Database User Guide4-16
The content of the FINAL file can be printed using an SPSS procedure of choice. An example call to this macro, and a printout of the results file, is presented in Exhibit 4.4. The code is included in the file called SampleJackPV.SPS.
Exhibit 4.4 Extract of SPSS Control Code and Output File for Using the Macro JACKPV.SPS
add files / file = "D:\TIMSS2003\Data\SPSS_Data\BSGARMM3.SAV" / file = "D:\TIMSS2003\Data\SPSS_Data\BSGAUSM3.SAV" / file = "D:\TIMSS2003\Data\SPSS_Data\BSGBFLM3.SAV" / file = "D:\TIMSS2003\Data\SPSS_Data\BSGBGRM3.SAV" / file = "D:\TIMSS2003\Data\SPSS_Data\BSGBHRM3.SAV" .
select if not(missing(ITSEX)) .
value labels IDCNTRY <list all country codes and country names>
save outfile = BSGALLM3 .
include "D:\TIMSS2003\Programs\SPSS_Programs\jackpv.sps" .
jackpv infile = BSGALLM3 / cvar = IDCNTRY ITSEX / rootpv = BSMMAT0 / npv = 5 / jkz = JKZONE / jkr = JKREP / njkz = 75 / wgt = TOTWGT .
* Print the results .print formats IDCNTRY ITSEX n (F6.0) TOTWGT (f10.0) mnpv mnpv_se pct pct_se (f6.2) .
report format = list automatic / var = IDCNTRY (label) ITSEX (label) n TOTWGT mnpv mnpv_se pct pct_se .
*SEX OF*COUNTRY ID* STUDENTS* N TOTWGT MNPV MNPV_SE PCT PCT_SE_____________________ _________ ______ __________ ______ _______ ______ ______
AUSTRALIA GIRL 2443 131600 498.59 5.79 51.13 2.25AUSTRALIA BOY 2348 125807 511.10 5.79 48.87 2.25BAHRAIN GIRL 2025 5317 417.32 2.37 50.43 .44BAHRAIN BOY 2174 5226 384.79 2.42 49.57 .44ARMENIA GIRL 3003 28625 482.86 3.29 52.76 .66ARMENIA BOY 2696 25630 472.78 3.42 47.24 .66BULGARIA GIRL 2015 42247 475.65 5.48 48.23 1.33BULGARIA BOY 2102 45356 476.66 4.33 51.77 1.33BELGIUM FLEMISH GIRL 2620 37887 531.72 3.53 53.64 2.09BELGIUM FLEMISH BOY 2350 32751 542.49 3.75 46.36 2.09

TIMSS 2003 International Database User Guide 4-17
In this example, the mean eighth grade mathematics achievement scores, based on all five plausible values, and their respective standard errors are calculated separately for boys and girls by country. In the results listing, we can see that there are entries for each country and gender combination. The first column has the country name and the second column indicates the gender of the students. The third column has the number of valid cases by country and gender and the fourth column has the total sum of weights by country and gender. The fifth and sixth columns report the mean eighth grade mathematics achievement score, based on all five plausible values, by country and gender and its standard error. The last two columns report the weighted percentage of girls and boys in each country and their respective standard errors.
From the first few lines of the results in Exhibit 4.4, we can say that in Australia there are 2,443 girls in the sample representing 131,600 students in the whole population. The mean mathematics score for the girls, based on the five plausible values, is 498.59 with a standard error of 5.79. Girls made up 51.13% of Australia’s student population. Additionally, Australia sampled 2,348 boys representing 125,807 students in the whole population. The mean mathematics score for the boys, based on the five plausible values, is 511.10 with a standard error of 5.79. Boys made up 48.87% of Australia’s student population.
Computing Means and Their JRR Standard Errors without Plausible Values (JACKGEN.SPS)
This section presents example SPSS code that can be used to compute the JRR standard errors for means of variables other than plausible values and percentages. This code is provided in the form of an SPSS macro, called JACKGEN.SPS, that computes the percentages of students within subgroups defined by a set of classification variables, the JRR standard errors of these percentages, the means on a variable of choice for the groups, and the JRR standard errors of these means. Although you can compute weighted percentages and means using other basic SPSS commands, the macro JACKGEN.SPS computes the proper JRR standard errors for these means and percentages.
This macro operates as follows:
1. Computes a set of replicate weights specified using the parameters NJKZ, JKZ, and JKR.
2. Aggregates or summarizes the data by computing the sum of the weights for each subgroup, the sum of the weights overall, and the weighted sum of a specified analysis variable.
3. Computes the percentages of students within each group, their mean on the analysis variable, and their respective standard errors. The resulting working file FINAL contains all the computed statistics.
TIMSS 2003 International Database User Guide4-18
When using this macro, you need to specify a set of classification variables, one analysis variable, the number of replicate weights to be generated, the variables that contain the jackknife replication information (JKZONE and JKREP), and the sampling weight that is to be used for the analysis. You will also need to specify the data file that contains the data that is to be processed.
You need to know some basic SPSS macro language in order to use JACKGEN.SPS. The macro should be included in the program file where it is going to be used. If you are operating in batch mode, then the macro needs to be included in every batch. If you are using SPSS interactively then the macro needs to be included once at the beginning of the session and it will remain active throughout the session. If the session is terminated and restarted at a later time the macro needs to be included once again. Once the macro is included in a specific session, the word “JACKGEN” should not be used within that program because doing so will invoke the macro.
The macro is included in the program file by issuing the following command in SPSS:
include "<path>jackgen.sps".
where <path> points to the specific drive and directory where the macro JACKGEN.SPS can be found. The macro requires that several parameters be specified when it is invoked. These parameters are:
INFILE The name of the data file that contains the variables necessary for the analysis. If the path location is included as part of the file name, the name of the file has to be enclosed in quotes. It is important to emphasize that this system file must include only those cases that are of interest in the analysis. If you want to have specific cases excluded from the analysis, for example students with missing data, this should be done prior to invoking the macro.
CVAR This lists the variables that are to be used to classify the students in the data file. This can be a single variable, or a list of variables. The maximum number of variables will depend mostly on the computer resources available to you at the time. It is recommended to always include the variable that identifies the country. At least one variable has to be specified, usually IDCNTRY.

TIMSS 2003 International Database User Guide 4-19
DVAR This is the variable for which means are to be computed. Only one variable can be listed here. If you want to examine results for two different variables, then the macro needs to be invoked separately to generate each table.
JKZ The variable that captures the assignment of cases to sampling zones. The name of this variable in all TIMSS files is JKZONE.
JKR The variable that captures whether the case is to be dropped or have its weight doubled for each set of replicate weights. The name of this variable in all TIMSS files is JKREP.
NJKZ This indicates the number of replicate weights to be generated when computing the JRR standard errors. When conducting analyses using the data from all countries, the value of NJKZ should be set to 75. When you are working with the data for only one country, you should set the NJKZ argument to as many replicates as are needed for the country. If the data from two or more countries are being used for an analysis, then the larger number of jackknife zones should be used. When in doubt, NJKZ should be set to 75. The standard errors will always be estimated correctly if more replicate weights than necessary are computed, but will be underestimated if you specify fewer replicate weights than necessary.
WGT The sampling weight to be used, generally TOTWGT when using the student files, or MATWGT, SCIWGT, or TCHWGT when using the teacher files.
The simplest and most straightforward way to invoke the macro is by using the conventional SPSS notation for invoking macros. This involves listing the macro name followed by the list of arguments for the analysis, each separated by a slash. For example, if the macro is invoked using

TIMSS 2003 International Database User Guide4-20
include "D:\TIMSS2003\Programs\SPSS_Programs\jackgen.sps" .
jackgen infile = BSGALLM3 / cvar = IDCNTRY / dvar = BSDAGE / njkz = 75 / jkz = JKZONE / jkr = JKREP / wgt = TOTWGT .
it will compute the eighth grade mean ages and their respective standard errors within each country, using the variable TOTWGT as the sampling weight. The data will be read from the SPSS system file BSGALLM3 and the standard errors will be computed based on 75 replicate weights.
The file that contains the results is called FINAL and is saved to the default directory being used by SPSS. The variables that are contained in this results file are:
Classification Variables
All classification variables are kept in the results file. In the example there is only one variable: IDCNTRY. There is one record for each category of this variable.
Weight Variable
Contains the sum of weights within each group defined by the classification variables.
N
Contains the number of valid cases within each group defined by the classification variables.
MNX
Contains the weighted means of the variable DVAR for each group defined by the classification variables.
MNX_SE
Contains the JRR standard errors of the MNX values.

TIMSS 2003 International Database User Guide 4-21
PCT
Contains the weighted percentages of students in the groups for the classification variable listed last, within the specific combination of the categories defined by the groups initially. In the example it is the weighted percentage of students by country.
PCT_SE
Contains the JRR standard errors of PCT values.
The contents of the FINAL file can be printed using an SPSS procedure of choice. An example call to this macro, and an extract of the results file, is presented in Exhibit 4.5. The code is included in the file called SampleJackGen.SPS.
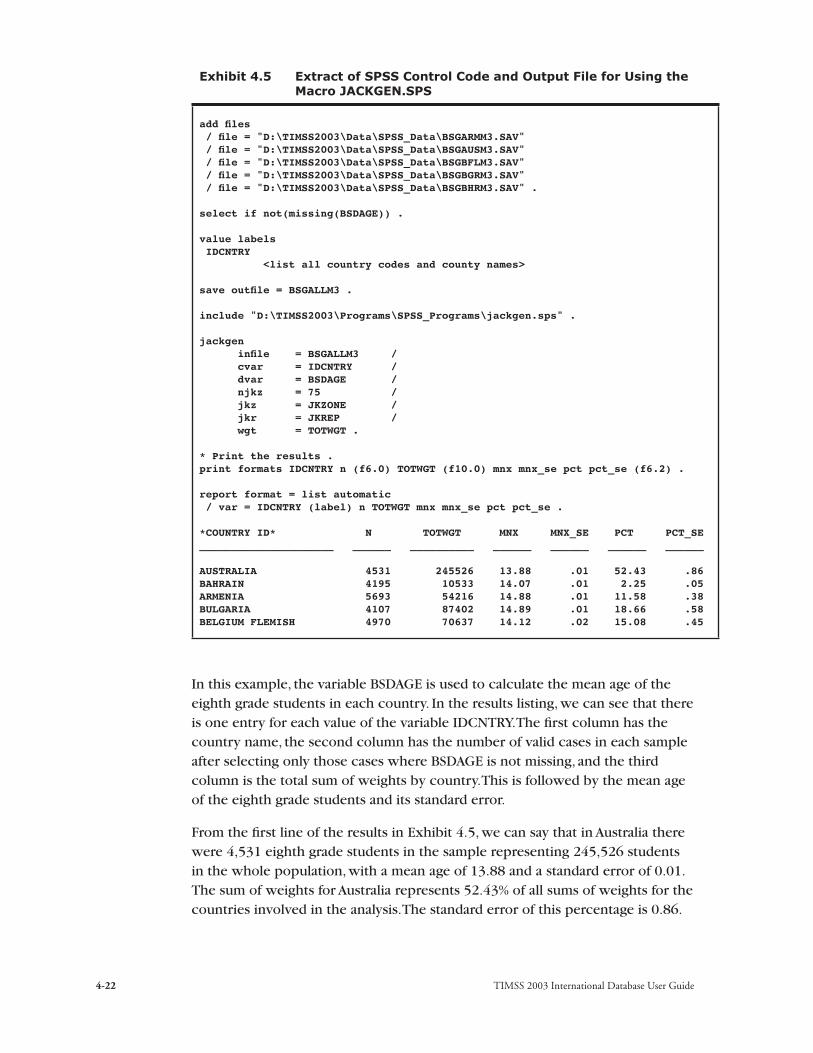
TIMSS 2003 International Database User Guide4-22
Exhibit 4.5 Extract of SPSS Control Code and Output File for Using the Macro JACKGEN.SPS
add files / file = "D:\TIMSS2003\Data\SPSS_Data\BSGARMM3.SAV" / file = "D:\TIMSS2003\Data\SPSS_Data\BSGAUSM3.SAV" / file = "D:\TIMSS2003\Data\SPSS_Data\BSGBFLM3.SAV" / file = "D:\TIMSS2003\Data\SPSS_Data\BSGBGRM3.SAV" / file = "D:\TIMSS2003\Data\SPSS_Data\BSGBHRM3.SAV" .
select if not(missing(BSDAGE)) .
value labels IDCNTRY <list all country codes and county names>
save outfile = BSGALLM3 .
include "D:\TIMSS2003\Programs\SPSS_Programs\jackgen.sps" .
jackgen infile = BSGALLM3 / cvar = IDCNTRY / dvar = BSDAGE / njkz = 75 / jkz = JKZONE / jkr = JKREP / wgt = TOTWGT .
* Print the results .print formats IDCNTRY n (f6.0) TOTWGT (f10.0) mnx mnx_se pct pct_se (f6.2) .
report format = list automatic / var = IDCNTRY (label) n TOTWGT mnx mnx_se pct pct_se . *COUNTRY ID* N TOTWGT MNX MNX_SE PCT PCT_SE_____________________ ______ __________ ______ ______ ______ ______
AUSTRALIA 4531 245526 13.88 .01 52.43 .86BAHRAIN 4195 10533 14.07 .01 2.25 .05ARMENIA 5693 54216 14.88 .01 11.58 .38BULGARIA 4107 87402 14.89 .01 18.66 .58BELGIUM FLEMISH 4970 70637 14.12 .02 15.08 .45
In this example, the variable BSDAGE is used to calculate the mean age of the eighth grade students in each country. In the results listing, we can see that there is one entry for each value of the variable IDCNTRY. The first column has the country name, the second column has the number of valid cases in each sample after selecting only those cases where BSDAGE is not missing, and the third column is the total sum of weights by country. This is followed by the mean age of the eighth grade students and its standard error.
From the first line of the results in Exhibit 4.5, we can say that in Australia there were 4,531 eighth grade students in the sample representing 245,526 students in the whole population, with a mean age of 13.88 and a standard error of 0.01. The sum of weights for Australia represents 52.43% of all sums of weights for the countries involved in the analysis. The standard error of this percentage is 0.86.

TIMSS 2003 International Database User Guide 4-23
Computing Regression Coefficients and Their JRR Standard Errors without Plausible Values (JACKREG.SPS)
This section presents example SPSS code that can be used to compute regression coefficients and their JRR standard errors. This code is provided in the form of an SPSS macro, called JACKREG.SPS, which performs a multiple linear regression between the specified dependent and independent variables within subgroups defined by a set of classification variables, as well as the regression coefficients and their JRR standard errors.
If you wish to conduct regression analyses using plausible values as the dependent variable, refer to JACKREGP.SPS described in the next section.
The JACKREG.SPS macro operates as follows:
1. Computes a set of replicate weights specified using the parameters NJKZ, JKZ, and JKR.
2. Aggregates or summarizes the data by computing the sum of the weights for each subgroup, the sum of the weights overall, and the weighted sum of all specified analysis variables.
3. Performs a multiple linear regression within each group, and computes the regression coefficients and their respective standard errors. The resulting working file REG contains all the computed statistics.
When using this macro, you need to specify a set of classification variables, the analysis variables, the number of replicate weights to be generated, the variables that contain the jackknife replication information (JKZONE and JKREP), and the sampling weight that is to be used for the analysis. You will also need to specify the data file that contains the data that is to be processed.
You need to know some basic SPSS macro language in order to use the macro. The macro should be included in the program file where it is going to be used. If you are operating in batch mode, then the macro needs to be included in every batch. If you are using SPSS interactively then the macro needs to be included once at the beginning of the session and it will remain active throughout the session. If the session is terminated and restarted at a later time the macro needs to be included once again. Once the macro is included in a specific session, the word “JACKREG” should not be used within that program because doing so will invoke the macro.

TIMSS 2003 International Database User Guide4-24
The macro is included in the program file by issuing the following command in SPSS:
include "<path>jackreg.sps".
where <path> points to the specific drive and directory where the macro JACKREG.SPS can be found. The macro requires that several parameters be specified when it is invoked. These parameters are:
INFILE The name of the data file that contains the variables necessary for the analysis. If the path location is included as part of the file name, the name of the file has to be enclosed in quotes. It is important to emphasize that this system file must include only those cases that are of interest in the analysis. If you want to have specific cases excluded from the analysis, for example students with missing data, this should be done prior to invoking the macro.
CVAR This lists the variables that are to be used to classify the students in the data file. This can be a single variable, or a list of variables. The maximum number of variables will depend mostly on the computer resources available to you at the time. It is recommended to always include the variable that identifies the country. At least one variable has to be specified, usually IDCNTRY.
XVAR This is a list of independent variables that will be used as predictors of the dependent variable specified in DVAR. The independent variables can be continuous or categorical. For example, it could be the variable ITSEX as originally coded in the data files, or dummy coded as 1 or 0.
DVAR This is the dependent variable that will be predicted by the variable or variables specified by the XVAR parameter. Only one variable can be listed here. If you want to use the same set of predictor variables to predict two different variables, then the macro needs to be invoked separately to generate each set of results.
JKZ The variable that captures the assignment of cases to sampling zones. The name of this variable in all TIMSS files is JKZONE.

TIMSS 2003 International Database User Guide 4-25
JKR The variable that captures whether the case is to be dropped or have its weight doubled for each set of replicate weights. The name of this variable in all TIMSS files is JKREP.
NJKZ This indicates the number of replicate weights to be generated when computing the JRR standard errors. When conducting analyses using the data from all countries, the value of NJKZ should be set to 75. When you are working with the data for only one country, you should set the NJKZ argument to as many replicates as are needed for the country. If the data from two or more countries are being used for an analysis, then the larger number of jackknife zones should be used. When in doubt, NJKZ should be set to 75. The standard errors will always be estimated correctly if more replicate weights than necessary are computed, but will be underestimated if you specify fewer replicate weights than necessary.
WGT The sampling weight to be used, generally TOTWGT when using the student files, or MATWGT, SCIWGT, or TCHWGT when using the teacher files.
The simplest and most straightforward way to invoke the macro is by using the conventional SPSS notation for invoking macros. This involves listing the macro name followed by the list of arguments for the analysis, each separated by a slash. For example, if the macro is invoked using
include "D:\TIMSS2003\Programs\SPSS_Programs\jackreg.sps" .
jackreg infile = BSGALLM3 / cvar = IDCNTRY / xvar = REGSEX / dvar = BOOK / njkz = 75 / jkz = JKZONE / jkr = JKREP / wgt = TOTWGT .
it will perform a multiple linear regression with the variable REGSEX as a predictor of the number of books at home, and the standard errors of the regression coefficients will be computed based on 75 replicate weights.
TIMSS 2003 International Database User Guide4-26
The file that contains the results is called REG and is saved to the default directory being used by SPSS. The variables that are contained in this results file are:
Classification Variables
All classification variables are kept in the results file. In the example there is only one variable: IDCNTRY. There is one record for each category of this variable.
N
Contains the number of valid cases within each group defined by the classification variables.
Mult_RSQ
The squared multiple correlation coefficient for the model within each group.
SS_Res, SS_Reg, SS_Total
The residual, regression, and total sums of squares for the model within each group.
Regression Coefficients and Standard Errors (B## and B##.SE)
These are the regression coefficients for each of the predictor variables in the model and their respective JRR standard errors. The coefficient zero (B00) is the intercept for the model. The other coefficients receive a sequential number starting with 01. This sequential number corresponds to the order of the variables in the list of variables specified in the parameter XVAR.
The contents of the REG file can be printed using an SPSS procedure of choice. An example call to this macro, and an extract of the results file, is presented in Exhibit 4.6. The code is included in the file called SampleJackReg.SPS.

TIMSS 2003 International Database User Guide 4-27
Exhibit 4.6 Extract of SPSS Control Code and Output File for Using the Macro JACKREG.SPS
add files / file = "D:\TIMSS2003\Data\SPSS_Data\BSGARMM3.SAV" / file = "D:\TIMSS2003\Data\SPSS_Data\BSGAUSM3.SAV" / file = "D:\TIMSS2003\Data\SPSS_Data\BSGBFLM3.SAV" / file = "D:\TIMSS2003\Data\SPSS_Data\BSGBGRM3.SAV" / file = "D:\TIMSS2003\Data\SPSS_Data\BSGBHRM3.SAV" .
select if not(missing(ITSEX)) .
compute REGSEX = ITSEX - 1 .
recode BSBGBOOK (1=5) (2=18) (3=63) (4=151) (5=251) into BOOK .
variable labels BOOK 'BOOKS AT HOME - Categorized' .
value labels BOOK 5 '5 Books at home' 18 '18 Books at home' 63 '63 Books at home' 151 '151 Books at home' 251 '251 Books at home' / IDCNTRY <list all country codes and county names>
save outfile = BSGALLM3
include "D\TIMSS2003\Programs\SPSS_Programs\jackreg.sps" .
jackreg infile = BSGALLM3 / cvar = IDCNTRY / xvar = REGSEX / dvar = BOOK / njkz = 75 / jkz = JKZONE / jkr = JKREP / wgt = TOTWGT .
* Print the results .print formats IDCNTRY n (f6.0) mult_rsq (f5.3) ss_total ss_reg (f10.0) b00 b00.se b01 b01.se (f6.2) .
list vars = IDCNTRY n mult_rsq ss_total ss_reg b00 b00.se b01 b01.se . IDCNTRY N MULT_RSQ SS_TOTAL SS_REG B00 B00.SE B01 B01.SE
36 4663 0.002 2056635596 4451708 129.26 3.24 8.42 4.06 48 4162 0.001 76995110 60535 92.17 2.14 -4.81 2.88 51 5558 0.000 430338454 17825 91.67 3.32 1.16 2.85 100 3996 0.001 785508028 897904 120.51 4.66 -6.51 4.30 956 4888 0.000 416292531 533 78.80 2.12 0.18 3.35
In this example, the variable REGSEX is created by subtracting one from the variable ITSEX. As a result, the girls receive a code of 0 and the boys receive a code of 1 on this variable. The variable BOOK is created to convert the responses to number of books. In this regression model, the variable REGSEX is

TIMSS 2003 International Database User Guide4-28
used to predict the values of the variable BOOK by country. In the results listing, we can see that there is one entry for each value of the variable IDCNTRY. The first column has the country code and the second column has the number of valid cases in each country. The multiple R squared is listed for each country, followed by the sums of squares for the model, and the regression coefficients and their standard errors. Because of the way in which the variable REGSEX is coded, the intercept B00 is the mean value for the variable BOOK for the girls and B00_SE is its standard error. The first regression coefficient (B01) is the difference in the mean value of the variable BOOK between girls and boys, and B01_SE is its JRR standard error.
From the first line of the results in Exhibit 4.6, we can say that in Australia (IDCNTRY=36) valid data were available for 4,663 cases. The squared multile correlation coefficient between gender and books at home is 0.002, with girls having on average 129.26 books at home and boys having on average 8.42 books more than girls. This difference is statistically significant, which can be determined by dividing the value of B01 by its standard error and comparing the result to the appropriate critical value.
Computing Regression Coefficients and Their JRR Standard Errors with Plausible Values (JACKREGP.SPS)
This section presents example SPSS code that can be used to compute regression coefficients and their JRR standard errors using plausible values as the dependent variable. This code is provided in the form of an SPSS macro, called JACKREGP.SPS, which performs a multiple linear regression between a set of plausible values specified as a dependent variable, and independent variables within subgroups defined by a set of classification variables, as well as the regression coefficients and their JRR standard errors.
The JACKREGP.SPS macro operates as follows:
1. Computes a set of replicate weights specified using the parameters NJKZ, JKZ, and JKR.
2. Aggregates or summarizes the data by computing the sum of the weights for each subgroup, the sum of the weights overall, and the weighted sum of all specified analysis variables.
3. Performs a multiple linear regression within each group, and computes the regression coefficients and their respective standard errors. The resulting working file REG contains all the computed statistics.
When using this macro, you need to specify a set of classification variables, the analysis variables including the set of plausible values, the number of replicate weights to be generated, the variables that contain the jackknife replication

TIMSS 2003 International Database User Guide 4-29
information (JKZONE and JKREP), and the sampling weight that is to be used for the analysis. You will also need to specify the data file that contains the data that is to be processed.
You need to know some basic SPSS macro language in order to use the macro. The macro should be included in the program file where it is going to be used. If you are operating in batch mode, then the macro needs to be included in every batch. If you are using SPSS interactively then the macro needs to be included once at the beginning of the session and it will remain active throughout the session. If the session is terminated and restarted at a later time the macro needs to be included once again. Once the macro is included in a specific session, the word “JACKREGP” should not be used within that program because doing so will invoke the macro.
The macro is included in the program file by issuing the following command in SPSS:
include "<path>jackregp.sps".
where <path> points to the specific drive and directory where the macro JACKREGP.SPS can be found. The macro requires that several parameters be specified when it is invoked. These parameters are:
INFILE The name of the data file that contains the variables necessary for the analysis. If the path location is included as part of the file name, the name of the file has to be enclosed in quotes. It is important to emphasize that this system file must include only those cases that are of interest in the analysis. If you want to have specific cases excluded from the analysis, for example students with missing data, this should be done prior to invoking the macro.
CVAR This lists the variables that are to be used to classify the students in the data file. This can be a single variable, or a list of variables. The maximum number of variables will depend mostly on the computer resources available to you at the time. It is recommended to always include the variable that identifies the country. At least one variable has to be specified, usually IDCNTRY.

TIMSS 2003 International Database User Guide4-30
XVAR This is a list of independent variables which will be used as predictors of the dependent variable specified as a set of plausible values in ROOTPV. The independent variables can be continuous or categorical. For example, it could be the variable ITSEX as originally coded in the data files, or dummy coded as 1 or 0.
ROOTPV This is the prefix used to identify the set of plausible values for the achievement scale of interest. This corresponds to the first 7 characters of the plausible values variable name. For example, the root of the overall science plausible values is “BSSSCI0,” the root of the geometry plausible values is “BSMGEO0.”
NPV This is the number of plausible values that will be used in the analysis. Generally you will want to use all five plausible values for the analysis, although in some circumstances fewer can be used. You should always use at least two plausible values for any analysis.
JKZ The variable that captures the assignment of cases to sampling zones. The name of this variable in all TIMSS files is JKZONE.
JKR The variable that captures whether the case is to be dropped or have its weight doubled for each set of replicate weights. The name of this variable in all TIMSS files is JKREP.
NJKZ This indicates the number of replicate weights to be generated when computing the JRR error estimates. When conducting analyses using the data from all countries, the value of NJKZ should be set to 75, the maximum possible value. When you are working with the data for only one country, you should set the NJKZ argument to as many replicates as are needed for the country. If the data from two or more countries is being used for an analysis, then the larger number of jackknife zones should be used. When in doubt, NJKZ should be set to 75. The standard errors will always be estimated correctly if more replicate weights than necessary are computed, but will be underestimated if you specify fewer replicate weights than necessary.

TIMSS 2003 International Database User Guide 4-31
WGT The sampling weight to be used, generally TOTWGT when using the student files, or MATWGT, SCIWGT, or TCHWGT when using the teacher files.
The simplest and most straightforward way to invoke the macro is by using the conventional SPSS notation for invoking macros. This involves listing the macro name followed by the list of arguments for the analysis, each separated by a slash. For example, if the macro is invoked using
include "D:\TIMSS2003\Programs\SPSS_Programs\jackregp.sps" .
jackregp infile = BSGALLM3 / cvar = IDCNTRY / xvar = REGSEX / rootpv = BSMMAT0 / npv = 5 / njkz = 75 / jkz = JKZONE / jkr = JKREP / wgt = TOTWGT .
it will perform a multiple linear regression with the variable REGSEX as a predictor of the mathematics plausible values, and the standard errors of the regression coefficients will be computed based on 75 replicate weights.
The file that contains the results is called REG and is saved in the default directory being used by SPSS. The variables that are contained in this file are:
Classification Variables
All classification variables are kept in the results file. In the example there is only one variable: IDCNTRY. There is one record for each category of this variable.
N
Contains the number of valid cases within each group defined by the classification variables.
Mult_RSQ
The squared multiple correlation coefficient for the model within each group.

TIMSS 2003 International Database User Guide4-32
SS_Res, SS_Reg, SS_Total
The residual, regression, and total sums of squares for the model within each group.
Regression Coefficients and Standard Errors (B## and B##.SE)
These are the regression coefficients for each of the predictor variables in the model and their respective JRR standard errors. The coefficient zero (B00) is the intercept for the model. The other coefficients receive a sequential number starting with 01. This sequential number corresponds to the order of the variables in the list of variables specified in the parameter XVAR.
The contents of the REG file can be printed using a SPSS procedure of choice. An example call to this macro, and an extract of the results file, is presented in Exhibit 4.7. The code is included in the file called SampleJackRegP.SPS.

TIMSS 2003 International Database User Guide 4-33
Exhibit 4.7 Extract of SPSS Control Code and Output File for Using the Macro JACKREGP.SPS
add files / file = "D:\TIMSS2003\Data\SPSS_Data\BSGARMM3.SAV" / file = "D:\TIMSS2003\Data\SPSS_Data\BSGAUSM3.SAV" / file = "D:\TIMSS2003\Data\SPSS_Data\BSGBFLM3.SAV" / file = "D:\TIMSS2003\Data\SPSS_Data\BSGBGRM3.SAV" / file = "D:\TIMSS2003\Data\SPSS_Data\BSGBHRM3.SAV" .
select if not(missing(ITSEX)) .
compute REGSEX = ITSEX - 1 .
value labels IDCNTRY <list all country codes and county names>
save outfile = BSGALLM3
include "D\TIMSS2003\Programs\SPSS_Programs\jackregp.sps" .
jackregp infile = BSGALLM3 / cvar = IDCNTRY / xvar = REGSEX / rootpv = BSMMAT0 / npv = 5 / njkz = 75 / jkz = JKZONE / jkr = JKREP / wgt = TOTWGT .
* Print the results .print formats IDCNTRY n (f6.0) mult_rsq (f5.3) ss_total ss_reg (f12.0) b00 b00.se b01 b01.se (f6.2) .
list vars = IDCNTRY n mult_rsq ss_total ss_reg b00 b00.se b01 b01.se . IDCNTRY N MULT_RSQ SS_TOTAL SS_REG B00 B00.SE B01 B01.SE
36 4791 .006 1711442579 10114110 498.59 5.79 12.51 7.04 48 4199 .045 61405486 2791933 417.32 2.37 -32.54 3.34 51 5699 .004 378269349 1380629 482.86 3.29 -10.08 2.97 100 4117 .000 619290982 44393 475.65 5.48 1.01 4.70 956 4970 .005 381570675 2053629 531.72 3.53 10.77 4.82
In this example, the variable REGSEX is once again created by subtracting one from the variable ITSEX. As a result, the girls receive a code of 0 and the boys receive a code of 1 on this variable. In this regression model, the variable REGSEX is used to predict the mathematics achievement by country using all five plausible values. In the results listing, we can see that there is one entry for each value of the variable IDCNTRY. The first column has the country code and the second column has the number of valid cases in each country. The multiple R squared is listed for each country, followed by the sums of squares for the model, and the regression coefficients and their standard errors. Because

TIMSS 2003 International Database User Guide4-34
of the way in which the variable REGSEX is coded, the intercept B00 is the mean mathematics achievement for the girls and B00_SE is its standard error. The first regression coefficient (B01) is the difference in the mean mathematics achievement between girls and boys, and B01_SE is its JRR standard error.
From the first line of the results in Exhibit 4.7, we can say that in Australia (IDCNTRY=36) valid data was available for 4,791 cases. The squared multiple correlation coefficient between gender and mathematics achievement is 0.006 with girls achieving on average 498.59 in mathematics and boys scoring on average 12.51 points higher. This difference is not statistically significant.
4.7 Replicating Analyses from the TIMSS 2003 International Reports: Student-Level
Many analyses of the TIMSS data can be undertaken using student-level data. We have already presented some examples in the previous sections when explaining how to use the macros provided with the data files. We now proceed to work through additional examples of actual analyses from the TIMSS 2003 international reports, where all the required steps are undertaken, including the invocation of the appropriate SPSS macros.
Example of Student-Level Analysis without Plausible Values
In our first example, we wish to replicate the analysis of eighth graders’ reports on the average number of hours spent reading a book for enjoyment during their leisure time on a normal school day. The results, originally presented in Exhibit 4.8 of the TIMSS 2003 International Science Report, are reproduced in Exhibit 4.8. Since we only want to report the average number of hours, which does not require any plausible values, we need to use the macro JACKGEN.

Armenia 1.8 (0.03) r 0.9 (0.03) r 1.6 (0.03) r 0.4 (0.02) r 1.2 (0.03) r 1.6 (0.03) r 0.7 (0.03) r 1.0 (0.04)Australia 2.0 (0.03) 0.9 (0.02) 1.7 (0.04) 1.0 (0.02) 1.6 (0.03) 0.7 (0.02) 1.3 (0.04) 0.4 (0.03)Bahrain 2.0 (0.03) 1.2 (0.02) 1.6 (0.03) 1.2 (0.02) 1.5 (0.03) 0.9 (0.02) 1.4 (0.03) 0.6 (0.02)Belgium (Flemish) 2.1 (0.03) 1.0 (0.03) 1.9 (0.03) 0.9 (0.02) 1.6 (0.03) 0.5 (0.01) 1.3 (0.03) 0.2 (0.02)Botswana 1.4 (0.03) 0.5 (0.02) 2.1 (0.04) 2.3 (0.03) 1.5 (0.02) 1.8 (0.03) 0.7 (0.02) 0.6 (0.03)Bulgaria 2.5 (0.04) 1.1 (0.04) 2.6 (0.05) 1.5 (0.03) 1.2 (0.04) 0.7 (0.03) 1.0 (0.04) 0.3 (0.02)Chile 2.2 (0.02) 0.7 (0.02) 2.3 (0.02) 1.5 (0.02) 1.8 (0.03) 0.6 (0.01) 0.7 (0.02) 0.3 (0.02)Chinese Taipei 1.7 (0.03) 1.4 (0.04) 1.4 (0.03) 0.7 (0.01) 1.0 (0.02) 1.0 (0.02) 1.4 (0.04) 0.2 (0.01)Cyprus 2.1 (0.03) 1.3 (0.02) 2.1 (0.03) 1.0 (0.03) 1.7 (0.03) 0.9 (0.02) 1.2 (0.02) 0.6 (0.02)Egypt 0.8 (0.02) 0.7 (0.02) 0.8 (0.02) 1.3 (0.03) 1.1 (0.02) 1.0 (0.02) 0.6 (0.02) 0.6 (0.02)Estonia 2.3 (0.03) 1.1 (0.03) 2.8 (0.03) 1.1 (0.02) 1.4 (0.03) 0.7 (0.02) 1.5 (0.04) 0.4 (0.02)Ghana 0.7 (0.02) 0.6 (0.02) 1.2 (0.03) 1.5 (0.03) 1.3 (0.02) 1.7 (0.03) 0.8 (0.03) 0.8 (0.03)Hong Kong, SAR 2.3 (0.03) 2.0 (0.04) 1.6 (0.03) 0.7 (0.01) 1.0 (0.02) 1.1 (0.02) 2.0 (0.03) 0.1 (0.01)Hungary 2.1 (0.03) 1.1 (0.03) 2.2 (0.03) 1.1 (0.02) 1.5 (0.03) 0.8 (0.02) 0.6 (0.03) 0.2 (0.02)Indonesia 1.5 (0.03) 0.5 (0.02) 1.3 (0.03) 2.2 (0.03) 1.1 (0.02) 1.1 (0.02) 0.3 (0.02) 0.8 (0.03)Iran, Islamic Rep. of 1.6 (0.03) 0.4 (0.02) 1.4 (0.03) 1.5 (0.03) 1.4 (0.04) 1.0 (0.02) 0.2 (0.02) 0.7 (0.05)Israel 2.5 (0.04) 1.9 (0.03) 2.3 (0.03) 1.4 (0.03) 1.6 (0.03) 0.9 (0.02) 1.8 (0.04) 0.6 (0.02)Italy 1.8 (0.03) 1.0 (0.02) 2.6 (0.03) 1.1 (0.03) 1.8 (0.03) 0.7 (0.02) 0.6 (0.02) 0.9 (0.02)Japan 2.7 (0.03) 0.9 (0.02) 1.6 (0.04) 0.6 (0.01) 1.3 (0.03) 0.9 (0.02) 0.6 (0.02) 0.1 (0.01)Jordan 1.5 (0.03) 0.9 (0.03) 1.2 (0.03) 1.3 (0.03) 1.2 (0.03) 0.9 (0.02) 0.6 (0.03) 0.6 (0.03)Korea, Rep. of 1.7 (0.03) 1.5 (0.03) 1.8 (0.03) 0.7 (0.01) 0.7 (0.02) 0.6 (0.01) 1.7 (0.03) 0.1 (0.01)Latvia 2.4 (0.03) 1.0 (0.02) 2.8 (0.03) 1.6 (0.03) 1.3 (0.03) 0.8 (0.03) 0.8 (0.03) 0.5 (0.02)Lebanon 1.8 (0.04) 1.3 (0.03) 1.6 (0.04) 1.3 (0.03) 1.6 (0.03) 1.0 (0.02) 1.0 (0.03) 0.8 (0.03)Lithuania 2.1 (0.03) 1.1 (0.03) 2.6 (0.04) 1.6 (0.04) 1.1 (0.03) 0.6 (0.02) 0.7 (0.03) 0.3 (0.02)Macedonia, Rep. of 2.3 (0.04) 1.3 (0.03) 2.2 (0.03) 1.6 (0.03) 1.8 (0.03) 1.0 (0.02) 0.9 (0.03) 0.7 (0.03)Malaysia 2.1 (0.04) 0.8 (0.03) 1.5 (0.03) 1.7 (0.02) 1.1 (0.02) 1.2 (0.02) 0.6 (0.02) 0.3 (0.02)Moldova, Rep. of 1.9 (0.04) 0.7 (0.03) 2.0 (0.04) 2.2 (0.06) 1.3 (0.03) 1.1 (0.03) 0.7 (0.03) 0.5 (0.03)Morocco 1.3 (0.04) 2.3 (0.06) 1.3 (0.03) 1.8 (0.03) 1.5 (0.03) r 1.3 (0.03) r 2.6 (0.06) r 2.8 (0.06)Netherlands 2.1 (0.05) 1.2 (0.04) 2.0 (0.05) 0.8 (0.02) 1.7 (0.04) 0.5 (0.02) 1.5 (0.04) 0.8 (0.05)New Zealand 2.1 (0.04) 1.0 (0.04) 1.8 (0.05) 1.0 (0.02) 1.5 (0.03) 0.7 (0.03) 1.3 (0.04) 0.6 (0.03)Norway 2.2 (0.03) 1.2 (0.03) 2.7 (0.03) 1.0 (0.03) 1.8 (0.03) 0.6 (0.02) 1.2 (0.03) 0.7 (0.02)Palestinian Nat'l Auth. 1.2 (0.02) 0.7 (0.02) 1.3 (0.03) 1.5 (0.03) 1.1 (0.03) 1.0 (0.02) 0.5 (0.02) 0.6 (0.03)Philippines 1.6 (0.04) 0.6 (0.02) 1.7 (0.03) 1.9 (0.03) 1.4 (0.02) 1.2 (0.02) 0.5 (0.03) 0.8 (0.04)Romania 2.0 (0.04) 0.9 (0.03) 2.1 (0.03) 1.7 (0.05) 1.3 (0.03) 1.0 (0.03) 0.8 (0.04) 0.5 (0.04)Russian Federation 2.0 (0.03) 1.0 (0.03) 2.5 (0.04) 1.6 (0.03) 1.3 (0.02) 1.1 (0.03) 0.4 (0.02) 0.2 (0.02)Saudi Arabia 1.6 (0.05) 1.1 (0.03) 1.3 (0.03) 1.5 (0.04) 1.2 (0.04) 0.9 (0.02) 0.8 (0.05) 0.8 (0.03)Scotland 2.2 (0.03) 1.4 (0.04) 2.7 (0.03) 0.8 (0.02) 1.7 (0.03) 0.6 (0.02) 1.4 (0.03) 0.5 (0.03)Serbia 2.1 (0.03) 1.0 (0.03) 2.1 (0.03) 1.3 (0.03) 1.7 (0.03) 0.8 (0.02) 0.6 (0.03) 0.3 (0.02)Singapore 2.3 (0.02) 1.4 (0.02) 1.7 (0.02) 0.7 (0.02) 1.4 (0.02) 0.9 (0.02) 1.6 (0.02) 0.2 (0.02)Slovak Republic 2.5 (0.03) 1.1 (0.03) 2.8 (0.03) 1.5 (0.03) 1.9 (0.04) 0.9 (0.02) 0.6 (0.03) 0.4 (0.02)Slovenia 2.2 (0.03) 1.3 (0.03) 2.0 (0.03) 1.2 (0.03) 1.7 (0.03) 0.8 (0.02) 1.1 (0.03) 0.4 (0.02)South Africa 1.5 (0.03) 0.7 (0.02) 2.0 (0.03) 1.8 (0.03) 1.6 (0.02) 1.6 (0.03) 0.8 (0.02) 0.8 (0.02)Sweden 2.1 (0.03) 1.1 (0.03) 2.8 (0.03) 1.0 (0.02) 1.6 (0.03) 0.6 (0.02) 1.7 (0.04) 0.4 (0.02)Tunisia 1.4 (0.02) 0.8 (0.03) 1.5 (0.02) 1.9 (0.03) 1.5 (0.02) 1.3 (0.02) 0.7 (0.02) 0.6 (0.02)United States 2.2 (0.03) 1.1 (0.02) 2.4 (0.03) 1.2 (0.02) 1.8 (0.02) 0.7 (0.01) 1.8 (0.03) 0.6 (0.02)
¶ England 2.0 (0.04) 1.1 (0.04) 2.4 (0.05) 0.8 (0.03) 1.4 (0.05) 0.5 (0.02) 1.4 (0.04) 0.5 (0.04)International Avg. 1.9 (0.00) 1.1 (0.00) 1.9 (0.00) 1.3 (0.00) 1.4 (0.00) 0.9 (0.00) 1.0 (0.00) 0.6 (0.00)
Benchmarking ParticipantsBasque Country, Spain 1.6 (0.04) 0.9 (0.03) 2.4 (0.04) 0.9 (0.03) 1.5 (0.03) 0.7 (0.02) 0.8 (0.03) 0.4 (0.03)Indiana State, US 2.2 (0.06) 1.0 (0.04) 2.4 (0.06) 1.2 (0.04) 1.8 (0.04) 0.7 (0.03) 1.7 (0.04) 0.6 (0.05)Ontario Province, Can. 2.1 (0.04) 1.2 (0.04) 2.0 (0.04) 0.9 (0.02) 1.7 (0.03) 0.8 (0.02) 1.9 (0.04) 0.6 (0.03)Quebec Province, Can. 2.0 (0.03) 1.4 (0.03) 2.0 (0.04) 0.9 (0.02) 1.7 (0.04) 0.6 (0.02) 1.5 (0.04) 0.6 (0.02)
Countries WatchTelevisionand Videos
PlayComputer
Games
Play or Talkwith Friends
Do Jobsat Home
PlaySports
Reada Book forEnjoyment
Use theInternet
Work ata Paid Job
Average Hours Spent Each Day*
TIMSS 2003 International Database User Guide 4-35
Exhibit 4.8 Sample Exhibit for Student-Level Analysis without Plausible Values Taken From the TIMSS 2003 International Science Report (Exhibit 4.8)

TIMSS 2003 International Database User Guide4-36
To replicate the results in this exhibit, we need to undertake several steps. After reviewing the codebooks and the questionnaire information, we observe that the variable BSBGREBO contains information on the number of hours spent reading for enjoyment before or after school (see Supplement 1 for a copy of the student background questionnaire), and this variable is found in the Student Background data file. Our next step is to review the documentation of national adaptations to the questionnaires to ensure that there were no deviations listed for this variable (see Supplement 2). If no national adaptations were made, we can continue with our analysis without any modifications.
We then proceed to read from the Student Background file our variable of interest (BSBGREBO), the student sampling weight (TOTWGT), the variables that contain the jackknife replication information (JKZONE and JKREP), and the variable containing the country identification code (IDCNTRY). In this analysis, we will use the data for all available countries, although the exact same steps need to be taken if you want to examine these variables within a single country, or for a select group of countries. We used the JOIN program, described earlier in this chapter, to join the eighth grade Student Background files for all countries into a single file called BSGALLM3.
In general, analyses involving all available countries are quite feasible with a powerful desktop computer; however, you need to keep in mind that computing and storage requirements for these types of analyses can be quite demanding.
The SPSS program code is presented in Exhibit 4.9 and is included on the DVD under the name EXAMPLE1.SPS. The results obtained from this program are displayed in Exhibit 4.10. We have included as part of the program the corresponding value labels and format statements so that the different categories or groups are labeled appropriately.
Note that one of the steps in this program is to select only those eighth grade students who have non-missing data in the variable of interest BSBGREBO.
In general, to perform student-level analyses of this type using the Student Background data files, you should do the following:
• Identify the variables of interest in the Student Background files and note any specific national adaptations to the variables.
• Retrieve the relevant variables from the Student Background files, including the sampling weights, the JRR replication information, and any other variables used in the selection of cases.
• Use the macro JACKGEN with the appropriate arguments and parameters.
• Print out the results file.
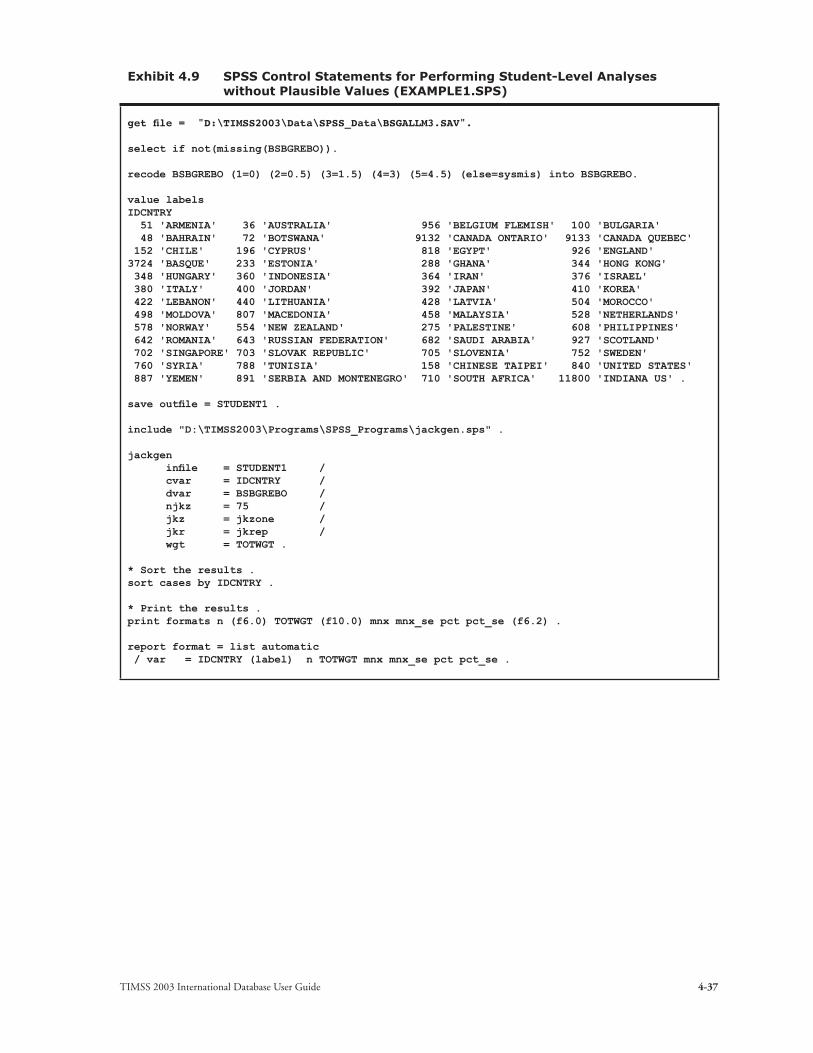
TIMSS 2003 International Database User Guide 4-37
Exhibit 4.9 SPSS Control Statements for Performing Student-Level Analyses without Plausible Values (EXAMPLE1.SPS)
get file = "D:\TIMSS2003\Data\SPSS_Data\BSGALLM3.SAV".
select if not(missing(BSBGREBO)).
recode BSBGREBO (1=0) (2=0.5) (3=1.5) (4=3) (5=4.5) (else=sysmis) into BSBGREBO.
value labelsIDCNTRY 51 'ARMENIA' 36 'AUSTRALIA' 956 'BELGIUM FLEMISH' 100 'BULGARIA' 48 'BAHRAIN' 72 'BOTSWANA' 9132 'CANADA ONTARIO' 9133 'CANADA QUEBEC' 152 'CHILE' 196 'CYPRUS' 818 'EGYPT' 926 'ENGLAND' 3724 'BASQUE' 233 'ESTONIA' 288 'GHANA' 344 'HONG KONG' 348 'HUNGARY' 360 'INDONESIA' 364 'IRAN' 376 'ISRAEL' 380 'ITALY' 400 'JORDAN' 392 'JAPAN' 410 'KOREA' 422 'LEBANON' 440 'LITHUANIA' 428 'LATVIA' 504 'MOROCCO' 498 'MOLDOVA' 807 'MACEDONIA' 458 'MALAYSIA' 528 'NETHERLANDS' 578 'NORWAY' 554 'NEW ZEALAND' 275 'PALESTINE' 608 'PHILIPPINES' 642 'ROMANIA' 643 'RUSSIAN FEDERATION' 682 'SAUDI ARABIA' 927 'SCOTLAND' 702 'SINGAPORE' 703 'SLOVAK REPUBLIC' 705 'SLOVENIA' 752 'SWEDEN' 760 'SYRIA' 788 'TUNISIA' 158 'CHINESE TAIPEI' 840 'UNITED STATES' 887 'YEMEN' 891 'SERBIA AND MONTENEGRO' 710 'SOUTH AFRICA' 11800 'INDIANA US' .
save outfile = STUDENT1 .
include "D:\TIMSS2003\Programs\SPSS_Programs\jackgen.sps" .
jackgen infile = STUDENT1 / cvar = IDCNTRY / dvar = BSBGREBO / njkz = 75 / jkz = jkzone / jkr = jkrep / wgt = TOTWGT .
* Sort the results .sort cases by IDCNTRY .
* Print the results .print formats n (f6.0) TOTWGT (f10.0) mnx mnx_se pct pct_se (f6.2) .
report format = list automatic / var = IDCNTRY (label) n TOTWGT mnx mnx_se pct pct_se .

TIMSS 2003 International Database User Guide4-38
Exhibit 4.10 Extract of SPSS Computer Output for Performing Student-Level Analyses without Plausible Values (EXAMPLE 1)
*COUNTRY ID* N TOTWGT MNX MNX_SE PCT PCT_SE_____________________ ______ __________ ______ ______ ______ ______
AUSTRALIA 4609 248940 .69 .02 1.29 .04BAHRAIN 4051 10177 .89 .02 .05 .00ARMENIA 4697 45299 1.59 .03 .23 .01BOTSWANA 4665 32840 1.79 .03 .17 .00BULGARIA 3842 81651 .74 .03 .42 .01CHILE 6291 261935 .62 .01 1.36 .03CHINESE TAIPEI 5363 296886 1.03 .02 1.54 .03CYPRUS 3790 8720 .93 .02 .05 .00ESTONIA 3903 20266 .68 .02 .10 .00PALESTINE 5158 62339 .98 .02 .32 .01GHANA 4524 243471 1.75 .03 1.26 .05HONG KONG 4914 81716 1.06 .02 .42 .01HUNGARY 3200 97457 .80 .02 .50 .01INDONESIA 5452 2186548 1.06 .02 11.32 .24IRAN 4815 1332910 1.00 .02 6.90 .15ISRAEL 4076 81016 .90 .02 .42 .01ITALY 4229 562078 .68 .02 2.91 .05JAPAN 4801 1255020 .86 .02 6.50 .06JORDAN 4257 91377 .85 .02 .47 .01KOREA 5266 566354 .62 .01 2.93 .05LEBANON 3467 52587 1.05 .02 .27 .01LATVIA 3524 32618 .78 .03 .17 .00LITHUANIA 4383 41668 .57 .02 .22 .01MALAYSIA 5278 411531 1.15 .02 2.13 .05MOLDOVA 3875 59224 1.12 .03 .31 .01MOROCCO 2540 176187 1.32 .03 .91 .03NETHERLANDS 2861 176429 .50 .02 .91 .03NEW ZEALAND 3595 54534 .72 .03 .28 .01NORWAY 3977 59045 .64 .02 .31 .01PHILIPPINES 6754 1362283 1.22 .02 7.05 .17ROMANIA 3917 280384 .96 .03 1.45 .03RUSSIAN FEDERATION 4499 1853726 1.13 .03 9.60 .41SAUDI ARABIA 4059 309671 .91 .02 1.60 .07SINGAPORE 5980 52964 .89 .02 .27 .00SLOVAK REPUBLIC 4150 74563 .86 .02 .39 .01SLOVENIA 3498 22485 .82 .02 .12 .00SOUTH AFRICA 8133 708468 1.60 .03 3.67 .09SWEDEN 4071 104366 .63 .02 .54 .01TUNISIA 4680 174690 1.30 .02 .90 .01MACEDONIA 3523 23466 1.00 .02 .12 .00EGYPT 6479 1216237 1.00 .02 6.30 .13UNITED STATES 8671 3359064 .69 .01 17.39 .25SERBIA AND MONTENEGRO 4024 82070 .76 .02 .42 .01ENGLAND 2631 616594 .53 .02 3.19 .10SCOTLAND 3396 56784 .59 .02 .29 .01BELGIUM FLEMISH 4849 68852 .47 .01 .36 .01BASQUE 2470 18394 .70 .02 .10 .00CANADA ONTARIO 4074 141318 .80 .02 .73 .03CANADA QUEBEC 4253 78813 .59 .02 .41 .01INDIANA US 2144 74604 .69 .03 .39 .01
In this example, each country’s mean value for BSBGREBO is reported for the eighth grade. The results are presented by country. The countries are identified in the first column and the second column reports the number of valid cases.

TIMSS 2003 International Database User Guide 4-39
The third column reports the sum of weights of these students, followed by the mean for BSBGREBO and its respective standard error. The last two columns report the weighted percentages of students in the population and their respective standard errors.
From the first line in Exhibit 4.10, we can say that in Australia valid data were available for 4,609 cases. These sampled students represent a population of 248,940 students. Australian students spend, on average, 0.69 hours reading for enjoyment before or after school. The standard error of this mean is 0.02.
Example of Student-Level Analysis with Plausible Values
In this second example, we wish to replicate another one of the results presented in the international reports. We are interested in looking at the eighth graders’ reports on the number of books in their home and their science achievement. These results, originally presented in Exhibit 4.4 of the TIMSS 2003 International Science Report, are reproduced in Exhibit 4.11. Since the results in this Exhibit are based on plausible values, we need to use the macro JACKPV.

������� �� ����� ��� ����� �� ����� ��� �������������� �� ����� ��� ����� � ����� ��� ������������ �� ����� ��� ����� �� ����� ��� ���������������������� �� ����� ��� ����� �� ����� ��� ������������� �� ����� ��� ����� �� ����� ��� ������������� �� ����� ��� ����� �� ����� ��� ����������� �� ����� ��� ����� �� ����� ��� ������������������� �� ����� ��� ����� �� ����� ��� ����������� �� ����� ��� ����� �� ����� ��� ���������� �� ����� ��� ����� �� ����� ��� ������������ �� ����� ��� ����� � ����� ��� ���������� �� ����� ��� ����� �� ����� ��� ������������������� �� ����� ��� ����� �� ����� ��� ������������ �� ����� ��� ����� � ����� ��� �������������� �� ����� ��� ����� �� ����� ��� �������������������������� �� ����� ��� ����� �� ����� ��� ����������� �� ����� ��� ����� � ����� ��� ���������� �� ����� ��� ����� �� ����� ��� ���������� �� ����� ��� ����� �� ����� ��� ����������� �� ����� ��� ����� �� ����� ��� ������������������� �� ����� ��� ����� �� ����� ��� ����������� �� ����� ��� ����� � ����� ��� ������������ �� ����� ��� ����� �� ����� ��� �������������� �� ����� ��� ����� �� ����� ��� ����������������������� �� ����� ��� ����� �� ����� ��� ������������� �� ����� ��� ����� �� ����� ��� ��������������������� �� ����� ��� ����� �� ����� ��� ������������ �� ����� ��� ����� �� ����� ��� ���������������� �� ����� ��� ����� �� ����� ��� ���������������� �� ����� ��� ����� � ����� ��� ����������� �� ����� ��� ����� � ����� ��� ���������������������������� �� ����� ��� ����� �� ����� ��� ���������������� �� ����� ��� ����� �� ����� ��� ������������ �� ����� ��� ����� �� ����� ��� ����������������������� �� ����� ��� ����� � ����� ��� ����������������� �� ����� ��� ����� �� ����� ��� ������������� �� ����� ��� ����� �� ����� ��� ����������� �� ����� ��� ����� �� ����� ��� �������������� �� ����� ��� ����� �� ����� ��� �������������������� �� ����� ��� ����� � ����� ��� ������������� �� ����� ��� ����� � ����� ��� ����������������� �� ����� ��� ����� �� ����� ��� ����������� �� ����� ��� ����� � ����� ��� ������������ �� ����� ��� ����� �� ����� ��� ������������������ �� ����� ��� ����� �� ����� ��� �����
� ������� �� ����� ��� ����� �� ����� ��� ����������������������� �� ����� ��� ����� �� ����� ��� �����
���������������������������������������������� �� ����� ��� ����� � ����� ��� ���������������������� �� ����� ��� ����� �� ����� ��� ��������������������������� �� ����� ��� ����� � ����� ��� �������������������������� �� ����� ��� ����� �� ����� ��� �����
����������� ����������
���������
������������������
������������������
������������������
������������������
������� �� ����� ��� ����� �� ����� ��� ����� �� ����� ��� �������������� �� ����� ��� ����� �� ����� ��� ����� �� ����� ��� ������������ �� ����� ��� ����� �� ����� ��� ����� �� ����� ��� ���������������������� �� ����� ��� ����� �� ����� ��� ����� �� ����� ��� ������������� � ����� ��� ������ � ����� ��� ����� �� ����� ��� ������������� �� ����� ��� ����� �� ����� ��� ����� �� ����� ��� ���������� � ����� ��� ����� � ����� ��� ����� �� ����� ��� ������������������� �� ����� ��� ����� �� ����� ��� ����� �� ����� ��� ����������� �� ����� ��� ����� �� ����� ��� ����� �� ����� ��� ���������� � ����� ��� ����� � ����� ��� ����� �� ����� ��� ������������ �� ����� ��� ����� �� ����� ��� ����� �� ����� ��� ���������� �� ����� ��� ������ � ����� ��� ������ �� ����� ��� ������������������� � ����� ��� ����� � ����� ��� ����� �� ����� ��� ������������ �� ����� ��� ����� �� ����� ��� ����� �� ����� ��� �������������� � ����� � � � ����� ��� ����� �� ����� ��� �������������������������� � ����� ��� ����� � ����� ��� ����� �� ����� ��� ����������� �� ����� ��� ����� �� ����� ��� ����� �� ����� ��� ���������� �� ����� ��� ����� �� ����� ��� ����� �� ����� ��� ���������� �� ����� ��� ����� �� ����� ��� ����� �� ����� ��� ����������� � ����� ��� ����� � ����� ��� ����� �� ����� ��� ������������������� �� ����� ��� ����� �� ����� ��� ����� �� ����� ��� ����������� �� ����� ��� ����� �� ����� ��� ����� �� ����� ��� ������������ � ����� ��� ����� � ����� ��� ����� �� ����� ��� �������������� �� ����� ��� ����� �� ����� ��� ����� �� ����� ��� ����������������������� � ����� ��� ����� � ����� ��� ����� �� ����� ��� ������������� � ����� ��� ����� � ����� ��� ����� �� ����� ��� ��������������������� � ����� ��� ����� � ����� ��� ����� �� ����� ��� ������������ � ����� ��� ������ � ����� ��� ����� �� ����� ��� ���������������� �� ����� ��� ����� �� ����� ��� ����� �� ����� ��� ���������������� �� ����� ��� ����� �� ����� ��� ����� �� ����� ��� ����������� �� ����� ��� ����� �� ����� ��� ����� �� ����� ��� ���������������������������� � ����� ��� ����� � ����� ��� ����� �� ����� ��� ���������������� � ����� ��� ������ � ����� ��� ������ �� ����� ��� ������������ �� ����� ��� ����� �� ����� ��� ����� �� ����� ��� ����������������������� �� ����� ��� ����� �� ����� ��� ����� �� ����� ��� ����������������� �� ����� ��� ����� � ����� ��� ����� �� ����� ��� ������������� �� ����� ��� ����� �� ����� ��� ����� �� ����� ��� ����������� � ����� ��� ����� � ����� ��� ����� �� ����� ��� �������������� �� ����� ��� ����� �� ����� ��� ����� �� ����� ��� �������������������� �� ����� ��� ����� �� ����� ��� ����� �� ����� ��� ������������� �� ����� ��� ����� �� ����� ��� ����� �� ����� ��� ����������������� � ����� ��� ������ � ����� ��� ������ �� ����� ��� ������������ �� ����� ��� ����� �� ����� ��� ����� �� ����� ��� ������������ � ����� ��� ����� � ����� ��� ����� �� ����� ��� ������������������ �� ����� ��� ����� �� ����� ��� ����� �� ����� ��� �����
� ������� �� ����� ��� ����� �� ����� ��� ����� �� ����� ��� ����������������������� �� ����� ��� ����� �� ����� ��� ����� �� ����� ��� �����
���������������������������������������������� �� ����� ��� ����� �� ����� ��� ����� �� ����� ��� ���������������������� �� ����� ��� ����� �� ����� ��� ����� �� ����� ��� ��������������������������� �� ����� ��� ����� �� ����� ��� ����� �� ����� ��� �������������������������� �� ����� ��� ����� �� ����� ��� ����� �� ����� ��� �����
������������������� ������������� ������������
������������������
������������������
���������
������������������
������������������
������������������
������������������
TIMSS 2003 International Database User Guide4-40
Exhibit 4.11 Sample Exhibit for Student-Level Analysis with Plausible Values Taken From the TIMSS 2003 International Science Report (Exhibit 4.4)
To replicate the results in this exhibit, we need to undertake several steps. After reviewing the codebooks and the questionnaire information, we observe that the variable BSBGBOOK contains information on the number of books in the home (see Supplement 1 for a copy of the student background questionnaire), and this variable is found in the Student Background data file. Our next step is to review the documentation of national adaptations to the questionnaires to ensure that there were no deviations listed for this variable (see Supplement 2). If no national adaptations were made, we can continue with our analysis without any modifications.
TIMSS 2003 International Database User Guide 4-41
We then proceed to read from the Student Background file our variable of interest (BSBGBOOK), the science achievement plausible values (BSSSCI01-BSSSCI05), the student sampling weight (TOTWGT ), the variables that contain the jackknife replication information (JKZONE and JKREP), and the variable containing the country identification code (IDCNTRY). In this analysis, we will again use the data for all available countries, although the exact same steps need to be taken if you want to examine these variables within a single country, or for a select group of countries.
The SPSS program code is presented in Exhibit 4.12 and is included on the DVD under the name EXAMPLE2.SPS. Selected results obtained from this program are displayed in Exhibit 4.13. We have included as part of the program the corresponding value labels and format statements so that the different categories or groups are labeled appropriately.
Note that one of the steps in this program is to select only those eighth grade students who have non-missing data in the variable of interest BSBGBOOK.
In general, to perform student-level analyses involving plausible values and using the Student Background data files, you should do the following:
• Identify the variables of interest in the Student Background file and note any specific national adaptations to the variables.
• Retrieve the relevant variables from the Student Background files, including the achievement scores, sampling weights, the JRR replication information, and any other variables used in the selection of cases.
• Use the macro JACKPV with the appropriate arguments and parameters.
• Print out the results file.

TIMSS 2003 International Database User Guide4-42
Exhibit 4.12 SPSS Control Statements for Performing Student-Level Analyses with Plausible Values (EXAMPLE2.SPS)
get file = "D:\TIMSS2003\Data\SPSS_Data\BSGALLM3.SAV".
select if not(missing(BSBGBOOK)).
value labels BSBGBOOK 1 "None or very few (0-10)" 2 "For 1 shelf (11-25)" 3 "For 1 bookcase (26-100)" 4 "For 2 bookcases (101-200)" 5 "For 3 or more bookcases (>200)" /IDCNTRY 51 'ARMENIA' 36 'AUSTRALIA' 956 'BELGIUM FLEMISH' 100 'BULGARIA' 48 'BAHRAIN' 72 'BOTSWANA' 9132 'CANADA ONTARIO' 9133 'CANADA QUEBEC' 152 'CHILE' 196 'CYPRUS' 818 'EGYPT' 926 'ENGLAND'3724 'BASQUE' 233 'ESTONIA' 288 'GHANA' 344 'HONG KONG' 348 'HUNGARY' 360 'INDONESIA' 364 'IRAN' 376 'ISRAEL' 380 'ITALY' 400 'JORDAN' 392 'JAPAN' 410 'KOREA' 422 'LEBANON' 440 'LITHUANIA' 428 'LATVIA' 504 'MOROCCO' 498 'MOLDOVA' 807 'MACEDONIA' 458 'MALAYSIA' 528 'NETHERLANDS' 578 'NORWAY' 554 'NEW ZEALAND' 275 'PALESTINE' 608 'PHILIPPINES' 642 'ROMANIA' 643 'RUSSIAN FEDERATION' 682 'SAUDI ARABIA' 927 'SCOTLAND' 702 'SINGAPORE' 703 'SLOVAK REPUBLIC' 705 'SLOVENIA' 752 'SWEDEN' 760 'SYRIA' 788 'TUNISIA' 158 'CHINESE TAIPEI' 840 'UNITED STATES' 887 'YEMEN' 891 'SERBIA AND MONTENEGRO' 710 'SOUTH AFRICA' 11800 'INDIANA US' .
save outfile = STUDENT2 .
include "D:\TIMSS2003\Programs\SPSS_Programs\jackpv.sps" .
jackpv infile = STUDENT2 / cvar = IDCNTRY BSBGBOOK / rootpv = BSSSCI0 / npv = 5 / jkz = JKZONE / jkr = JKREP / njkz = 75 / wgt = TOTWGT .
sort cases by IDCNTRY.
* Print the results .print formats n (f6.0) TOTWGT (f10.0) mnpv mnpv_se pct pct_se (f6.2).
report format = list automatic / var = BSBGBOOK (label) n TOTWGT mnpv mnpv_se pct pct_se / break = IDCNTRY (label) .

TIMSS 2003 International Database User Guide 4-43
Exhibit 4.13 Extract of SPSS Computer Output for Performing Student-Level Analyses with Plausible Values (EXAMPLE 2)
GEN\NR OF BOOKS *COUNTRY ID* IN YOUR HOME N TOTWGT MNPV MNPV_SE PCT PCT_SE______________ __________________ ______ __________ ______ _______ ______ ______ ARMENIA None or very few (0-10) 798 8025 433.20 5.17 15.14 .94 For 1 shelf (11-25) 1246 12595 453.07 4.75 23.77 .87 For 1 bookcase (26-100) 1621 14899 467.14 3.59 28.12 .71 For 2 bookcases (101-200) 781 7047 474.69 4.21 13.30 .64 For 3 or more bookcases (>200) 1112 10426 478.40 5.06 19.67 1.00
AUSTRALIA None or very few (0-10) 248 13527 463.86 8.67 5.38 .50 For 1 shelf (11-25) 477 27603 493.11 5.77 10.98 .77 For 1 bookcase (26-100) 1369 74730 516.78 4.82 29.72 .96 For 2 bookcases (101-200) 1104 57620 540.00 3.38 22.92 .82 For 3 or more bookcases (>200) 1465 77934 553.16 4.09 31.00 1.38
.
.
.
NORWAY None or very few (0-10) 247 3959 441.31 7.04 6.59 .41 For 1 shelf (11-25) 453 6815 462.59 4.58 11.35 .60 For 1 bookcase (26-100) 1307 19661 492.55 3.05 32.74 .86 For 2 bookcases (101-200) 902 13223 504.34 2.80 22.02 .69 For 3 or more bookcases (>200) 1144 16393 514.52 2.63 27.30 1.15
UNITED STATES None or very few (0-10) 1157 436292 468.96 4.62 12.82 .58 For 1 shelf (11-25) 1619 623310 493.21 3.28 18.32 .59 For 1 bookcase (26-100) 2441 936415 526.81 2.90 27.52 .62 For 2 bookcases (101-200) 1573 603150 552.40 3.41 17.73 .50 For 3 or more bookcases (>200) 2010 803597 568.95 3.65 23.62 .90
In this example, each country’s eighth grade mean science achievement is reported for each response category in the variable BSBGBOOK. The results are presented by country and each value of the variable BSBGBOOK. The countries and the five response options are presented in the first and second columns. The third column reports the number of valid cases. The fourth column reports the sum of weights of these students, followed by the mean science achievement based on the five plausible values and its respective standard error. The last two columns report the weighted percentages of students within each category and their respective standard errors.
From the first few lines in Exhibit 4.13, we can say that in Armenia the 1,112 students (19.67%) who reported having more than 200 books have a mean science achievement of 478.40 with a standard error of 5.06; while the 798 students (15.14%) who reported having none or very few books (0-10) have a mean science achievement of 433.20 with a standard error of 5.17.

TIMSS 2003 International Database User Guide4-44
4.8 Performing Analyses with Teacher-Level Variables
The TIMSS 2003 teachers do not constitute representative samples of teachers. Rather, they are the teachers for nationally representative samples of students. Therefore, it is appropriate that statements about the teachers be made only in terms of how many students are taught by teachers of one kind or another, and not in terms of how many teachers in a country have one attribute or another.
When analyzing teacher data, it is first necessary to link the students with their respective teachers. Each eighth grade student record in the Student Background file can link to as many as six different teachers in the Teacher Background file. There are usually fewer student-teacher links at the fourth grade. To facilitate the linking between students and their teachers, the Student-Teacher Linkage file was created and is part of the International Database. This file is called BST<COUNTRY>M3 for the eighth grade and AST<COUNTRY>M3 for the fourth grade. The Student-Teacher Linkage file contains one record for each student-teacher combination, with the appropriate identification variables.
Each record in the Student-Teacher Linkage file also contains the number of mathematics and science teachers for the student and a set of weights that can be used when conducting analyses with these data. Student achievement plausible values, sampling weights, and JRR replication information have been added to the Student-Teacher Linkage file in order to simplify the merging process for analyses that link teacher variables to student achievement. For such analyses, it is necessary to merge only the Teacher Background file with the Student-Teacher Linkage file. For analyses linking teacher variables to other student variables, it is also necessary to merge the Student Background file with the Teacher Background file after it has been combined with the Student-Teacher Linkage file.
Conducting analyses with teacher data requires some extra steps. As our third example, we will investigate the age of the science teachers who teach the eighth grade students in each of the TIMSS countries. In particular, we will investigate the percentage of eighth grade students who are taught by teachers from specified age groups (BTBGAGE), and the mean science achievement of these students taught by those teachers. The results are found in the Science Teacher Background Data Almanac (BSALM7_M3) for questionnaire item TQS2-1, as shown in Exhibits 4.14 and 4.15. The percentages also appear in Exhibit 6.3 of the TIMSS 2003 International Science Report.
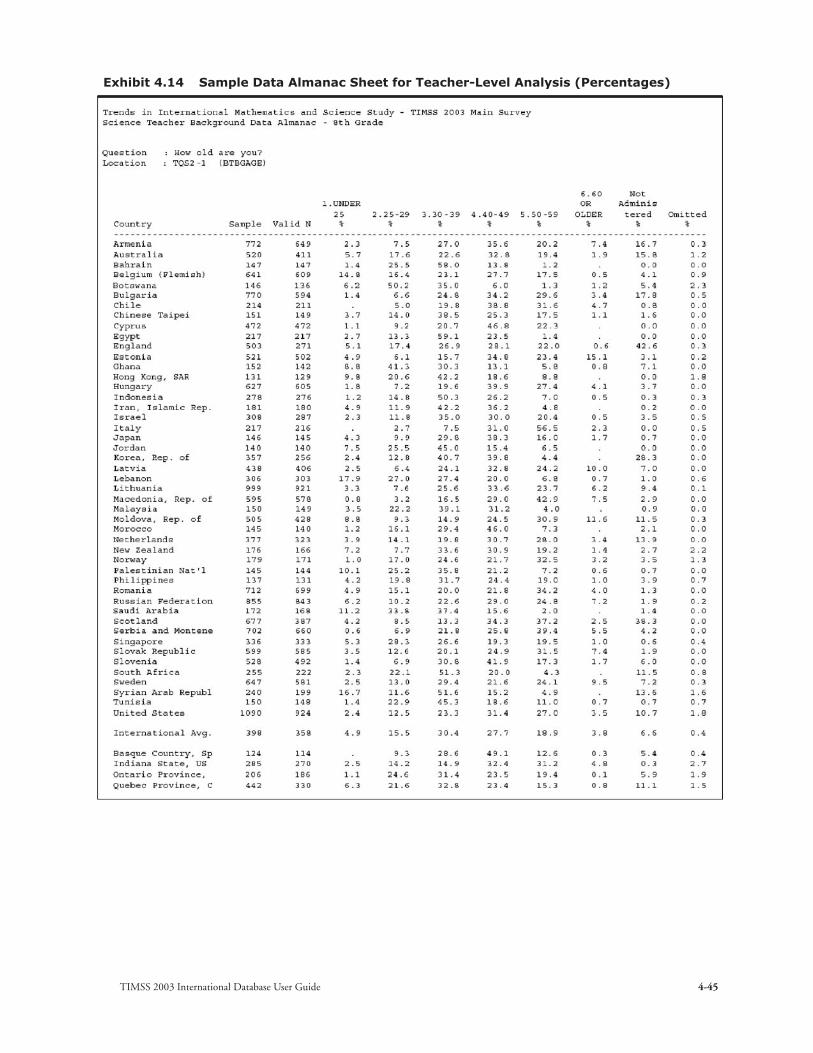
TIMSS 2003 International Database User Guide 4-45
Exhibit 4.14 Sample Data Almanac Sheet for Teacher-Level Analysis (Percentages)

TIMSS 2003 International Database User Guide4-46
Exhibit 4.15 Sample Data Almanac Sheet for Teacher-Level Analysis (Means)

TIMSS 2003 International Database User Guide 4-47
As before, we first proceed to identify the variables relevant to the analysis in the appropriate files, and review the documentation on any specific national adaptations to the questions of interest (Supplements 1 and 2). Since we are using teacher-level variables, we need to look in the teacher file and the Student-Teacher Linkage file to find the variables. From the teacher file, we will need the variable that contains the information on the science teachers’ age (BTBGAGE), the variable that identifies the country (IDCNTRY), and the two variables that will allow us to link the teacher information to the student data (IDTEACH and IDLINK).
For the eighth grade, there is one teacher file for the mathematics teachers and a second teacher file for the science teachers. If you want to look only at mathematics teachers, then you will need to use the mathematics teacher file (BTM<COUNTRY>M3); if your interest is in the science teachers then you will need to use the science teacher file (BTS<COUNTRY>M3); but if your interest is in the mathematics and science teachers combined, both these files need to be combined by adding one file to the other. In doing so, it is important to keep in mind that although there are variables in common between these two files, most of them are not.
In our example, our teacher variable of interest (BTBGAGE) is a categorical variable with six categories. However, we want to categorize the teachers into four groups: less than 30 years old, 30-39 years old, 40-49 years old, and 50 years or older. When reading the teacher file, we will use SPSS commands to collapse the six values into four categories and label them accordingly. We then proceed to read the necessary information from the Student-Teacher Linkage file. From this file we need the country identification (IDCNTRY) and the two variables that will allow us to link the student information to the teacher data (IDTEACH and IDLINK). We also need the science achievement plausible values (BSSSCI01-BSSSCI05), and the jackknife replication information (JKZONE and JKREP). We need to use the weight variable appropriate for science teacher variables (SCIWGT). If you are investigating the mathematics teachers, then the weight variable MATWGT should be used; if you are interested in analyzing mathematics and science teachers combined, the weight variable TCHWGT should be used.
The two files are merged into one file that will then be used with the JACKPV macro. These two files are merged using the variables IDCNTRY, IDTEACH, and IDLINK. The combination of values for these three variables is unique within the teacher data, but is repeated in the Student-Teacher Linkage file as many times as the specific teacher teaches students in a class. After the files are merged, the macro JACKPV is used and the results can be printed.
In this analysis, we will again use the eighth grade data for all available countries, although the exact same steps need to be taken if you want to examine these variables within a single country, or for a select group of countries. We used

TIMSS 2003 International Database User Guide4-48
the JOIN program, described earlier in this chapter, to join the Science Teacher Background files for all available countries into a single Science Teacher Background file called BTSALLM3. The JOIN program was used a second time to join all the Student-Teacher Linkage files into a single one called BSTALLM3.
The SPSS program code for this example is presented in Exhibit 4.16 and is included on the DVD under the name EXAMPLE3.SPS. Selected results obtained from this program are displayed in Exhibit 4.17. In this program, the variable TCHAGE is created by collapsing the categorical variable BTBGAGE into only four categories.
Note that one of the steps in this program is to select only those science teachers who have non-missing data in the variable of interest TCHAGE.
In general, to perform teacher-level analyses using the Teacher Background data files, you should do the following:
• Identify the variables of interest in the appropriate Teacher Background files and note any specific national adaptations to the variables.
• Retrieve the relevant variables from the Teacher Background files. If you are investigating mathematics and science teachers combined, then the files for these teachers need to be added to each other.
• Retrieve the relevant variables from the Student-Teacher Linkage files. This includes the country and teacher identification information (IDCNTRY, IDTEACH, and IDLINK), the achievement scores, the JRR replication information, and the appropriate sampling weights. If the analysis is to be based on mathematics teachers only, then the weight variable to use is MATWGT. If the analysis is to be based on the science teachers only, then the weight variable to be used is SCIWGT. If the analysis is to be based on the science and mathematics teachers combined, then the weight variable to be used is TCHWGT.
• Merge the Teacher Background files with the Student-Teacher Linkage files using the variables IDCNTRY, IDTEACH and IDLINK.
• Use the macro JACKGEN, or JACKPV if plausible values are involved, with the appropriate arguments and parameters.
• Print out the results file.

TIMSS 2003 International Database User Guide 4-49
Exhibit 4.16 SPSS Control Statement for Performing Teacher-Level Analysis (EXAMPLE3.SPS)
get file = "D:\TIMSS2003\Data\SPSS_Data\BTSALLM3.SAV".recode BTBGAGE (1,2=1) (3=2) (4=3) (5,6=4) (else=sysmis) into TCHAGE .sort cases by IDCNTRY IDTEACH IDLINK .save outfile = TEACHER .
get file = "D:\TIMSS2003\Data\SPSS_Data\BSTALLM3.SAV".select if SCIWGT > 0 .sort cases by IDCNTRY IDTEACH IDLINK.save outfile= STDTCH.
match files / file=STDTCH / table=TEACHER / by IDCNTRY IDTEACH IDLINK.
select if not(missing(TCHAGE)).
value labels TCHAGE 1 "Less than 30 years old" 2 "30-39 years old" 3 "40-49 years old" 4 "50 years or older" /IDCNTRY 51 'ARMENIA' 36 'AUSTRALIA' 956 'BELGIUM FLEMISH' 100 'BULGARIA' 48 'BAHRAIN' 72 'BOTSWANA' 9132 'CANADA ONTARIO' 9133 'CANADA QUEBEC' 152 'CHILE' 196 'CYPRUS' 818 'EGYPT' 926 'ENGLAND' 3724 'BASQUE' 233 'ESTONIA' 288 'GHANA' 344 'HONG KONG' 348 'HUNGARY' 360 'INDONESIA' 364 'IRAN' 376 'ISRAEL' 380 'ITALY' 400 'JORDAN' 392 'JAPAN' 410 'KOREA' 422 'LEBANON' 440 'LITHUANIA' 428 'LATVIA' 504 'MOROCCO' 498 'MOLDOVA' 807 'MACEDONIA' 458 'MALAYSIA' 528 'NETHERLANDS' 578 'NORWAY' 554 'NEW ZEALAND' 275 'PALESTINE' 608 'PHILIPPINES' 642 'ROMANIA' 643 'RUSSIAN FEDERATION' 682 'SAUDI ARABIA' 927 'SCOTLAND' 702 'SINGAPORE' 703 'SLOVAK REPUBLIC' 705 'SLOVENIA' 752 'SWEDEN' 760 'SYRIA' 788 'TUNISIA' 158 'CHINESE TAIPEI' 840 'UNITED STATES' 887 'YEMEN' 891 'SERBIA AND MONTENEGRO' 710 'SOUTH AFRICA' 11800 'INDIANA US' .
save outfile = MERGED3 .
include "D:\TIMSS2003\Programs\SPSS_Programs\jackpv.sps" .
jackpv infile = MERGED3 / cvar = IDCNTRY TCHAGE / rootpv = BSSSCI0 / npv = 5 / jkz = JKZONE / jkr = JKREP / njkz = 75 / wgt = SCIWGT .
sort cases by IDCNTRY .
* Print the results .print formats n (f6.0) SCIWGT (f10.0) mnpv mnpv_se pct pct_se (F6.2) .
report format = list automatic / var = TCHAGE (label) n SCIWGT mnpv mnpv_se pct pct_se / break = IDCNTRY (label) .

TIMSS 2003 International Database User Guide4-50
Exhibit 4.17 Extract of SPSS Computer Output for Performing Teacher-Level Analysis (EXAMPLE 3)
*COUNTRY ID* TCHAGE N TOTWGT MNPV MNPV_SE PCT PCT_SE______________ __________________ ______ __________ ______ _______ ______ ______ ARMENIA Less than 30 years old 1778 4392 467.22 7.48 9.78 1.45 30 – 39 years old 5162 12146 458.93 5.20 27.04 2.02 40 – 49 years old 6475 16006 466.90 4.12 35.64 2.26 50 years or older 5174 12369 460.08 4.29 27.54 1.74
AUSTRALIA Less than 30 years old 1035 49869 515.66 7.05 23.34 3.25 30 – 39 years old 1110 48223 527.35 5.88 22.57 2.52 40 – 49 years old 1309 70160 537.52 6.81 32.84 3.77 50 years or older 866 45374 520.17 8.89 21.24 3.21
.
.
.
NORWAY Less than 30 years old 726 10478 498.21 5.74 17.96 3.26 30 – 39 years old 1030 14363 484.85 5.26 24.62 3.35 40 – 49 years old 856 12658 498.10 5.33 21.70 3.32 50 years or older 1337 20832 494.52 3.21 35.71 4.36
UNITED STATES Less than 30 years old 1090 448839 530.54 6.15 14.88 2.28 30 – 39 years old 1932 702160 520.86 6.74 23.29 2.44 40 – 49 years old 2375 945533 536.32 5.75 31.36 3.14 50 years or older 2378 918958 535.40 6.17 30.47 2.92
In this example, each country’s eighth grade mean science achievement is reported for each response category in the variable TCHAGE. The results are presented by country and each value of the variable TCHAGE. The countries and the four age groups are presented in the first and the second columns. The third column reports the number of valid cases. The fourth column reports the sum of weights of these students, followed by the mean science achievement based on the five plausible values and its respective standard error. The last two columns report the weighted percentages of students within each teacher age group and their respective standard errors.
From the first few lines of Exhibit 4.14, we can say that in Armenia the 1,778 students (9.78%) with teachers less than 30 years old have a mean science achievement of 467.22 with a standard error of 7.48; while the 5,174 students (27.54%) with teachers 50 years or older have a mean science achievement of 460.08 with a standard error of 4.29.
TIMSS 2003 International Database User Guide 4-51
4.9 Performing Analyses with School-Level Variables
TIMSS 2003 has representative samples of schools and so it is possible to compute weighted numbers of schools with particular characteristics for providing reasonable estimates of percentages and averages across primary or middle schools in each country. However, the school samples were designed to optimize the student samples and the student-level estimates. For this reason, it is preferable to analyze school-level variables as attributes of students, rather than as elements in their own right. The following example describes school-level analyses based on student-weighted data.
For student-weighted analyses, the school-level data are analyzed to make statements about the number of students attending schools with one characteristic or another, rather than the number of schools with one characteristic or another. When school-level variables are analyzed, we recommend that you merge the selected school-level variables with the student-level file, and then use the sampling and weight information contained in the student-level file to make the desired statements. The example presented in this section describes how this can be accomplished using SPSS.
As our fourth example, we wish to investigate the percentage of eighth grade students who attend schools in areas of different population sizes (BCBGCOMU), and their mean science achievement. The results are found in the School Background Data Almanac by Science Achievement (BSALM4_M3) for questionnaire item SCQ2-3, as shown in Exhibits 4.18 and 4.19.

TIMSS 2003 International Database User Guide4-52
Exhibit 4.18 Sample Data Almanac Sheet for School-Level Analysis (Percentages)

TIMSS 2003 International Database User Guide 4-53
Exhibit 4.19 Sample Data Almanac Sheet for School-Level Analysis (Means)

The first step in our analysis is to identify the variables of interest in the appropriate files and review the documentation on specific national adaptations to the questions of interest (Supplements 1 and 2). We observe that the variable BCBGCOMU in the School Background file contains information on the size of the community where the schools are located. Our next step is to review the documentation of national adaptations to the questionnaires to ensure that there were no deviations listed for this variable (see Supplement 2). If no adaptations were made, we can continue with our analysis without any modifications.
We then read from the School Background file the variables relevant to our analysis. In this case, we will need our variable of interest (BCBGCOMU) and the country and school identification information (IDCNTRY and IDSCHOOL). These last two variables will allow us to merge the school data to the student data. We then read the variables of interest from the Student Background file. We will need the country and school identification information (IDCNTRY and IDSCHOOL), which will allow us to merge the student data to the school data. We will also need the international science achievement plausible values (BSSSCI01-BSSSCI05), the student sampling weight (TOTWGT), and the variables that contain the jackknife replication information (JKZONE and JKREP).
We then proceed to merge the school information with the student information using the variables IDCNTRY and IDSCHOOL, and then use the macro JACKPV to obtain the percentages of students and their mean science achievement scores within each category of the variable BCBGCOMU by country.
In this analysis, we will again use the data for all available countries, although the exact same steps need to be taken if you want to examine these variables within a single country, or for a select group of countries. We used the JOIN program, described earlier in this chapter, to join the School Background files for all available countries into a single School Background file called BCGALLM3. The JOIN program was used a second time to join all the Student Background files into a single one called BSGALLM3.
The SPSS program code for this example is presented in Exhibit 4.20 and is included on the DVD under the name EXAMPLE4.SPS. Selected results obtained from this program are displayed in Exhibit 4.21.
Note that one of the steps in this program is to select only those eighth grade students who have non-missing data in the variable of interest BCBGCOMU.
TIMSS 2003 International Database User Guide4-54

In general, to perform student-weighted school-level analyses using the School Background files, you should do the following:
• Identify the variables of interest in the School Background file and note any specific national adaptations to the variables.
• Retrieve the relevant variables from the School Background file.
• Retrieve the relevant variables from the Student Background file, including the achievement scores, sampling weights, JRR replication information, and any other variables used in the selection of cases.
• Merge the School Background files with the Student Background files using the variables IDCNTRY and IDSCHOOL.
• Use the macro JACKGEN, or JACKPV if plausible values are involved, with the appropriate arguments and parameters.
• Print out the results file.
TIMSS 2003 International Database User Guide 4-55

Exhibit 4.20 SPSS Control Statements for Performing Student-Weighted Analyses with School-Level Variables (EXAMPLE4.SPS)
get file = "D:\TIMSS2003\Data\SPSS_Data\BCGALLM3.SAV".sort cases by IDCNTRY IDSCHOOL .save outfile = SCHOOL .
get file = "D:\TIMSS2003\Data\SPSS_Data\BSGALLM3.SAV".sort cases by IDCNTRY IDSCHOOL.save outfile = STUDENT .
match files / file= STUDENT / table= SCHOOL / by IDCNTRY IDSCHOOL.
select if not(missing(BCBGCOMU)).
value labels BCBGCOMU 1 'More than 500000 people' 2 '100001 to 500000 people' 3 '50001 to 100000 people' 4 '15001 to 50000 people' 5 '3001 to 15000 people' 6 'Fewer than 3000 people'/IDCNTRY 51 'ARMENIA' 36 'AUSTRALIA' 956 'BELGIUM FLEMISH' 100 'BULGARIA' 48 'BAHRAIN' 72 'BOTSWANA' 9132 'CANADA ONTARIO' 9133 'CANADA QUEBEC' 152 'CHILE' 196 'CYPRUS' 818 'EGYPT' 926 'ENGLAND' 3724 'BASQUE' 233 'ESTONIA' 288 'GHANA' 344 'HONG KONG' 348 'HUNGARY' 360 'INDONESIA' 364 'IRAN' 376 'ISRAEL' 380 'ITALY' 400 'JORDAN' 392 'JAPAN' 410 'KOREA' 422 'LEBANON' 440 'LITHUANIA' 428 'LATVIA' 504 'MOROCCO' 498 'MOLDOVA' 807 'MACEDONIA' 458 'MALAYSIA' 528 'NETHERLANDS' 578 'NORWAY' 554 'NEW ZEALAND' 275 'PALESTINE' 608 'PHILIPPINES' 642 'ROMANIA' 643 'RUSSIAN FEDERATION' 682 'SAUDI ARABIA' 927 'SCOTLAND' 702 'SINGAPORE' 703 'SLOVAK REPUBLIC' 705 'SLOVENIA' 752 'SWEDEN' 760 'SYRIA' 788 'TUNISIA' 158 'CHINESE TAIPEI' 840 'UNITED STATES' 887 'YEMEN' 891 'SERBIA AND MONTENEGRO' 710 'SOUTH AFRICA' 11800 'INDIANA US' .
save outfile = MERGED4 .
include "D:\TIMSS2003\Programs\SPSS_Programs\jackpv.sps" .
jackpv infile = MERGED4 / cvar = IDCNTRY BCBGCOMU / rootpv = BSSSCI0 / npv = 5 / jkz = JKZONE / jkr = JKREP / njkz = 75 / wgt = TOTWGT .
* Sort the results .sort cases by IDCNTRY BCBGCOMU .
* Print the results .print formats n (f6.0) TOTWGT (f10.0) mnpv mnpv_se pct pct_se (F6.2) .
report format = list automatic / var = BCBGCOMU (label) n TOTWGT mnpv mnpv_se pct pct_se / break = IDCNTRY (label) .
TIMSS 2003 International Database User Guide4-56

Exhibit 4.21 Extract of SPSS Computer Output for Performing Student-Weighted Analyses with School-Level Variables (EXAMPLE 4)
*COUNTRY ID* GEN\TYPE OF COMMUNITY N TOTWGT MNPV MNPV_SE PCT PCT_SE______________ __________________ ______ __________ ______ _______ ______ ______ ARMENIA More than 500000 people 844 7404 474.60 5.67 16.90 2.78 100001 to 500000 people 489 3555 473.32 9.05 8.12 2.14 50001 to 100000 people 292 2035 484.47 15.59 4.65 1.92 15001 to 50000 people 754 7337 468.27 6.76 16.75 3.78 3001 to 15000 people 1716 14000 455.38 6.85 31.96 4.32 Fewer than 3000 people 713 9473 435.57 7.09 21.63 3.44
AUSTRALIA More than 500000 people 1366 80685 532.32 7.22 35.24 4.09 100001 to 500000 people 842 38918 529.37 10.95 17.00 3.70 50001 to 100000 people 548 28317 525.72 14.80 12.37 2.86 15001 to 50000 people 705 37412 526.70 12.25 16.34 2.77 3001 to 15000 people 559 35212 527.09 7.61 15.38 3.23 Fewer than 3000 people 270 8385 511.89 4.77 3.66 1.36
.
.
.
NORWAY More than 500000 people 281 3434 503.55 12.52 5.76 2.06 100001 to 500000 people 725 7815 494.87 6.06 13.10 2.81 50001 to 100000 people 402 4495 505.44 8.18 7.54 2.44 15001 to 50000 people 1295 19015 491.00 3.20 31.88 4.06 3001 to 15000 people 1206 21713 492.75 4.16 36.40 3.79 Fewer than 3000 people 108 3175 502.48 7.10 5.32 2.27
UNITED STATES More than 500000 people 951 340114 523.04 11.63 11.35 2.05 100001 to 500000 people 1053 396476 505.56 8.98 13.24 2.33 50001 to 100000 people 1041 369343 538.39 8.96 12.33 2.33 15001 to 50000 people 2274 936639 536.72 6.05 31.27 3.71 3001 to 15000 people 1659 626613 532.89 8.02 20.92 3.06 Fewer than 3000 people 701 326297 541.76 7.43 10.89 2.09
In this example, each country’s eighth grade mean science achievement is reported for each response category in the variable BCBGCOMU. The results are presented by country and each value of the variable BCBGCOMU. The countries and the six community types are presented in the first and the second columns. The third column reports the number of valid cases. The fourth column reports the sum of weights of these students, followed by the mean science achievement based on the five plausible values, and its respective standard error. The last two columns report the weighted percentages of students within each category and their respective standard errors.
From the first few lines of Exhibit 4.21, we can say that in Armenia 844 students (16.9%), who represent 7,404 students in the population, responded that they live in a city of more than 500,000 people. These students have a mean science achievement of 474.60 with a standard error of 5.67.
TIMSS 2003 International Database User Guide 4-57


TIMSS 2003 International Database User Guide 5-1
5 Performing Analyses with the TIMSS Data Using SAS
5.1 Overview
This chapter presents some basic examples of analyses that can be performed with the TIMSS 2003 International Database using the sampling weights and achievement scores discussed in previous chapters. It also describes the SAS programs used to conduct such analyses, and their results. The analyses presented here are simple in nature, and are designed primarily to familiarize you with the different files and their structure, as well as the relevant variables that need to be included in most analyses. The programs compute the percent of students in specified subgroups, the mean mathematics or science achievement in those groups, and the proper standard errors for the percent and mean statistics. Additionally, some examples of linear regression analyses are presented. All of these analyses, based on student, teacher and school data, replicate analyses that are included in the TIMSS 2003 Science International Report. You are invited to compare the results from these analyses to the Exhibits in the reports, and are encouraged to practice analyzing the TIMSS data by trying to replicate the Exhibits that are presented in the international reports.1
In our examples, we use macros written for SAS that can be used to perform any of the analyses that are described below. These are general procedures that can be used for many purposes, provided you have some basic knowledge of the SAS macro language. If you have some programming experience in this statistical package, then you will be able to make the necessary modifications to the macros to obtain the desired results.
5.2 Contents of the TIMSS 2003 Database DVD
The DVD that accompanies this User Guide contains the TIMSS 2003 data. It has the following internal file structure:
• A main directory identifying the study (TIMSS2003).
• Within the main directory, there are eight sub-directories.
1 Documentation regarding the computational methods used to obtain any derived variables included in the international reports is presented in Supplement 3

TIMSS 2003 International Database User Guide5-2
DATA: Contains data files in SPSS, SAS and ASCII formats
PROGRAMS: Contains SPSS and SAS programs
CODEBOOKS: Contains codebook files
ALMANACS: Contains data almanacs
TCMA: Contains Test–Curriculum Matching Analysis Data
ITEMS: Contains the Item Information files
CURRICULUM: Contains the Curriculum Questionnaire data
REPORTS : Contains all international reports, this User Guide and its supplements.
The directory names on the DVD and the file names generally follow the DOS naming convention: file names with up to eight characters, followed by a three-character extension (as in FILENAME.EXT). Files with the same names are complementary to each other, and the extension identifies their function or type. The extensions used in the files contained on the DVD are the following.
.SAS SAS Control file or program
.SPS SPSS Control file or program
.RAW ASCII Data file
.SAV SPSS System file
.EXP SAS Export file
.LST Almanac in ASCII format
.DOC Almanac in MS Word format
.PDF Almanac in PDF format
.CDT Codebook in Printout format
.SDB Codebook in Dbase format
.CSV Test Curriculum Matching Analysis file
.XLS Curriculum Questionnaire data and Item Information files in Excel format.
The DATA sub-directory contains the TIMSS data files in ASCII, SAS and SPSS formats. The data files that are in this directory are described in Chapter 3 of this guide. Each file type has two corresponding control files in the PROGRAMS sub-directory. One of these reads the ASCII data file and creates a SAS data file, the other reads the ASCII data file and creates an SPSS system file. This chapter will focus on the files that can be used with SAS.

TIMSS 2003 International Database User Guide 5-3
The following programs can also be found in the PROGRAMS sub-directory:
ASASCRM3.SAS and BSASCRM3.SAS
These files contain SAS programs that can be used to convert the response codes to the cognitive items to their corresponding correctness score levels. The use of these programs is described in this chapter.
CONVERT.SAS
This SAS program converts the SAS Export files found on the DVD into SAS data files. All programs and macros described in this chapter require that the SAS Export files be converted into SAS data files. The use of this program is described in this chapter.
JOIN.SAS
This SAS program combines files of the same type from more than one country. The use of this program is described in this chapter.
JACKGEN.SAS
This macro program in SAS can be used to compute weighted percentages of students within defined groups, and their means on a specified continuous variable. This macro also generates replicate weights and computes jackknife repeated replication (JRR) standard errors for the percentages and mean estimates. The analysis variable can be any continuous variable. The use of this macro programs is described later in this chapter. When computing mean achievement scores based on plausible values, you will need to use the macro JACKPV.SSS.
JACKPV.SAS
This macro program in SAS can be used to compute weighted percentages of students within defined groups, and their mean achievement scores using the available plausible values. This macro also generates replicate weights and computes the JRR standard errors for the percentages and mean achievement scores. This macro should be used when multiple plausible values are used in the analysis.

TIMSS 2003 International Database User Guide5-4
JACKREG.SAS
This macro program in SAS can be used to compute weighted regression coefficients and their standard errors within defined groups. It also computes descriptive statistics on the variables. This macro can be used with any analysis variable, but it does not make use of the five plausible values.
JACKREGP.SAS
This macro program in SAS can be used to compute weighted regression coefficients and their standard errors within defined groups when using plausible values as the achievement scores. It also computes descriptive statistics on the variables.
Each of the four macros above has a corresponding sample program that calls the respective macros and prints out the results. These are discussed later in this chapter.
EXAMPLE1.SAS, EXAMPLE2.SAS, EXAMPLE3.SAS, EXAMPLE4.SAS
These are the programs used in the examples presented later in this chapter.
5.3 Creating SAS Data Files
The DVD contains SAS control code to read each one of the ASCII data files and create SAS data files. Each of these control files contains information on the location of each variable in the file, its format, a descriptive label for each variable and its categories (in the case of categorical variables), and code for handling missing data. The control files have been created to facilitate access to the data on a country by country basis. They should be used to create SAS data files directly if the SAS export files provided on the DVD are not compatible for a specific computer platform or configuration.
The command lines in the control files should be edited to produce programs that will create SAS data files for any specified countries. While most of the program code is functional as provided, you will need to edit input and output directories and the list of desired countries. Performing analyses that require data from more than one country will necessitate adding or appending the respective data files into a larger one. These control files will create separate files for each desired country. These individual country files can then be joined into a single data file using the JOIN program described later in this chapter.
Alternatively, you can access the data and compute the necessary statistics on a country by country basis, reading one file at a time and moving on to the

TIMSS 2003 International Database User Guide 5-5
next country’s data. The method you choose will depend greatly on the storage and processing capacity of the computer system you use. For the examples presented in this User Guide, we have combined the data files of individual countries into one large data file that contains all the data for all participating countries. The three-character country identifier for this file is “ALL”.
When creating a SAS data file of a specific type, you should do the following:
1. Open the SAS control file for the appropriate file type, for example BSGTMSM3.SAS .
2. In the line that reads “%LET CTY = …”, you should enter the three-character identification code for each country whose data you want to create. If you leave this line unedited, the data for all countries listed will be created.
3. In the line that reads “LIBNAME libdat…”, you should enter the path where you want to store the SAS data files that you will be creating.
4. In the line that reads “FILENAME rawinp…”, you should enter the path where the raw data are located.
5. Submit the code for processing. After processing is complete, you will find the SAS data files in the location you specified in step 3.
In the extract presented in exhibit 5.1, the Student Background data for Australia, Belgium (Flemish), Bulgaria, England and the United States will be read from the directory “D:\ TIMSS2003\DATA\Raw_Data\”. Separate SAS data files will be stored in the directory “D:\TIMSS2003\DATA\SAS_Data\” under the name BSG<country>M3. Only the sections that need to be modified are presented in this exhibit.

TIMSS 2003 International Database User Guide5-6
Exhibit 5.1 Extract from SAS Control Code for Creating Student Background SAS Data files
%let cty = AUS BFL BGR ENG USA ;
*library where the SAS data files are written to;
LIBNAME libdat “D:\TIMSS2003\Data\SAS_Data” ;
%macro doit; %let i = 1; %do %while(%length(%scan(&cty,&i))); %let ccode = %lowcase(%scan(&cty,&i));
%let fname= BSG&ccode.m3;
*NOTE: file-specification of the input raw-data file ;
FILENAME rawinp “D:\TIMSS2003\Data\RAW_Data\&fname..RAW” ;
%PUT INFO: data set definition ;%PUT INFO: data set definitions have to be modified ;
*Output data set ;data libdat.&fname;
.
.
.
RUN ;
%let i = %eval(&i + 1);%end;
%mend doit;
%doit;
5.4 Scoring the Items
There were several types of items administered as part of the TIMSS tests. There were multiple-choice items, in which the student was asked to select one of four or five options as the correct response. The responses to these items are coded with one digit. The codes used to represent the responses to these items are as follows.
Code 1 Option A
Code 2 Option B
Code 3 Option C
Code 4 Option D
Code 5 Option E
Code 6 Not reached
Code 7 Invalid response (chose more than one of the options available)

TIMSS 2003 International Database User Guide 5-7
Code 8 Not administered
Code 9 No response although the item was administered and was reached (i.e. item was omitted)
There were also constructed-response items where the students were asked to construct a response to a question, rather than choosing an answer from a list of options. The answers to these questions were scored by scorers trained to use the two-digit scoring rubrics described in chapter 2 of this guide. The first digit of the two-digit code indicates the score given to the question, and the second digit in conjunction with the first provides diagnostic information on the specific answer given by the student. The codes used to represent the responses to these items are the following:
Codes 30 to 39 Three-point answer. Second digit provides diagnostic information
Codes 20 to 29 Two-point answer. Second digit provides diagnostic information
Codes 10 to 19 One-point answer. Second digit provides diagnostic information
Codes 70 to 79 Zero-point answer. Second digit provides diagnostic information
Code 96 Not reached
Code 98 Not administered
The achievement data files contained on the DVD include information on the answers given to each item administered to a student. You might want to work with these item data after they are recoded to the right-wrong format, in the case of multiple-choice items, or to the level of correctness in the case of the constructed-response items. For this purpose, we have included on the DVD two SAS programs, one for each population, which will allow you to recode the items from the achievement test to their right-wrong or correctness-level format. These programs contain a macro called SCOREIT and the necessary call to this macro so that all the items in the specified file are scored. This program will convert the response option codes for multiple-choice items to dichotomous score levels (0 or 1) based on scoring keys. For the constructed-response items the two-digit codes will be converted to the corresponding correctness score level (3, 2, 1, 0) based on the value of the first digit, as described in Chapter 2.
Two files are included to provide control code to perform the recodes of the test items in the achievement test file:
ASASCRM3 TIMSS 2003 Fourth Grade Achievement files
BSASCRM3 TIMSS 2003 Eighth Grade Achievement files

TIMSS 2003 International Database User Guide5-8
When using these programs, you must first consider the recoding scheme that is desired. For example, under certain circumstances you might want to recode the not reached responses as incorrect (codes 6 and 96), whereas under other circumstances you might want to recode these responses as not administered or invalid. In the case of TIMSS, not reached responses were recoded as not administered (and effectively as missing responses) for the purpose of calibrating the items. But the not-reached responses were then recoded as incorrect when scoring the item for the individual countries, and for the purpose of calculating the scale scores for the individuals. By default, the scoring program provided with the database recodes the items coded as not reached and those left blank as incorrect responses.
To use the SCOREIT macro, you need to adapt the program code in either of the programs ASASCRM3 (fourth grade) or BSASCRM3 (eighth grade). You should do the following:
1. Open the appropriate control file, for example BSASCRM3.SAS.
2. In the line that reads “LIBNAME libdat “<path>”;”, you should enter the path where the SAS data file you want to recode is located.
3. In the line that reads “DATA libdat.BSA<country>M3;”, you should enter the 3-character code for the country whose data you are scoring.
4. In the line that reads “SET libdat.BSA<country>M3;”, you should enter the 3-character code for the country whose data you are scoring.
5. Submit the code for processing
Both of these programs recode the items onto themselves, so if you want to preserve the original answers and codes assigned to the questions, then the file with the recoded item variables should be saved under a different file name, or in a different directory. A copy of the program that scores the items in SAS is presented in Exhibit 5.2.

TIMSS 2003 International Database User Guide 5-9
Exhibit 5.2 Extracted Sections of SAS Program SCOREIT Used to Convert Cognitive Item Response Codes to Correctness-Score Levels
%MACRO SCOREIT(ITEM,TYPE,RIGHT,NR,NA,OM,OTHER) ;
.
.
.
%MEND SCOREIT ;
* Specify the location of the SAS data files;LIBNAME libdat “<path>”;
* Get the student achievement data;DATA libdat.BSA<country>M3; SET libdat.BSA<country>M3;
%LET ARIGHT = <list items where option A is the correct one> ;%LET BRIGHT = <list items where option B is the correct one> ;%LET CRIGHT = <list items where option C is the correct one> ;%LET DRIGHT = <list items where option D is the correct one> ;%LET ERIGHT = <list items where option E is the correct one> ;%LET OPENEND = <list open-ended items> ;
.
.
.
RUN;
5.5 Converting Files
The DVD provides a special program called CONVERT.SAS that simply converts the SAS Export files provided on the DVD to SAS data files. This conversion is necessary since all the SAS macros and SAS procedures presented in this chapter require the use of SAS data files. SAS data files can also be created from the raw data files, as described in section 5.3.
To convert a SAS Export file to a SAS data file, you should to do the following:
1. Open the control file CONVERT.SAS.
2. At the begining of the program, you should list all the countries of interest in the parameter “cty”.
3. You should specify the file type in the parameter “type”.
4. You should specify the path where the SAS export files are located in the parameter “exppath”.
5. You should specify the path where the SAS data files will be located in the parameter “datpath”.

TIMSS 2003 International Database User Guide5-10
An example of the CONVERT program is presented in Exhibit 5.3. This example converts the SAS Export files of type BSG for all countries. All SAS export files are located in the directory “D:\TIMSS2003\Data\SAS_Data”. The SAS data files will also be located in this directory.
Exhibit 5.3 Contents of SAS Program CONVERT Used to Convert SAS Export Files Into SAS Data Files
* This program converts SAS export files to SAS data sets ;
options nonotes ;
* Insert the countries ;%let cty = ARM AUS BFL BGR BHR BWA COT CQU CHL CYP EGY ENG BSQ EST GHA HKG HUN IDN IRN ISR ITA JOR JPN KOR LBN LTU LVA MAR MDA MKD MYS NLD NOR NZL PSE PHL ROM RUS SAU SCO SGP SVK SVN SWE SYR TUN TWN USA UIN SCG YEM ZAF ;
* Insert the file type ;%let type = BSG ;
* Insert the path for the export files following the format x:\xxx\ ;%let exppath = D:\TIMSS2003\Data\SAS_Data\ ;
* Insert the path for the data files following the format x:\xxx\ ;%let datpath = D:\TIMSS2003\Data\SAS_Data\ ;
%macro convertit;
%let i = 1;%do %while(%length(%scan(&cty,&i))); %let ccode = %lowcase(%scan(&cty,&i)); proc cimport file=”&exppath.&type.&ccode.M3.exp” data=”&datpath.&type.&ccode.M3” ; %let i = %eval(&i + 1);%end;
run;
%mend convertit;
%convertit;
TIMSS 2003 International Database User Guide 5-11
5.6 Joining Files
The programs presented until now produce a single SAS data file per country. The DVD provides a special program called JOIN.SAS that joins individual country files into a single aggregated file. This program facilitates joint analyses for more than one country. This program can only join SAS data files of the same type, for example BSG files.
To create a SAS data file with more than one country’s data, you should do the following:
1. Open the control file JOIN.SAS.
2. At the begining of the program, you should list all the countries of interest in the parameter “cty”.
3. You should specify the file type in the parameter “type”.
4. You should specify the sorting variables in the parameter “sortvar”.
5. You should specify the path where all files are located in the “libname” statement.
6. Submit the code for processing.
An example of the JOIN program is presented in Exhibit 5.4. This example joins all the BSG files for all countries. All individual country files are located in the directory “D:\TIMSS2003\Data\SAS_Data”. The resulting file will also be located in this directory and will be called BSGALLM3. The resulting file will be sorted by IDCNTRY and IDSTUD.
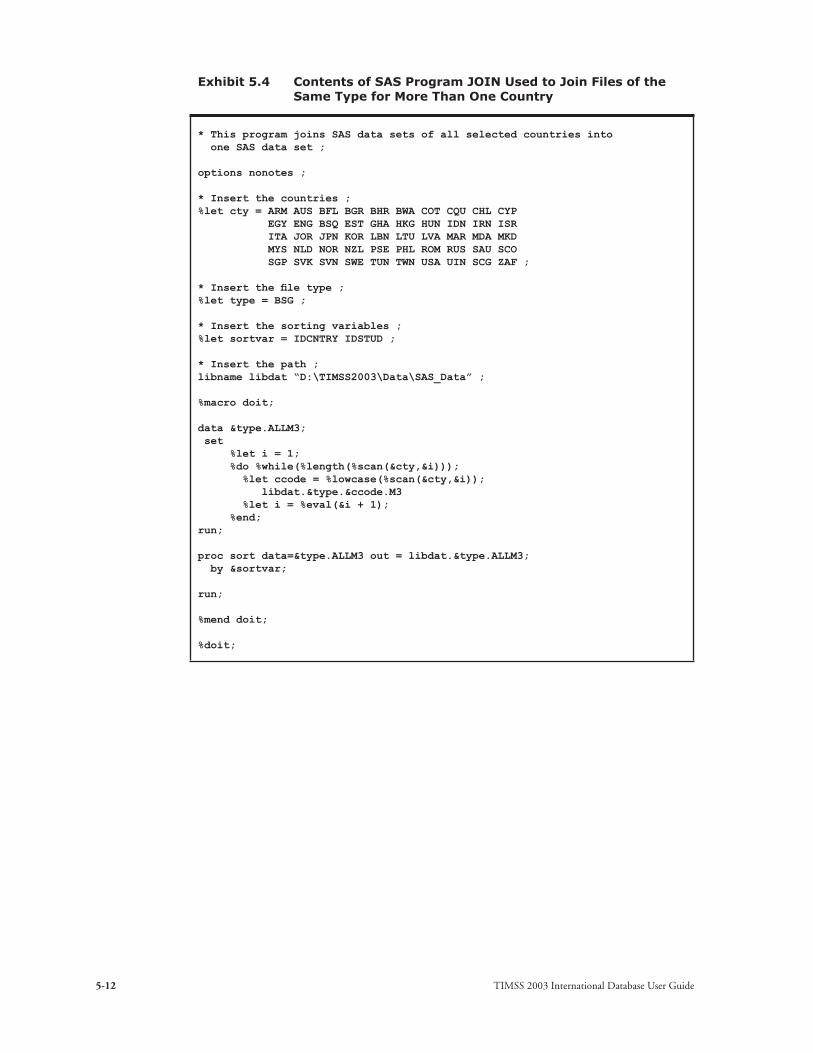
TIMSS 2003 International Database User Guide5-12
Exhibit 5.4 Contents of SAS Program JOIN Used to Join Files of the Same Type for More Than One Country
* This program joins SAS data sets of all selected countries into one SAS data set ;
options nonotes ;
* Insert the countries ;%let cty = ARM AUS BFL BGR BHR BWA COT CQU CHL CYP EGY ENG BSQ EST GHA HKG HUN IDN IRN ISR ITA JOR JPN KOR LBN LTU LVA MAR MDA MKD MYS NLD NOR NZL PSE PHL ROM RUS SAU SCO SGP SVK SVN SWE TUN TWN USA UIN SCG ZAF ;
* Insert the file type ;%let type = BSG ;
* Insert the sorting variables ;%let sortvar = IDCNTRY IDSTUD ;
* Insert the path ;libname libdat “D:\TIMSS2003\Data\SAS_Data” ;
%macro doit;
data &type.ALLM3; set %let i = 1; %do %while(%length(%scan(&cty,&i))); %let ccode = %lowcase(%scan(&cty,&i)); libdat.&type.&ccode.M3 %let i = %eval(&i + 1); %end;run;
proc sort data=&type.ALLM3 out = libdat.&type.ALLM3; by &sortvar;
run;
%mend doit;
%doit;
TIMSS 2003 International Database User Guide 5-13
5.7 Basic Analyses with the TIMSS Data: Means, Percentages, Regression Coefficients and Their JRR Standard Errors
In this section, four macros that can be used to compute the correct standard errors are described, including examples in which these macros are used to replicate tables in the TIMSS 2003 international reports and almanacs.
Computing Means and Their JRR Standard Errors with Plausible Values (JACKPV.SAS)
This section presents example SAS code that can be used to compute the JRR standard errors for mean achievement scores based on plausible values and percentages. This code is provided in the form of a SAS macro, called JACKPV.SAS, that computes the percentages of students within subgroups defined by a set of classification variables, the JRR standard errors of these percentages, the mean achievement scores for the groups using plausible values, and the JRR standard errors of these means including the sampling and imputation variance components.
The JACKPV.SAS macro operates as follows:
1. Computes a set of replicate weights specified using the parameters NJKZ, JKZ, and JKR.
2. Aggregates or summarizes the data by computing the sum of the weights for each subgroup, the sum of the weights overall, and the weighted sum of a set of plausible values.
3. Computes the percentages of students within each group, their mean achievement scores based on the plausible values, and their respective standard errors. The resulting working file FINAL contains all the computed statistics.
When using this macro, you need to specify a set of classification variables, the name of the plausible values and how many there are, the number of replicate weights to be generated, the variables that contain the jackknife replication information (JKZONE and JKREP), and the sampling weight that is to be used for the analysis. You will also need to specify the data file that contains the data that be processed.
You need to know some basic SAS macro language in order to use JACKPV.SAS. The macro should be included in the program file where it is going to be used.

TIMSS 2003 International Database User Guide5-14
If you are operating in batch mode, then the macro should be included in every batch. If you are using SAS interactively then the macro should be included once at the beginning of the session and it will remain active throughout the session. If the session is terminated and restarted at a later time the macro should be included once again. Once the macro is included in a specific session, the word “JACKPV” should not be used within that session because doing so will invoke the macro.
The macro is included in the program file by issuing the following command in SAS:
%include “<path>jackpv.sas” ;
where <path> points to the specific drive and directory where the macro JACKPV.SAS can be found. The macro requires that several parameters be specified when it is invoked. These parameters are:
INFILE The name of the data file that contains the variables necessary for the analysis. If the path location is included as part of the file name, the name of the file has to be enclosed in quotes. It is important to emphasize that this system file must include only those cases that are of interest in the analysis. If you want to have specific cases excluded from the analysis, for example students with missing data, this should be done prior to invoking the macro.
CVAR This lists the variables that are to be used to classify the students in the data file. This can be a single variable, or a list of variables. The maximum number of variables will depend mostly on the computer resources available to you at the time. It is recommended to always include the variable that identifies the country. At least one variable has to be specified, usually IDCNTRY.
ROOTPV This is the prefix used to identify the plausible values for the achievement scale of interest. This corresponds to the first 7 characters of the plausible values variable name. For example, the root of the overall science plausible values is “BSSSCI0,” the root of the geometry plausible values is “BSMGEO0.”

TIMSS 2003 International Database User Guide 5-15
NPV This is the number of plausible values that will be used for the analysis. Generally you will want to use all five plausible values for the analysis, although in some circumstances fewer can be used. You should always use at least two plausible values for any analysis.
JKZ The variable that captures the assignment of cases to sampling zones. The name of this variable in all TIMSS files is JKZONE.
JKR The variable that captures whether the case is to be dropped or have its weight doubled for each set of replicate weights. The name of this variable in all TIMSS files is JKREP.
NJKZ This indicates the number of replicate weights to be generated when computing the JRR standard errors. When conducting analyses using the data from all countries, the value of NJKZ should be set to 75, the maximum possible value. When you are working with the data for only one country, you should set the NJKZ argument to as many replicates as are needed for the country. If the data from two or more countries are being used for an analysis, then the largest number of jackknife zones should be used. When in doubt, NJKZ should be set to 75. The standard errors will always be estimated correctly if more replicate weights than necessary are computed, but will be underestimated if you specify fewer replicate weights than necessary.
WGT The sampling weight to be used in the analysis, generally TOTWGT when using the student files, or MATWGT, SCIWGT, or TCHWGT when using the teacher files.
The simplest and most straightforward way to invoke the macro is by using the conventional SAS notation for invoking macros. This involves listing the macro name followed by the list of arguments for the analysis in parenthesis, each separated by a comma. For example, if the macro is invoked using
%jackpv (TOTWGT, JKZONE, JKREP, 75, IDCNTRY ITSEX, BSMMAT0, 5, BSGALLM3) ;

TIMSS 2003 International Database User Guide5-16
it will compute the eighth grade mean mathematics achievement scores using five plausible values and their respective standard errors for boys and girls within each country, using the variable TOTWGT as the sampling weight. It will also compute the percentages of boys and girls within each country, and their respective standard errors. The data will be read from the data file BSGALLM3, and the standard errors will be computed based on 75 replicate weights.
The file that contains the results is called FINAL and is saved to the default directory being used by SAS. The variables that are contained in this results file are:
Classification Variables
All classification variables are kept in the results file. In the example there are two classification variables: IDCNTRY and ITSEX. There is one record for each combination of the categories for these variables.
Weight Variable
Contains the sum of weights within each group defined by the classification variables. In the example this variable is called TOTWGT.
N
Contains the number of valid cases within each group defined by the classification variables. In the example this is the number of boys and girls in each country’s sample.
MNX
Contains the weighted achievement scores, based only on the first plausible value, for each group defined by the classification variables.
MNX_SE
Contains the JRR standard errors of the weighted achievement scores, based only on the first plausible value. This does not include the imputation error that should be computed when using plausible values.
MNPV
Contains the weighted achievement scores, based on the all plausible values.

TIMSS 2003 International Database User Guide 5-17
MNPV_SE
Contains the JRR standard errors of the weighted achievement scores, based on the all plausible values. These standard errors contain both the sampling and the imputation variance components.
PCT
Contains the weighted percentages of students in the groups for the last classification variable listed, within the specific combination of the categories defined by the remaining classification variables. In the example it is the percentage of boys and girls within each country.
PCT_SE
Contains the standard errors of PCT values.
The contents of the FINAL file can be printed using a SAS procedure of choice. An example call to this macro, and a printout of the results file is presented in Exhibit 5.5. The code is included in the file called SampleJackPV.SAS.

TIMSS 2003 International Database User Guide5-18
Exhibit 5.5 Extract of SAS Control Code and Output File for Using the Macro JACKPV.SAS
libname bm3 “D:\TIMSS2003\Data\SAS_Data” ;
%include “D:\TIMSS2003\Programs\SAS_Programs\jackpv.sas” ;
data BSGALLM3 ; set bm3.BSGARMM3 bm3.BSGAUSM3 bm3.BSGBFLM3 bm3.BSGBGRM3 bm3.BSGBHRM3 ; where nmiss(ITSEX) = 0 ;
proc format library=work ; value country < list all country codes and country names > value sex 1 = ‘Girl’ 2 = ‘Boy’ ;
%jackpv (TOTWGT, JKZONE, JKREP, 75, IDCNTRY ITSEX, BSMMAT0, 5, BSGALLM3) ;
* Print the results ; proc print data=final noobs ; var IDCNTRY ITSEX n TOTWGT mnpv mnpv_se pct pct_se ; format IDCNTRY country. ITSEX sex. n 6.0 TOTWGT 10.0 mnpv mnpv_se pct pct_se 6.2 ;
run ;
IDCNTRY ITSEX N TOTWGT mnpv mnpv_se pct pct_se AUSTRALIA Girl 2443 131600 498.59 5.79 51.13 2.25 AUSTRALIA Boy 2348 125807 511.10 5.79 48.87 2.25 BAHRAIN Girl 2025 5317 417.32 2.37 50.43 0.44 BAHRAIN Boy 2174 5226 384.79 2.42 49.57 0.44 ARMENIA Girl 3003 28625 482.86 3.29 52.76 0.66 ARMENIA Boy 2696 25630 472.78 3.42 47.24 0.66 BULGARIA Girl 2015 42247 475.65 5.48 48.23 1.33 BULGARIA Boy 2102 45356 476.66 4.33 51.77 1.33 BELGIUM FLEMISH Girl 2620 37887 531.72 3.53 53.64 2.09 BELGIUM FLEMISH Boy 2350 32751 542.49 3.75 46.36 2.09
In this example, the mean eighth grade mathematics achievement scores, based on all five plausible values, and their respective standard errors are calculated separately for boys and girls by country. In the results listing, we can see that there are entries for each country and gender combination. The first column has the country name and the second column indicates the gender of the students. The third column has the number of valid cases by country and gender and the fourth column has the total sum of weights by country and gender. The fifth and sixth columns report the mean eighth grade mathematics achievement score, based on all five plausible values, by country and gender and its standard error. The last two columns report the weighted percentage of girls and boys in each country and their respective standard errors.
TIMSS 2003 International Database User Guide 5-19
From the first few lines of the results in Exhibit 5.5, we can say that in Australia there are 2,443 girls in the sample representing 131,600 students in the whole population. The mean mathematics score for the girls, based on the five plausible values, is 498.59 with a standard error of 5.79. Girls made up 51.13% of Australia’s student population. Additionally, Australia sampled 2,348 boys representing 125,807 students in the whole population. The mean mathematics score for the boys, based on the five plausible values, is 511.10 with a standard error of 5.79. Boys made up 48.87% of Australia’s student population.
Computing Means and Their JRR Standard Errors without Plausible Values (JACKGEN.SAS)
This section presents example SAS code that can be used to compute the JRR standard errors for means of variables other than plausible values and percentages. This code is provided in the form of an SAS macro, called JACKGEN.SAS, that computes the percentages of students within subgroups defined by a set of classification variables, the JRR standard errors of these percentages, the means on a variable of choice, and the JRR standard errors of these means. Although you can compute weighted percentages and means using other basic SAS commands, the macro JACKGEN.SAS computes the proper JRR standard errors for these means and percentages.
This macro operates as follows:
1. Computes a set of replicate weights specified using the parameters NJKZ, JKZ, and JKR.
2. Aggregates or summarizes the data by computing the sum of the weights for each subgroup, the sum of the weights overall, and the weighted sum of a specified analysis variable.
3. Computes the percentages of students within each group, their mean on the analysis variable, and their respective standard errors. The resulting working file FINAL contains all the computed statistics.
When using this macro, you need to specify a set of classification variables, one analysis variable, the number of replicate weights to be generated, the variables that contain the jackknife replication information (JKZONE and JKREP), and the sampling weight that is to be used for the analysis. You will also need to specify the data file that contains the data that is to be processed.
You need to know some basic SAS macro language in order to use JACKGEN.SAS. The macro should be included in the program file where it is going to be used. If you are operating in batch mode, then the macro needs to be included in every batch. If you are using SAS interactively then the macro needs to be included once at the beginning of the session and it will remain active throughout the

TIMSS 2003 International Database User Guide5-20
session. If the session is terminated and restarted at a later time the macro needs to be included once again. Once the macro is included in a specific session, the word “JACKGEN” should not be used within that program because doing so will invoke the macro.
The macro is included in the program file by issuing the following command in SAS:
%include “<path>jackgen.sas”;
where <path> points to the specific drive and directory where the macro JACKGEN.SAS can be found. The macro requires that several arguments be specified when it is invoked. These parameters are:
INFILE The name of the data file that contains the variables necessary for the analysis. If the path location is included as part of the file name, the name of the file has to be enclosed in quotes. It is important to emphasize that this system file must include only those cases that are of interest in the analysis. If you want to have specific cases excluded from the analysis, for example students with missing data, this should be done prior to invoking the macro.
CVAR This lists the variables that are to be used to classify the students in the data file. This can be a single variable, or a list of variables. The maximum number of variables will depend mostly on the computer resources available to you at the time. It is recommended to always include the variable that identifies the country. At least one variable has to be specified, usually IDCNTRY.
DVAR This is the variable for which means are to be computed. Only one variable can be listed here. If you want to examine results for two different variables, then the macro needs to be invoked separately to generate each table.
JKZ The variable that captures the assignment of cases to sampling zones. The name of this variable in all TIMSS files is JKZONE.
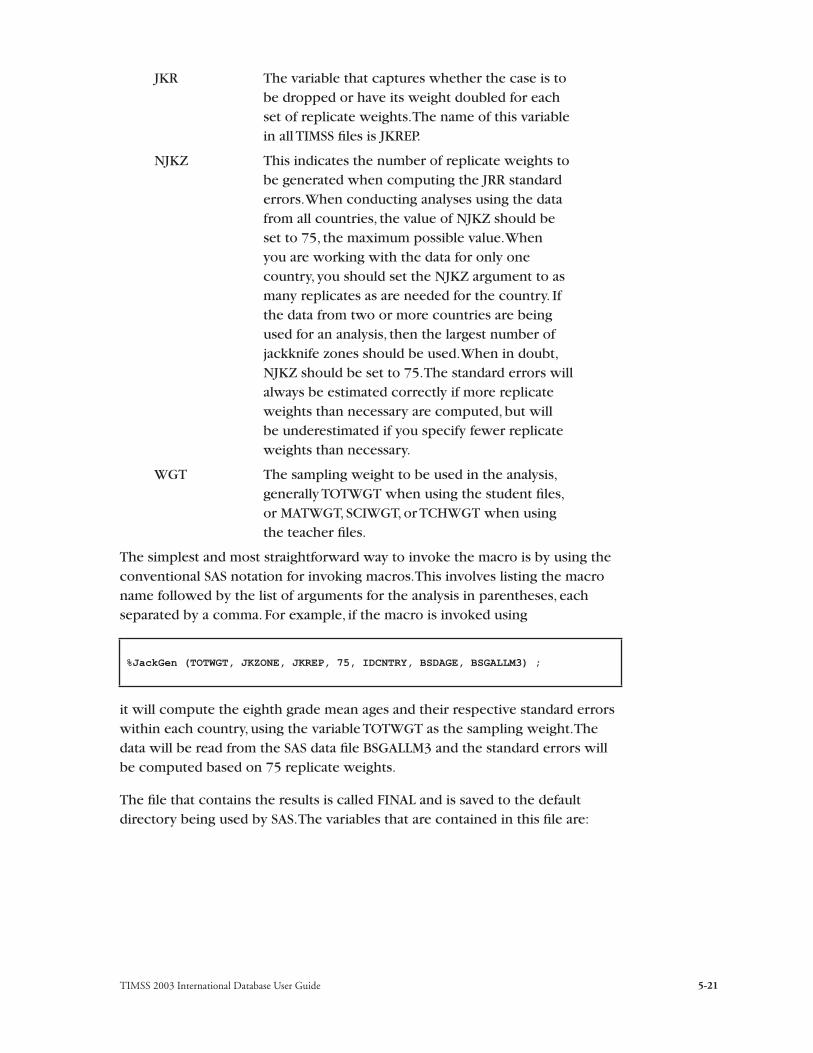
TIMSS 2003 International Database User Guide 5-21
JKR The variable that captures whether the case is to be dropped or have its weight doubled for each set of replicate weights. The name of this variable in all TIMSS files is JKREP.
NJKZ This indicates the number of replicate weights to be generated when computing the JRR standard errors. When conducting analyses using the data from all countries, the value of NJKZ should be set to 75, the maximum possible value. When you are working with the data for only one country, you should set the NJKZ argument to as many replicates as are needed for the country. If the data from two or more countries are being used for an analysis, then the largest number of jackknife zones should be used. When in doubt, NJKZ should be set to 75. The standard errors will always be estimated correctly if more replicate weights than necessary are computed, but will be underestimated if you specify fewer replicate weights than necessary.
WGT The sampling weight to be used in the analysis, generally TOTWGT when using the student files, or MATWGT, SCIWGT, or TCHWGT when using the teacher files.
The simplest and most straightforward way to invoke the macro is by using the conventional SAS notation for invoking macros. This involves listing the macro name followed by the list of arguments for the analysis in parentheses, each separated by a comma. For example, if the macro is invoked using
%JackGen (TOTWGT, JKZONE, JKREP, 75, IDCNTRY, BSDAGE, BSGALLM3) ;
it will compute the eighth grade mean ages and their respective standard errors within each country, using the variable TOTWGT as the sampling weight. The data will be read from the SAS data file BSGALLM3 and the standard errors will be computed based on 75 replicate weights.
The file that contains the results is called FINAL and is saved to the default directory being used by SAS. The variables that are contained in this file are:
TIMSS 2003 International Database User Guide5-22
Classification Variables
All classification variables are kept in the results file. In the example there is only one variable: IDCNTRY. There is one record for each category of this variable.
Weight Variable
Contains the sum of weights within each group defined by the classification variables.
N
Contains the number of valid cases within each group defined by the classification variables.
MNX
Contains the weighted means of the variable DVAR for each group defined by the classification variables.
MNX_SE
Contains the JRR standard errors of the MNX values.
PCT
Contains the weighted percentages of students in the groups for the classification variable listed last, within the specific combination of the categories defined by the groups initially. In the example it is the weighted percentage of students by country.
PCT_SE
Contains the JRR standard errors of PCT values.
The contents of the FINAL file can be printed using a SAS procedure of choice. An example call to this macro, and an extract of the results file is presented in Exhibit 5.6. The code is included in the file called SampleJackGen.SAS.
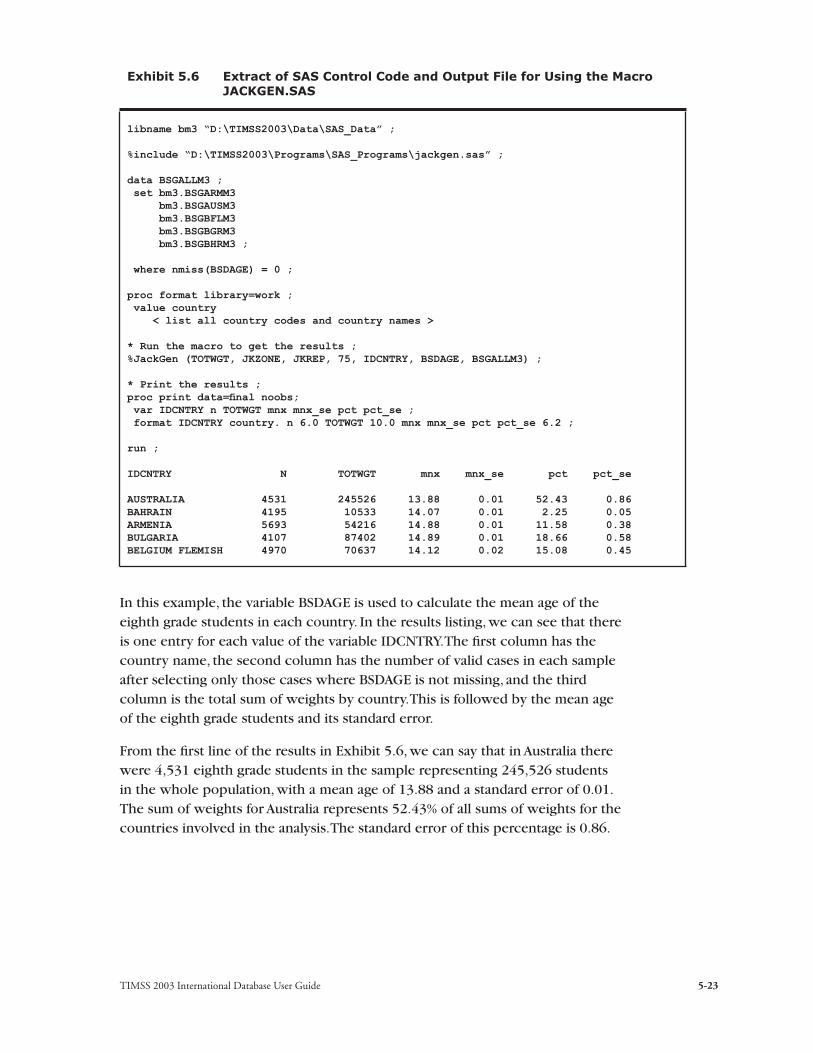
TIMSS 2003 International Database User Guide 5-23
Exhibit 5.6 Extract of SAS Control Code and Output File for Using the Macro JACKGEN.SAS
libname bm3 “D:\TIMSS2003\Data\SAS_Data” ;
%include “D:\TIMSS2003\Programs\SAS_Programs\jackgen.sas” ;
data BSGALLM3 ; set bm3.BSGARMM3 bm3.BSGAUSM3 bm3.BSGBFLM3 bm3.BSGBGRM3 bm3.BSGBHRM3 ; where nmiss(BSDAGE) = 0 ;
proc format library=work ; value country < list all country codes and country names >
* Run the macro to get the results ; %JackGen (TOTWGT, JKZONE, JKREP, 75, IDCNTRY, BSDAGE, BSGALLM3) ;
* Print the results ; proc print data=final noobs; var IDCNTRY n TOTWGT mnx mnx_se pct pct_se ; format IDCNTRY country. n 6.0 TOTWGT 10.0 mnx mnx_se pct pct_se 6.2 ;
run ;
IDCNTRY N TOTWGT mnx mnx_se pct pct_se
AUSTRALIA 4531 245526 13.88 0.01 52.43 0.86 BAHRAIN 4195 10533 14.07 0.01 2.25 0.05 ARMENIA 5693 54216 14.88 0.01 11.58 0.38 BULGARIA 4107 87402 14.89 0.01 18.66 0.58 BELGIUM FLEMISH 4970 70637 14.12 0.02 15.08 0.45
In this example, the variable BSDAGE is used to calculate the mean age of the eighth grade students in each country. In the results listing, we can see that there is one entry for each value of the variable IDCNTRY. The first column has the country name, the second column has the number of valid cases in each sample after selecting only those cases where BSDAGE is not missing, and the third column is the total sum of weights by country. This is followed by the mean age of the eighth grade students and its standard error.
From the first line of the results in Exhibit 5.6, we can say that in Australia there were 4,531 eighth grade students in the sample representing 245,526 students in the whole population, with a mean age of 13.88 and a standard error of 0.01. The sum of weights for Australia represents 52.43% of all sums of weights for the countries involved in the analysis. The standard error of this percentage is 0.86.
TIMSS 2003 International Database User Guide5-24
Computing Regression Coefficients and Their JRR Standard Errors without Plausible Values (JACKREG.SAS)
This section presents example SAS code that can be used to compute regression coefficients and their JRR standard errors. This code is provided in the form of a SAS macro, called JACKREG.SAS, which performs a multiple linear regression betweens the specified dependent and independent variables within subgroups defined by a set of classification variables, as well as the regression coefficients and their JRR standard errors.
If you wish to conduct regression analyses using plausible values as the dependent variables, refer to JACKREGP.SAS described in the next section.
The JACKREG.SAS macro operates as follows:
1. Computes a set of replicate weights specified using the parameters NJKZ, JKZ, and JKR.
2. Aggregates or summarizes the data by computing the sum of the weights for each subgroup, the sum of the weights overall, and the weighted sum of all specified analysis variables.
3. Performs a multiple linear regression within each group, and computes the regression coefficients and their respective standard errors. The resulting working file REG contains all the computed statistics.
When using this macro, you need to specify a set of classification variables, the analysis variables, the number of replicate weights to be generated, the variables that contain the jackknife replication information (JKZONE and JKREP), and the sampling weight that is to be used for the analysis. You will also need to specify the data file that contains the data that is to be processed.
You need to know some basic SAS macro language in order to use the macro. The macro should be included in the program file where it is going to be used. If you are operating in batch mode, then the macro needs to be included in every batch. If you are using SAS interactively then the macro needs to be included once at the beginning of the session and it will remain active throughout the session. If the session is terminated and restarted at a later time the macro needs to be included once again. Once the macro is included in a specific session, the word “JACKREG” should not be used within that program because doing so will invoke the macro.

TIMSS 2003 International Database User Guide 5-25
The macro is included in the program file by issuing the following command in SAS:
%include “<path>jackreg.sas”;
where <path> points to the specific drive and directory where the macro JACKREG.SAS can be found. The macro requires that several parameters be specified when it is invoked. These parameters are:
INFILE The name of the data file that contains the variables necessary for the analysis. If the path location is included as part of the file name, the name of the file has to be enclosed in quotes. It is important to emphasize that this system file must include only those cases that are of interest in the analysis. If you want to have specific cases excluded from the analysis, for example students with missing data, this should be done prior to invoking the macro.
CVAR This lists the variables that are to be used to classify the students in the data file. This can be a single variable, or a list of variables. The maximum number of variables will depend mostly on the computer resources available to you at the time. It is recommended to always include the variable that identifies the country. At least one variable has to be specified, usually IDCNTRY.
XVAR This is a list of independent variables that will be used as predictors of the dependent variable specified in DVAR. The independent variables can be continuous or categorical. For example, it could be the variable ITSEX as originally coded in the data files, or dummy coded as 1 or 0.
DVAR This is the dependent variable that will be predicted by the variable or variables specified by the XVAR parameter. Only one variable can be listed here. If you want to use the same set of predictor variables to predict two different variables, then the macro needs to be invoked separately to generate each set of results.

TIMSS 2003 International Database User Guide5-26
JKZ The variable that captures the assignment of cases to sampling zones. The name of this variable in all TIMSS files is JKZONE.
JKR The variable that captures whether the case is to be dropped or have its weight doubled for each set of replicate weights. The name of this variable in all TIMSS files is JKREP.
NJKZ This indicates the number of replicate weights to be generated when computing the JRR standard errors. When conducting analyses using the data from all countries, the value of NJKZ should be set to 75. When you are working with the data for only one country, you should set the NJKZ argument to as many replicates as are needed for the country. If the data from two or more countries are being used for an analysis, then the larger number of jackknife zones should be used. When in doubt, NJKZ should be set to 75. The standard errors will always be estimated correctly if more replicate weights than necessary are computed, but will be underestimated if you specify fewer replicate weights than necessary.
WGT The sampling weight to be used, generally TOTWGT when using the student files, or MATWGT, SCIWGT, or TCHWGT when using the teacher files.
The simplest and most straightforward way to invoke the macro is by using the conventional SAS notation for invoking macros. This involves listing the macro name followed by the list of arguments for the analysis, each separated by a comma. For example, if the macro is invoked using
%JackReg (TOTWGT, JKZONE, JKREP, 75, IDCNTRY, REGSEX, BOOK, BSGALLM3) ;
it will perform a multiple linear regression with the variable REGSEX as a predictor of the number of books at home, and the standard errors of the regression coefficients will be computed based on 75 replicate weights.
The file that contains these results is called REG and is saved to the default directory being used by SAS. The variables that are contained in this results file are:

TIMSS 2003 International Database User Guide 5-27
Classification Variables
All classification variables are kept in the results file. In the example there is only one variable: IDCNTRY. There is one record for each category of this variable.
N
Contains the number of valid cases within each group defined by the classification variables.
Mult_RSQ
The squared multiple correlation coefficient for the model within each group.
SS_Res, SS_Reg, SS_Total
The residual, regression, and total sums of squares for the model within each group.
Regression Coefficients and Standard Errors (B## and B##.SE)
These are the regression coefficients for each of the predictor variables in the model and their respective JRR standard errors. The coefficient zero (B00) is the intercept for the model. The other coefficients receive a sequential number starting with 01. This sequential number corresponds to the order of the variables in the list of variables specified in the parameter XVAR.
The contents of the REG file can be printed using a SAS procedure of choice. An example call to this macro, and an extract of the results file is presented in Exhibit 5.7. The code is included in the file called SampleJackReg.SAS.

TIMSS 2003 International Database User Guide5-28
Exhibit 5.7 Extract of SAS Control Code and Output File for Using the Macro JACKREG.SAS
libname bm3 “D:\TIMSS2003\Data\SAS_Data” ;
%include “D:\TIMSS2003\Programs\SAS_Programs\jackreg.sas” ;
data BSGALLM3 ; set bm3.BSGARMM3 bm3.BSGAUSM3 bm3.BSGBFLM3 bm3.BSGBGRM3 bm3.BSGBHRM3 ; where nmiss(ITSEX) = 0 ;
REGSEX = ITSEX-1 ;
select (BSBGBOOK) ; when(1) BOOK = 5 ; /* 5 Books at home*/ when(2) BOOK = 18 ; /* 18 Books at home*/ when(3) BOOK = 63 ; /* 63 Books at home*/ when(4) BOOK = 151 ; /*151 Books at home*/ when(5) BOOK = 251 ; /*251 Books at home*/ otherwise ; end ;
proc format library=work ; value country < list all country codes and country names > %JackReg (TOTWGT, JKZONE, JKREP, 75, IDCNTRY, REGSEX, BOOK, BSGALLM3) ;
* Print the results ; proc print data=reg noobs ; var IDCNTRY n mult_rsq ss_total ss_reg b00 b00_se b01 b01_se ; format IDCNTRY country. n 6.0 mult_rsq 5.3 ss_total ss_reg 10.0 b00 b00_se b01 b01_se 6.2 ; run ;
IDCNTRY N Mult_RSQ SS_Total SS_Reg b00 b00_se b01 b01_se
AUSTRALIA 4663 0.002 2056635596 4451708 129.26 3.24 8.42 4.06 BAHRAIN 4162 0.001 76995110 60535 92.17 2.14 -4.81 2.88 ARMENIA 5558 0.000 430338454 17825 91.67 3.32 1.16 2.85 BULGARIA 3996 0.001 785508028 897904 120.51 4.66 -6.51 4.30 BELGIUM FLEMISH 4888 0.000 416292531 533 78.80 2.12 0.18 3.35
In this example, the variable REGSEX is created by subtracting one from the variable ITSEX. As a result, the girls receive a code of 0 and the boys receive a code of 1 on this variable. The variable BOOK is created to convert the responses to number of books. In this regression model, the variable REGSEX is used to predict the values of the variable BOOK by country. In the results listing, we can see that there is one entry for each value of the variable IDCNTRY. The first column has the country code and the second column has the number of valid cases in each country. The multiple R squared is listed for each country, followed by the sums of squares for the model, and the regression coefficients

TIMSS 2003 International Database User Guide 5-29
and their standard errors. Because of the way in which the variable REGSEX is coded, the intercept B00 is the mean value for the variable BOOK for the girls and B00_SE is its standard error. The first regression coefficient (B01) is the difference in the mean value of the variable BOOK between girls and boys, and B01_SE is its JRR standard error.
From the first line of the results in Exhibit 5.7, we can say that in Australia valid data were available for 4,663 cases. The squared multile correlation between gender and books at home is 0.002, with girls having on average 129.26 books at home and boys having on average 8.42 books more than girls. This difference is statistically significant, which can be determined by dividing the value of B01 by its standard error and comparing the result to the appropriate critical value.
Computing Regression Coefficients and Their JRR Standard Errors with Plausible Values (JACKREGP.SAS)
In this section example SAS code that can be used to compute the JRR standard errors for regression coefficients using plausible values as the dependent variable is described. This code is provided in the form of an SAS macro called JACKREGP.SAS. This macro computes the multiple correlation coefficient between the specified plausible values and independent variables within subgroups defined by a set of classification variables, as well as the regression coefficients and the JRR standard errors.
The JACKREGP.SAS macro operates as follows:
1. Computes a set of replicate weights specified using the parameters NJKZ, JKZ, and JKR.
2. Aggregates or summarizes the data by computing the sum of the weights for each subgroup, the sum of the weights overall, and the weighted sum of all specified analysis variables.
3. Performs a multiple linear regression within each group, and computes the regression coefficients and their respective standard errors. The resulting working file REG contains all the computed statistics.
When using this macro, you need to specify a set of classification variables, the analysis variables including the set of plausible values, the number of replicate weights to be generated, the variables that contain the jackknife replication information (JKZONE and JKREP), and the sampling weight that is to be used for the analysis. You will also need to specify the data file that contains the data that is to be processed.
You need to know some basic SAS macro language in order to use the macro. The macro should be included in the program file where it is going to be used. If

TIMSS 2003 International Database User Guide5-30
you are operating in batch mode, then the macro needs to be included in every batch. If you are using SAS interactively then the macro needs to be included once at the beginning of the session and it will remain active throughout the session. If the session is terminated and restarted at a later time the macro needs to be included once again. Once the macro is included in a specific session, the word “JACKREGP” should not be used within that program because doing so will invoke the macro.
The macro is included in the program file by issuing the following command in SAS:
%include “<path>jackregp.sas”;
where <path> points to the specific drive and directory where the macro JACKREGP.SAS can be found. The macro requires that several parameters be specified when it is invoked. These parameters are:
INFILE The name of the data file that contains the variables necessary for the analysis. If the path location is included as part of the file name, the name of the file has to be enclosed in quotes. It is important to emphasize that this system file must include only those cases that are of interest in the analysis. If you want to have specific cases excluded from the analysis, for example students with missing data, this should be done prior to invoking the macro.
CVAR This lists the variables that are to be used to classify the students in the data file. This can be a single variable, or a list of variables. The maximum number of variables will depend mostly on the computer resources available to you at the time. It is recommended to always include the variable that identifies the country. At least one variable has to be specified, usually IDCNTRY.
XVAR This is a list of independent variables which will be used as predictors of the dependent variable specified as a set of plausible values in ROOTPV. The independent variables can be continuous or categorical. For example, it could be the variable ITSEX as originally coded in the data files, or dummy coded as 1 or 0.
TIMSS 2003 International Database User Guide 5-31
ROOTPV This is the prefix used to identify the set of plausible values for the achievement scale of interest. This corresponds to the first 7 characters of the plausible values variable name. For example, the root of the overall science plausible values is “BSSSCI0,” the root of the geometry plausible values is “BSMGEO0.”
NPV This is the number of plausible values that will be used in the analysis. Generally you will want to use all five plausible values for the analysis, although in some circumstances fewer can be used. You should always use at least two plausible values for any analysis.
JKZ The variable that captures the assignment of cases to sampling zones. The name of this variable in all TIMSS files is JKZONE.
JKR The variable that captures whether the case is to be dropped or have its weight doubled for each set of replicate weights. The name of this variable in all TIMSS files is JKREP.
NJKZ This indicates the number of replicate weights to be generated when computing the JRR error estimates. When conducting analyses using the data from all countries, the value of NJKZ should be set to 75, the maximum possible value. When you are working with the data for only one country, you should set the NJKZ argument to as many replicates as are needed for the country. If the data from two or more countries is being used for an analysis, then the larger number of jackknife zones should be used. When in doubt, NJKZ should be set to 75. The standard errors will always be estimated correctly if more replicate weights than necessary are computed, but will be underestimated if you specify fewer replicate weights than necessary.
WGT The sampling weight to be used, generally TOTWGT when using the student files, or MATWGT, SCIWGT, or TCHWGT when using the teacher files.

TIMSS 2003 International Database User Guide5-32
The simplest and most straightforward way to invoke the macro is by using the conventional SAS notation for invoking macros. This involves listing the macro name followed by the list of arguments for the analysis, each separated by a slash. For example, if the macro is invoked using
%JackRegP (TOTWGT, JKZONE, JKREP, 75, IDCNTRY, REGSEX , BSMMAT0, 5, BSGALLM3);
it will perform a multiple linear regression with the variable REGSEX as a predictor of the mathematics plausible values, and the standard errors of the regression coefficients will be computed based on 75 replicate weights.
The file that contains the results is called REG and is saved in the default directory being used by SAS. The variables that are contained in this file are:
Classification Variables
All classification variables are kept in the results file. In the example there is only one variable: IDCNTRY. There is one record for each category of this variable.
N
Contains the number of valid cases within each group defined by the classification variables.
Mult_RSQ
The squared multiple correlation coefficient for the model within each group.
SS_Res, SS_Reg, SS_Total
The residual, regression, and total sums of squares for the model within each group.
Regression Coefficients and Standard Errors (B## and B##.SE)
These are the regression coefficients for each of the predictor variables in the model and their respective JRR standard errors. The coefficient zero (B00) is the intercept for the model. The other coefficients receive a sequential number starting with 01. This sequential number corresponds to the order of the variables in the list of variables specified in the parameter XVAR.

TIMSS 2003 International Database User Guide 5-33
Exhibit 5.8 Extract of SAS Control Code and Output File for Using the Macro JACKREGP.SAS
libname bm3 “D:\TIMSS2003\Data\SAS_Data” ;
%include “D:\TIMSS2003\Programs\SAS_Programs\jackregp.sas” ;
data BSGALLM3 ; set bm3.BSGARMM3 bm3.BSGAUSM3 bm3.BSGBFLM3 bm3.BSGBGRM3 bm3.BSGBHRM3 ; where ITSEX > .Z ;
REGSEX = ITSEX-1 ;
proc format library=work ; value country < list all country codes and country names > %JackRegP (TOTWGT, JKZONE, JKREP, 75, IDCNTRY, REGSEX , BSMMAT0, 5, BSGALLM3) ;
* Print the results ; proc print data=reg noobs; var IDCNTRY n mult_rsq ss_total ss_reg b00 b00_se b01 b01_se ; format IDCNTRY country. n 6.0 mult_rsq 5.3 ss_total ss_reg 12.0 b00 b00_se b01 b01_se 6.2 ;
run ;
IDCNTRY n Mult_RSQ SS_Total SS_Reg b00 b00_se b01 b01_se
AUSTRALIA 4791 0.006 1711442579 10114110 498.59 5.79 12.51 7.04 BAHRAIN 4199 0.045 61405486 2791933 417.32 2.37 -32.54 3.34 ARMENIA 5699 0.004 378269349 1380629 482.86 3.29 -10.08 2.97 BULGARIA 4117 0.000 619290982 44393 475.65 5.48 1.01 4.70 BELGIUM FLEMISH 4970 0.005 381570675 2053629 531.72 3.53 10.77 4.82
In this example, the variable REGSEX is once again created by subtracting one from the variable ITSEX. As a result, the girls receive a code of 0 and the boys receive a code of 1 on this variable. In this regression model, the variable REGSEX is used to predict the mathematics achievement by country using all five plausible values. In the results listing, we can see that there is one entry for each value of the variable IDCNTRY. The first column has the country code and the second column has the number of valid cases in each country. The multiple R squared is listed for each country, followed by the sums of squares for the model, and the regression coefficients and their standard errors. Because of the way in which the variable REGSEX is coded, the intercept B00 is the
The contents of the REG file can be printed using a SAS procedure of choice. An example call to this macro, and an extract of the results file, is presented in Exhibit 5.8. The code is included in the file called SampleJackRegP.SAS.
TIMSS 2003 International Database User Guide5-34
mean mathematics achievement for the girls and B00_SE is its standard error. The first regression coefficient (B01) is the difference in the mean mathematics achievement between girls and boys, and B01_SE is its JRR standard error.
From the first line of the results in Exhibit 5.8, we can say that in Australia valid data was available for 4,791 cases. The squared multiple correlation between gender and mathematics achievement is 0.006 with girls achieving on average 498.59 in mathematics and boys scoring on average 12.51 points higher. This difference is not statistically significant.
5.8 Replicating Analyses from the TIMSS 2003 International Reports: Student-Level
Many analyses of the TIMSS data can be undertaken using student-level data. We have already presented some examples in the previous sections when explaining how to use the macros provided with the data files. We now proceed to work through additional examples of actual analyses from the TIMSS 2003 international reports, where all the required steps are undertaken, including the invocation of the appropriate SAS macros.
Example of Student-Level Analysis without Plausible Values
In our first example, we wish to replicate the analysis of eighth graders’ reports on the average number of hours spent reading a book for enjoyment during their leisure time on a normal school day. The results, originally presented in Exhibit 5.9 of the TIMSS 2003 International Science Report, are reproduced in Exhibit 4.8. Since we only want to report the average number of hours, which does not require any plausible values, we need to use the macro JACKGEN.

TIMSS 2003 International Database User Guide 5-35
Exhibit 5.9 Sample Exhibit for Student-Level Analysis without Plausible Values Taken From the TIMSS 2003 International Science Report (Exhibit 4.8)
Armenia 1.8 (0.03) r 0.9 (0.03) r 1.6 (0.03) r 0.4 (0.02) r 1.2 (0.03) r 1.6 (0.03) r 0.7 (0.03) r 1.0 (0.04)Australia 2.0 (0.03) 0.9 (0.02) 1.7 (0.04) 1.0 (0.02) 1.6 (0.03) 0.7 (0.02) 1.3 (0.04) 0.4 (0.03)Bahrain 2.0 (0.03) 1.2 (0.02) 1.6 (0.03) 1.2 (0.02) 1.5 (0.03) 0.9 (0.02) 1.4 (0.03) 0.6 (0.02)Belgium (Flemish) 2.1 (0.03) 1.0 (0.03) 1.9 (0.03) 0.9 (0.02) 1.6 (0.03) 0.5 (0.01) 1.3 (0.03) 0.2 (0.02)Botswana 1.4 (0.03) 0.5 (0.02) 2.1 (0.04) 2.3 (0.03) 1.5 (0.02) 1.8 (0.03) 0.7 (0.02) 0.6 (0.03)Bulgaria 2.5 (0.04) 1.1 (0.04) 2.6 (0.05) 1.5 (0.03) 1.2 (0.04) 0.7 (0.03) 1.0 (0.04) 0.3 (0.02)Chile 2.2 (0.02) 0.7 (0.02) 2.3 (0.02) 1.5 (0.02) 1.8 (0.03) 0.6 (0.01) 0.7 (0.02) 0.3 (0.02)Chinese Taipei 1.7 (0.03) 1.4 (0.04) 1.4 (0.03) 0.7 (0.01) 1.0 (0.02) 1.0 (0.02) 1.4 (0.04) 0.2 (0.01)Cyprus 2.1 (0.03) 1.3 (0.02) 2.1 (0.03) 1.0 (0.03) 1.7 (0.03) 0.9 (0.02) 1.2 (0.02) 0.6 (0.02)Egypt 0.8 (0.02) 0.7 (0.02) 0.8 (0.02) 1.3 (0.03) 1.1 (0.02) 1.0 (0.02) 0.6 (0.02) 0.6 (0.02)Estonia 2.3 (0.03) 1.1 (0.03) 2.8 (0.03) 1.1 (0.02) 1.4 (0.03) 0.7 (0.02) 1.5 (0.04) 0.4 (0.02)Ghana 0.7 (0.02) 0.6 (0.02) 1.2 (0.03) 1.5 (0.03) 1.3 (0.02) 1.7 (0.03) 0.8 (0.03) 0.8 (0.03)Hong Kong, SAR 2.3 (0.03) 2.0 (0.04) 1.6 (0.03) 0.7 (0.01) 1.0 (0.02) 1.1 (0.02) 2.0 (0.03) 0.1 (0.01)Hungary 2.1 (0.03) 1.1 (0.03) 2.2 (0.03) 1.1 (0.02) 1.5 (0.03) 0.8 (0.02) 0.6 (0.03) 0.2 (0.02)Indonesia 1.5 (0.03) 0.5 (0.02) 1.3 (0.03) 2.2 (0.03) 1.1 (0.02) 1.1 (0.02) 0.3 (0.02) 0.8 (0.03)Iran, Islamic Rep. of 1.6 (0.03) 0.4 (0.02) 1.4 (0.03) 1.5 (0.03) 1.4 (0.04) 1.0 (0.02) 0.2 (0.02) 0.7 (0.05)Israel 2.5 (0.04) 1.9 (0.03) 2.3 (0.03) 1.4 (0.03) 1.6 (0.03) 0.9 (0.02) 1.8 (0.04) 0.6 (0.02)Italy 1.8 (0.03) 1.0 (0.02) 2.6 (0.03) 1.1 (0.03) 1.8 (0.03) 0.7 (0.02) 0.6 (0.02) 0.9 (0.02)Japan 2.7 (0.03) 0.9 (0.02) 1.6 (0.04) 0.6 (0.01) 1.3 (0.03) 0.9 (0.02) 0.6 (0.02) 0.1 (0.01)Jordan 1.5 (0.03) 0.9 (0.03) 1.2 (0.03) 1.3 (0.03) 1.2 (0.03) 0.9 (0.02) 0.6 (0.03) 0.6 (0.03)Korea, Rep. of 1.7 (0.03) 1.5 (0.03) 1.8 (0.03) 0.7 (0.01) 0.7 (0.02) 0.6 (0.01) 1.7 (0.03) 0.1 (0.01)Latvia 2.4 (0.03) 1.0 (0.02) 2.8 (0.03) 1.6 (0.03) 1.3 (0.03) 0.8 (0.03) 0.8 (0.03) 0.5 (0.02)Lebanon 1.8 (0.04) 1.3 (0.03) 1.6 (0.04) 1.3 (0.03) 1.6 (0.03) 1.0 (0.02) 1.0 (0.03) 0.8 (0.03)Lithuania 2.1 (0.03) 1.1 (0.03) 2.6 (0.04) 1.6 (0.04) 1.1 (0.03) 0.6 (0.02) 0.7 (0.03) 0.3 (0.02)Macedonia, Rep. of 2.3 (0.04) 1.3 (0.03) 2.2 (0.03) 1.6 (0.03) 1.8 (0.03) 1.0 (0.02) 0.9 (0.03) 0.7 (0.03)Malaysia 2.1 (0.04) 0.8 (0.03) 1.5 (0.03) 1.7 (0.02) 1.1 (0.02) 1.2 (0.02) 0.6 (0.02) 0.3 (0.02)Moldova, Rep. of 1.9 (0.04) 0.7 (0.03) 2.0 (0.04) 2.2 (0.06) 1.3 (0.03) 1.1 (0.03) 0.7 (0.03) 0.5 (0.03)Morocco 1.3 (0.04) 2.3 (0.06) 1.3 (0.03) 1.8 (0.03) 1.5 (0.03) r 1.3 (0.03) r 2.6 (0.06) r 2.8 (0.06)Netherlands 2.1 (0.05) 1.2 (0.04) 2.0 (0.05) 0.8 (0.02) 1.7 (0.04) 0.5 (0.02) 1.5 (0.04) 0.8 (0.05)New Zealand 2.1 (0.04) 1.0 (0.04) 1.8 (0.05) 1.0 (0.02) 1.5 (0.03) 0.7 (0.03) 1.3 (0.04) 0.6 (0.03)Norway 2.2 (0.03) 1.2 (0.03) 2.7 (0.03) 1.0 (0.03) 1.8 (0.03) 0.6 (0.02) 1.2 (0.03) 0.7 (0.02)Palestinian Nat'l Auth. 1.2 (0.02) 0.7 (0.02) 1.3 (0.03) 1.5 (0.03) 1.1 (0.03) 1.0 (0.02) 0.5 (0.02) 0.6 (0.03)Philippines 1.6 (0.04) 0.6 (0.02) 1.7 (0.03) 1.9 (0.03) 1.4 (0.02) 1.2 (0.02) 0.5 (0.03) 0.8 (0.04)Romania 2.0 (0.04) 0.9 (0.03) 2.1 (0.03) 1.7 (0.05) 1.3 (0.03) 1.0 (0.03) 0.8 (0.04) 0.5 (0.04)Russian Federation 2.0 (0.03) 1.0 (0.03) 2.5 (0.04) 1.6 (0.03) 1.3 (0.02) 1.1 (0.03) 0.4 (0.02) 0.2 (0.02)Saudi Arabia 1.6 (0.05) 1.1 (0.03) 1.3 (0.03) 1.5 (0.04) 1.2 (0.04) 0.9 (0.02) 0.8 (0.05) 0.8 (0.03)Scotland 2.2 (0.03) 1.4 (0.04) 2.7 (0.03) 0.8 (0.02) 1.7 (0.03) 0.6 (0.02) 1.4 (0.03) 0.5 (0.03)Serbia 2.1 (0.03) 1.0 (0.03) 2.1 (0.03) 1.3 (0.03) 1.7 (0.03) 0.8 (0.02) 0.6 (0.03) 0.3 (0.02)Singapore 2.3 (0.02) 1.4 (0.02) 1.7 (0.02) 0.7 (0.02) 1.4 (0.02) 0.9 (0.02) 1.6 (0.02) 0.2 (0.02)Slovak Republic 2.5 (0.03) 1.1 (0.03) 2.8 (0.03) 1.5 (0.03) 1.9 (0.04) 0.9 (0.02) 0.6 (0.03) 0.4 (0.02)Slovenia 2.2 (0.03) 1.3 (0.03) 2.0 (0.03) 1.2 (0.03) 1.7 (0.03) 0.8 (0.02) 1.1 (0.03) 0.4 (0.02)South Africa 1.5 (0.03) 0.7 (0.02) 2.0 (0.03) 1.8 (0.03) 1.6 (0.02) 1.6 (0.03) 0.8 (0.02) 0.8 (0.02)Sweden 2.1 (0.03) 1.1 (0.03) 2.8 (0.03) 1.0 (0.02) 1.6 (0.03) 0.6 (0.02) 1.7 (0.04) 0.4 (0.02)Tunisia 1.4 (0.02) 0.8 (0.03) 1.5 (0.02) 1.9 (0.03) 1.5 (0.02) 1.3 (0.02) 0.7 (0.02) 0.6 (0.02)United States 2.2 (0.03) 1.1 (0.02) 2.4 (0.03) 1.2 (0.02) 1.8 (0.02) 0.7 (0.01) 1.8 (0.03) 0.6 (0.02)
¶ England 2.0 (0.04) 1.1 (0.04) 2.4 (0.05) 0.8 (0.03) 1.4 (0.05) 0.5 (0.02) 1.4 (0.04) 0.5 (0.04)International Avg. 1.9 (0.00) 1.1 (0.00) 1.9 (0.00) 1.3 (0.00) 1.4 (0.00) 0.9 (0.00) 1.0 (0.00) 0.6 (0.00)
Benchmarking ParticipantsBasque Country, Spain 1.6 (0.04) 0.9 (0.03) 2.4 (0.04) 0.9 (0.03) 1.5 (0.03) 0.7 (0.02) 0.8 (0.03) 0.4 (0.03)Indiana State, US 2.2 (0.06) 1.0 (0.04) 2.4 (0.06) 1.2 (0.04) 1.8 (0.04) 0.7 (0.03) 1.7 (0.04) 0.6 (0.05)Ontario Province, Can. 2.1 (0.04) 1.2 (0.04) 2.0 (0.04) 0.9 (0.02) 1.7 (0.03) 0.8 (0.02) 1.9 (0.04) 0.6 (0.03)Quebec Province, Can. 2.0 (0.03) 1.4 (0.03) 2.0 (0.04) 0.9 (0.02) 1.7 (0.04) 0.6 (0.02) 1.5 (0.04) 0.6 (0.02)
Countries WatchTelevisionand Videos
PlayComputer
Games
Play or Talkwith Friends
Do Jobsat Home
PlaySports
Reada Book forEnjoyment
Use theInternet
Work ata Paid Job
Average Hours Spent Each Day*

TIMSS 2003 International Database User Guide5-36
To replicate the results in this exhibit, we need to undertake several steps. After reviewing the codebooks and the questionnaire information, we observe that the variable BSBGREBO contains information on the number of hours spent reading for enjoyment before or after school (see Supplement 1 for a copy of the student background questionnaire), and this variable is found in the Student Background data file. Our next step is to review the documentation of national adaptations to the questionnaires to ensure that there were no deviations listed for this variable (see Supplement 2). If no national adaptations were made, we can continue with our analysis without any modifications.
We then proceed to read from the Student Background file our variable of interest (BSBGREBO), the student sampling weight (TOTWGT), the variables that contain the jackknife replication information (JKZONE and JKREP), and the variable containing the country identification code (IDCNTRY). In this analysis, we will use the data for all available countries, although the exact same steps need to be taken if you want to examine these variables within a single country, or for a select group of countries. We used the JOIN program, described earlier in this chapter, to join the eighth grade Student Background files for all countries into a single file called BSGALLM3.
In general, analyses involving all available countries are quite feasible with a powerful desktop computer; however, you need to keep in mind that computing and storage requirements for these types of analyses can be quite demanding.
The SAS program code is presented in Exhibit 5.10 and is included on the DVD under the name EXAMPLE1.SAS. The results obtained from this program are displayed in Exhibit 5.11. We have included as part of the program the corresponding value labels and format statements so that the different categories or groups are labeled appropriately.
Note that one of the steps in this program is to select only those eighth grade students who have non-missing data in the variable of interest BSBGREBO.
In general, to perform student-level analyses of this type using the Student Background data files, you should do the following:
• Identify the variables of interest in the Student Background files and note any specific national adaptations to the variables.
• Retrieve the relevant variables from the Student Background files, including the sampling weights, the Jackknife replication information, and any other variables used in the selection of cases.
• Use the macro JACKGEN with the appropriate arguments and parameters.
• Print out the results file.

TIMSS 2003 International Database User Guide 5-37
Exhibit 5.10 SAS Control Statements for Performing Student-Level Analyses without Plausible Values (EXAMPLE1.SAS)
libname bm3 “D:\TIMSS2003\Data\SAS_Data” ;
%include “D:\TIMSS2003\Programs\SAS_Programs\jackgen.sas” ;
data student1 ; set bm3.BSGALLM3; where nmiss(BSBGREBO) = 0; select (BSBGREBO); when (1) BSBGREBO = 0; * No time ; when (2) BSBGREBO = 0.5; * Less than 1 hour; when (3) BSBGREBO = 1.5; * 1 - 2 hours; when (4) BSBGREBO = 3; * More than 2 but less than 4 hours; when (5) BSBGREBO = 4.5; * 4 or more hours; otherwise BSBGREBO = .; end;
proc format library=work ;value country 51 = ‘ARMENIA’ 36 = ‘AUSTRALIA’ 956 = ‘BELGIUM FLEMISH’ 100 = ‘BULGARIA’ 48 = ‘BAHRAIN’ 72 = ‘BOTSWANA’ 9132 = ‘CANADA ONTARIO’ 9133 = ‘CANADA QUEBEC’ 152 = ‘CHILE’ 196 = ‘CYPRUS’ 818 = ‘EGYPT’ 926 = ‘ENGLAND’ 3724 = ‘BASQUE’ 233 = ‘ESTONIA’ 288 = ‘GHANA’ 344 = ‘HONG KONG’ 348 = ‘HUNGARY’ 360 = ‘INDONESIA’ 364 = ‘IRAN’ 376 = ‘ISRAEL’ 380 = ‘ITALY’ 400 = ‘JORDAN’ 392 = ‘JAPAN’ 410 = ‘KOREA’ 422 = ‘LEBANON’ 440 = ‘LITHUANIA’ 428 = ‘LATVIA’ 504 = ‘MOROCCO’ 498 = ‘MOLDOVA’ 807 = ‘MACEDONIA’ 458 = ‘MALAYSIA’ 528 = ‘NETHERLANDS’ 578 = ‘NORWAY’ 554 = ‘NEW ZEALAND’ 275 = ‘PALESTINE’ 608 = ‘PHILIPPINES’ 642 = ‘ROMANIA’ 643 = ‘RUSSIAN FEDERATION’ 682 = ‘SAUDI ARABIA’ 927 = ‘SCOTLAND’ 702 = ‘SINGAPORE’ 703 = ‘SLOVAK REPUBLIC’ 705 = ‘SLOVENIA’ 752 = ‘SWEDEN’ 760 = ‘SYRIA’ 788 = ‘TUNISIA’ 158 = ‘CHINESE TAIPEI’ 840 = ‘UNITED STATES’ 887 = ‘YEMEN’ 891 = ‘SERBIA AND MONTENEGRO’ 710 = ‘SOUTH AFRICA’ 11800 = ‘INDIANA US’;
%JackGen (TOTWGT, jkzone, jkrep, 75, IDCNTRY, BSBGREBO, student1) ;
* Print the results ; proc print data=final noobs ; var IDCNTRY n TOTWGT mnx mnx_se pct pct_se ; format IDCNTRY country. n 6.0 TOTWGT 10.0 mnx pct mnx_se pct_se 6.2 ;
run ;

TIMSS 2003 International Database User Guide5-38
Exhibit 5.11 Extract of SAS Computer Output for Performing Student-Level Analyses without Plausible Values (EXAMPLE 1)
IDCNTRY N TOTWGT mnx mnx_se pct pct_se
AUSTRALIA 4609 248940 0.69 0.02 1.29 0.04BAHRAIN 4051 10177 0.89 0.02 0.05 0.00ARMENIA 4697 45299 1.59 0.03 0.23 0.01BOTSWANA 4665 32840 1.79 0.03 0.17 0.00BULGARIA 3842 81651 0.74 0.03 0.42 0.01CHILE 6291 261935 0.62 0.01 1.36 0.03CHINESE TAIPEI 5363 296886 1.03 0.02 1.54 0.03CYPRUS 3790 8720 0.93 0.02 0.05 0.00ESTONIA 3903 20266 0.68 0.02 0.10 0.00PALESTINE 5158 62339 0.98 0.02 0.32 0.01GHANA 4524 243471 1.75 0.03 1.26 0.05HONG KONG 4914 81716 1.06 0.02 0.42 0.01HUNGARY 3200 97457 0.80 0.02 0.50 0.01INDONESIA 5452 2186548 1.06 0.02 11.32 0.24IRAN 4815 1332910 1.00 0.02 6.90 0.15ISRAEL 4076 81016 0.90 0.02 0.42 0.01ITALY 4229 562078 0.68 0.02 2.91 0.05JAPAN 4801 1255020 0.86 0.02 6.50 0.06JORDAN 4257 91377 0.85 0.02 0.47 0.01KOREA 5266 566354 0.62 0.01 2.93 0.05LEBANON 3467 52587 1.05 0.02 0.27 0.01LATVIA 3524 32618 0.78 0.03 0.17 0.00LITHUANIA 4383 41668 0.57 0.02 0.22 0.01MALAYSIA 5278 411531 1.15 0.02 2.13 0.05MOLDOVA 3875 59224 1.12 0.03 0.31 0.01MOROCCO 2540 176187 1.32 0.03 0.91 0.03NETHERLANDS 2861 176429 0.50 0.02 0.91 0.03NEW ZEALAND 3595 54534 0.72 0.03 0.28 0.01NORWAY 3977 59045 0.64 0.02 0.31 0.01PHILIPPINES 6754 1362283 1.22 0.02 7.05 0.17ROMANIA 3917 280384 0.96 0.03 1.45 0.03RUSSIAN FEDERATION 4499 1853726 1.13 0.03 9.60 0.41SAUDI ARABIA 4059 309671 0.91 0.02 1.60 0.07SINGAPORE 5980 52964 0.89 0.02 0.27 0.00SLOVAK REPUBLIC 4150 74563 0.86 0.02 0.39 0.01SLOVENIA 3498 22485 0.82 0.02 0.12 0.00SOUTH AFRICA 8133 708468 1.60 0.03 3.67 0.09SWEDEN 4071 104366 0.63 0.02 0.54 0.01TUNISIA 4680 174690 1.30 0.02 0.90 0.01MACEDONIA 3523 23466 1.00 0.02 0.12 0.00EGYPT 6479 1216237 1.00 0.02 6.30 0.13UNITED STATES 8671 3359064 0.69 0.01 17.39 0.25SERBIA AND MONTENEGRO 4024 82070 0.76 0.02 0.42 0.01ENGLAND 2631 616594 0.53 0.02 3.19 0.10SCOTLAND 3396 56784 0.59 0.02 0.29 0.01BELGIUM FLEMISH 4849 68852 0.47 0.01 0.36 0.01BASQUE 2470 18394 0.70 0.02 0.10 0.00CANADA ONTARIO 4074 141318 0.80 0.02 0.73 0.03CANADA QUEBEC 4253 78813 0.59 0.02 0.41 0.01INDIANA US 2144 74604 0.69 0.03 0.39 0.01
In this example, each country’s mean value for BSBGREBO is reported for the eighth grade. The results are presented by country. The countries are identified in the first column and the second column reports the number of valid cases. The third column reports the sum of weights of these students, followed by the mean for BSBGREBO and its respective standard error. The last two columns
TIMSS 2003 International Database User Guide 5-39
report the weighted percentages of students in the population and their respective standard errors.
From the first line in Exhibit 5.11, we can say that in Australia valid data were available for 4,609 cases. These sampled students represent a population of 248,940 students. Australian students spend, on average, 0.69 hours reading for enjoyment before or after school. The standard error of this mean is 0.02.
Example of Student-Level Analysis with Plausible Values
In this second example, we wish to replicate another one of the results presented in the international reports. We are interested in looking at the eighth graders’ reports on the number of books in their home and their science achievement. These results, originally presented in Exhibit 4.4 of the TIMSS 2003 International Science Report, are reproduced in Exhibit 5.12. Since the results in this Exhibit are based on plausible values, we need to use the macro JACKPV.

TIMSS 2003 International Database User Guide5-40
Exhibit 5.12 Sample Exhibit for Student-Level Analysis with Plausible Values Taken From the
TIMSS 2003 International Science Report (Exhibit 4.4)
������� �� ����� ��� ����� �� ����� ��� �������������� �� ����� ��� ����� � ����� ��� ������������ �� ����� ��� ����� �� ����� ��� ���������������������� �� ����� ��� ����� �� ����� ��� ������������� �� ����� ��� ����� �� ����� ��� ������������� �� ����� ��� ����� �� ����� ��� ����������� �� ����� ��� ����� �� ����� ��� ������������������� �� ����� ��� ����� �� ����� ��� ����������� �� ����� ��� ����� �� ����� ��� ���������� �� ����� ��� ����� �� ����� ��� ������������ �� ����� ��� ����� � ����� ��� ���������� �� ����� ��� ����� �� ����� ��� ������������������� �� ����� ��� ����� �� ����� ��� ������������ �� ����� ��� ����� � ����� ��� �������������� �� ����� ��� ����� �� ����� ��� �������������������������� �� ����� ��� ����� �� ����� ��� ����������� �� ����� ��� ����� � ����� ��� ���������� �� ����� ��� ����� �� ����� ��� ���������� �� ����� ��� ����� �� ����� ��� ����������� �� ����� ��� ����� �� ����� ��� ������������������� �� ����� ��� ����� �� ����� ��� ����������� �� ����� ��� ����� � ����� ��� ������������ �� ����� ��� ����� �� ����� ��� �������������� �� ����� ��� ����� �� ����� ��� ����������������������� �� ����� ��� ����� �� ����� ��� ������������� �� ����� ��� ����� �� ����� ��� ��������������������� �� ����� ��� ����� �� ����� ��� ������������ �� ����� ��� ����� �� ����� ��� ���������������� �� ����� ��� ����� �� ����� ��� ���������������� �� ����� ��� ����� � ����� ��� ����������� �� ����� ��� ����� � ����� ��� ���������������������������� �� ����� ��� ����� �� ����� ��� ���������������� �� ����� ��� ����� �� ����� ��� ������������ �� ����� ��� ����� �� ����� ��� ����������������������� �� ����� ��� ����� � ����� ��� ����������������� �� ����� ��� ����� �� ����� ��� ������������� �� ����� ��� ����� �� ����� ��� ����������� �� ����� ��� ����� �� ����� ��� �������������� �� ����� ��� ����� �� ����� ��� �������������������� �� ����� ��� ����� � ����� ��� ������������� �� ����� ��� ����� � ����� ��� ����������������� �� ����� ��� ����� �� ����� ��� ����������� �� ����� ��� ����� � ����� ��� ������������ �� ����� ��� ����� �� ����� ��� ������������������ �� ����� ��� ����� �� ����� ��� �����
� ������� �� ����� ��� ����� �� ����� ��� ����������������������� �� ����� ��� ����� �� ����� ��� �����
���������������������������������������������� �� ����� ��� ����� � ����� ��� ���������������������� �� ����� ��� ����� �� ����� ��� ��������������������������� �� ����� ��� ����� � ����� ��� �������������������������� �� ����� ��� ����� �� ����� ��� �����
����������� ����������
���������
������������������
������������������
������������������
������������������
������� �� ����� ��� ����� �� ����� ��� ����� �� ����� ��� �������������� �� ����� ��� ����� �� ����� ��� ����� �� ����� ��� ������������ �� ����� ��� ����� �� ����� ��� ����� �� ����� ��� ���������������������� �� ����� ��� ����� �� ����� ��� ����� �� ����� ��� ������������� � ����� ��� ������ � ����� ��� ����� �� ����� ��� ������������� �� ����� ��� ����� �� ����� ��� ����� �� ����� ��� ���������� � ����� ��� ����� � ����� ��� ����� �� ����� ��� ������������������� �� ����� ��� ����� �� ����� ��� ����� �� ����� ��� ����������� �� ����� ��� ����� �� ����� ��� ����� �� ����� ��� ���������� � ����� ��� ����� � ����� ��� ����� �� ����� ��� ������������ �� ����� ��� ����� �� ����� ��� ����� �� ����� ��� ���������� �� ����� ��� ������ � ����� ��� ������ �� ����� ��� ������������������� � ����� ��� ����� � ����� ��� ����� �� ����� ��� ������������ �� ����� ��� ����� �� ����� ��� ����� �� ����� ��� �������������� � ����� � � � ����� ��� ����� �� ����� ��� �������������������������� � ����� ��� ����� � ����� ��� ����� �� ����� ��� ����������� �� ����� ��� ����� �� ����� ��� ����� �� ����� ��� ���������� �� ����� ��� ����� �� ����� ��� ����� �� ����� ��� ���������� �� ����� ��� ����� �� ����� ��� ����� �� ����� ��� ����������� � ����� ��� ����� � ����� ��� ����� �� ����� ��� ������������������� �� ����� ��� ����� �� ����� ��� ����� �� ����� ��� ����������� �� ����� ��� ����� �� ����� ��� ����� �� ����� ��� ������������ � ����� ��� ����� � ����� ��� ����� �� ����� ��� �������������� �� ����� ��� ����� �� ����� ��� ����� �� ����� ��� ����������������������� � ����� ��� ����� � ����� ��� ����� �� ����� ��� ������������� � ����� ��� ����� � ����� ��� ����� �� ����� ��� ��������������������� � ����� ��� ����� � ����� ��� ����� �� ����� ��� ������������ � ����� ��� ������ � ����� ��� ����� �� ����� ��� ���������������� �� ����� ��� ����� �� ����� ��� ����� �� ����� ��� ���������������� �� ����� ��� ����� �� ����� ��� ����� �� ����� ��� ����������� �� ����� ��� ����� �� ����� ��� ����� �� ����� ��� ���������������������������� � ����� ��� ����� � ����� ��� ����� �� ����� ��� ���������������� � ����� ��� ������ � ����� ��� ������ �� ����� ��� ������������ �� ����� ��� ����� �� ����� ��� ����� �� ����� ��� ����������������������� �� ����� ��� ����� �� ����� ��� ����� �� ����� ��� ����������������� �� ����� ��� ����� � ����� ��� ����� �� ����� ��� ������������� �� ����� ��� ����� �� ����� ��� ����� �� ����� ��� ����������� � ����� ��� ����� � ����� ��� ����� �� ����� ��� �������������� �� ����� ��� ����� �� ����� ��� ����� �� ����� ��� �������������������� �� ����� ��� ����� �� ����� ��� ����� �� ����� ��� ������������� �� ����� ��� ����� �� ����� ��� ����� �� ����� ��� ����������������� � ����� ��� ������ � ����� ��� ������ �� ����� ��� ������������ �� ����� ��� ����� �� ����� ��� ����� �� ����� ��� ������������ � ����� ��� ����� � ����� ��� ����� �� ����� ��� ������������������ �� ����� ��� ����� �� ����� ��� ����� �� ����� ��� �����
� ������� �� ����� ��� ����� �� ����� ��� ����� �� ����� ��� ����������������������� �� ����� ��� ����� �� ����� ��� ����� �� ����� ��� �����
���������������������������������������������� �� ����� ��� ����� �� ����� ��� ����� �� ����� ��� ���������������������� �� ����� ��� ����� �� ����� ��� ����� �� ����� ��� ��������������������������� �� ����� ��� ����� �� ����� ��� ����� �� ����� ��� �������������������������� �� ����� ��� ����� �� ����� ��� ����� �� ����� ��� �����
������������������� ������������� ������������
������������������
������������������
���������
������������������
������������������
������������������
������������������
To replicate the results in this exhibit, we need to undertake several steps. After reviewing the codebooks and the questionnaire information, we observe that the variable BSBGBOOK contains information on the number of books in the home (see Supplement 1 for a copy of the student background questionnaire), and this variable is found in the Student Background data file. Our next step is to review the documentation of national adaptations to the questionnaires to ensure that there were no deviations listed for this variable (see Supplement 2). If no national adaptations were made, we can continue with our analysis without any modifications.

TIMSS 2003 International Database User Guide 5-41
We then proceed to read from the Student Background file our variable of interest (BSBGBOOK), the science achievement plausible values (BSSSCI01-BSSSCI05), the student sampling weight (TOTWGT ), the variables that contain the jackknife replication information (JKZONE and JKREP), and the variable containing the country identification code (IDCNTRY). In this analysis, we will again use the data for all available countries, although the exact same steps need to be taken if you want to examine these variables within a single country, or for a select group of countries.
The SAS program code is presented in Exhibit 5.13 and is included on the DVD under the name EXAMPLE2.SAS. Selected results obtained from this program are displayed in Exhibit 5.14. We have included as part of the program the corresponding value labels and format statements so that the different categories or groups are labeled appropriately.
Note that one of the steps in this program is to select only those eighth grade students who have non-missing data in the variable of interest BSBGBOOK.
In general, to perform student-level analyses involving plausible values and using the Student Background data files, you should do the following:
• Identify the variables of interest in the Student Background file and note any specific national adaptations to the variables.
• Retrieve the relevant variables from the Student Background files, including the achievement scores, sampling weights, the Jackknife replication information, and any other variables used in the selection of cases.
• Use the macro JACKPV with the appropriate arguments and parameters.
• Print out the results file.

TIMSS 2003 International Database User Guide5-42
Exhibit 5.13 SAS Control Statements for Performing Student-Level Analyses with Plausible Values (EXAMPLE2.SAS)
libname bm3 “D:\TIMSS2003\Data\SAS_Data” ;
%include “D:\TIMSS2003\Programs\SAS_Programs\JackPV.sas” ;
data student2 ; set bm3.BSGALLM3; where nmiss(BSBGBOOK) = 0 ;
proc format library=work ; value country 51 = ‘ARMENIA’ 36 = ‘AUSTRALIA’ 956 = ‘BELGIUM FLEMISH’ 100 = ‘BULGARIA’ 48 = ‘BAHRAIN’ 72 = ‘BOTSWANA’ 9132 = ‘CANADA ONTARIO’ 9133 = ‘CANADA QUEBEC’ 152 = ‘CHILE’ 196 = ‘CYPRUS’ 818 = ‘EGYPT’ 926 = ‘ENGLAND’ 3724 = ‘BASQUE’ 233 = ‘ESTONIA’ 288 = ‘GHANA’ 344 = ‘HONG KONG’ 348 = ‘HUNGARY’ 360 = ‘INDONESIA’ 364 = ‘IRAN’ 376 = ‘ISRAEL’ 380 = ‘ITALY’ 400 = ‘JORDAN’ 392 = ‘JAPAN’ 410 = ‘KOREA’ 422 = ‘LEBANON’ 440 = ‘LITHUANIA’ 428 = ‘LATVIA’ 504 = ‘MOROCCO’ 498 = ‘MOLDOVA’ 807 = ‘MACEDONIA’ 458 = ‘MALAYSIA’ 528 = ‘NETHERLANDS’ 578 = ‘NORWAY’ 554 = ‘NEW ZEALAND’ 275 = ‘PALESTINE’ 608 = ‘PHILIPPINES’ 642 = ‘ROMANIA’ 643 = ‘RUSSIAN FEDERATION’ 682 = ‘SAUDI ARABIA’ 927 = ‘SCOTLAND’ 702 = ‘SINGAPORE’ 703 = ‘SLOVAK REPUBLIC’ 705 = ‘SLOVENIA’ 752 = ‘SWEDEN’ 760 = ‘SYRIA’ 788 = ‘TUNISIA’ 158 = ‘CHINESE TAIPEI’ 840 = ‘UNITED STATES’ 887 = ‘YEMEN’ 891 = ‘SERBIA AND MONTENEGRO’ 710 = ‘SOUTH AFRICA’ 11800 = ‘INDIANA US’;
value books 1 = ‘None or very few (0-10)’ 2 = ‘For 1 shelf (11-25)’ 3 = ‘For 1 bookcase (26-100)’ 4 = ‘For 2 bookcases (101-200)’ 5 = ‘For 3 or more bookcases (>200)’ ;
%JackPV (TOTWGT, jkzone, jkrep, 75, IDCNTRY BSBGBOOK, BSSSCI0, 5, student2) ;
* Print the results ; proc print data=final noobs ; var IDCNTRY BSBGBOOK n TOTWGT mnpv mnpv_se pct pct_se ; format IDCNTRY country. BSBGBOOK books. n 6.0 TOTWGT 10.0 mnpv mnpv_se pct pct_se 6.2 ;
run ;

TIMSS 2003 International Database User Guide 5-43
Exhibit 5.14 Extract of SAS Computer Output for Performing Student-Level Analyses with Plausible Values (EXAMPLE 2)
IDCNTRY BSBGBOOK N TOTWGT mnpv mnpv_se pct pct_se
ARMENIA None or very few (0-10) 798 8025 433.20 5.17 15.14 0.94 For 1 shelf (11-25) 1246 12595 453.07 4.75 23.77 0.87 For 1 bookcase (26-100) 1621 14899 467.14 3.59 28.12 0.71 For 2 bookcases (101-200) 781 7047 474.69 4.21 13.30 0.64 For 3 or more bookcases (>200) 1112 10426 478.40 5.06 19.67 1.00
AUSTRALIA None or very few (0-10) 248 13527 463.86 8.67 5.38 0.50 For 1 shelf (11-25) 477 27603 493.11 5.77 10.98 0.77 For 1 bookcase (26-100) 1369 74730 516.78 4.82 29.72 0.96 For 2 bookcases (101-200) 1104 57620 540.00 3.38 22.92 0.82 For 3 or more bookcases (>200) 1465 77934 553.16 4.09 31.00 1.38
.
.
.
NORWAY None or very few (0-10) 247 3959 441.31 7.04 6.59 0.41 For 1 shelf (11-25) 453 6815 462.59 4.58 11.35 0.60 For 1 bookcase (26-100) 1307 19661 492.55 3.05 32.74 0.86 For 2 bookcases (101-200) 902 13223 504.34 2.80 22.02 0.69 For 3 or more bookcases (>200) 1144 16393 514.52 2.63 27.30 1.15
UNITED STATES None or very few (0-10) 1157 436292 468.96 4.62 12.82 0.58 For 1 shelf (11-25) 1619 623310 493.21 3.28 18.32 0.59 For 1 bookcase (26-100) 2441 936415 526.81 2.90 27.52 0.62 For 2 bookcases (101-200) 1573 603150 552.40 3.41 17.73 0.50 For 3 or more bookcases (>200) 2010 803597 568.95 3.65 23.62 0.90
In this example, each country’s eighth grade mean science achievement is reported for each response category in the variable BSBGBOOK. The results are presented by country and each value of the variable BSBGBOOK. The countries and the five response options are presented in the first and second columns. The third column reports the number of valid cases. The fourth column reports the sum of weights of these students, followed by the mean science achievement based on the five plausible values and its respective standard error. The last two columns report the weighted percentages of students within each category and their respective standard errors.
From the first few lines in Exhibit 5.14, we can say that in Armenia the 1,112 students (19.67%) who reported having more than 200 books have a mean science achievement of 478.40 with a standard error of 5.06; while the 798 students (15.14%) who reported having none or very few books (0-10) have a mean science achievement of 433.20 with a standard error of 5.17.

TIMSS 2003 International Database User Guide5-44
5.9 Performing Analyses with Teacher-Level Variables
The TIMSS 2003 teachers do not constitute representative samples of teachers. Rather, they are the teachers for nationally representative samples of students. Therefore, it is appropriate that statements about the teachers be made only in terms of how many students are taught by teachers of one kind or another, and not in terms of how many teachers in a country have one attribute or another.
When analyzing teacher data, it is first necessary to link the students with their respective teachers. Each eighth grade student record in the Student Background file can link to as many as six different teachers in the Teacher Background file. There are usually fewer student-teacher links at the fourth grade. To facilitate the linking between students and their teachers, the Student-Teacher Linkage file was created and is part of the International Database. This file is called BST<COUNTRY>M3 for the eighth grade and AST<COUNTRY>M3 for the fourth grade. The Student-Teacher Linkage file contains one record for each student-teacher combination, with the appropriate identification variables.
Each record in the Student-Teacher Linkage file also contains the number of mathematics and science teachers for the student and a set of weights that can be used when conducting analyses with these data. Student achievement plausible values, sampling weights, and Jackknife replication information have been added to the Student-Teacher Linkage file in order to simplify the merging process for analyses that link teacher variables to student achievement. For such analyses, it is necessary to merge only the Teacher Background file with the Student-Teacher Linkage file. For analyses linking teacher variables to other student variables, it is also necessary to merge the Student Background file with the Teacher Background file after it has been combined with the Student-Teacher Linkage file.
Conducting analyses with teacher data requires some extra steps. As our third example, we will investigate the age of the science teachers who teach the eighth grade students in each of the TIMSS countries. In particular, we will investigate the percentage of eighth grade students who are taught by teachers from specified age groups (BTBGAGE), and the mean science achievement of these students taught by those teachers. The results are found in the Science Teacher Background Data Almanac (BSALM7_M3) for questionnaire item TQS2-1, as shown in Exhibits 5.15 and 5.16. The percentages also appear in Exhibit 6.3 of the TIMSS 2003 International Science Report.

TIMSS 2003 International Database User Guide 5-45
Exhibit 5.15 Sample Data Almanac Sheet for Teacher-Level Analysis (Percentages)
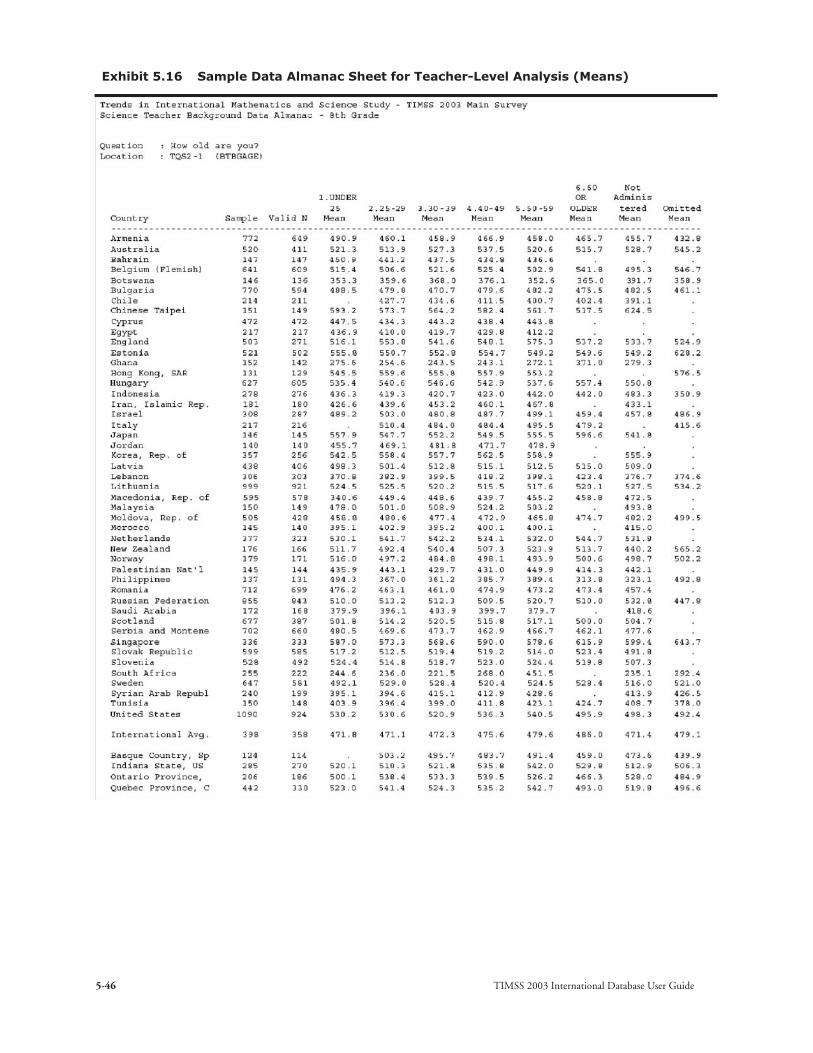
TIMSS 2003 International Database User Guide5-46
Exhibit 5.16 Sample Data Almanac Sheet for Teacher-Level Analysis (Means)

TIMSS 2003 International Database User Guide 5-47
As before, we first proceed to identify the variables relevant to the analysis in the appropriate files, and review the documentation on any specific national adaptations to the questions of interest (Supplements 1 and 2). Since we are using teacher-level variables, we need to look in the teacher file and the Student-Teacher Linkage file to find the variables. From the teacher file, we will need the variable that contains the information on the science teachers’ age (BTBGAGE), the variable that identifies the country (IDCNTRY), and the two variables that will allow us to link the teacher information to the student data (IDTEACH and IDLINK).
For the eighth grade, there is one teacher file for the mathematics teachers and a second teacher file for the science teachers. If you want to look only at mathematics teachers, then you will need to use the mathematics teacher file (BTM<COUNTRY>M3); if your interest is in the science teachers then you will need to use the science teacher file (BTS<COUNTRY>M3); but if your interest is in the mathematics and science teachers combined, both these files need to be combined by adding one file to the other. In doing so, it is important to keep in mind that although there are variables in common between these two files, most of them are not.
In our example, our teacher variable of interest (BTBGAGE) is a categorical variable with six categories. However, we want to categorize the teachers into four groups: less than 30 years old, 30-39 years old, 40-49 years old, and 50 years or older. When reading the teacher file, we will use SAS commands to collapse the six values into four categories and label them accordingly. We then proceed to read the necessary information from the Student-Teacher Linkage file. From this file we need the country identification (IDCNTRY) and the two variables that will allow us to link the student information to the teacher data (IDTEACH and IDLINK). We also need the science achievement plausible values (BSSSCI01-BSSSCI05), and the jackknife replication information (JKZONE and JKREP). We need to use the weight variable appropriate for science teacher variables (SCIWGT). If you are investigating the mathematics teachers, then the weight variable MATWGT should be used; if you are interested in analyzing mathematics and science teachers combined, the weight variable TCHWGT should be used.
The two files are merged into one file that will then be used with the JACKPV macro. These two files are merged using the variables IDCNTRY, IDTEACH, and IDLINK. The combination of values for these three variables is unique within the teacher data, but is repeated in the Student-Teacher Linkage file as many times as the specific teacher teaches students in a class. After the files are merged, the macro JACKPV is used and the results can be printed.
In this analysis, we will again use the eighth grade data for all available countries, although the exact same steps need to be taken if you want to examine these variables within a single country, or for a select group of countries. We used

TIMSS 2003 International Database User Guide5-48
the JOIN program, described earlier in this chapter, to join the Science Teacher Background files for all available countries into a single Science Teacher Background file called BTSALLM3. The JOIN program was used a second time to join all the Student-Teacher Linkage files into a single one called BSTALLM3.
The SAS program code for this example is presented in Exhibit 5.17 and is included on the DVD under the name EXAMPLE3.SAS. Selected results obtained from this program are displayed in Exhibit 5.18. In this program, the variable TCHAGE is created by collapsing the categorical variable BTBGAGE into only four categories.
Note that one of the steps in this program is to select only those science teachers who have non-missing data in the variable of interest TCHAGE.
In general, to perform teacher-level analyses using the Teacher Background data files, you should do the following:
• Identify the variables of interest in the appropriate Teacher Background files and note any specific national adaptations to the variables.
• Retrieve the relevant variables from the Teacher Background files. If you are investigating mathematics and science teachers combined, then the files for these teachers need to be added to each other.
• Retrieve the relevant variables from the Student-Teacher Linkage files. This includes the country and teacher identification information (IDCNTRY, IDTEACH, and IDLINK), the achievement scores, the Jackknife replication information, and the appropriate sampling weights. If the analysis is to be based on mathematics teachers only, then the weight variable to use is MATWGT. If the analysis is to be based on the science teachers only, then the weight variable to be used is SCIWGT. If the analysis is to be based on the science and mathematics teachers combined, then the weight variable to be used is TCHWGT.
• Merge the Teacher Background files with the Student-Teacher Linkage files using the variables IDCNTRY, IDTEACH and IDLINK.
• Use the macro JACKGEN, or JACKPV if plausible values are involved, with the appropriate arguments and parameters.
• Print out the results file.
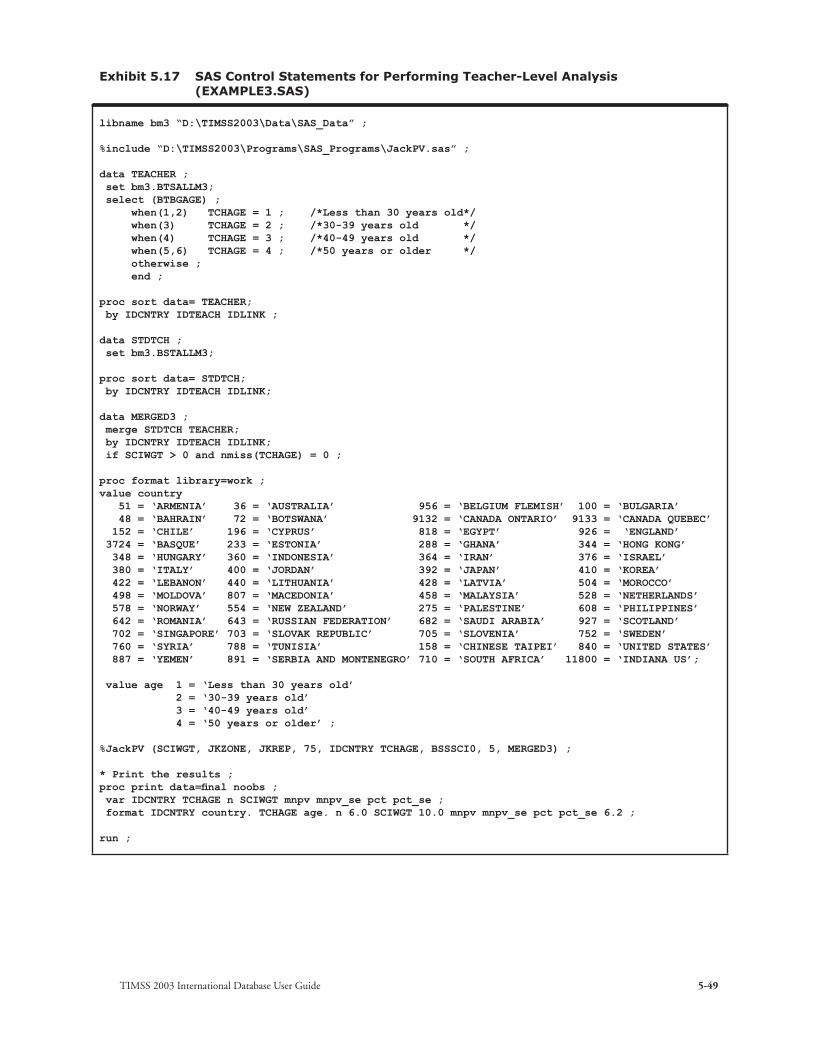
TIMSS 2003 International Database User Guide 5-49
libname bm3 “D:\TIMSS2003\Data\SAS_Data” ;
%include “D:\TIMSS2003\Programs\SAS_Programs\JackPV.sas” ;
data TEACHER ; set bm3.BTSALLM3; select (BTBGAGE) ; when(1,2) TCHAGE = 1 ; /*Less than 30 years old*/ when(3) TCHAGE = 2 ; /*30-39 years old */ when(4) TCHAGE = 3 ; /*40-49 years old */ when(5,6) TCHAGE = 4 ; /*50 years or older */ otherwise ; end ;
proc sort data= TEACHER; by IDCNTRY IDTEACH IDLINK ;
data STDTCH ; set bm3.BSTALLM3;
proc sort data= STDTCH; by IDCNTRY IDTEACH IDLINK;
data MERGED3 ; merge STDTCH TEACHER; by IDCNTRY IDTEACH IDLINK; if SCIWGT > 0 and nmiss(TCHAGE) = 0 ;
proc format library=work ;value country 51 = ‘ARMENIA’ 36 = ‘AUSTRALIA’ 956 = ‘BELGIUM FLEMISH’ 100 = ‘BULGARIA’ 48 = ‘BAHRAIN’ 72 = ‘BOTSWANA’ 9132 = ‘CANADA ONTARIO’ 9133 = ‘CANADA QUEBEC’ 152 = ‘CHILE’ 196 = ‘CYPRUS’ 818 = ‘EGYPT’ 926 = ‘ENGLAND’ 3724 = ‘BASQUE’ 233 = ‘ESTONIA’ 288 = ‘GHANA’ 344 = ‘HONG KONG’ 348 = ‘HUNGARY’ 360 = ‘INDONESIA’ 364 = ‘IRAN’ 376 = ‘ISRAEL’ 380 = ‘ITALY’ 400 = ‘JORDAN’ 392 = ‘JAPAN’ 410 = ‘KOREA’ 422 = ‘LEBANON’ 440 = ‘LITHUANIA’ 428 = ‘LATVIA’ 504 = ‘MOROCCO’ 498 = ‘MOLDOVA’ 807 = ‘MACEDONIA’ 458 = ‘MALAYSIA’ 528 = ‘NETHERLANDS’ 578 = ‘NORWAY’ 554 = ‘NEW ZEALAND’ 275 = ‘PALESTINE’ 608 = ‘PHILIPPINES’ 642 = ‘ROMANIA’ 643 = ‘RUSSIAN FEDERATION’ 682 = ‘SAUDI ARABIA’ 927 = ‘SCOTLAND’ 702 = ‘SINGAPORE’ 703 = ‘SLOVAK REPUBLIC’ 705 = ‘SLOVENIA’ 752 = ‘SWEDEN’ 760 = ‘SYRIA’ 788 = ‘TUNISIA’ 158 = ‘CHINESE TAIPEI’ 840 = ‘UNITED STATES’ 887 = ‘YEMEN’ 891 = ‘SERBIA AND MONTENEGRO’ 710 = ‘SOUTH AFRICA’ 11800 = ‘INDIANA US’;
value age 1 = ‘Less than 30 years old’ 2 = ‘30-39 years old’ 3 = ‘40-49 years old’ 4 = ‘50 years or older’ ;
%JackPV (SCIWGT, JKZONE, JKREP, 75, IDCNTRY TCHAGE, BSSSCI0, 5, MERGED3) ;
* Print the results ; proc print data=final noobs ; var IDCNTRY TCHAGE n SCIWGT mnpv mnpv_se pct pct_se ; format IDCNTRY country. TCHAGE age. n 6.0 SCIWGT 10.0 mnpv mnpv_se pct pct_se 6.2 ;
run ;
Exhibit 5.17 SAS Control Statements for Performing Teacher-Level Analysis (EXAMPLE3.SAS)

TIMSS 2003 International Database User Guide5-50
Exhibit 5.18 Extract of SAS Computer Output Performing Teacher-Level Analysis (EXAMPLE 3)
IDCNTRY TCHAGE N SCIWGT mnpv mnpv_se pct pct_se
ARMENIA Less than 30 years old 1778 4392 467.22 7.48 9.78 1.45 30-39 years old 5162 12146 458.93 5.20 27.04 2.02 40-49 years old 6475 16006 466.90 4.12 35.64 2.26 50 years or older 5174 12369 460.08 4.29 27.54 1.74
AUSTRALIA Less than 30 years old 1035 49869 515.66 7.05 23.34 3.25 30-39 years old 1110 48223 527.35 5.88 22.57 2.52 40-49 years old 1309 70160 537.52 6.81 32.84 3.77 50 years or older 866 45374 520.17 8.89 21.24 3.21
.
.
.
NORWAY Less than 30 years old 726 10478 498.21 5.74 17.96 3.26 30-39 years old 1030 14363 484.85 5.26 24.62 3.35 40-49 years old 856 12658 498.10 5.33 21.70 3.32 50 years or older 1337 20832 494.52 3.21 35.71 4.36
UNITED STATES Less than 30 years old 1090 448839 530.54 6.15 14.88 2.28 30-39 years old 1932 702160 520.86 6.74 23.29 2.44 40-49 years old 2375 945533 536.32 5.75 31.36 3.14 50 years or older 2378 918958 535.40 6.17 30.47 2.92
In this example, each country’s eighth grade mean science achievement is reported for each response category in the variable TCHAGE. The results are presented by country and each value of the variable TCHAGE. The countries and the four age groups are presented in the first and the second columns. The third column reports the number of valid cases. The fourth column reports the sum of weights of these students, followed by the mean science achievement based on the five plausible values and its respective standard error. The last two columns report the weighted percentages of students within each teacher age group and their respective standard errors.
From the first few lines of Exhibit 5.18, we can say that in Armenia the 1,778 students (9.78%) with teachers less than 30 years old have a mean science achievement of 467.22 with a standard error of 7.48; while the 5,174 students (27.54%) with teachers 50 years or older have a mean science achievement of 460.08 with a standard error of 4.29.

TIMSS 2003 International Database User Guide 5-51
5.10 Performing Analyses with School-Level Variables
TIMSS 2003 has representative samples of schools and so it is possible to compute weighted numbers of schools with particular characteristics for providing reasonable estimates of percentages and averages across primary or middle schools in each country. However, the school samples were designed to optimize the student samples and the student-level estimates. For this reason, it is preferable to analyze school-level variables as attributes of students, rather than as elements in their own right. The following example describes school-level analyses based on student-weighted data.
For student-weighted analyses, the school-level data are analyzed to make statements about the number of students attending schools with one characteristic or another, rather than the number of schools with one characteristic or another. When school-level variables are analyzed, we recommend that you merge the selected school-level variables with the student-level file, and then use the sampling and weight information contained in the student-level file to make the desired statements. The example presented in this section describes how this can be accomplished using SAS.
As our fourth example, we wish to investigate the percentage of eighth grade students who attend schools in areas of different population sizes (BCBGCOMU), and their mean science achievement. The results are found in the School Background Data Almanac by Science Achievement (BSALM4_M3) for questionnaire item SCQ2-3, as shown in Exhibits 5.19 and 5.20.

TIMSS 2003 International Database User Guide5-52
Exhibit 5.19 Sample Data Almanac Sheet for School-Level Analysis (Percentages)
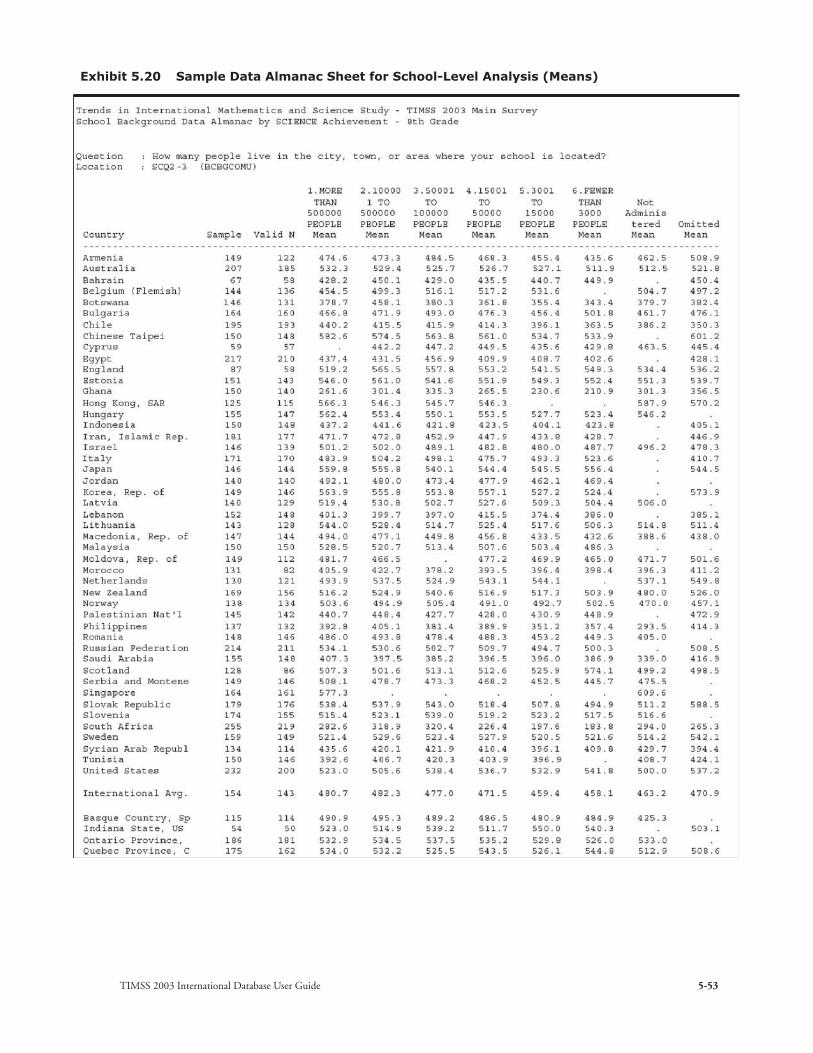
TIMSS 2003 International Database User Guide 5-53
Exhibit 5.20 Sample Data Almanac Sheet for School-Level Analysis (Means)
TIMSS 2003 International Database User Guide5-54
The first step in our analysis is to identify the variables of interest in the appropriate files and review the documentation on specific national adaptations to the questions of interest (Supplements 1 and 2). We observe that the variable BCBGCOMU in the School Background file contains information on the size of the community where the schools are located. Our next step is to review the documentation of national adaptations to the questionnaires to ensure that there were no deviations listed for this variable (see Supplement 2). If no adaptations were made, we can continue with our analysis without any modifications.
We then read from the School Background file the variables relevant to our analysis. In this case, we will need our variable of interest (BCBGCOMU) and the country and school identification information (IDCNTRY and IDSCHOOL). These last two variables will allow us to merge the school data to the student data. We then read the variables of interest from the Student Background file. We will need the country and school identification information (IDCNTRY and IDSCHOOL), which will allow us to merge the student data to the school data. We will also need the international science achievement plausible values (BSSSCI01-BSSSCI05), the student sampling weight (TOTWGT), and the variables that contain the jackknife replication information (JKZONE and JKREP).
We then proceed to merge the school information with the student information using the variables IDCNTRY and IDSCHOOL, and then use the macro JACKPV to obtain the percentages of students and their mean science achievement scores within each category of the variable BCBGCOMU by country.
In this analysis, we will again use the data for all available countries, although the exact same steps need to be taken if you want to examine these variables within a single country, or for a select group of countries. We used the JOIN program, described earlier in this chapter, to join the School Background files for all available countries into a single School Background file called BCGALLM3. The JOIN program was used a second time to join all the Student Background files into a single one called BSGALLM3.
The SAS program code for this example is presented in Exhibit 5.21 and is included on the DVD under the name EXAMPLE4.SAS. Selected results obtained from this program are displayed in Exhibit 5.22.
Note that one of the steps in this program is to select only those eighth grade students who have non-missing data in the variable of interest BCBGCOMU.

TIMSS 2003 International Database User Guide 5-55
In general, to perform student-weighted school-level analyses using the School Background files, you should do the following:
• Identify the variables of interest in the School Background file and note any specific national adaptations to the variables.
• Retrieve the relevant variables from the School Background file.
• Retrieve the relevant variables from the Student Background file, including the achievement scores, sampling weights, jackknife replication information, and any other variables used in the selection of cases.
• Merge the School Background files with the Student Background files using the variables IDCNTRY and IDSCHOOL.
• Use the macro JACKGEN, or JACKPV if plausible values are involved, with the appropriate arguments and parameters.

TIMSS 2003 International Database User Guide5-56
Exhibit 5.21 SAS Control Statements for Performing Student-Weighted Analyses with School-Level Variables (EXAMPLE4.SAS)
libname bm3 “D:\TIMSS2003\Data\SAS_Data” ;
%include “D:\TIMSS2003\Programs\SAS_Programs\jackpv.sas” ;
data SCHOOL ; set bm3.BCGALLM3;
proc sort data= SCHOOL; by IDCNTRY IDSCHOOL ;
data STUDENT ; set bm3.BSGALLM3;
proc sort data= STUDENT; by IDCNTRY IDSCHOOL;
data MERGED4 ; merge STUDENT SCHOOL; by IDCNTRY IDSCHOOL; if BCBGCOMU > .Z ;
proc format library=work;value country 51 = ‘ARMENIA’ 36 = ‘AUSTRALIA’ 956 = ‘BELGIUM FLEMISH’ 100 = ‘BULGARIA’ 48 = ‘BAHRAIN’ 72 = ‘BOTSWANA’ 9132 = ‘CANADA ONTARIO’ 9133 = ‘CANADA QUEBEC’ 152 = ‘CHILE’ 196 = ‘CYPRUS’ 818 = ‘EGYPT’ 926 = ‘ENGLAND’ 3724 = ‘BASQUE’ 233 = ‘ESTONIA’ 288 = ‘GHANA’ 344 = ‘HONG KONG’ 348 = ‘HUNGARY’ 360 = ‘INDONESIA’ 364 = ‘IRAN’ 376 = ‘ISRAEL’ 380 = ‘ITALY’ 400 = ‘JORDAN’ 392 = ‘JAPAN’ 410 = ‘KOREA’ 422 = ‘LEBANON’ 440 = ‘LITHUANIA’ 428 = ‘LATVIA’ 504 = ‘MOROCCO’ 498 = ‘MOLDOVA’ 807 = ‘MACEDONIA’ 458 = ‘MALAYSIA’ 528 = ‘NETHERLANDS’ 578 = ‘NORWAY’ 554 = ‘NEW ZEALAND’ 275 = ‘PALESTINE’ 608 = ‘PHILIPPINES’ 642 = ‘ROMANIA’ 643 = ‘RUSSIAN FEDERATION’ 682 = ‘SAUDI ARABIA’ 927 = ‘SCOTLAND’ 702 = ‘SINGAPORE’ 703 = ‘SLOVAK REPUBLIC’ 705 = ‘SLOVENIA’ 752 = ‘SWEDEN’ 760 = ‘SYRIA’ 788 = ‘TUNISIA’ 158 = ‘CHINESE TAIPEI’ 840 = ‘UNITED STATES’ 887 = ‘YEMEN’ 891 = ‘SERBIA AND MONTENEGRO’ 710 = ‘SOUTH AFRICA’ 11800 = ‘INDIANA US’;
value comm 1 = ‘More than 500000 people’ 2 = ‘100001 to 500000 people’ 3 = ‘50001 to 100000 people’ 4 = ‘15001 to 50000 people’ 5 = ‘3001 to 15000 people’ 6 = ‘Fewer than 3000 people’ ;
%JackPV (TOTWGT, JKZONE, JKREP, 75, IDCNTRY BCBGCOMU, BSSSCI0, 5, MERGED4) ;
* Print the results ; proc print data=final noobs ; var IDCNTRY BCBGCOMU n TOTWGT mnpv mnpv_se pct pct_se ; format IDCNTRY country. BCBGCOMU comm. n 6.0 TOTWGT 10.0 mnpv mnpv_se pct pct_se 6.2 ;
run ;

TIMSS 2003 International Database User Guide 5-57
Exhibit 5.22 Extract of SAS Computer Output for Performing Student-Weighted Analyses with School-Level Variables (EXAMPLE 4)
IDCNTRY BCBGCOMU N TOTWGT mnpv mnpv_se pct pct_se
AUSTRALIA More than 500000 people 1366 80685 532.32 7.22 35.24 4.09 100001 to 500000 people 842 38918 529.37 10.95 17.00 3.70 50001 to 100000 people 548 28317 525.72 14.80 12.37 2.86 15001 to 50000 people 705 37412 526.70 12.25 16.34 2.77 3001 to 15000 people 559 35212 527.09 7.61 15.38 3.23 Fewer than 3000 people 270 8385 511.89 4.77 3.66 1.36
ARMENIA More than 500000 people 844 7404 474.60 5.67 16.90 2.78 100001 to 500000 people 489 3555 473.32 9.05 8.12 2.14 50001 to 100000 people 292 2035 484.47 15.59 4.65 1.92 15001 to 50000 people 754 7337 468.27 6.76 16.75 3.78 3001 to 15000 people 1716 14000 455.38 6.85 31.96 4.32 Fewer than 3000 people 713 9473 435.57 7.09 21.63 3.44
.
.
.
NORWAY More than 500000 people 281 3434 503.55 12.52 5.76 2.06 100001 to 500000 people 725 7815 494.87 6.06 13.10 2.81 50001 to 100000 people 402 4495 505.44 8.18 7.54 2.44 15001 to 50000 people 1295 19015 491.00 3.20 31.88 4.06 3001 to 15000 people 1206 21713 492.75 4.16 36.40 3.79 Fewer than 3000 people 108 3175 502.48 7.10 5.32 2.27
UNITED STATES More than 500000 people 951 340114 523.04 11.63 11.35 2.05 100001 to 500000 people 1053 396476 505.56 8.98 13.24 2.33 50001 to 100000 people 1041 369343 538.39 8.96 12.33 2.33 15001 to 50000 people 2274 936639 536.72 6.05 31.27 3.71 3001 to 15000 people 1659 626613 532.89 8.02 20.92 3.06 Fewer than 3000 people 701 326297 541.76 7.43 10.89 2.09
In this example, each country’s eighth grade mean science achievement is reported for each response category in the variable BCBGCOMU. The results are presented by country and each value of the variable BCBGCOMU. The countries and the six community types are presented in the first and the second columns. The third column reports the number of valid cases. The fourth column reports the sum of weights of these students, followed by the mean science achievement based on the five plausible values, and its respective standard error. The last two columns report the weighted percentages of students within each category and their respective standard errors.
From the first few lines of Exhibit 5.22, we can say that in Armenia 844 students (16.9%), who represent 7,404 students in the population, responded that they live in a city of more than 500,000 people. These students have a mean science achievement of 474.60 with a standard error of 5.67.


TIMSS 2003 International Database User Guide A-1
A Acknowledgements
Developing and implementing TIMSS 2003 was an extremely ambitious and truly collaborative effort involving hundreds of individuals around the world. Staff from the national research centers in each participating country, the International Association for the Evaluation for Educational Achievement (IEA), the TIMSS & PIRLS International Study Center (ISC) at Boston College, advisors, and funding agencies worked closely to develop and implement TIMSS 2003. The project would not have been possible without the tireless efforts of all involved. Below, the individuals and organizations are acknowledged for their contributions. Given that implementing TIMSS 2003 has spanned approximately four years and involved so many people and organizations, this list may not pay heed to all who contributed throughout the life of the project. Any omission is inadvertent. TIMSS 2003 also acknowledges the students, teachers, and school principals who contributed their time and effort to the study. This report would not be possible without them.
A.1 Funding Agencies
Funding for the international coordination of TIMSS 2003 was provided by the National Center for Education Statistics of the US Department of Education, the US National Science Foundation, the World Bank, the United Nations Development Programme (UNDP), Boston College, and participating countries. Valena Plisko, Patrick Gonzales, Elois Scott, and Eugene Owen of the National Center for Education Statistics; Janice Earle, Larry Suter, Finbarr Sloane, and Elizabeth VanderPutten of the National Science Foundation; Marlaine Lockheed of the World Bank; and Maen Nsour of the UNDP each played a crucial role in making TIMSS 2003 possible and for ensuring the quality of the study. Each participating country was responsible for funding national project costs and implementing TIMSS 2003 in accordance with the international procedures.
A.2 Management and Operations
TIMSS 2003 was conducted under the auspices of the IEA. The study was directed by Michael O. Martin and Ina V.S. Mullis, and managed centrally by the staff of the TIMSS & PIRLS International Study Center at Boston College, Lynch School of Education. Although the study was directed by the International

TIMSS 2003 International Database User GuideA-2
Study Center and its staff members implemented various parts of TIMSS 2003, important activities also were carried out in centers around the world. In the IEA Secretariat, Hans Wagemaker, Executive Director, was responsible for overseeing fundraising and country participation. The IEA Secretariat also managed the ambitious translation verification effort conducted for the field test and main assessment and recruited international quality control monitors in each country. The IEA Data Processing Center was responsible for processing and verifying the data from the participating countries and for constructing the international database. Statistics Canada was responsible for collecting and evaluating the sampling documentation from each country and for calculating the sampling weights. Educational Testing Service in Princeton, New Jersey provided consultation on psychometric issues as well as technical support and software for scaling the achievement data. The Project Management Team, comprising the study directors and representatives from the International Study Center, IEA, Statistics Canada, and Educational Testing Service, met regularly throughout the study to discuss the study’s progress, procedures, and schedule.
IEA SecretariatAlejandro Tiana, IEA Chair (until 2004)
Seamus F. Hegarty, IEA Chair (2004 to present)
Hans Wagemaker, Executive Director
Barbara Malak-Minkiewicz, Manager Membership Relations
Juriaan Hartenberg, Financial Manager
Isabelle Braun-Gemin, Financial Manager Assistant
Katazyna Krohn, Management Assistant
TIMSS & PIRLS International Study Center at Boston CollegeMichael O. Martin, Co-Director
Ina V.S. Mullis, Co-Director
Eugenio J. Gonzalez, Director of Operations and Data Analysis (until 2004)
Pierre Foy, Director of Sampling and Data Analysis (2005 to present)
Teresa Smith Neidorf, TIMSS Science Coordinator (until 2003)
Robert Garden, TIMSS Mathematics Coordinator
Steven Chrostowski, TIMSS Project Coordinator (until 2004)
Ann Kennedy, PIRLS Project Coordinator
Joseph Galia, Senior Statistician/Programmer
Isaac Li, Statistician/Programmer
Alka Arora, Research Associate

TIMSS 2003 International Database User Guide A-3
Dana Diaconu, Research Associate
Ebru Erberber, Research Associate
Cheryl Flaherty, Research Associate
Ieva Johansone, Research Associate (2005 to present)
María José Ramírez, Graduate Assistant (until 2004)
Keith Morgan, Publications Design & Production Manager (2003 to present)
José Nieto, Publications Production Manager (until 2003)
Mario Pita, Data Graphics Specialist
Betty Hugh, Data Graphics Specialist
Susan Messner, Graphics Specialist
Christine Hoage, Manager, Finance
Marcie Petras, Manager, Office Administration
Laura Brown, Administrative Coordinator
Rita Holmes, Administrative Coordinator
IEA Data Processing CenterDirk Hastedt, Senior Researcher
Pierre Foy, Senior Researcher (until 2005)
Oliver Neuschmidt, Researcher
Juliane Barth, Researcher
Ieva Johansone, Junior Researcher (until 2005)
Milena Taneva, Junior Researcher
Christine Busch, Junior Researcher
Dirk Oehler, Programmer
Stefan Petzchen, Programmer
Harpreet Singh Choudry, Programmer
Statistics CanadaMarc Joncas, Senior Methodologist
Educational Testing ServiceJohn Barone, Executive Director, Center for Data Analysis Research
Matthias Von Davier, Principal Research Scientist
Ed Kulick, Manager, Research Data Analysis
Project Management TeamMichael O. Martin, International Study Center
Ina V.S. Mullis, International Study Center
Eugenio J. Gonzalez, International Study Center (until 2004)
Hans Wagemaker, IEA Secretariat
Dirk Hastedt, IEA Data Processing Center
TIMSS 2003 International Database User GuideA-4
Pierre Foy, IEA Data Processing Center
Marc Joncas, Statistics Canada
Matthias Von Davier, Educational Testing Service
TIMSS 2003 Special Consultants
Sampling RefereeKeith Rust, Westat, Inc.
Psychometric DesignEugene Johnson, American Institutes for Research
IEA Editorial ReviewDavid Robitaille, University of British Columbia
IEA Technical Executive Group
A.3 TIMSS 2003 Advisory Committees and Task Forces
The TIMSS & PIRLS International Study Center at Boston College was supported in its work by a number of advisory committees. The International Expert Panel in Mathematics and Science played a crucial role in developing the TIMSS 2003 frameworks and specifications for the assessment. The Mathematics and Science Item Development Task Forces coordinated the work of the national research coordinators in developing and reviewing the mathematics and science achievement items. The Science and Mathematics Item Review Committee reviewed and revised successive drafts of the achievement items and was an integral part of the scale anchoring process. The Questionnaire Item Review Committee revised the TIMSS context questionnaires for the 2003 assessment.
International Expert Panel
MathematicsKhattab Abu-Libdeh, Jordan
Anica Aleksova, Republic of Macedonia
Kiril Bankov, Bulgaria
Aarnout Brombacher, South Africa
Anna Maria Caputo, Italy
Joan Ferrini-Mundy, United States
Jim Fey, United States
Derek Holton, New Zealand
Jeremy Kilpatrick, United States
TIMSS 2003 International Database User Guide A-5
Pekka Kupari, Finland
Mary Lindquist, United States
David Robitaille, Canada
Graham Ruddock, England
Hanako Senuma, Japan
ScienceK.Th. (Kerst) Boersma, the Netherlands
Rodger Bybee, United States
Audrey Champagne, United States
Reinders Duit, Germany
Martin Hollins, England
Eric Jakobsson, United States
Galina Kovalyova, Russian Federation
Svein Lie, Norway
Jan Lokan, Australia
Francisco Mazzitelli, Argentina
Gabriela Noveanu, Romania
Margery Osborne, United Status
Jana Paleckova, Czech Republic
Hong Kim Tan, Singapore
Khadija Zaim-Idrissi, Morocco
Mathematics Item Development Task ForceRobert Garden, New Zealand (Mathematics Coordinator)
Chancey Jones, United States
Graham Ruddock, England
Science Item Development Task ForceTeresa Smith Neidorf, United States (Science Coordinator)
Svein Lie, Norway
Christine O’Sullivan, United States
Science and Mathematics Item Review Committee
MathematicsAnica Aleksova, Republic of Macedonia
Kiril Bankov, Bulgaria
Aarnout Brombacher, South Africa
Francine Jaques, Canada
Jeremy Kilpatrick, United States

TIMSS 2003 International Database User GuideA-6
Mary Lindquist, United States
Graham Ruddock, England
Hanako Senuma, Japan
ScienceAudrey Champagne, United States
Chang Chu-Nan, Chinese Taipei
Galina Kovalyova, Russian Federation
Svein Lie, Norway
Jan Lokan, Australia
Francisco Mazzitelli, Argentina
Gabriela Noveanu, Romania
Ahmed Muhammed Rafea, Bahrain
Vivien Talisayon, Philippines
Sandy Tan, Singapore
Questionnaire Item Review CommitteeKhattab Abu Lebdeh, Jordan
Klaas Bos, the Netherlands
Megan Chamberlain, New Zealand
Chiu Mei-Hung, Chinese Taipei
Rich Coley, United States
Patrick Gonzales, United States
Mike Marshall, Canada
TIMSS 2003 International Database User Guide A-7
National Research Coordinators
The TIMSS 2003 National Research Coordinators and their staff had the enormous task of implementing the TIMSS 2003 design. This involved obtaining funding for the project; participating in the development of the instruments and procedures; conducting field tests; participating in and conducting training sessions; translating the instruments and procedural manuals into the local language; selecting the sample of schools and students; working with the schools to arrange for the testing; arranging for data collection, coding, and data entry; preparing the data files for submission to the IEA Data Processing Center; contributing to the development of the international reports; and preparing national reports. The way in which the national centers operated and the resources that were available varied considerably across the TIMSS 2003 countries. In some countries, the tasks were conducted centrally, while in others, various components were subcontracted to other organizations. In some countries, resources were more than adequate, while in some cases, the national centers were operating with limited resources. All of the TIMSS 2003 National Research Coordinators and their staff members are to be commended for their professionalism and their dedication in conducting all aspects of TIMSS.
ARGENTINA
Margarita PoggiMinisterio de EducaciónDirección Nacional de Información y Evaluación Paraguay 1657, 2er Piso – Of 201 Buenos Aires C1062ACA
ARMENIA, REPUBLIC OF
Arsen BaghdasaryanYerevan State University26 Halabyan Str Apt 31Yerevan 375036
AUSTRALIA
Sue ThomsonAustralian Council for Educational Research(ACER)19 Prospect Hill Rd. Camberwell, Victoria 3124
BAHRAIN
Ahmed Muhammad RafeaChief, Assessment and Curriculum Development DivisionPO Box 43Ministry EducationManama

TIMSS 2003 International Database User GuideA-8
BELGIUM (Flemish)
Christiane Brusselmans-Dehairs Vakgroep Onderwijskunde Universiteit GentHenri Dunantlaan 2B 9000 Gent
Ann Van Den BroeckLIVODekenstraat 2Leuven B-3000
BOTSWANA
Cyprian Ismael Cele Examinations Research and Testing DivisionMinistry of EducationPrivate Bag 0070Gaborone
BULGARIA
Kiril BankovFaculty of Mathematics and InformaticsUniversity of Sofia5, bul James BoucherSofia 1164
CHILE
Leonor Cariola HuertaMinisterio de EducaciónAlameda 1146Piso 8, Sector BSantiago
CHINESE TAIPEI
Chu-Nan ChangDean of College of Science National Taiwan Normal University88 Sec 4, Ting-Chou RoadTaipei, 116
CYPRUS
Constantinos ChristouResearch and Evaluation DepartmentPedagogical InstitueUniversity of Cyprus-Dept. of EducationKallipoleous 75, P.O. Box 20537Nicosia 1678

TIMSS 2003 International Database User Guide A-9
EGYPT
Solaiman El-Khodary El-SheikhNational Center of Examinations and Educational Evaluation Hadaba OlyaAl-MokkatamCairo
ENGLAND
Graham RuddockNational Foundation for Educational Research (NFER)The Mere, Upton ParkSlough, BerkshireSL1 2DQ
ESTONIA
Kristi MereEstonian Ministry of Education Munga 18Tartu EE 50088
GHANAAba Mansa FolsonHead of Inspectorate Division Ministry of EducationGhana Education ServiceArakan Printing Press Building Kotobabi, Accra
HONG KONG, SAR
Frederick LeungThe University of Hong Kong – Hong Kong IEA Centre Pokfulam RoadHong Kong, SAR
HUNGARY
Peter VariNational Institute of Public EducationCentre for Evaluation StudiesDorottya u.8, PF 701/420Budapest 1051
INDONESIA
Jahja UmarMinistry of National EducationExaminiation Development CenterJalan Gunung Sahari Raya – 4Jakarta Pusat, 1000 Jakarta

TIMSS 2003 International Database User GuideA-10
IRAN, ISLAMIC REPUBLIC OF
Abbass RahiminezhadInstitute for National ResearchHojjat Doost Alley Naderi St.196 Keshavarz Blvd.Tehran
ISRAELRuth ZuzovskyTel Aviv UniversitySchool of EducationCenter for Science and Technology EducationRamat Aviv, Tel Aviv 69978
ITALY
Anna Maria CaputoIstituto Nazionale per laValutazione del Sistema dell’Istruzione (CEDE)Borromini 5 – Villa FalconieriFrascati (Roma) 00044
JAPAN
Yuji Saruta National Institute for Educational Research (NIER)6-5-22 ShimomeguroMeguro-ku, Tokyo153-8681
Hanako SenumaNational Institute for Educational Research (NIER)6-5-22 ShimomeguroMeguro-ku, Tokyo153-8681
JORDAN
Tayseer Al-NharNational Center for Human Resources DevelopmentP. O. Box 560Amman 11941
KOREA, REPUBLIC OF
Chung ParkKorea Institute of Curriculum & Evaluation(KICE)25-1 Samchung-dongGhongRo-Gu, Seoul110-230
TIMSS 2003 International Database User Guide A-11
LATVIAAndrejs GeskeUniversity of LatviaIEA National Research CenterJurmalas Gatve 74/76, Rm 204ARiga LV-1083
LEBANON
Leila Maliha FayadMinistry of EducationThe Educational Center for Research and Development Dekwanen, Beirut
LITHUANIA
Algirdas ZabulionisMinistry of Education and ScienceNational Examination CenterM. Katkaus 44Vilnius LT2051
MACEDONIA, REPUBLIC OF
Anica AleksovaMinistry of Education and ScienceBureau for Development of EducationRuder Boskovic St bb1000 Skopje
MALAYSIA
Azmi ZakariaMinistry of EducationEducational Planning and Research DivisionLevel 2, Block J SouthPusat Bandar Damansara, Kuala Lumpur50604
MOLDOVA, REPUBLIC OFIlie NasuMinistry of Education and ScienceUniversity A RussoStr. Puschin 38Balti 3100
MOROCCO
Mohamed SassiDirection de l’Évaluation du Système EducatifMinistère de l’Éducation NationaleInnovations Pédagogiques32 Boulevard Ibn ToumertPlace Bob Rouah, Rabat

TIMSS 2003 International Database User GuideA-12
THE NETHERLANDS
Martina MeelissenUniversity of TwenteCentre for Applied Research in Education(OCTO)PO Box 2177500 AE Enschede
NEW ZEALAND
Megan ChamberlainMinistry of EducationCER Unit-Research Division45-47 Pipitea StreetThorndon, Wellington
Fiona SturrockMinistry of EducationCER Unit-Research Division45-47 Pipitea StreetThorndon, Wellington
NORWAYLiv Sissel Grønmo University of Oslo ILSPostboks 1099 Blindern0316 Oslo 3
PALESTINIAN NATIONAL AUTHORITY
Ola KhaliliMinistry of EducationAssessment CenterBox 719Ramallah – West Bank
PHILIPPINES
Vivien TalisayonUniversity of the PhilippinesTIMSS 2003 Coordination OfficeVidal Tan HallDiliman, Quezon City
ROMANIA
Gabriela NoveanuInstitute for Educational SciencesEvaluation and Forecasting DivisionRevoltiei B1. C7/7Bucharest Ro-70732
TIMSS 2003 International Database User Guide A-13
RUSSIAN FEDERATION
Galina KovalyovaCenter for Evaluating the Quality of EducationInstitute of General Secondary EducationRussian Academy of EducationUl. Pogodinskaya, 8 - Moscow 119905
SAUDI ARABIAAli AlhakamiMinistry of EducationCenter for Educational Development PO Box 102298Riyadh, 11675
SCOTLAND
Jo MacDonald Scottish Executive Education Dept ResearchEconomic and Corporate Strategy Unit 1B (South) Victoria QuayEdinburgh EH6 6QQ
SERBIA
Slobodanka Milanovic-NahodInstitute for Educational ResearchDobrinjska 11/lllPF 546 11001 Belgrade
SINGAPORE
Kok Leong BoeyResearch and Evaluation Section#15-31 MOE Building1 North Buona Vista Drive138675 Singapore
SLOVAK REPUBLIC
Jozef KurajNational Institute for EducationP O Box 26, Pluhova 8Brastislava SK – 830 00
SLOVENIABarbara JapeljEducational Research Institute Gerbiceva 62PO Box 76Ljubljana 1000

TIMSS 2003 International Database User GuideA-14
SOUTH AFRICA
Vijay Reddy Human Sciences Research Council (HSRC)134 Pretorius Street Private Bag X07Pretoria 0001
SWEDEN
Jan-Olof Lindstrom Department of Educational Measurement/ TIMSS Umeå UniversityEnheten for pedagogiska matningarSamhallsvetarhuset, 90187 Umeå
SYRIA
Aychoua IshakMinistry of EducationDamascus
TUNISIA
Mejib AyedCNIPRE130 Boulevard du 9 Avril 1938Tunis 1006
USA
Patrick GonzalesNational Center for Education StatisticsUS Department of Education1990 K St., NW Rm 9071Washington, DC 20006
YEMEN, REPUBLIC OF
Omar Ba-Fadhel Center for Educational Research and Development Ministry of Education General Market (Nokom),Sana’a 23049
Benchmarking Participants
Basque Country, SPAIN
Josu Sierra ISEI-IVEIAsturias 9Bilbao, Basque Country 48015

TIMSS 2003 International Database User Guide A-15
State of Indiana, USA
Carole GallagherDivision of AssessmentIndiana Department of EducationRoom 229, State House Indianapolis, IN 46204
Ontario Province, CANADA
Francine JaquesEducation Quality and Accountability Office2 Carlton StreetSuite 1200Toronto, Ontario M5B 2M9
Québec Province, CANADA
Serge BaillargeonMEQ Direction de la Sanction des Études1035 rue de la Chevrotière13e Étage Québec, PQ G1R 5 A5