tip leakage cavitation, associated bubble dynamics, noise
TRANSCRIPT

CAV2001:sessionA6.004 1
Abstract This paper focuses on the onset of tip-leakage cavitation on a fixed hydrofoil. The objectives are to investigate the effect of gap size on the flow structure, conditions of cavitation inception, the associated bubble dynamics and cavitation noise. The same hydrofoil with three tip gap sizes of 12%, 28% and 52% of the maximum tip thickness have been studied. Controlled cavitation tests are performed after de-aerating the water in the tunnel and using electrolysis to generate cavitation nuclei. The experiments consist of simultaneously detecting cavitation inception using a 2000fps digital camera (visual) and two accelerometers (“acoustic”) mounted on the test-section windows. Good agreement between these methods is achieved when the visual observations are performed carefully. To obtain the time dependent noise spectra, portions of the signal containing cavitation noise are analyzed using Hilbert and Wavelet transforms. Rates of cavitation events as a function of the cavitation index (σ) for the 3 gap sizes are also measured. The observations demonstrate that high amplitude noise spikes are generated when the bubbles are distorted and “shredded” – broken to several bubbles following their growth in the vortex core. Mere changes to bubble size and shape caused significantly lower noise. High resolution Particle Image Velocimetry with a vector spacing of 180µm is used to measure the flow, especially to capture the slender tip vortices where cavitation inception is observed. The instantaneous realizations are analyzed to obtain probability density functions of the circulation of the leakage vortex. The circulation decreases with increasing gap sizes and minimum pressure coefficients in the cores of these vortices are estimated using a Rankine model. The diameter of the vortex core varied between 540 – 720 µm. These coefficients show a very good agreement with the measured cavitation inception indices. 1. Introduction Cavitation occurs in liquid flows when a nucleus (bubbles, particles etc.) is captured in a region where the pressure is lower or equal to the vapor pressure (Arndt 1981, Brennen 1995). Such low-pressure regions could be at the cores of vortical structures that frequently occur in shear flows (Katz & O’Hern 1986, O’Hern 1991, Ran & Katz 1994, Gopalan et al. 1999, Belahadji et al. 1995, Arndt 1981). Experimental studies on tip vortex formation and cavitation have been addressed (for e.g.) by Higuchi et al. (1989), Maines and Arndt (1997) and a numerical study of steady-state tip vortex has been reported by Hsiao & Pauley (1998). Several papers in recent years have dealt with cavitation in tip leakage or tip clearance flows. As a result of the clearance between the tip and the wall, a tip leakage vortex develops which is prone to cavitation (Farrell & Billet 1994, Boulon et al. 1999). Farrell and Billet (1994) examined the effect of gap size on tip leakage cavitation (in a rotating turbo machine) and found that the cavitation inception indices increased with decreasing gap sizes. They also found a minimum in the cavitation inception index near λ ≈0.2; λ is the ratio of tip gap size to the maximum tip thickness. Conversely, experiments performed by Boulon et al. (1999) in a setup similar to the present study, i.e. no relative motion between the tip and the end wall, do not show a minimum in the cavitation inception index that is consistent with the present observations. These observations could be explained using a potential flow model, elaborated in Boulon et al. and discussed briefly in section 4 of this paper. This paper provides high magnification, high-speed photographs of bubbles cavitating in the tip vortex and simultaneous measurements of cavitating noise thus explaining the physical and acoustic relationships involved during cavitation. Detailed measurements of the velocity and thus vorticity and circulation of the tip leakage vortex, vortex core size and estimated minimum pressure coefficients are also documented.
The following issues are addressed: (i) the relationship between cavitation inception measurements using visual and acoustic techniques, (ii) the bubble dynamics during cavitation (iii) a comparison between the acoustic signal and the visual occurrence of cavitation, including a detailed spectral analysis of the signal, (iv) the strength of
Tip Leakage Cavitation, Associated Bubble Dynamics, Noise, Flow Structure and Effect of Tip Gap Size
Shridhar Gopalan and Joseph Katz The Johns Hopkins University, Baltimore MD
Han L Liu
Naval Surface Warfare Center, West Bethesda, MD, USA

CAV2001:sessionA6.004 2
Side view
Top view
the tip leakage vortex and the effect of gap size on leakage flow characteristics. Plots of cavitation index, σ versus rate of cavitation events, rc, where σ = (P0 – Pv)/0.5ρV2, P0 is the ambient pressure in the test section, Pv is the vapor pressure and V is the free-stream velocity are obtained in nuclei controlled conditions. Three tip gap sizes of 0.6, 1.4 and 2.6mm are studied, corresponding to λ = 0.12, 0.28 and 0.52 respectively. Cavitation events were recorded using accelerometers attached to windows of the test section. A high-speed camera at 2000 frames/s is used to record the motion of bubbles as they interact with the tip leakage vortex. The observations demonstrate clearly that high noise spikes occur when the bubbles break-up in the vortex core. Mere oscillations in bubble size and shape cause significantly lower amplitude signals. PIV experiments are conducted using an angled light sheet so that a cross-section of the tip leakage vortex core is captured. The purpose of these measurements is to evaluate the vorticity distribution in the vortex core then compute the circulation from the vorticity field. The results are used to estimate minimum pressure coefficients in the vortex core. These coefficients compare well to the cavitation inception indices. 2. Experimental set up and procedure The tests were performed in a specially designed water tunnel located at The Johns Hopkins University (figure 1a). The 6.35 x 5.08 cm2 test section has a minimum length of 41 cm and maximum entrance velocity of 13 m/s, although the present tests were performed at 5 m/s (figure 1b). The flow was driven by two 11KW centrifugal pumps located 4m below the test section to prevent pump cavitation. The facility has windows (made of optical
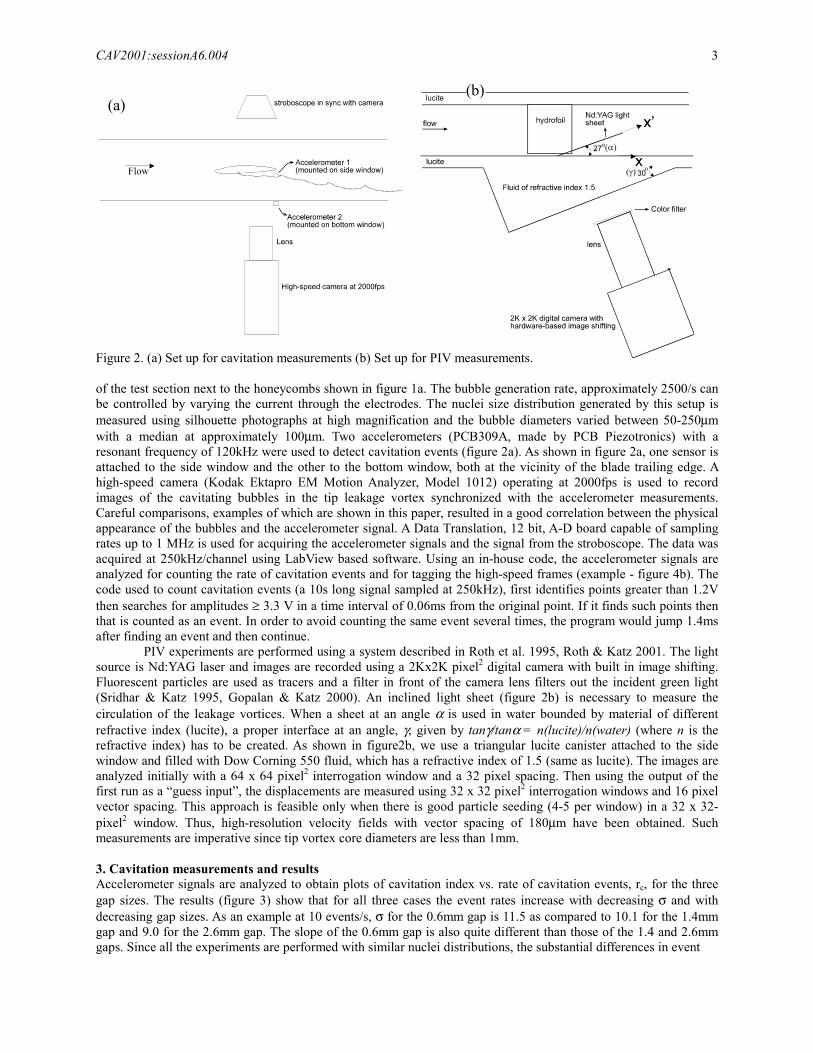
Figure 1. (a) Experimental facility (b) Close-up of test-section. grade lucite) on four sides to enable easy access for PIV measurements. The constant chord hydrofoil with a chord length of 50mm and a span of 50 mm is attached to a side window and its tip has a small clearance with the opposite side window (figure 1b). The maximum tip thickness is 5mm (at mid-chord) and the hydrofoil is loaded towards the tip. The clearance (or gap) size is varied by varying the thickness of the side window. Boundary layer suction followed by tripping is used on the wall near the tip as shown in figure 1b (side view) to generate a fully developed turbulent boundary layer on the wall.
The free stream velocity in the test-section is fixed at 5 m/s (Rec, based on chord, c equal to 2.5x10⁵) and the cavitation index is regulated by varying the ambient pressure in the test chamber. The air content is reduced to about 3 ppm by keeping the facility under vacuum for extended periods and the dissolved oxygen content measured using an oxygen meter. The cavitation nuclei are supplied by electrolysis using two vertical wires, located upstream
(a) (b)
CAV2001:sessionA6.004 3
Figure 2. (a) Set up for cavitation measurements (b) Set up for PIV measurements. of the test section next to the honeycombs shown in figure 1a. The bubble generation rate, approximately 2500/s can be controlled by varying the current through the electrodes. The nuclei size distribution generated by this setup is measured using silhouette photographs at high magnification and the bubble diameters varied between 50-250µm with a median at approximately 100µm. Two accelerometers (PCB309A, made by PCB Piezotronics) with a resonant frequency of 120kHz were used to detect cavitation events (figure 2a). As shown in figure 2a, one sensor is attached to the side window and the other to the bottom window, both at the vicinity of the blade trailing edge. A high-speed camera (Kodak Ektapro EM Motion Analyzer, Model 1012) operating at 2000fps is used to record images of the cavitating bubbles in the tip leakage vortex synchronized with the accelerometer measurements. Careful comparisons, examples of which are shown in this paper, resulted in a good correlation between the physical appearance of the bubbles and the accelerometer signal. A Data Translation, 12 bit, A-D board capable of sampling rates up to 1 MHz is used for acquiring the accelerometer signals and the signal from the stroboscope. The data was acquired at 250kHz/channel using LabView based software. Using an in-house code, the accelerometer signals are analyzed for counting the rate of cavitation events and for tagging the high-speed frames (example - figure 4b). The code used to count cavitation events (a 10s long signal sampled at 250kHz), first identifies points greater than 1.2V then searches for amplitudes ≥ 3.3 V in a time interval of 0.06ms from the original point. If it finds such points then that is counted as an event. In order to avoid counting the same event several times, the program would jump 1.4ms after finding an event and then continue.
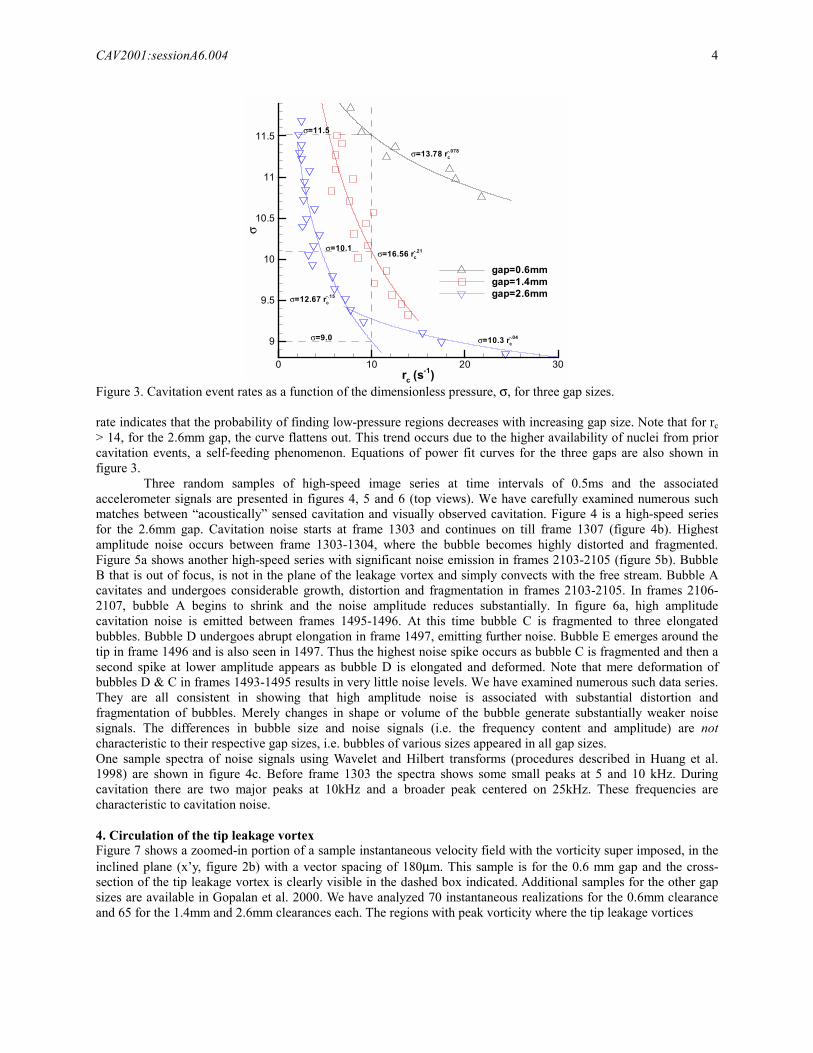
PIV experiments are performed using a system described in Roth et al. 1995, Roth & Katz 2001. The light source is Nd:YAG laser and images are recorded using a 2Kx2K pixel2 digital camera with built in image shifting. Fluorescent particles are used as tracers and a filter in front of the camera lens filters out the incident green light (Sridhar & Katz 1995, Gopalan & Katz 2000). An inclined light sheet (figure 2b) is necessary to measure the circulation of the leakage vortices. When a sheet at an angle α is used in water bounded by material of different refractive index (lucite), a proper interface at an angle, γ, given by tanγ/tanα = n(lucite)/n(water) (where n is the refractive index) has to be created. As shown in figure2b, we use a triangular lucite canister attached to the side window and filled with Dow Corning 550 fluid, which has a refractive index of 1.5 (same as lucite). The images are analyzed initially with a 64 x 64 pixel2 interrogation window and a 32 pixel spacing. Then using the output of the first run as a “guess input”, the displacements are measured using 32 x 32 pixel2 interrogation windows and 16 pixel vector spacing. This approach is feasible only when there is good particle seeding (4-5 per window) in a 32 x 32-pixel2 window. Thus, high-resolution velocity fields with vector spacing of 180µm have been obtained. Such measurements are imperative since tip vortex core diameters are less than 1mm. 3. Cavitation measurements and results Accelerometer signals are analyzed to obtain plots of cavitation index vs. rate of cavitation events, rc, for the three gap sizes. The results (figure 3) show that for all three cases the event rates increase with decreasing σ and with decreasing gap sizes. As an example at 10 events/s, σ for the 0.6mm gap is 11.5 as compared to 10.1 for the 1.4mm gap and 9.0 for the 2.6mm gap. The slope of the 0.6mm gap is also quite different than those of the 1.4 and 2.6mm gaps. Since all the experiments are performed with similar nuclei distributions, the substantial differences in event
(a) (b)
CAV2001:sessionA6.004 4
rc (s-1)
σ
0 10 20 30
9
9.5
10
10.5
11
11.5
gap=0.6mmgap=1.4mmgap=2.6mm
σ=16.56 rc-.21
σ=12.67 rc-.15
σ=13.78 rc-.078
σ=10.3 rc-.04σ=9.0
σ=10.1
σ=11.5
Figure 3. Cavitation event rates as a function of the dimensionless pressure, σ, for three gap sizes. rate indicates that the probability of finding low-pressure regions decreases with increasing gap size. Note that for rc > 14, for the 2.6mm gap, the curve flattens out. This trend occurs due to the higher availability of nuclei from prior cavitation events, a self-feeding phenomenon. Equations of power fit curves for the three gaps are also shown in figure 3.
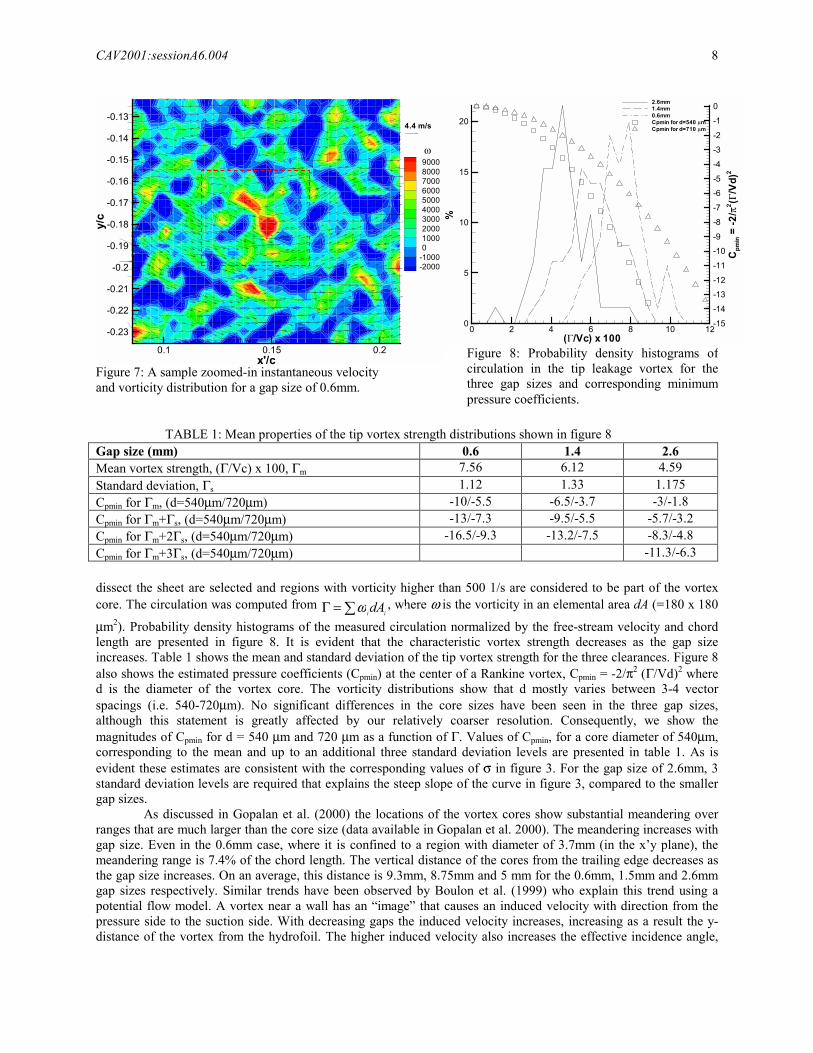
Three random samples of high-speed image series at time intervals of 0.5ms and the associated accelerometer signals are presented in figures 4, 5 and 6 (top views). We have carefully examined numerous such matches between “acoustically” sensed cavitation and visually observed cavitation. Figure 4 is a high-speed series for the 2.6mm gap. Cavitation noise starts at frame 1303 and continues on till frame 1307 (figure 4b). Highest amplitude noise occurs between frame 1303-1304, where the bubble becomes highly distorted and fragmented. Figure 5a shows another high-speed series with significant noise emission in frames 2103-2105 (figure 5b). Bubble B that is out of focus, is not in the plane of the leakage vortex and simply convects with the free stream. Bubble A cavitates and undergoes considerable growth, distortion and fragmentation in frames 2103-2105. In frames 2106-2107, bubble A begins to shrink and the noise amplitude reduces substantially. In figure 6a, high amplitude cavitation noise is emitted between frames 1495-1496. At this time bubble C is fragmented to three elongated bubbles. Bubble D undergoes abrupt elongation in frame 1497, emitting further noise. Bubble E emerges around the tip in frame 1496 and is also seen in 1497. Thus the highest noise spike occurs as bubble C is fragmented and then a second spike at lower amplitude appears as bubble D is elongated and deformed. Note that mere deformation of bubbles D & C in frames 1493-1495 results in very little noise levels. We have examined numerous such data series. They are all consistent in showing that high amplitude noise is associated with substantial distortion and fragmentation of bubbles. Merely changes in shape or volume of the bubble generate substantially weaker noise signals. The differences in bubble size and noise signals (i.e. the frequency content and amplitude) are not characteristic to their respective gap sizes, i.e. bubbles of various sizes appeared in all gap sizes. One sample spectra of noise signals using Wavelet and Hilbert transforms (procedures described in Huang et al. 1998) are shown in figure 4c. Before frame 1303 the spectra shows some small peaks at 5 and 10 kHz. During cavitation there are two major peaks at 10kHz and a broader peak centered on 25kHz. These frequencies are characteristic to cavitation noise. 4. Circulation of the tip leakage vortex Figure 7 shows a zoomed-in portion of a sample instantaneous velocity field with the vorticity super imposed, in the inclined plane (x’y, figure 2b) with a vector spacing of 180µm. This sample is for the 0.6 mm gap and the cross-section of the tip leakage vortex is clearly visible in the dashed box indicated. Additional samples for the other gap sizes are available in Gopalan et al. 2000. We have analyzed 70 instantaneous realizations for the 0.6mm clearance and 65 for the 1.4mm and 2.6mm clearances each. The regions with peak vorticity where the tip leakage vortices

CAV2001:sessionA6.004 5
1300
1302
1303
1304
gap=2.6mm
1300
1301
1303
1299(a)
(b)
(c)
1303
1307
1303
Figure 4: (a) A high-speed series (frames 1299-1304) at 2000fps (gap size, 2.6mm). Flow is from left to right with suction surface, tip and trailing edge (TE) visible (σ~10); (b) corresponding accelerometer and strobe signals (indicated by vertical bars); (c) Wavelet and Hilbert transforms of the accelerometer signal. Frame timings are indicated by dashed lines.
Tip TE

CAV2001:sessionA6.004 6
2103
2107
Figure 5: (a) A high-speed series (frames 2103-2107) at 2000fps (gap size, 2.6mm). Flow is from left to right with suction surface, tip and trailing edge visible (σ~10); (b) corresponding accelerometer and strobe signals (indicated by vertical bars at the bottom).
(b)(a) Tip

CAV2001:sessionA6.004 7
1493
1494
1495
1496
1497
Gap=0.6mm
1498
1495
(a)
(b)
1498
x/c=0.52 x/c=0.84
Figure 6: (a) A high-speed series (frames 1493-1498) at2000fps (gap size, 0.6mm). Flow is from left to right withsuction surface and tip visible (σ~10); (b) correspondingaccelerometer and strobe signals (indicated by verticalbars); (c) Wavelet and Hilbert transforms of theaccelerometer signal. Frame timings are indicated bydashed lines.
1495
D
D C
D C
E
DC
DC
Tip
CAV2001:sessionA6.004 8
x'/c
y/c
0.1 0.15 0.2
-0.23
-0.22
-0.21
-0.2
-0.19
-0.18
-0.17
-0.16
-0.15
-0.14
-0.13
9000800070006000500040003000200010000-1000-2000
4.4 m/s
ω
Figure 7: A sample zoomed-in instantaneous velocity and vorticity distribution for a gap size of 0.6mm.
dissect the sheet are selected and regions with vorticity higher than 500 1/s are considered to be part of the vortex core. The circulation was computed from
iidA∑=Γ ω , where ω is the vorticity in an elemental area dA (=180 x 180
µm2). Probability density histograms of the measured circulation normalized by the free-stream velocity and chord length are presented in figure 8. It is evident that the characteristic vortex strength decreases as the gap size increases. Table 1 shows the mean and standard deviation of the tip vortex strength for the three clearances. Figure 8 also shows the estimated pressure coefficients (Cpmin) at the center of a Rankine vortex, Cpmin = -2/π2 (Γ/Vd)2 where d is the diameter of the vortex core. The vorticity distributions show that d mostly varies between 3-4 vector spacings (i.e. 540-720µm). No significant differences in the core sizes have been seen in the three gap sizes, although this statement is greatly affected by our relatively coarser resolution. Consequently, we show the magnitudes of Cpmin for d = 540 µm and 720 µm as a function of Γ. Values of Cpmin, for a core diameter of 540µm, corresponding to the mean and up to an additional three standard deviation levels are presented in table 1. As is evident these estimates are consistent with the corresponding values of σ in figure 3. For the gap size of 2.6mm, 3 standard deviation levels are required that explains the steep slope of the curve in figure 3, compared to the smaller gap sizes.
As discussed in Gopalan et al. (2000) the locations of the vortex cores show substantial meandering over ranges that are much larger than the core size (data available in Gopalan et al. 2000). The meandering increases with gap size. Even in the 0.6mm case, where it is confined to a region with diameter of 3.7mm (in the x’y plane), the meandering range is 7.4% of the chord length. The vertical distance of the cores from the trailing edge decreases as the gap size increases. On an average, this distance is 9.3mm, 8.75mm and 5 mm for the 0.6mm, 1.5mm and 2.6mm gap sizes respectively. Similar trends have been observed by Boulon et al. (1999) who explain this trend using a potential flow model. A vortex near a wall has an “image” that causes an induced velocity with direction from the pressure side to the suction side. With decreasing gaps the induced velocity increases, increasing as a result the y-distance of the vortex from the hydrofoil. The higher induced velocity also increases the effective incidence angle,
Gap size (mm) 0.6 1.4 2.6 Mean vortex strength, (Γ/Vc) x 100, Γm 7.56 6.12 4.59 Standard deviation, Γs 1.12 1.33 1.175 Cpmin for Γm, (d=540µm/720µm) -10/-5.5 -6.5/-3.7 -3/-1.8 Cpmin for Γm+Γs, (d=540µm/720µm) -13/-7.3 -9.5/-5.5 -5.7/-3.2 Cpmin for Γm+2Γs, (d=540µm/720µm) -16.5/-9.3 -13.2/-7.5 -8.3/-4.8 Cpmin for Γm+3Γs, (d=540µm/720µm) -11.3/-6.3
TABLE 1: Mean properties of the tip vortex strength distributions shown in figure 8
Figure 8: Probability density histograms of circulation in the tip leakage vortex for the three gap sizes and corresponding minimum pressure coefficients.
733
(Γ/Vc) x 100
%
Cpmin=-2/π2 (Γ/Vd)
2
0 2 4 6 8 10 120
5
10
15
20
-15
-14
-13-12
-11
-10-9
-8
-7
-6-5
-4
-3-2
-1
02.6mm1.4mm0.6mmCpmin for d=540 µmCpmin for d=710 µm

CAV2001:sessionA6.004 9
which would in turn increase the lift. Observations show that the flow structure for the 2.6mm gap is quite different than the 1.4 mm and 0.6 mm gaps. There is a “bump” in the vortex trajectory at about 10% of the chord length downstream of the trailing edge, which is absent in the smaller clearances (a description is available in Gopalan et al. 2000). 5. Conclusion Tip leakage cavitation is studied in detail on a fixed hydrofoil with three tip gap sizes of λ = 0.12, 0.28 and 0.52. The cavitation event rates decrease with increasing gap size. One of the main conclusions of this paper is the correlation between visual appearance of cavitation and the noise signals. High amplitude cavitation noise is observed only when bubbles get highly distorted and fragmented. Much weaker signals (by an order of magnitude) are observed when the bubbles merely change shape or size. Cavitation noise is consistently observed in the 10-40 kHz range.
High resolution PIV data is used for measuring the circulation, estimate the size and location of the tip leakage vortex. The results show a core size of 540µm-720µm. The vortex strength decrease with increasing gap sizes. Minimum pressure coefficients calculated using a Rankine vortex model and the measured strengths and core diameters, lead to results that are consistent with the measured cavitation indices. The tip leakage vortex trajectory moves closer to the hydrofoil as the clearance is increased. Meandering of the vortex core is substantial in all cases and increases with increasing clearances. Acknowledgments This project has been graciously supported by the Naval Surface Warfare Center – Carderock Division. The authors would like to thank Y Ronzhes, Y C Chow, B McFadden, Dr. E Malkiel and Dr. J Karni for their contributions. References ARNDT, R. E. A. 1981 Cavitation in fluid machinery and hydraulic structures. Ann. Rev. Fluid Mech. 13, 273-328. BELAHADJI, B., FRANC, J. P. & MICHEL, J. M. 1995 Cavitation in the rotational structures of a turbulent wake.
J. Fluid Mech., 287, 383-403. BOULON, O., CALLENAERE, M., FRANC, J. P., MICHEL, J. M. 1999 An experimental insight into the effect of
confinement on tip vortex cavitation of an elliptical hydrofoil, J. Fluid Mech., 390. BRENNEN, C. E. 1995 Cavitation and Bubble Dynamics. Oxford University Press. FARRELL, K. J. & BILLET, M. L. 1994 A correlation of leakage vortex cavitation in axial-flow pumps, Journal of
Fluids Engineering, 116. GOPALAN, S., KATZ, J., KNIO, O. 1999 The flow structure in the near field of jets and its effect on cavitation
inception, Journal of Fluid Mechanics, 398, 1-43. GOPALAN, S. & KATZ, J. 2000 Flow structure and modeling issues in the closure region of attached cavitation,
Physics of Fluids, 12, 895-911. GOPALAN, S., LIU, H. L., KATZ, J. On the flow structure, tip leakage cavitation inception and associated noise, Twenty-Third Symposium on Naval Hydrodynamics, France, September 2000. HIGUCHI, H., ARNDT, R. E. A., ROGERS, M. F., 1989 Characteristics of tip vortex cavitation noise, J. Fluids
Engng., 111, 495-501. HUANG, N. E. et al. 1998 The empirical mode decomposition and the Hilbert spectrum for non-linear and non-
stationary time series analysis. Proc. R. Soc. London 454, 903-995. HSIAO, C. T. & PAULEY, L. L. 1998 Numerical study of the steady-state tip vortex flow over a finite-span
hydrofoil. Journal of Fluids Engineering, 120. KATZ, J. & O'HERN, T. J. 1986 Cavitation in large-scale shear flows. J. Fluids Engng 108, 373-376. MAINES, B. H. & ARNDT, R. E. A. 1997 Tip vortex formation and cavitation, Journal of Fluids Engineering, 119. O'HERN, T. J. 1990 An experimental investigation of turbulent shear flow cavitation. J. Fluid Mech. 215, 365-391. RAN, B. & KATZ, J. 1991 The response of microscopic bubbles to sudden changes in ambient pressure. J. Fluid
Mech. 224, 91-115. ROTH, G., HART, D. & KATZ, J. 1995 Feasibility of using the L64720 video motion estimation processor (MEP)
to increase efficiency of velocity map generation for PIV, ASME/EALA Sixth International Symposium on Laser Anemometry, Hilton Head S.C.
ROTH, G., & KATZ, J. 2001 Five techniques for increasing the speed and accuracy of PIV interrogation, Meas. Sci. Technol. 12, 238.
SRIDHAR, G. & KATZ, J. 1995 Lift and drag forces on microscopic bubbles entrained by a vortex. Phys. Fluids 7, 389–399.