tips masterclass 3of3 surfaces series (002) - read-only
TRANSCRIPT

ENVIRONMENTAL MONITORING
HOW DO YOU MEASURE CLEAN?
AND THE MYTH AND FACTS OF ATP
Christine Greene, MPH, PhD
TIPS Masterclass Webinar, February 12, 2020

THANK YOU!
DISCLOSURES
� TSG, Regulatory Microbiologist
� EVS Protects, LLC, Co-Owner
� HITS Consortium, President
� TIPS, Board Member
© 2019 EVS PROTECTS, LLC
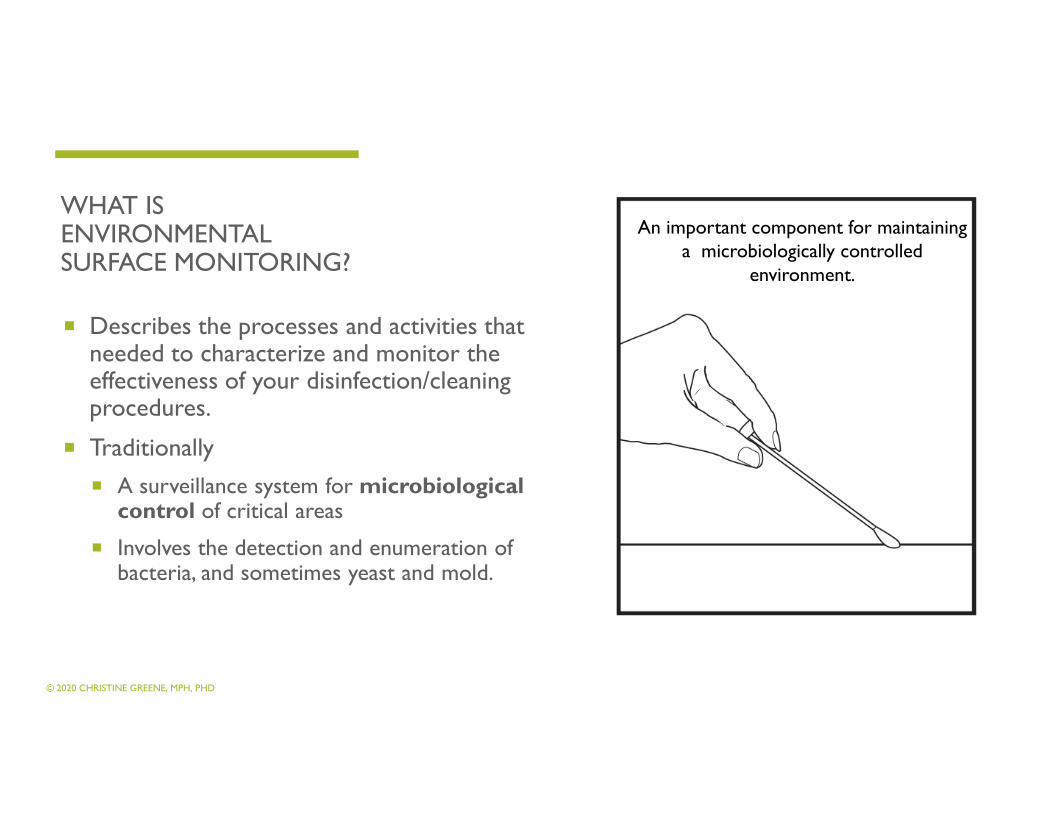
WHAT IS ENVIRONMENTAL SURFACE MONITORING?
� Describes the processes and activities that needed to characterize and monitor the effectiveness of your disinfection/cleaning procedures.
� Traditionally
� A surveillance system for microbiological control of critical areas
� Involves the detection and enumeration of bacteria, and sometimes yeast and mold.
An important component for maintaining a microbiologically controlled
environment.
© 2020 CHRISTINE GREENE, MPH, PHD
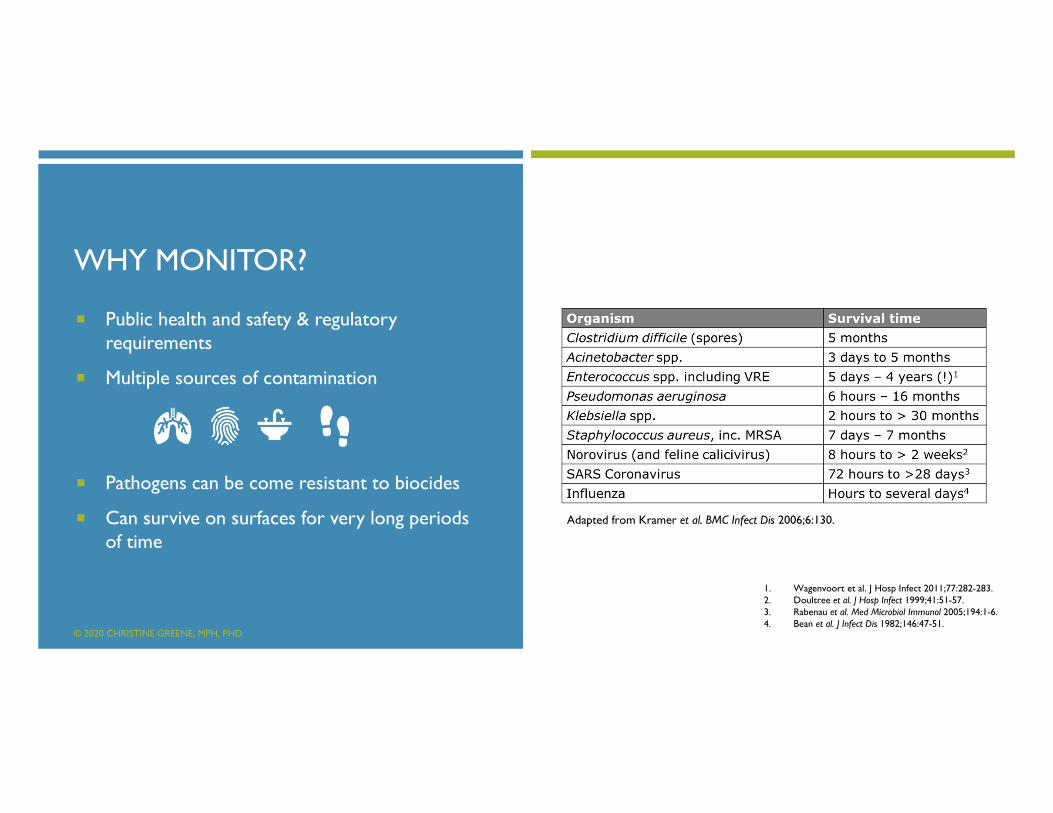
WHY MONITOR?
� Public health and safety & regulatory requirements
� Multiple sources of contamination
� Pathogens can be come resistant to biocides
� Can survive on surfaces for very long periods of time
Adapted from Kramer et al. BMC Infect Dis 2006;6:130.
1. Wagenvoort et al. J Hosp Infect 2011;77:282-283.2. Doultree et al. J Hosp Infect 1999;41:51-57.3. Rabenau et al. Med Microbiol Immunol 2005;194:1-6.4. Bean et al. J Infect Dis 1982;146:47-51.
© 2020 CHRISTINE GREENE, MPH, PHD
CDC’S DEFINITION OF “CLEAN”
� Cleaning removes germs, dirt, and impurities from surfaces or objects.
� Involves soap (or detergent) and water to physically remove germs from surfaces.
� This process does not necessarily kill germs, but by removing them, it lowers their numbers and the risk of spreading infection.
� https://www.cdc.gov/flu/school/cleaning.htm
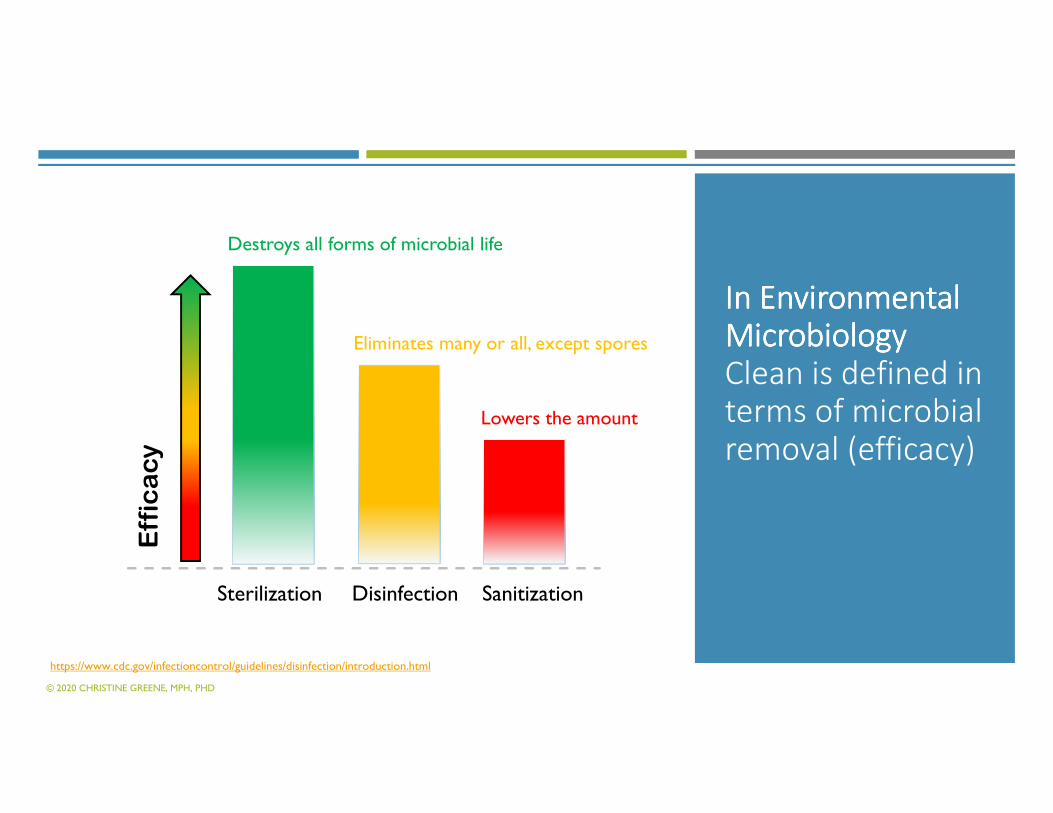
In Environmental In Environmental In Environmental In Environmental MicrobiologyMicrobiologyMicrobiologyMicrobiologyClean is defined in terms of microbial removal (efficacy)
Efficacy
Sterilization Disinfection Sanitization
© 2020 CHRISTINE GREENE, MPH, PHD
Destroys all forms of microbial life
Eliminates many or all, except spores
Lowers the amount
https://www.cdc.gov/infectioncontrol/guidelines/disinfection/introduction.html
How do we measure “clean”?
• No recognized standard method for measuring cleanliness
© 2020 CHRISTINE GREENE, MPH, PHD
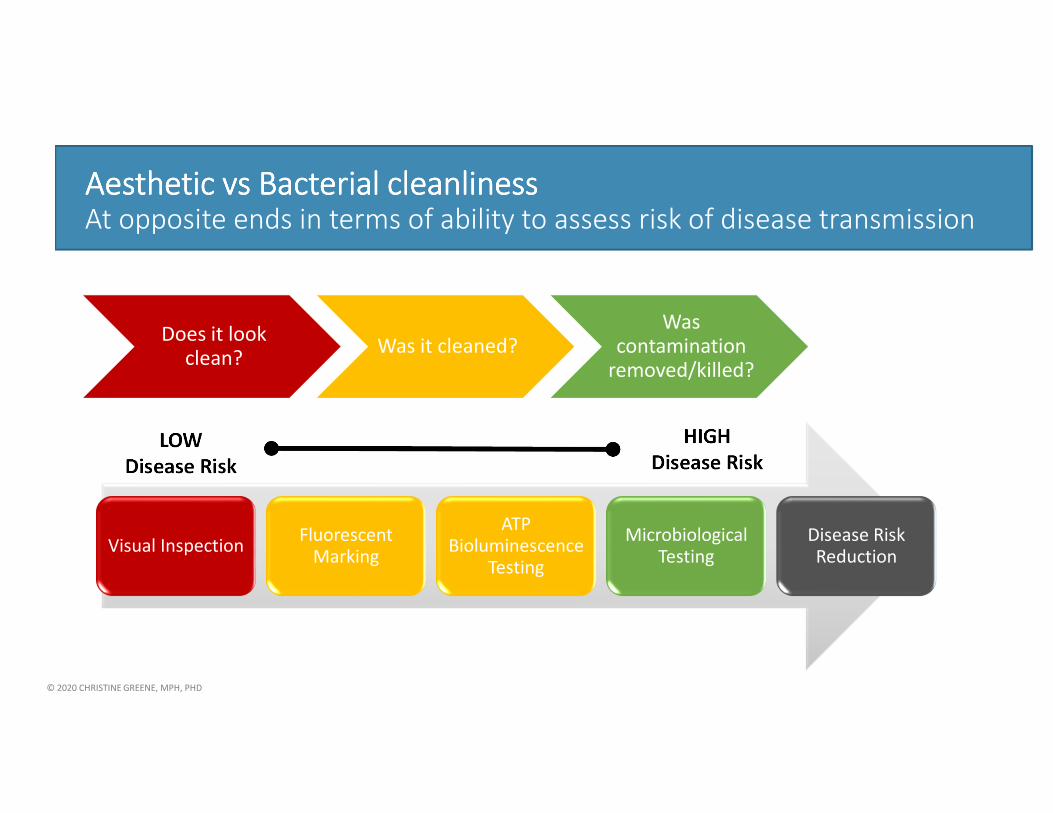
Aesthetic vs Bacterial cleanliness Aesthetic vs Bacterial cleanliness Aesthetic vs Bacterial cleanliness Aesthetic vs Bacterial cleanliness At opposite ends in terms of ability to assess risk of disease transmission
Does it look clean?
Was it cleaned?Was
contamination removed/killed?
LOW
Disease Risk
HIGH
Disease Risk
© 2020 CHRISTINE GREENE, MPH, PHD
Visual InspectionFluorescent
Marking
ATP Bioluminescence
Testing
Microbiological Testing
Disease Risk Reduction
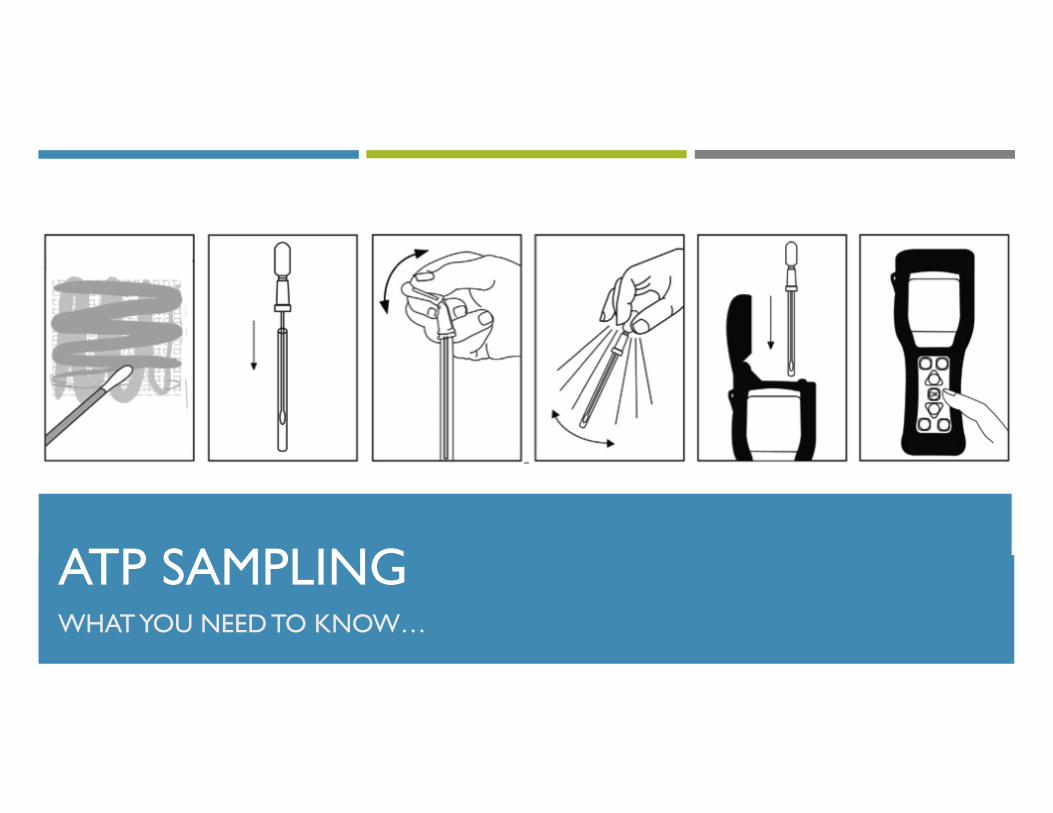
ATP SAMPLINGWHAT YOU NEED TO KNOW…
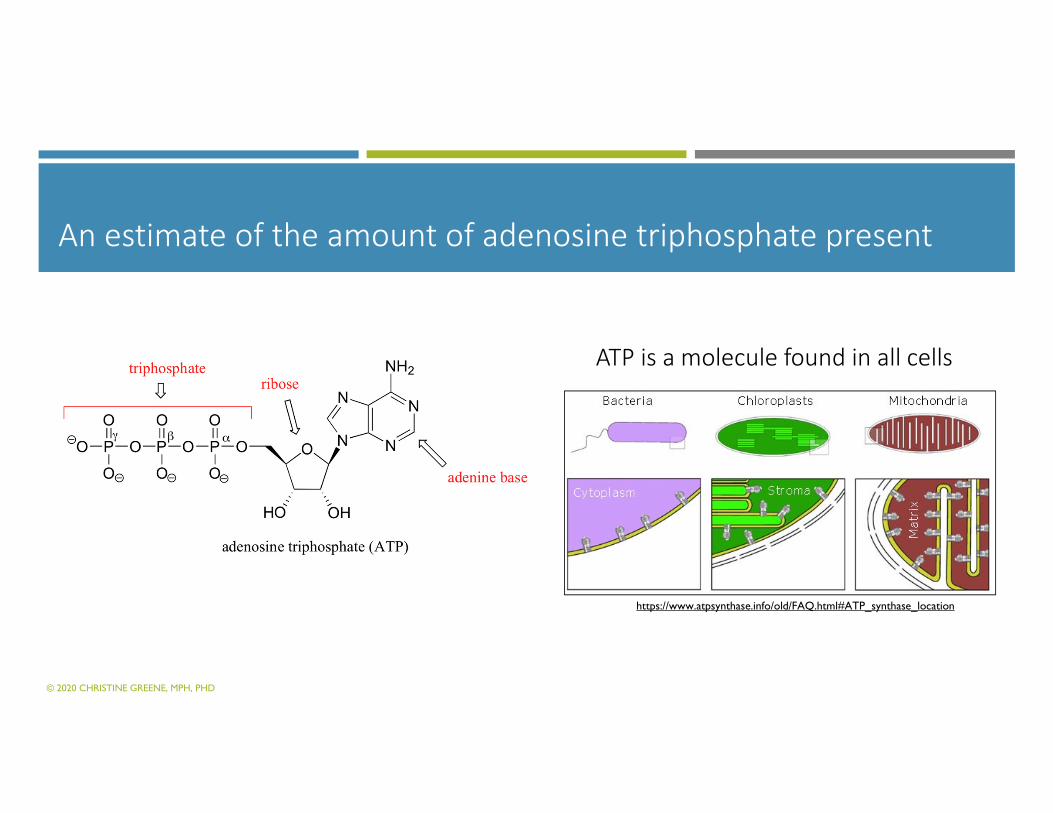
An estimate of the amount of adenosine triphosphate present
https://www.atpsynthase.info/old/FAQ.html#ATP_synthase_location
ATP is a molecule found in all cells
© 2020 CHRISTINE GREENE, MPH, PHD

How ATP Systems WorkHow ATP Systems WorkHow ATP Systems WorkHow ATP Systems Work
� ATP monitoring systems contain 2 important chemicals:
� ATP releasing agent – break open cells to release the ATP.
� Similar in chemistry to detergents
� Enzyme Luciferase - reacts with ATP to generate light
� measured as relative light units (RLU) using a luminometer.
� light emitted is directly proportional to amount of ATP present.
© 2020 CHRISTINE GREENE, MPH, PHD
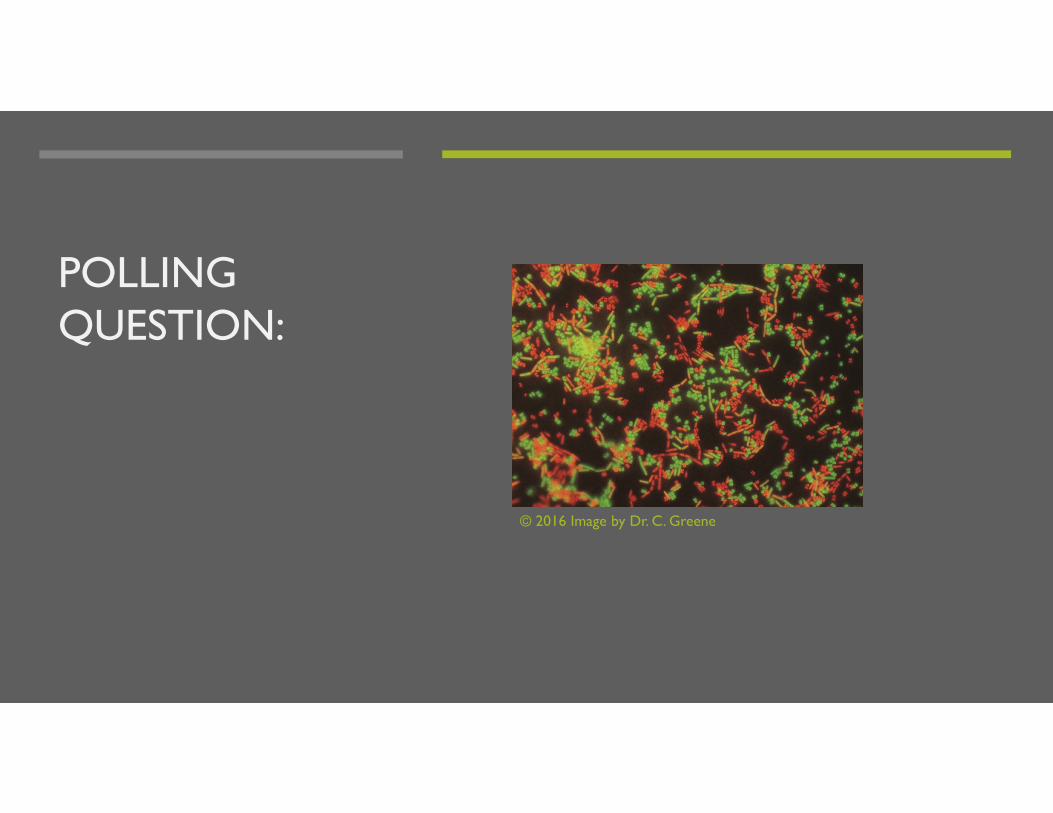
POLLING QUESTION:
© 2016 Image by Dr. C. Greene
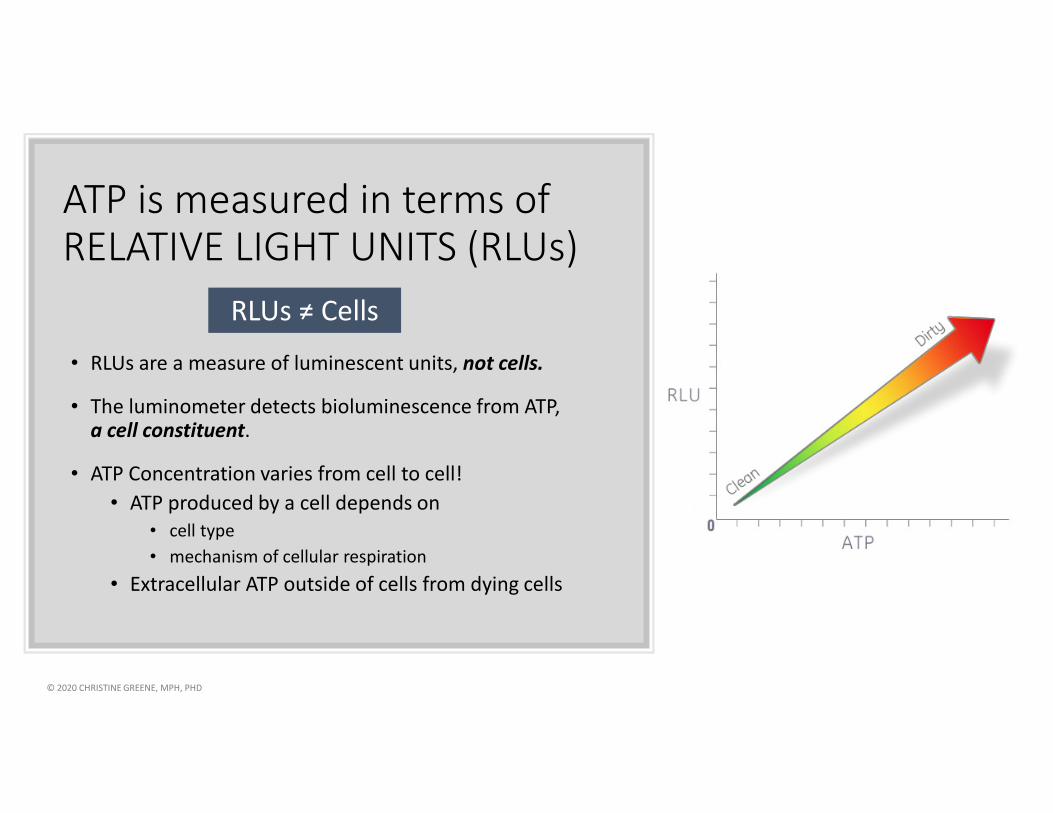
ATP is measured in terms of RELATIVE LIGHT UNITS (RLUs)
• RLUs are a measure of luminescent units, not cells.
• The luminometer detects bioluminescence from ATP, a cell constituent.
• ATP Concentration varies from cell to cell!
• ATP produced by a cell depends on
• cell type
• mechanism of cellular respiration
• Extracellular ATP outside of cells from dying cells
RLUs ≠ Cells
© 2020 CHRISTINE GREENE, MPH, PHD

Independent Correlation StudyNSF International Unpublished data from 2018 study at hospital; n=394 samples per group
“Bacterial ATP” Meter
RLU threshold
Bacterial ATP
% %
Standard ATP Meter
Found No correlation between ATP & CFUs
• Standard ATP System
• Identifies true negatives* ~79% of time• ~ 21% of samples identified as dirty had no contamination
• Identifies true positives** ~43% of the time• ~ 57% of the samples identified as clean had contamination
• Bacteria Specific ATP System
• Identifies true negatives* ~95% of time• ~5% of samples identified as dirty had no contamination
• Identifies true positives** ~15% of the time
• ~ 85% of samples identified as clean had contamination
*true negative= RLU ≤ 500 (or ≤ 2) for a surface that is truly clean.
**true positive = RLU ≥ 500 (or ≥2) for a surface that is truly dirty.“clean” = 2.5 cfu/cm2© 2020 CHRISTINE GREENE, MPH, PHD

POLLING QUESTION:
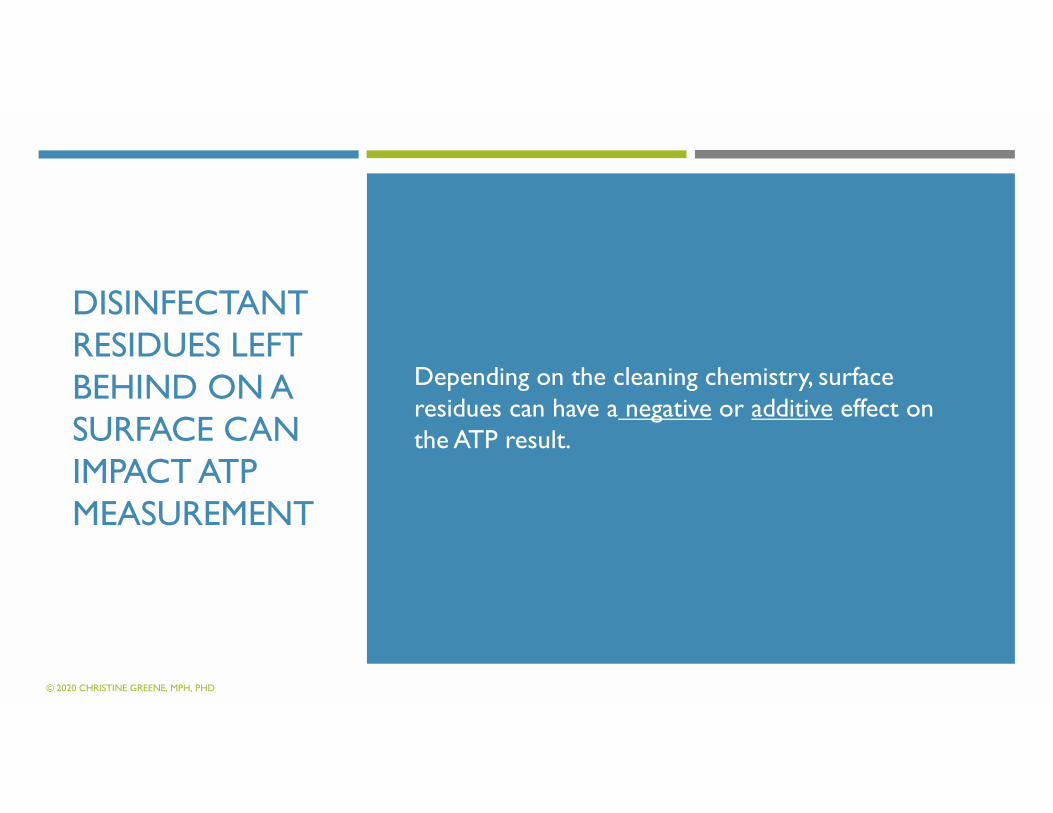
DISINFECTANT RESIDUES LEFT BEHIND ON A SURFACE CAN IMPACT ATP MEASUREMENT
Depending on the cleaning chemistry, surface residues can have a negative or additive effect on the ATP result.
© 2020 CHRISTINE GREENE, MPH, PHD


Chemical composition of cleaning agents are often very similar to the ATP releasing agents!
ATP systems have proprietary blends with a calculated concentration of releasing agent
• too little jeopardies ability to adequately break open the cells to release the ATP
• too high risks inactivating the enzyme Luciferase.
Disinfectant residuals can severely affect Luciferase causing an artificially erroneous result.
ATP
Releasing
Agent
Enzyme
Luciferase
Luciferase is inactivated by
high concentrations of ATP
releasing agent. © 2020 CHRISTINE GREENE, MPH, PHD
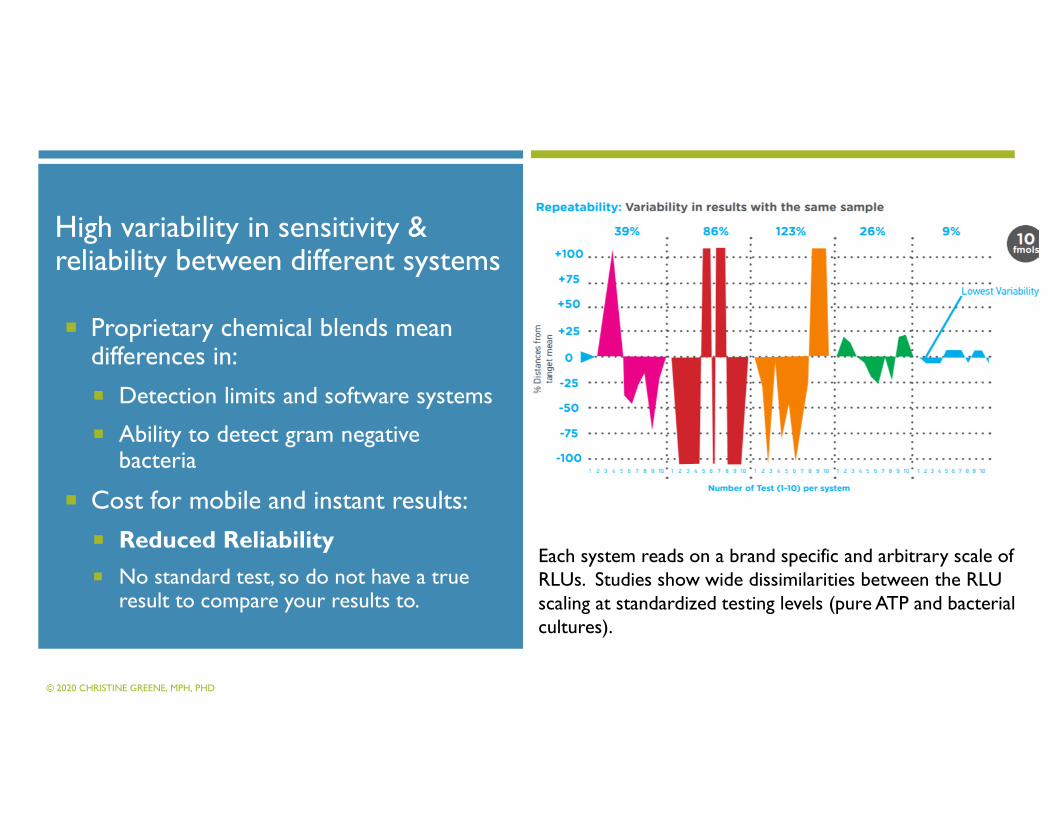
High variability in sensitivity & reliability between different systems
� Proprietary chemical blends mean differences in:
� Detection limits and software systems
� Ability to detect gram negative bacteria
� Cost for mobile and instant results:
� Reduced Reliability
� No standard test, so do not have a true result to compare your results to.
Each system reads on a brand specific and arbitrary scale of RLUs. Studies show wide dissimilarities between the RLUscaling at standardized testing levels (pure ATP and bacterial cultures).
© 2020 CHRISTINE GREENE, MPH, PHD
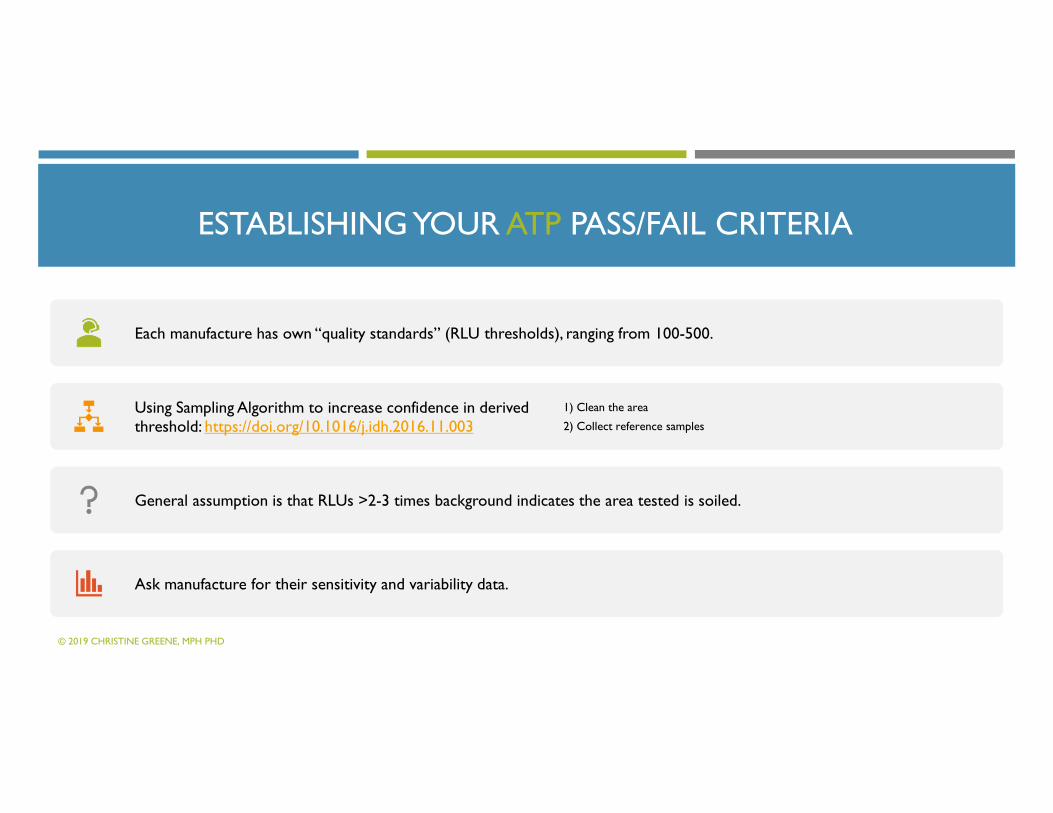
ESTABLISHING YOUR ATP PASS/FAIL CRITERIA
Each manufacture has own “quality standards” (RLU thresholds), ranging from 100-500.
Using Sampling Algorithm to increase confidence in derived threshold: https://doi.org/10.1016/j.idh.2016.11.003
1) Clean the area
2) Collect reference samples
General assumption is that RLUs >2-3 times background indicates the area tested is soiled.
Ask manufacture for their sensitivity and variability data.
© 2019 CHRISTINE GREENE, MPH PHD
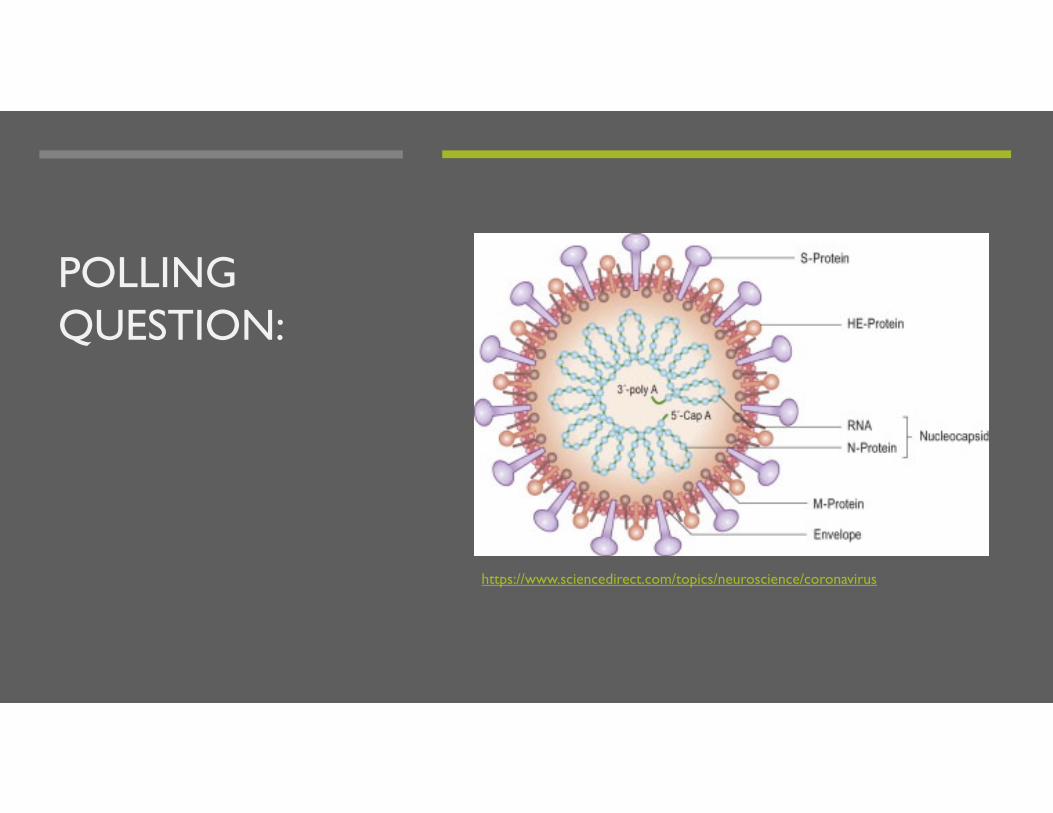
POLLING QUESTION:
https://www.sciencedirect.com/topics/neuroscience/coronavirus
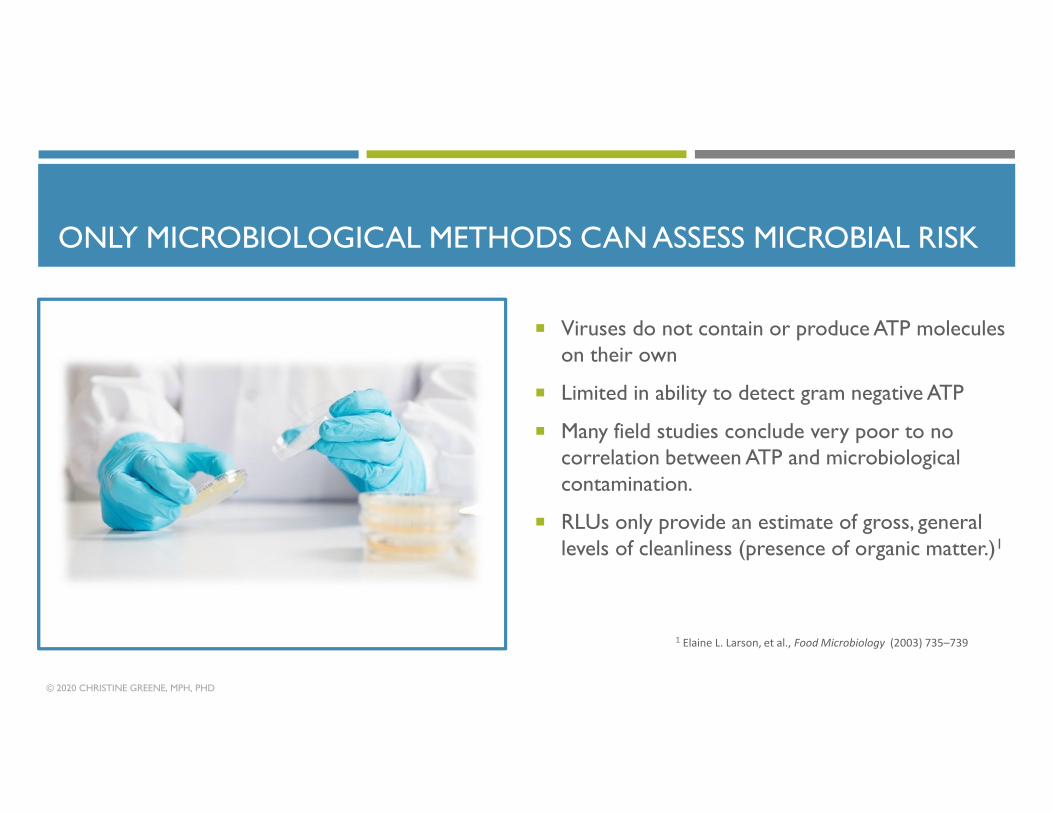
ONLY MICROBIOLOGICAL METHODS CAN ASSESS MICROBIAL RISK
� Viruses do not contain or produce ATP molecules on their own
� Limited in ability to detect gram negative ATP
� Many field studies conclude very poor to no correlation between ATP and microbiological contamination.
� RLUs only provide an estimate of gross, general levels of cleanliness (presence of organic matter.)1
1 Elaine L. Larson, et al., Food Microbiology (2003) 735–739
© 2020 CHRISTINE GREENE, MPH, PHD

MICROBIAL SAMPLING
WHAT YOU
NEED TO
KNOW…
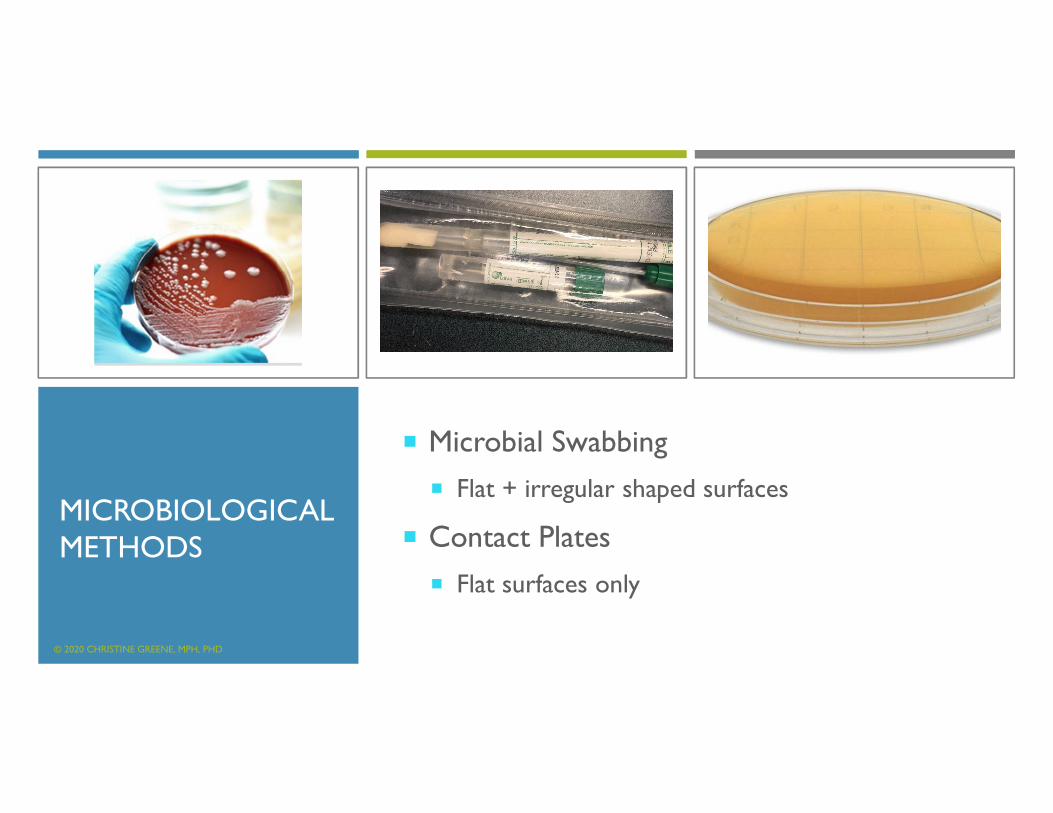
MICROBIOLOGICAL METHODS
� Microbial Swabbing
� Flat + irregular shaped surfaces
� Contact Plates
� Flat surfaces only
© 2020 CHRISTINE GREENE, MPH, PHD
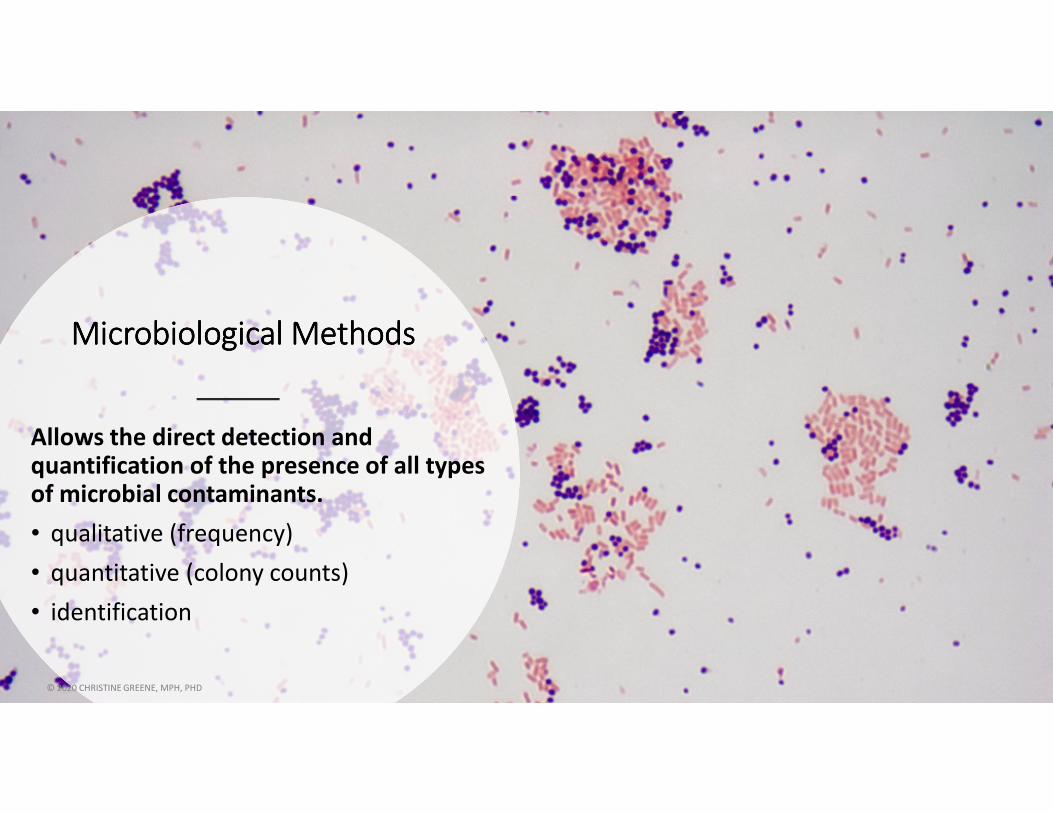
Microbiological MethodsMicrobiological MethodsMicrobiological MethodsMicrobiological Methods
Allows the direct detection and
quantification of the presence of all types
of microbial contaminants.
• qualitative (frequency)
• quantitative (colony counts)
• identification
© 2020 CHRISTINE GREENE, MPH, PHD
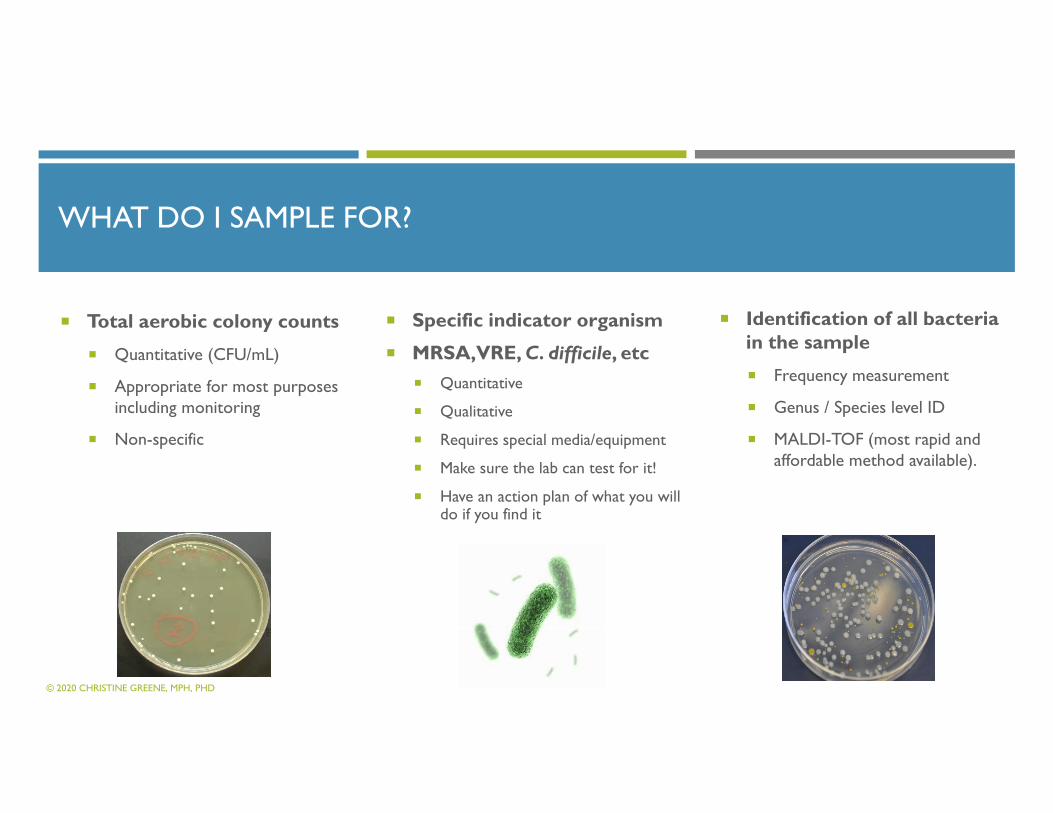
WHAT DO I SAMPLE FOR?
� Total aerobic colony counts
� Quantitative (CFU/mL)
� Appropriate for most purposes including monitoring
� Non-specific
� Specific indicator organism
� MRSA, VRE, C. difficile, etc
� Quantitative
� Qualitative
� Requires special media/equipment
� Make sure the lab can test for it!
� Have an action plan of what you will do if you find it
� Identification of all bacteria in the sample
� Frequency measurement
� Genus / Species level ID
� MALDI-TOF (most rapid and affordable method available).
© 2020 CHRISTINE GREENE, MPH, PHD

QUALITATIVEVSQUANTITATIVEANALYSIS
� Quantitative
� Colony Counts (ACC)
� Reported as: colony forming units (CFU) per sample or per cm2
� Log Reduction and % Reduction in bioburden
� Qualitative
� Growth or no growth of bacteria
� Reported as: present or absent
� % reduction in positive samples
© 2020 CHRISTINE GREENE, MPH, PHD

� Microbiological
� Cleaning/disinfecting quality standards1,2
� Aerobic Colony Counts: <2.5 cfu/cm2
� Specific indicator organisms: <1 cfu/cm2)
� Pharma requirements depend on ISO Classification
� “Clean rooms”
1 Mulvey et al. J Hosp Infect 2011;77:25-30.2 Malik et al. Am J Infect Control 2003;31:181-187.
BENCHMARKING(Pass/fail criteria)
Important considerations before collecting microbial swab samples …
~ swab selection~ transport media~ sampling technique
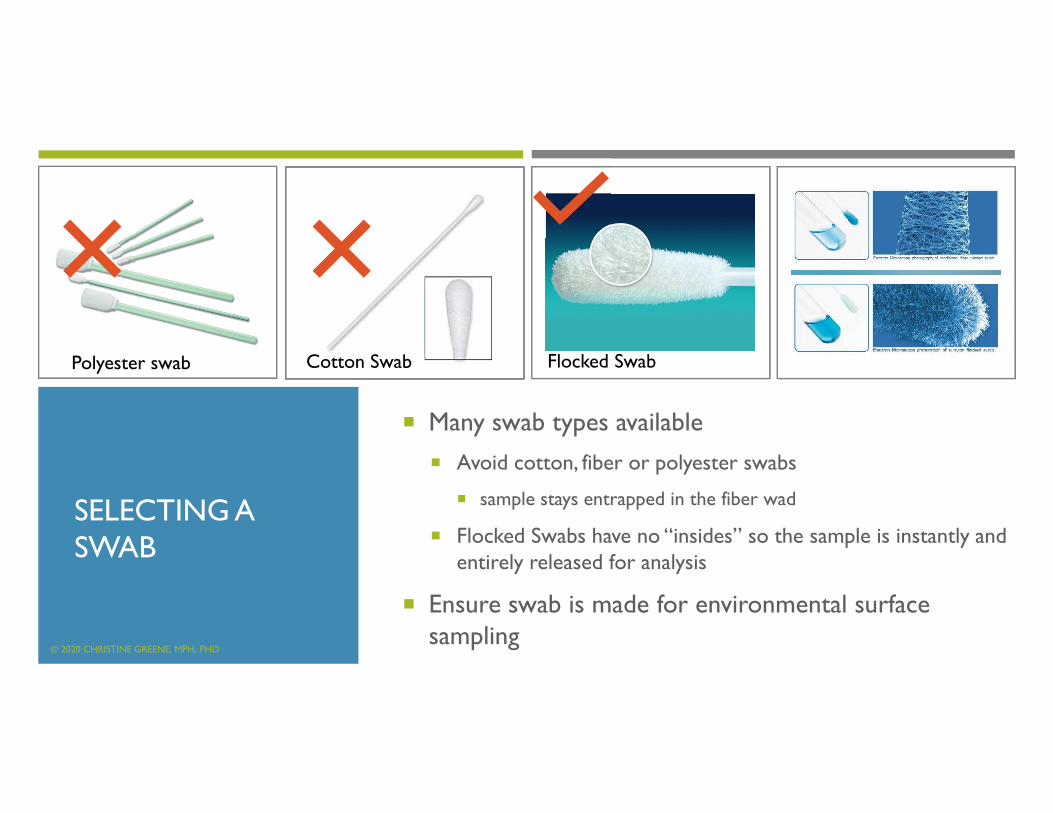
SELECTING A SWAB
� Many swab types available
� Avoid cotton, fiber or polyester swabs
� sample stays entrapped in the fiber wad
� Flocked Swabs have no “insides” so the sample is instantly and entirely released for analysis
� Ensure swab is made for environmental surface sampling
Polyester swab Cotton Swab Flocked Swab
© 2020 CHRISTINE GREENE, MPH, PHD
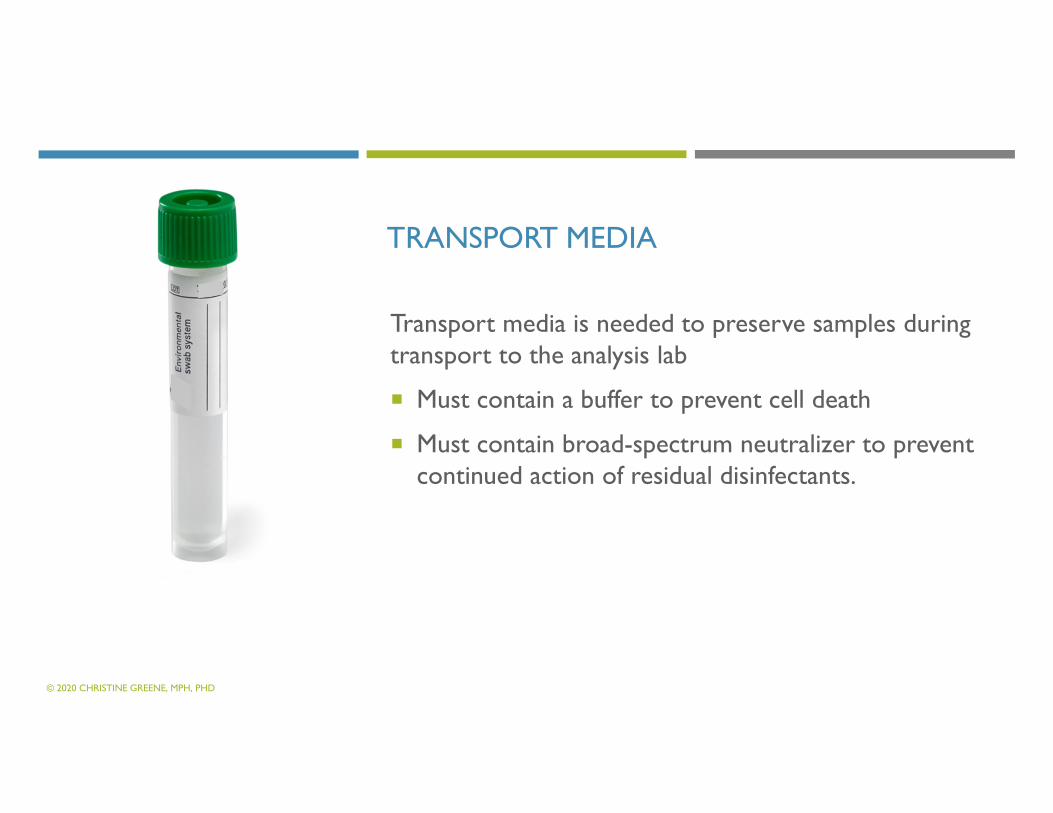
TRANSPORT MEDIA
Transport media is needed to preserve samples during transport to the analysis lab
� Must contain a buffer to prevent cell death
� Must contain broad-spectrum neutralizer to prevent continued action of residual disinfectants.
© 2020 CHRISTINE GREENE, MPH, PHD

2Apply consistent pressure!
Rotate or flip over the swab throughout the process.
1Using a template, ensure full coverage of the surface area.
Keep sampling area size consistent between samples
© 2020 CHRISTINE GREENE, MPH, PHD
COLLECTING MICROBIAL
SWAB SAMPLES

� Ship using freezer packs in insulated shipping box.
� Do NOT use dry ice!
� DO NOT use ice in a ziplockbaggie!
� Don’t forget to include documentation!!
� Ship overnight to the lab!
SAMPLE TRANSPORTATION
POLLING QUESTION:
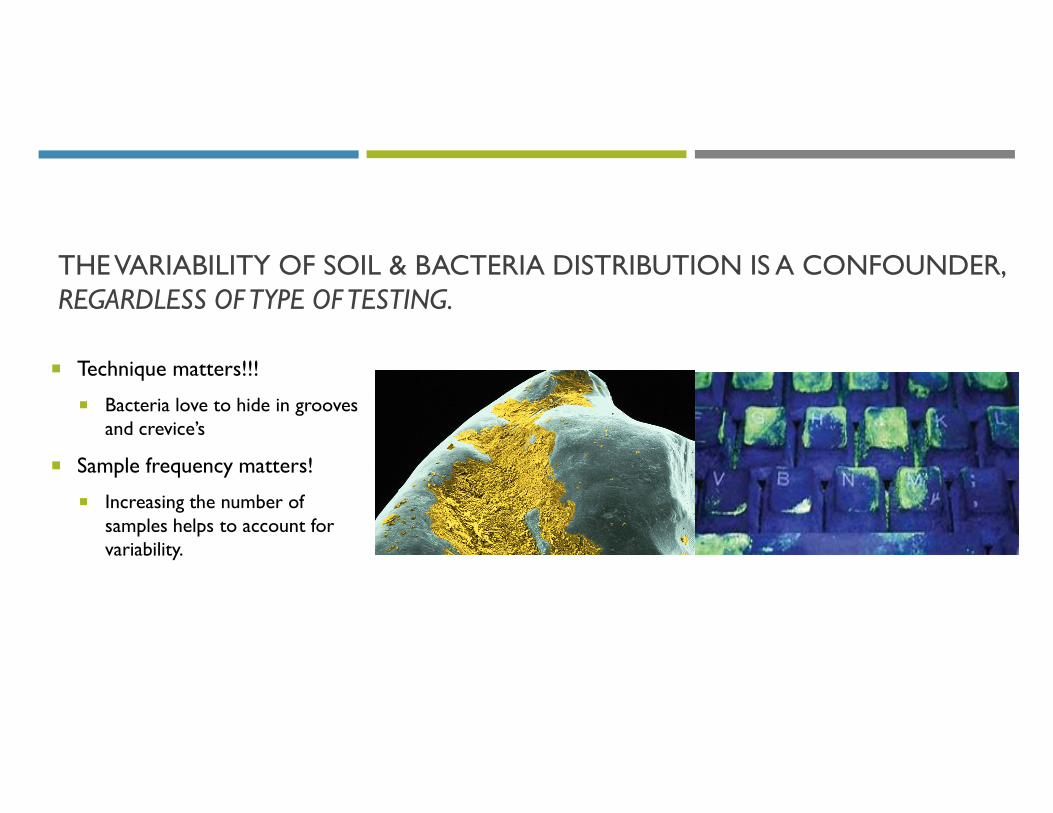
THE VARIABILITY OF SOIL & BACTERIA DISTRIBUTION IS A CONFOUNDER,REGARDLESS OF TYPE OF TESTING.
� Technique matters!!!
� Bacteria love to hide in grooves and crevice’s
� Sample frequency matters!
� Increasing the number of samples helps to account for variability.
DEVELOPING A SURFACE SAMPLING PLAN:THE BASICS
WHERE TO COLLECT SAMPLES?
WHEN & HOW OFTEN TO COLLECT SAMPLES?
ACTION PLAN
WHEN TO USE ATP OR MICROBIAL METHODS?
Your Surface Sampling Plan
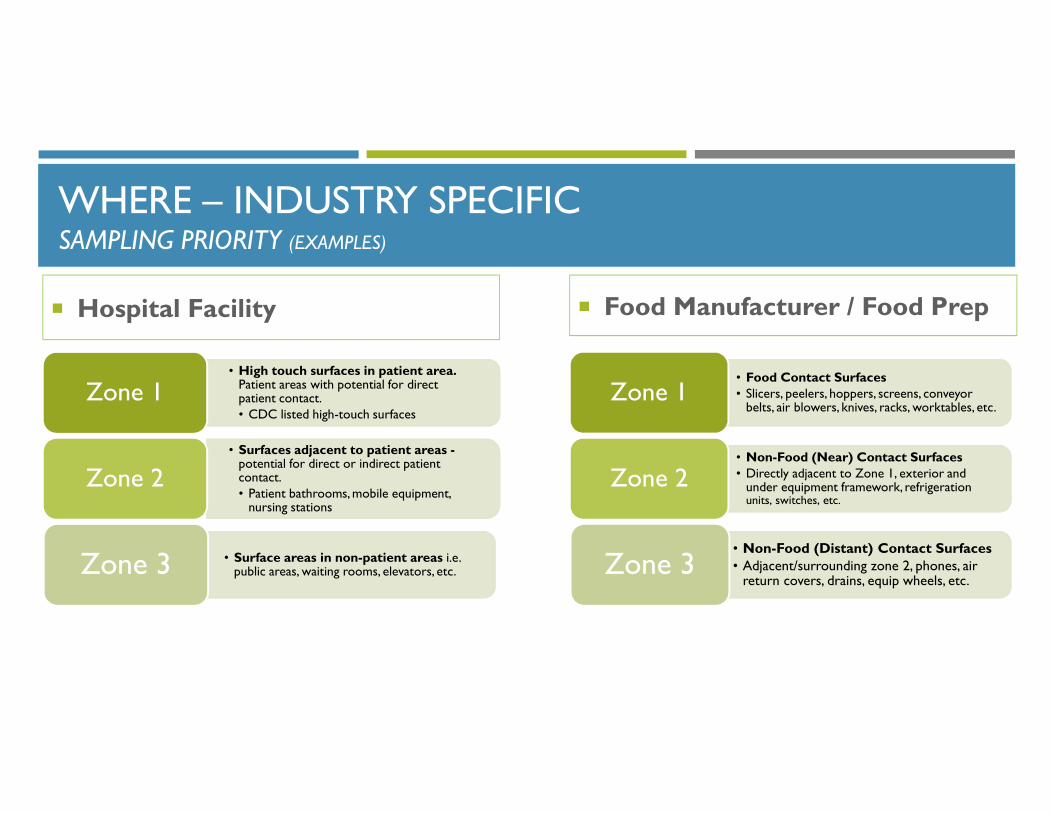
WHERE – INDUSTRY SPECIFICSAMPLING PRIORITY (EXAMPLES)
• Food Contact Surfaces• Slicers, peelers, hoppers, screens, conveyor
belts, air blowers, knives, racks, worktables, etc.Zone 1
• Non-Food (Near) Contact Surfaces• Directly adjacent to Zone 1, exterior and
under equipment framework, refrigerationunits, switches, etc.
Zone 2
• Non-Food (Distant) Contact Surfaces
• Adjacent/surrounding zone 2, phones, air return covers, drains, equip wheels, etc.
Zone 3
• High touch surfaces in patient area. Patient areas with potential for direct patient contact.• CDC listed high-touch surfaces
Zone 1
• Surfaces adjacent to patient areas -potential for direct or indirect patient contact.• Patient bathrooms, mobile equipment,
nursing stations
Zone 2
• Surface areas in non-patient areas i.e. public areas, waiting rooms, elevators, etc.Zone 3
� Hospital Facility � Food Manufacturer / Food Prep
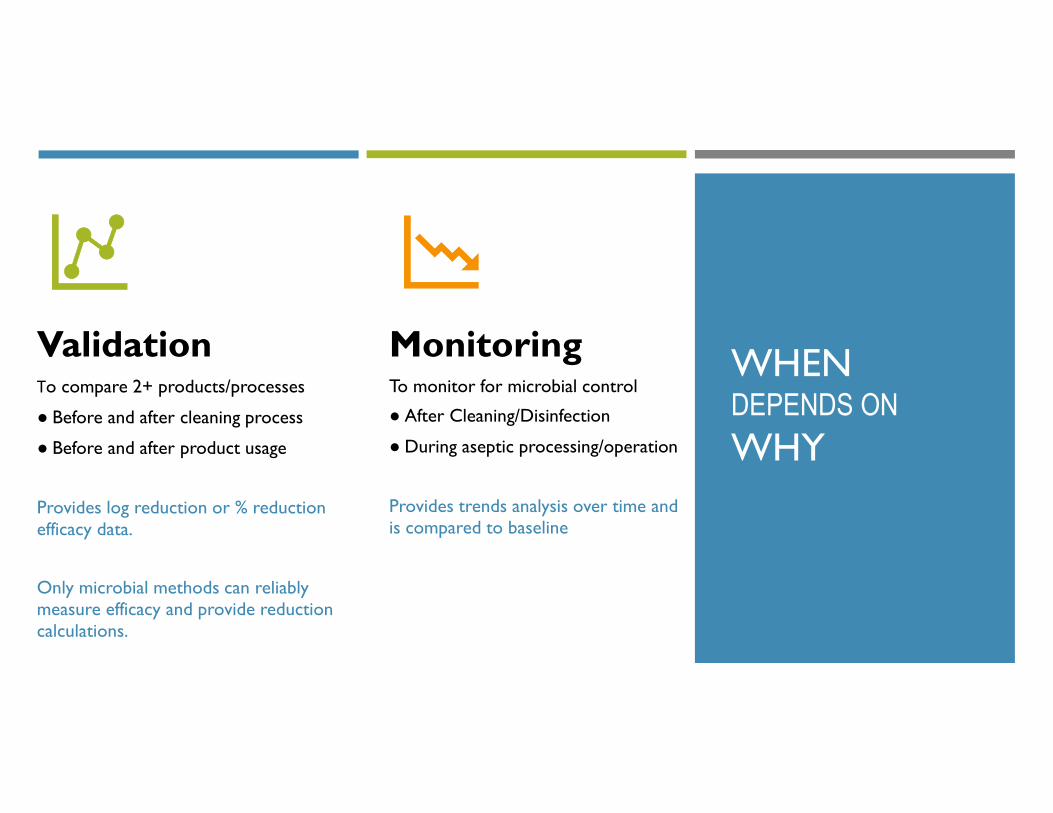
WHEN DEPENDS ON
WHY
ValidationTo compare 2+ products/processes
● Before and after cleaning process
● Before and after product usage
Provides log reduction or % reduction efficacy data.
Only microbial methods can reliably measure efficacy and provide reduction calculations.
Monitoring To monitor for microbial control
● After Cleaning/Disinfection
● During aseptic processing/operation
Provides trends analysis over time and is compared to baseline
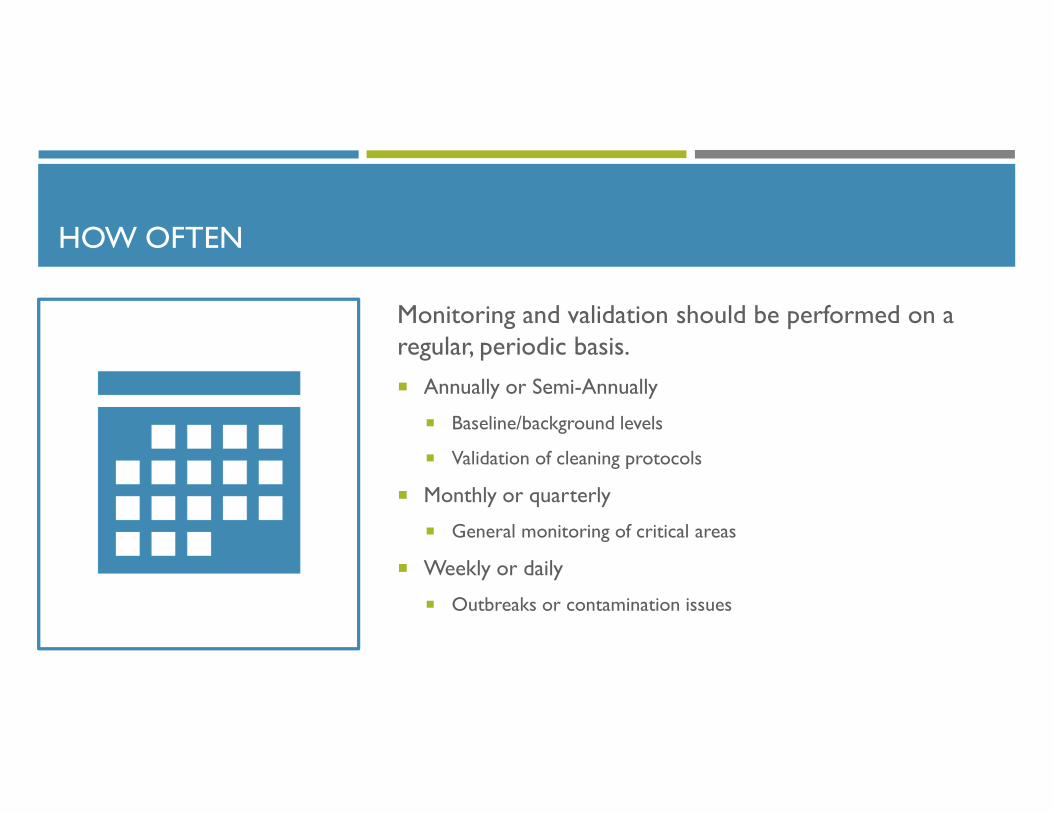
HOW OFTEN
Monitoring and validation should be performed on a regular, periodic basis.
� Annually or Semi-Annually
� Baseline/background levels
� Validation of cleaning protocols
� Monthly or quarterly
� General monitoring of critical areas
� Weekly or daily
� Outbreaks or contamination issues

YOU HAVE YOUR RESULTS … NOW WHAT?
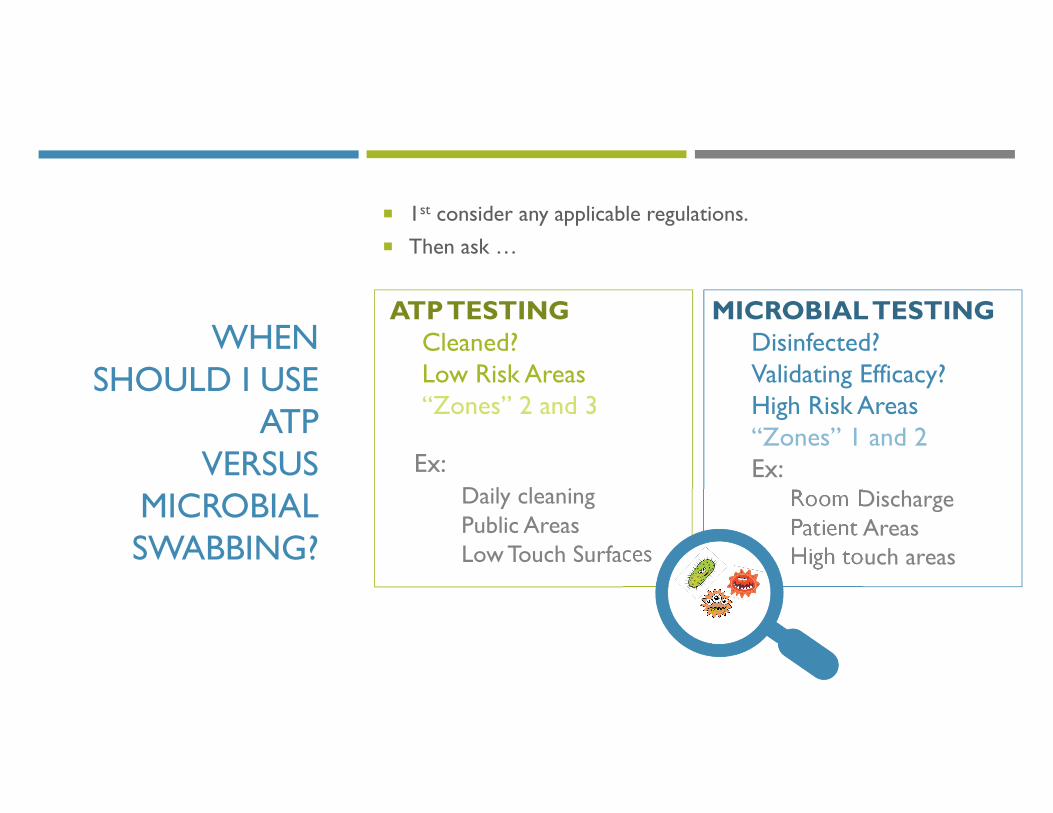
ATP TESTINGCleaned?Low Risk Areas“Zones” 2 and 3
Ex:Daily cleaningPublic AreasLow Touch Surfaces
MICROBIAL TESTINGDisinfected?Validating Efficacy?High Risk Areas“Zones” 1 and 2Ex:
Room DischargePatient AreasHigh touch areas
WHEN SHOULD I USE
ATP VERSUS
MICROBIAL SWABBING?
� 1st consider any applicable regulations.
� Then ask …

REFERENCES:
� Elaine L. Larson, et al., Bioluminescence ATP monitoring as a surrogate marker for microbial load on hands and surfaces in the home. Food Microbiology (2003) 20, 735–739.
� Navid Omidbakhsh et al. How Reliable Are ATP Bioluminescence Meters in Assessing Decontamination of Environmental Surfaces in Healthcare Settings? PLoS ONE (2014) 9:6, e99951. DOI: 10.1371/journal.pone.0099951
� Danielle E Turner, et al., Efficacy and Limitations of an ATP-Based Monitoring System. Journal of the American Association for Laboratory Animal Science (2010) 49:2, 190-195.
� Juha Lappalainen. Microbial Testing Methods for Detection of Residual Cleaning Agents and Disinfectants—Prevention of ATP Bioluminescence Measurement Errors in the Food Industry. Journal of Food Protection (2000) 63:2, 210–215.
� Madeline Valazquez and Joellen M. Feirtag. Quenching and Enhancement Effects of ATP Extractants, Cleansers, and Sanitizers on the Detection of the ATP. Journal of Food Protection (1997) 60:7, 799-803.
� G. Shama, D.J. Malik. The uses and abuses of rapid bioluminescence-based ATP assays. International Journal of Hygiene and Environmental Health (2013) 216, 115-125. http://dx.doi.org/10.1016/j.ijheh.2012.03.009.
� Emanuele Amodioa, Claudia Dinoba. Use of ATP bioluminescence for assessing the cleanliness of hospital surfaces: A review of the published literature (1990—2012). Journal of Infection and Public Health (2014) 7, 92-98.
REFERENCES:
� B.M. Andersen, M. Rasch, J. Kvist, T. Tollefsen, R. Lukkassen, L. Sandvik, et al. Floor cleaning: effect on bacteria and organic materials in hospital rooms. J Hosp Infect, 71 (2009), pp. 57-65.
� C.V. Sciortino, R.A. Giles. Validation and comparison of three adenosine triphosphate luminometers for monitoring hospital surface sanitization: a rosetta stone for adenosine triphosphate testing. Am J Infect Control, 40 (2013), pp. e233-e239
� G.S. Whiteley, C. Derry, T. Glasbey. The comparative performance of three brands of portable ATP-bioluminometerintended for use in hospital infection control. Healthc Infect, 17 (2012), pp. 91-97.
� G.S. Whiteley, T. O. Glasbey, P.P. Fahey. A suggested sampling algorithm for use with ATP testing in cleanliness measurement. Infection, Disease & Health, (2016) pp 169-175. https://doi.org/10.1016/j.idh.2016.11.003.
� Boyce et al. Infect Control Hosp Epidemiol 2011;32:1187-1189.
� Mulvey et al. J Hosp Infect 2011;77:25-30.

QUESTIONS?