tissue characterization using optical coherence tomography
TRANSCRIPT
University of ConnecticutOpenCommons@UConn
Master's Theses University of Connecticut Graduate School
7-7-2015
Tissue Characterization Using Optical CoherenceTomographyMina MahdianUniversity of Connecticut School of Medicine and Dentistry, [email protected]
This work is brought to you for free and open access by the University of Connecticut Graduate School at OpenCommons@UConn. It has beenaccepted for inclusion in Master's Theses by an authorized administrator of OpenCommons@UConn. For more information, please [email protected].
Recommended CitationMahdian, Mina, "Tissue Characterization Using Optical Coherence Tomography" (2015). Master's Theses. 793.https://opencommons.uconn.edu/gs_theses/793
i
Tissue Characterization Using Optical Coherence Tomography
Mina Mahdian
DDS, Shahid Beheshti School of Dentistry, 2009
A Thesis
Submitted in Partial Fulfillment of the
Requirements for the Degree of
Master of Dental Sciences
At the
University of Connecticut
2015
ii
APPROVAL PAGE
Masters of Dental Science Thesis
Tissue Characterization Using Optical Coherence Tomography
Presented by
Mina Mahdian, DDS
Major Advisor: _____________________________________
Dr. Aditya Tadinada
Associate Advisor: ___________________________________
Dr. Alan Lurie
Associate Advisor: ________________________________
Dr. Sumit Yadav
University of Connecticut
2015
iii
Acknowledgements:
I would like to express my sincere gratitude to my principal advisor, Dr. Aditya Tadinada
for his continuous support, patience and encouragement throughout this project. I would
also like to thank Dr. Alan Lurie, my associate advisor and program director, who has
taught me a lot, not only about oral and maxillofacial radiology, but also about life. My
sincere thanks also go to Dr. Sumit Yadav for his constructive comments and
mentorship. Special thanks goes to Mr. Hassan Salehi, PhD candidate in the
department of electrical engineering and a great friend who has been the mathematical
brain behind this project without whose contribution, this project would not have been
implemented. And last but not least, I would like to express my deepest gratitude to my
family- my parents and two brothers- whose constant support and good wishes have
been my all-time companions throughout the past three years of my residency program
at the University of Connecticut.
iv
Table of Contents:
Approval page ………………………………………………………………………….ii
Acknowledgements …………………………………………………………………..iii
Table of contents ……………………………………………………………………...iv
Abstract ………………………………………………………………………………….v
Introduction ……………………………………………………………………………..1
Hypothesis ……………………………………………………………………………..7
Materials and Methods ……………………………………………………………......8
Results ………………………………………………………………………………….13
Discussion ……………………………………………………………………………..28
Conclusion ……………………………………………………………………………..32
References ……………………………………………………………………………..33
v
Abstract:
Optical coherence tomography (OCT) is a non-invasive imaging modality, which
provides real-time near-histology resolution images. In dentistry, OCT has been used
for early detection of carious lesions, malignant changes in the oral tissues and other
indications. However, to the best of our knowledge there is no information regarding the
ability of this imaging modality in differentiating between different types of tissues in the
oral cavity. If OCT proves to be able to render information regarding the properties of
tissues, it can be used to detect pathological changes at an early stage, which results in
better treatment outcomes. In this study, we imaged five types of tissues, i.e., human
enamel, human cortical bone, human trabecular bone, rat masseteric muscle and fatty
tissue plus water and air using OCT (Axsun Inc. Billerica, MA). We then developed an
algorithm to determine the intensity profile, pixel intensity values and histograms for
each sample. The same tissues plus water and air were also imaged using cone beam
computed tomography (CBCT) and gray scale values were measured for each tissue.
The mean pixel intensity values and gray scale values for the OCT images and CBCT
scans of each tissue were reported, respectively. A similar pattern was observed in the
pixel intensity values and gray scale values in both imaging modalities. Therefore, within
the limitations of this study, it was concluded that OCT can reliably differentiate between
different tissues (hard and soft tissues) in vitro and the results are comparable to CBCT
gray scale values.
1
Introduction:
With the discovery of X-rays in 1895 by Wilhem Roentgen, radiographic imaging has
become an essential component in the diagnosis and follow-up of a variety of
pathological conditions. Over the years, researchers have been working on advancing
the field in order to better understand the disease process with optimum accuracy and
efficiency. Therefore, diagnostic imaging has undergone many changes to develop the
most effective and efficient imaging modality that is diagnostically acceptable and
exposes the patient to the minimum detrimental effects associated with ionizing
radiation (1). The challenges associated with ionizing radiation forever will caution the
clinician to consider the risk-benefit analyses before any diagnostic radiation exposure.
While the fundamental principle of As Low as Reasonable Achievable (ALARA) remains
the cornerstone for responsible imaging, an evolving concept known as ALADA (As low
as diagnostically acceptable) forms the basis for the development of new and advanced
imaging modalities in medicine and dentistry that either mitigate the radiation exposure
or work on alternative sources of imaging. Science and industry work together to
advance the field of diagnostic imaging based on this principle (2).
For years, clinicians have been trying to establish an accurate and reliable method to
detect and quantify changes in the properties of the tissue that is undergoing
pathological changes. This enables the clinician to understand the disease process
better and to detect changes in an early stage resulting in more successful treatment
outcome (3-5).
It has been well documented that any changes in tissue characteristics due to a
pathological or physiological process affects the tissue attenuation coefficient, tissue
2
echogenicity, tissue diffusion coefficient and its optical properties which are detectable
using computed tomography (CT), ultrasonography (US), magnetic resonance imaging
(MRI) and optical coherence tomography (OCT), respectively (6-11).
Multi-detector computed tomography (MDCT) and cone beam computed tomography
(CBCT) differentiate tissues on the basis of their attenuation characteristics, which in
turn are primarily a function of tissue density (12). In medical CT (MDCT), a standard
scaling scheme has been established to differentiate between the attenuation
coefficients in different tissues, known as Hounsfield Units (HU), whereas in dental CT
(CBCT), the manufacturers have not yet been able to establish a standard system for
scaling the grey levels representing the reconstructed values. The absence of such a
system makes it difficult to compare tissue densities between different machines (13-
16). To date, the use of Hounsfield units (HU) has probably been the most reliable
method for differentiating between tissues. However, due to the significant detrimental
effects associated with high dose ionizing radiation delivered during a CT scan,
researchers are working towards developing post-processing algorithms to be able to
extrapolate information regarding tissue properties from less-invasive imaging
modalities such as US, MRI and OCT.
Ultrasonography is a non-invasive imaging modality that can provide valuable
information regarding tissue properties based on the acoustic backscatter coefficient of
the tissue (11). Using the spectrum analysis method, researchers have been able to
reliably demonstrate the ability of US imaging in detecting pathological changes in
various organs such as the eye, breast, prostate, kidney and liver (17-20).
3
Another non-invasive imaging modality that has revolutionized the field of diagnostic
sciences is magnetic resonance imaging (MRI). This modality is based on the
electromagnetic properties of tissues and can assist the clinician in differentiating
between diseased and non-diseased tissues (21, 22). Ever since the invention of MRI in
medicine, researchers have been trying to expand upon the various applications of this
modality and enhance its efficiency by reducing the examination time and improving the
image quality (23, 24).
Optical imaging techniques have contributed to numerous cellular and molecular
biological discoveries in medicine and dentistry by providing microscopic like detailed
information using near-infrared light (9,25). Optical coherence tomography is a high-
resolution optical modality, which uses broadband light and provides high-resolution
subsurface tissue images. The images are obtained in real-time and near histo-
pathological level resolution (26-30). OCT is analogous to ultrasound B mode imaging
except that it uses light rather than sound, therefore achieving unprecedented image
resolutions (1-10 µm), approximately 100 times higher than conventional ultrasound by
using broad bandwidth light sources in combination with interferometric detection
techniques (31).
Since its invention in the early 1990s, the original concept of OCT was to enable non-
invasive optical biopsy, i.e., the real time, in situ imaging of tissue microstructure with a
resolution approaching that of histology, but without the need for tissue excision and
post-processing. In order to accomplish this goal, recent research in OCT has achieved
quantum advances in resolution (sub-µm), data acquisition speed (more than 1,000,000
measurements/s), optimization of tissue penetration (up to 2 mm). Hence OCT can now
4
be considered as an optical analogue to CT or MRI, but with microscopic resolution for
superficial tissue (31, 32).
In dentistry, the imaging modality of choice for the majority of procedures is still
conventional two-dimensional imaging. With the introduction of cone beam computed
tomography (CBCT) in the early 1990’s, dental radiology has entered a new era and
researchers and manufacturers have been working on improving the image quality,
definition and resolution of the images while reducing the patient’s exposure to radiation
(33,34). Compared to multi-detector computed tomography (MDCT) in medicine, CBCT
generally delivers less radiation to the patient, making it the three dimensional imaging
modality of choice for a variety of procedures including implant treatment planning,
diagnosis of pathosis in the maxillofacial region and contemporary approaches to
orthognathic surgery (33,35,36). However, like any other diagnostic technique, CBCT
has its own limitations including low contrast resolution compared to MDCT, which does
not provide sufficient information regarding soft tissue structures. Furthermore, similar to
MDCT and any other imaging modality that uses ionizing radiation, it does not typically
demonstrate pathological changes at early stages, i.e., molecular/cellular levels.
Another disadvantage with CBCT is that despite the significant improvement in reducing
radiation doses, it still involves the use of ionizing radiation (37). Therefore, the focus of
several researcher groups has been towards developing modalities that do not use
ionizing radiation as a source for imaging such as dental MRI and optical coherence
tomography (38, 39).
Optical coherence tomography has been studied extensively for the detection of early
carious lesions, micro-fractures, pulpal inflammation, properties of dental materials,
5
early dysplastic changes in oral malignancies, early inflammatory changes in the
periodontal tissues and PDL changes due to orthodontic tooth movement (27, 40-61).
Extensions of OCT have been developed that enable non-invasive depth resolved
functional or contrast enhanced imaging, providing spectroscopic, metabolic,
polarization-sensitive, blood flow or physiologic tissue information. These new OCT
technologies promise to not only improve image contrast, but also enable the
differentiation of pathology using localized metabolic properties or the functional state.
Refractive index
In optics, the refractive index (n) of an optical medium is a number that describes how
light, or any other radiation, propagates through that medium. It is defined as: 𝑛 =𝑐
𝑣 ,
where c is the speed of light in vacuum and v is the phase velocity of light in the
medium. For example, the refractive index of water is 1.33, meaning that light travels
1.33 times faster in a vacuum than it does in water (62).
The refractive index determines how much light is refracted, when entering a
material. The refractive indices also determine the amount of light that is reflected when
reaching the interface, as well as the critical angle for total internal reflection (63, 64).
The refractive index varies with the wavelength of light. This is called dispersion and
causes the splitting of white light into its constituent colors in prisms, and chromatic
aberration in lenses (62). In general, the refractive index of a glass increases with
its density. However, there does not exist an overall linear relation between the
refractive index and the density for all silicate and borosilicate glasses. A relatively high
refractive index and low density can be obtained with glasses containing light metal
6
oxides such as Li2O and MgO, while the opposite trend is observed with glasses
containing PbO and BaO (65).
Traditionally, the n of a tissue has been determined by immersing the tissue in fluids
with matching n. However, over the years, new methods have emerged including
employing low-coherence interferometry, a principle on which OCT is based (66, 67).
Hariri and colleagues have shown that optical coherence tomography can estimate the
mineral content in the enamel and dentin (67). Furthermore, Gandjbakhche and
colleagues have developed a method to quantify parameters associated with
pathological changes in breast tissue for functional characterization of tumors using
optical imaging (9). In dentistry, there is limited information on optical coherence
spectroscopy and tissue characterization using optical imaging, therefore, the purpose
of this study is to evaluate the ability of OCT to characterize selected samples of hard
and soft tissues in the oral cavity.
7
Hypotheses:
1. Optical coherence tomography can differentiate between a range of hard and soft
tissues, water and air based on their densities.
2. Cone beam computed tomography can differentiate between a range of hard and
soft tissues, water and air based on their densities.
3. Pixel intensity values obtained from OCT are comparable to gray scale values
obtained using cone beam computed tomography.
8
Materials and methods
Study design:
This is a comparative observational study in which we attempted to evaluate the ability
of OCT in tissue characterization and quantify optical density for a range of biological
tissues. We then compared the values obtained from OCT images with grayscale
values of the same tissue obtained from CBCT volumes.
The study was done in two phases:
Phase 1: Imaging with Optical Coherence Tomography
Five different tissues (rat masseteric muscle, fatty tissue, human cancellous bone,
human cortical bone, human enamel) were prepared in blocks of 5mm x 5mm x 3mm
(width x length x height). Water was also poured in a container with similar dimensions.
The surfaces of the tissues were kept hydrated for optimal light penetration and
refraction (68). The OCT machine that was used in the present study was a prototype
OCT unit provided by Axsun Technologies (Axsun Technologies Inc., Billerica, MA)
(Figure 1). It is a swept source OCT machine operating at wavelengths ranging between
1250 nm and 1360 nm with an average power of 18 mW and a scan rate of 50-100
KHz.
9
Figure 1- OCT machine, Axsun Inc.
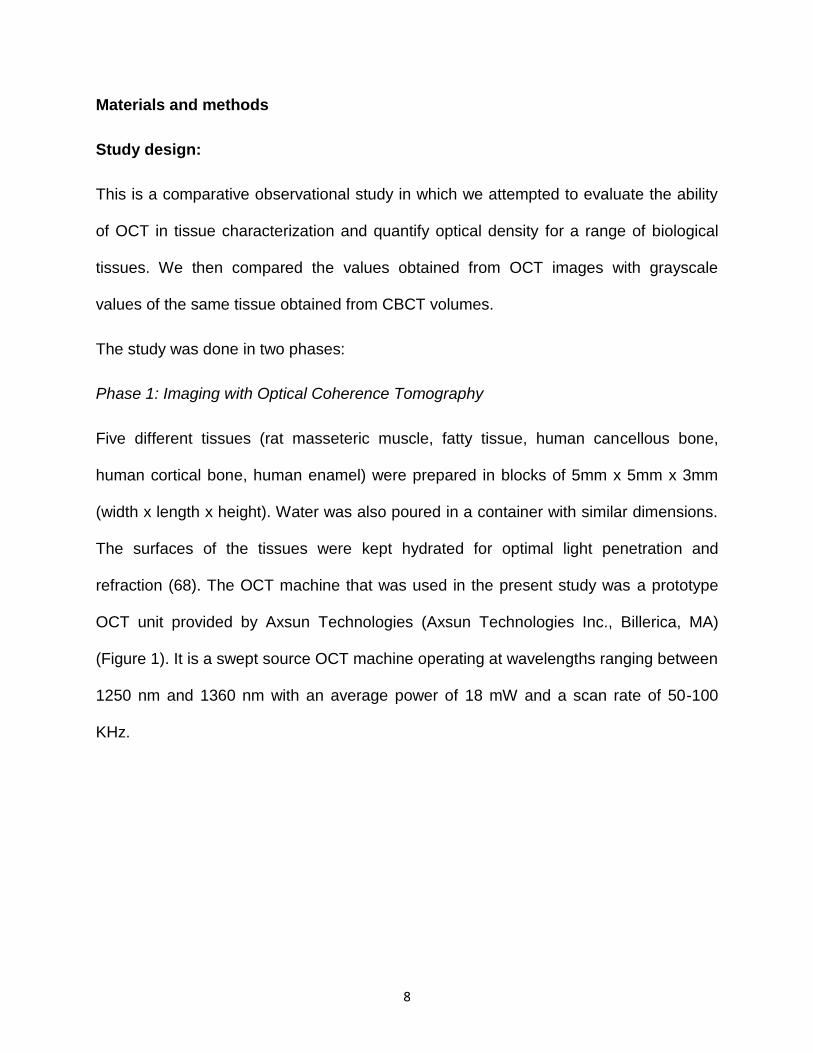
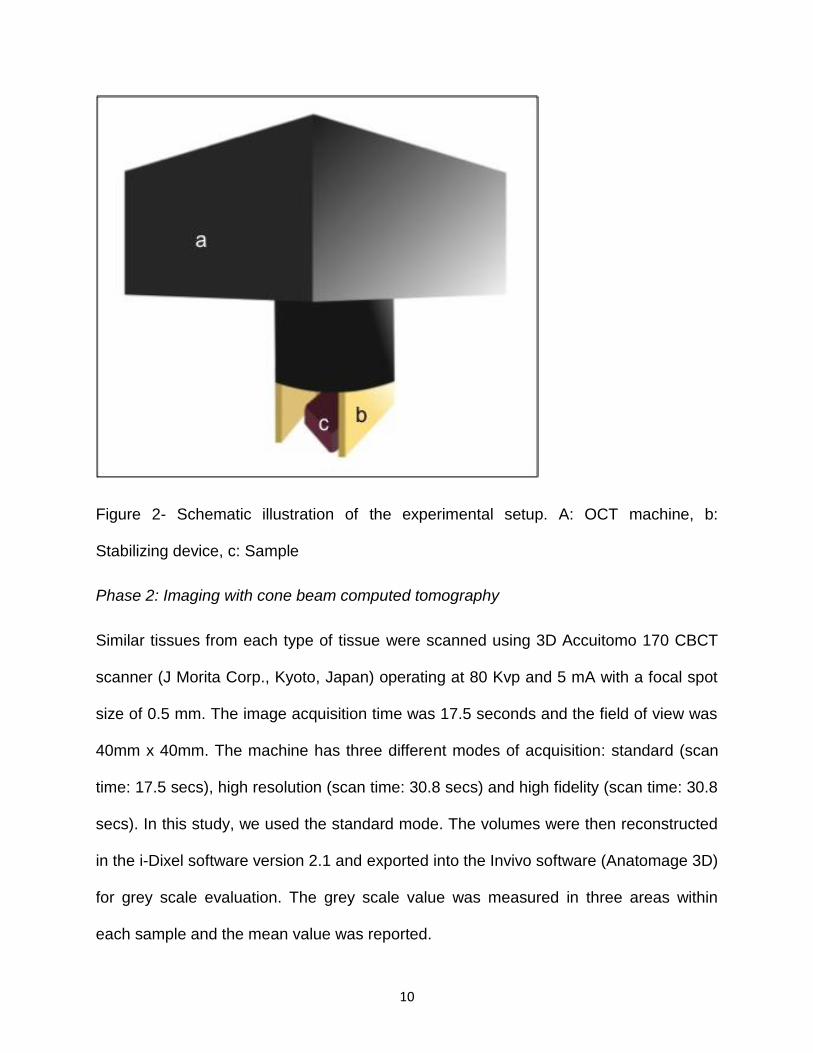
The probe was placed atop a 2cm x 2cm stabilizing device to maintain a standard
distance from the samples. Figure 2 illustrates a schematic diagram of the experimental
setup. Ten samples from each tissue were imaged and the images were imported and
saved in jpeg format. The images were then subjected to post-processing mathematical
algorithms in MATLAB in order to determine the intensity profiles and histograms for the
tissues. The mean pixel intensity values for each group of samples were calculated.
10
Figure 2- Schematic illustration of the experimental setup. A: OCT machine, b:
Stabilizing device, c: Sample
Phase 2: Imaging with cone beam computed tomography
Similar tissues from each type of tissue were scanned using 3D Accuitomo 170 CBCT
scanner (J Morita Corp., Kyoto, Japan) operating at 80 Kvp and 5 mA with a focal spot
size of 0.5 mm. The image acquisition time was 17.5 seconds and the field of view was
40mm x 40mm. The machine has three different modes of acquisition: standard (scan
time: 17.5 secs), high resolution (scan time: 30.8 secs) and high fidelity (scan time: 30.8
secs). In this study, we used the standard mode. The volumes were then reconstructed
in the i-Dixel software version 2.1 and exported into the Invivo software (Anatomage 3D)
for grey scale evaluation. The grey scale value was measured in three areas within
each sample and the mean value was reported.
11
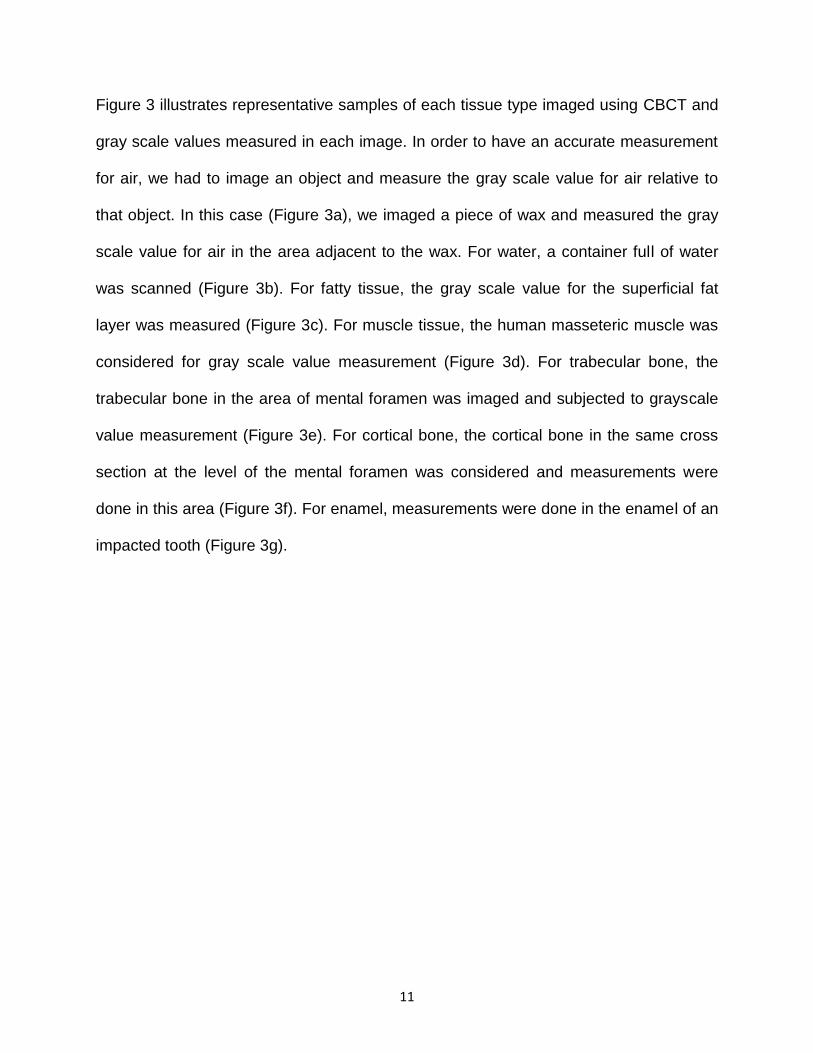
Figure 3 illustrates representative samples of each tissue type imaged using CBCT and
gray scale values measured in each image. In order to have an accurate measurement
for air, we had to image an object and measure the gray scale value for air relative to
that object. In this case (Figure 3a), we imaged a piece of wax and measured the gray
scale value for air in the area adjacent to the wax. For water, a container full of water
was scanned (Figure 3b). For fatty tissue, the gray scale value for the superficial fat
layer was measured (Figure 3c). For muscle tissue, the human masseteric muscle was
considered for gray scale value measurement (Figure 3d). For trabecular bone, the
trabecular bone in the area of mental foramen was imaged and subjected to grayscale
value measurement (Figure 3e). For cortical bone, the cortical bone in the same cross
section at the level of the mental foramen was considered and measurements were
done in this area (Figure 3f). For enamel, measurements were done in the enamel of an
impacted tooth (Figure 3g).
12
Figure 3(a-g) – Representative CBCT images of each type of tissue and grayscale
values for each tissue. A: air, b: water, c: fatty tissue, d: muscle tissue, e: trabecular
bone, f: cortical bone, g: enamel.
13
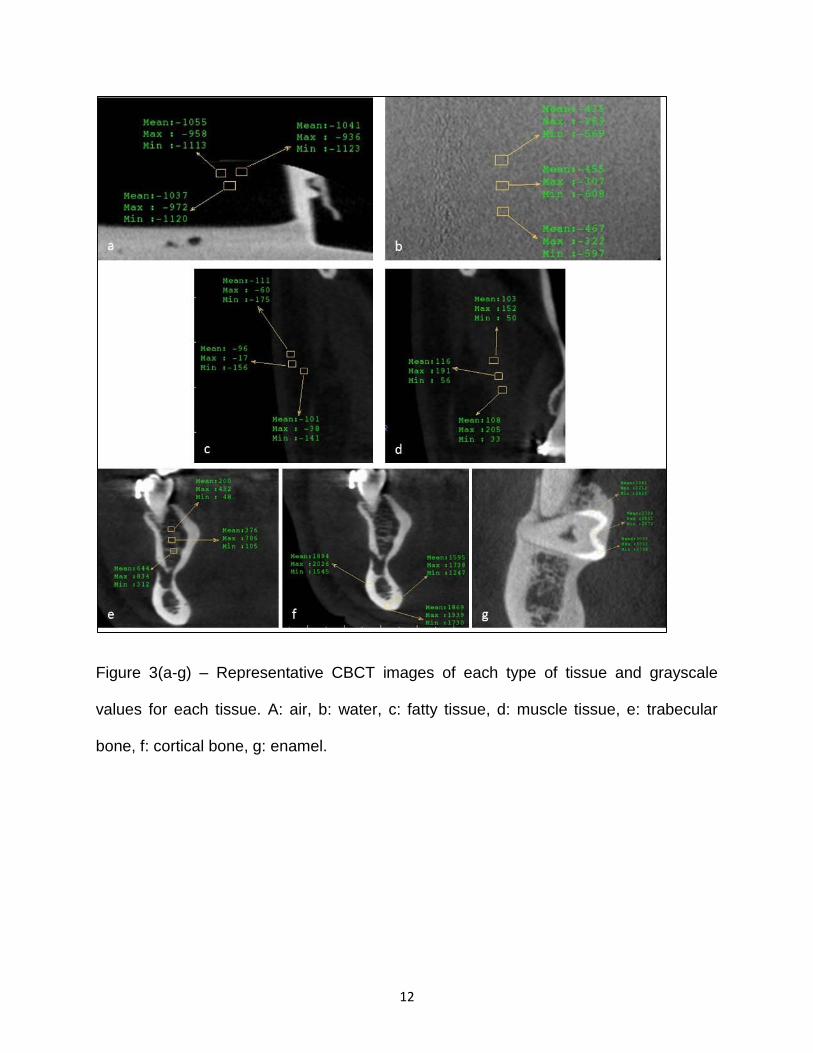
Results:
Figures 4 and 5 show the OCT image and the corresponding intensity profile, contour
plot and histogram for air. The intensity profile provides information regarding surface
characteristics as well as internal texture of the tissue/specimen. The intensity profile for
air was very homogeneous and at a low spectrum. Only one spike was observed which
is reflective of the vertical line going through the corresponding OCT image (Figure 4).
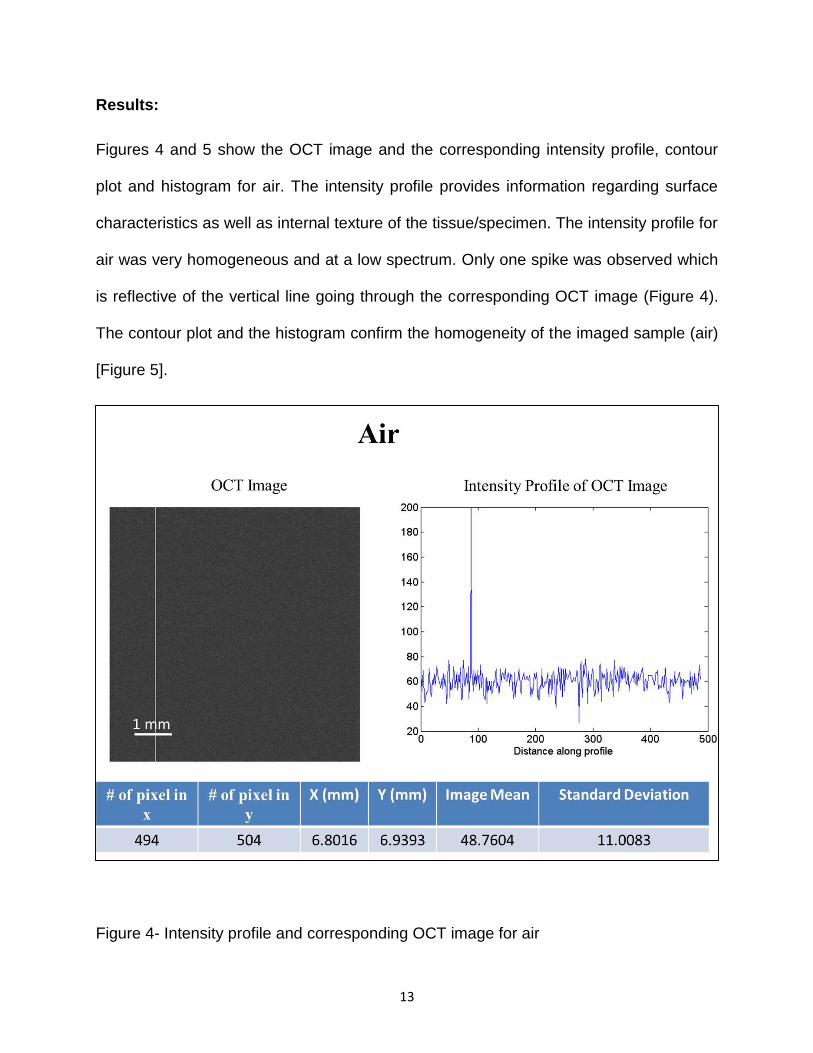
The contour plot and the histogram confirm the homogeneity of the imaged sample (air)
[Figure 5].
Figure 4- Intensity profile and corresponding OCT image for air
14
Figure 5- Contour plot and histogram for air
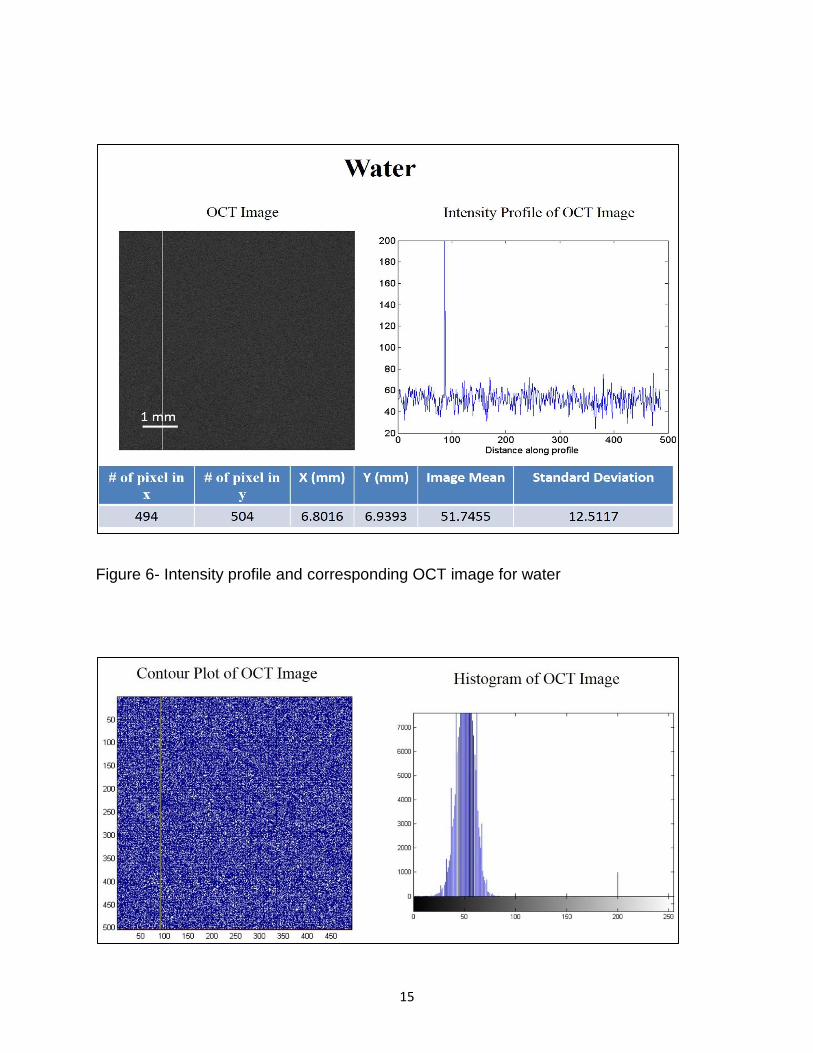
The intensity profile for water (Figure 6) shows a relatively slight degree of
heterogeneity compared to air which may be due to the presence of particles in water. A
spike is seen in the profile which corresponds to the vertical line in the OCT image. The
contour plot is slightly denser compared to air and the histogram is broader which
indicates that scatter characteristics of water is different compared to air (Figure 7).
15
Figure 6- Intensity profile and corresponding OCT image for water
16
Figure 7- Contour plot and histogram for water
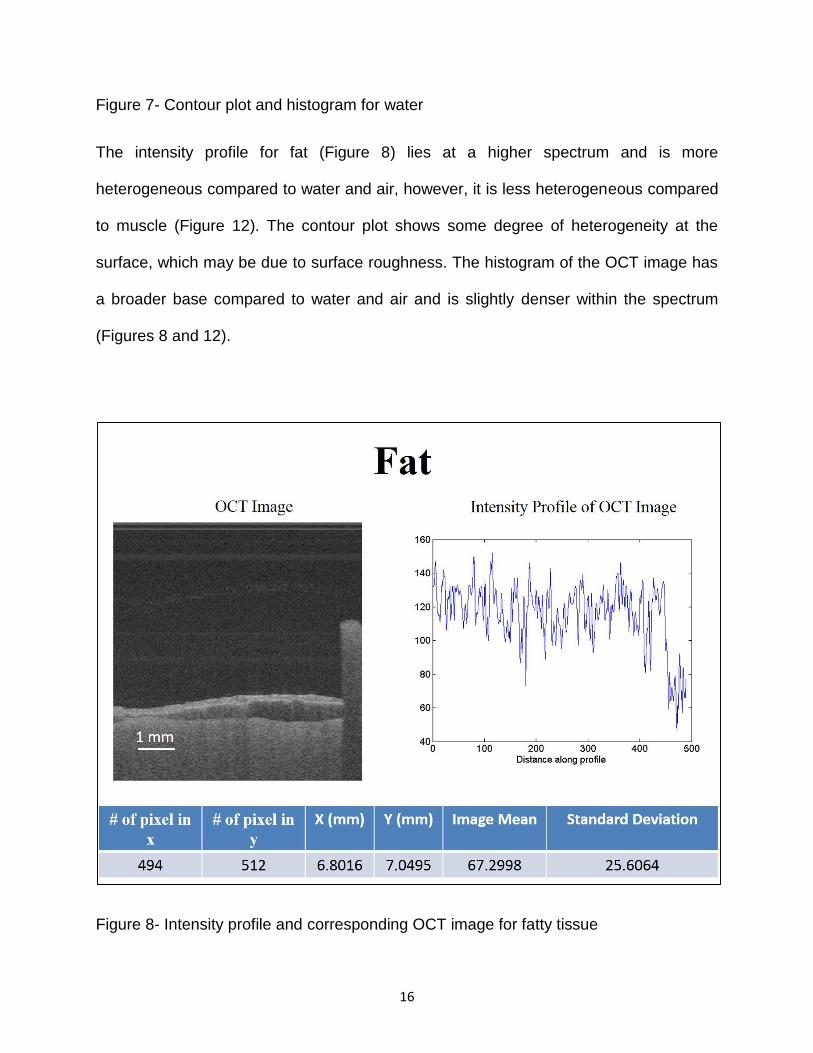
The intensity profile for fat (Figure 8) lies at a higher spectrum and is more
heterogeneous compared to water and air, however, it is less heterogeneous compared
to muscle (Figure 12). The contour plot shows some degree of heterogeneity at the
surface, which may be due to surface roughness. The histogram of the OCT image has
a broader base compared to water and air and is slightly denser within the spectrum
(Figures 8 and 12).
Figure 8- Intensity profile and corresponding OCT image for fatty tissue
17
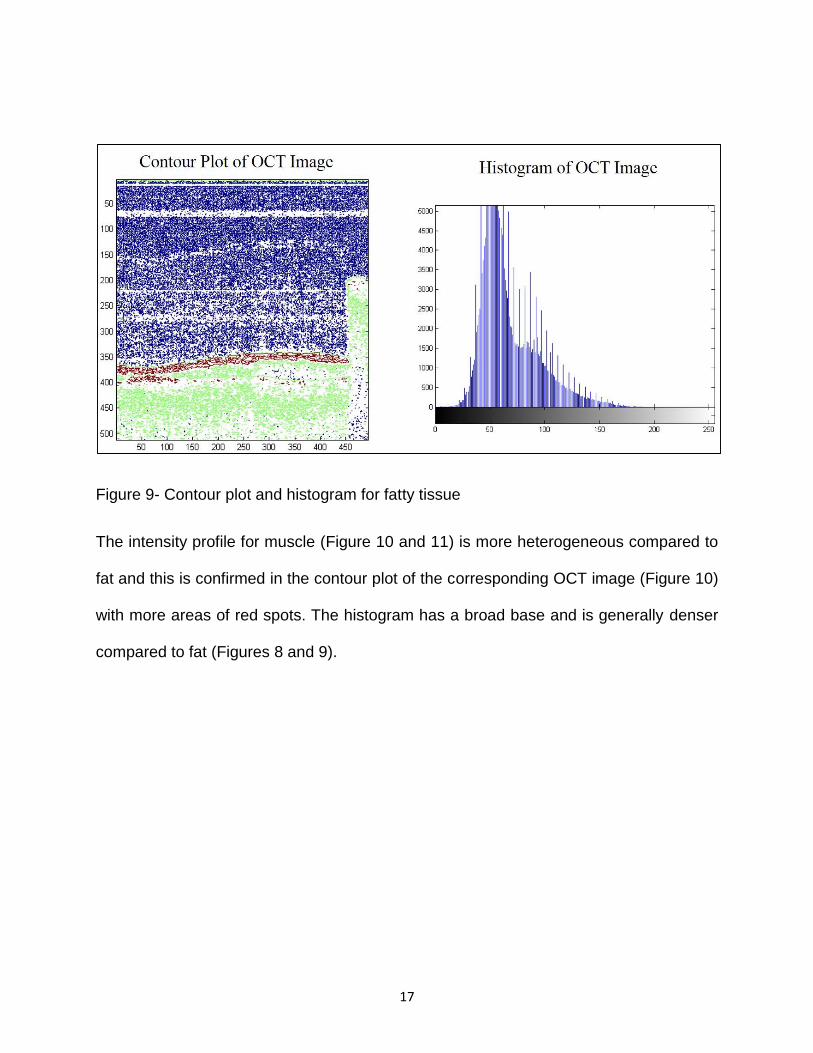
Figure 9- Contour plot and histogram for fatty tissue
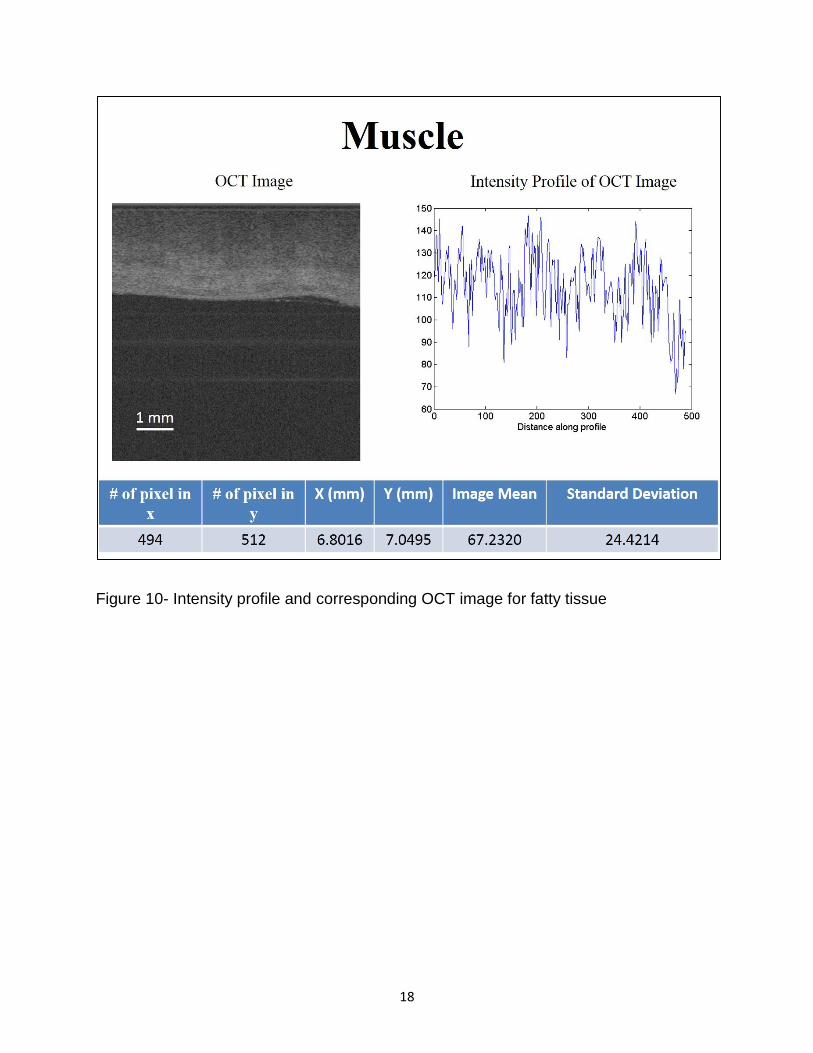
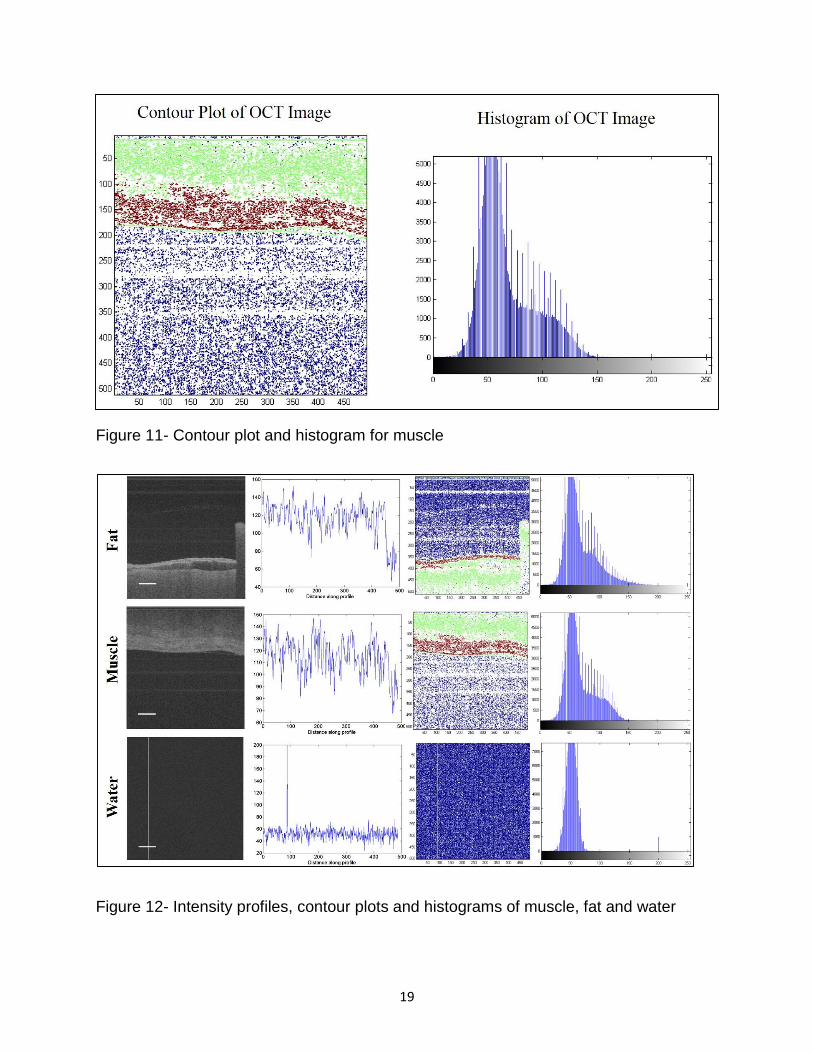
The intensity profile for muscle (Figure 10 and 11) is more heterogeneous compared to
fat and this is confirmed in the contour plot of the corresponding OCT image (Figure 10)
with more areas of red spots. The histogram has a broad base and is generally denser
compared to fat (Figures 8 and 9).
18
Figure 10- Intensity profile and corresponding OCT image for fatty tissue
19
Figure 11- Contour plot and histogram for muscle
Figure 12- Intensity profiles, contour plots and histograms of muscle, fat and water
20
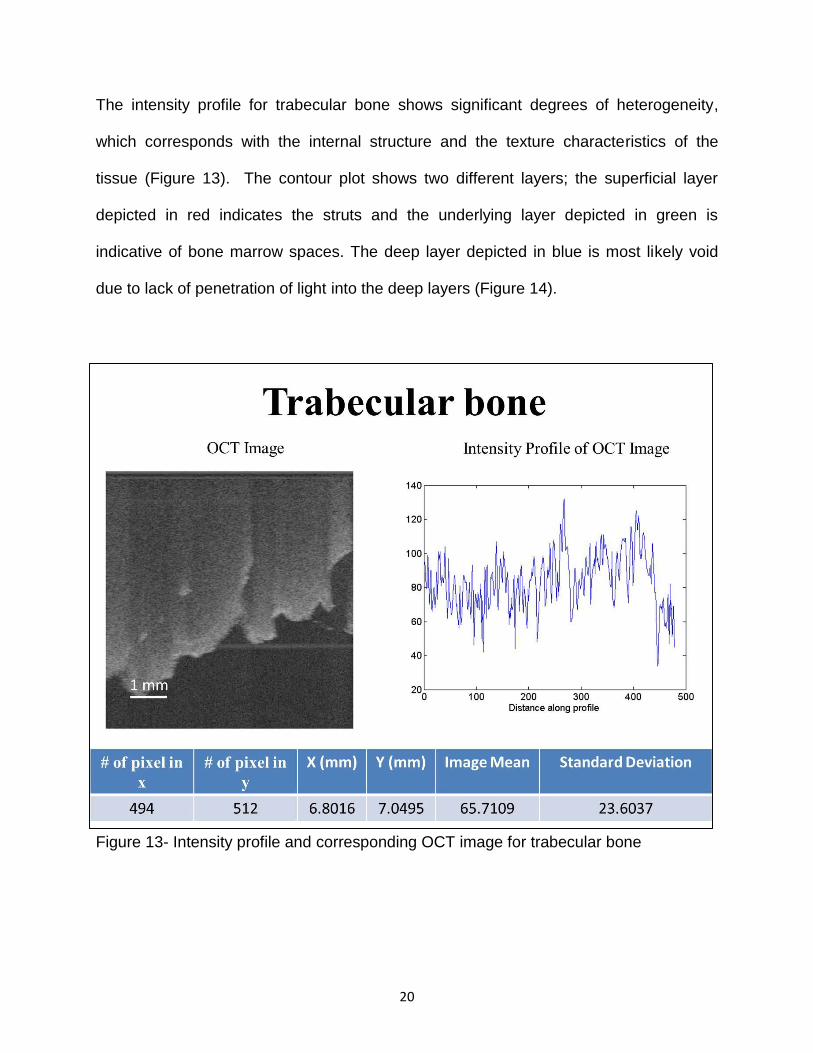
The intensity profile for trabecular bone shows significant degrees of heterogeneity,
which corresponds with the internal structure and the texture characteristics of the
tissue (Figure 13). The contour plot shows two different layers; the superficial layer
depicted in red indicates the struts and the underlying layer depicted in green is
indicative of bone marrow spaces. The deep layer depicted in blue is most likely void
due to lack of penetration of light into the deep layers (Figure 14).
Figure 13- Intensity profile and corresponding OCT image for trabecular bone
21
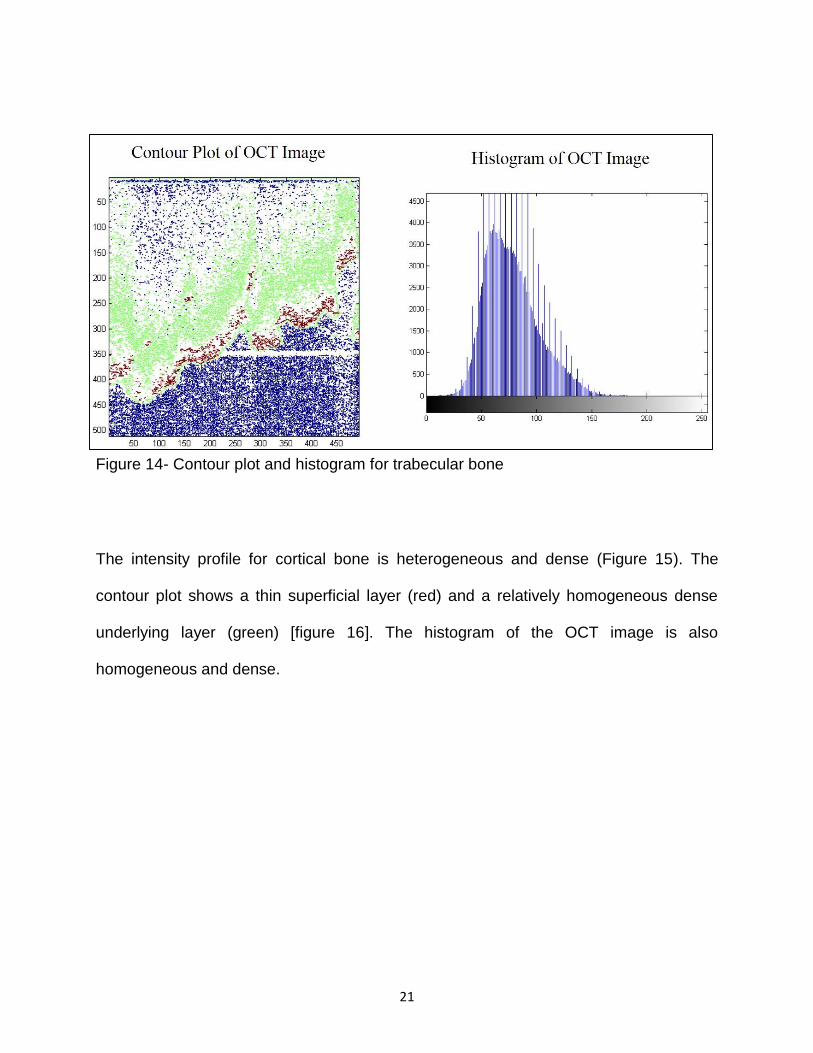
Figure 14- Contour plot and histogram for trabecular bone
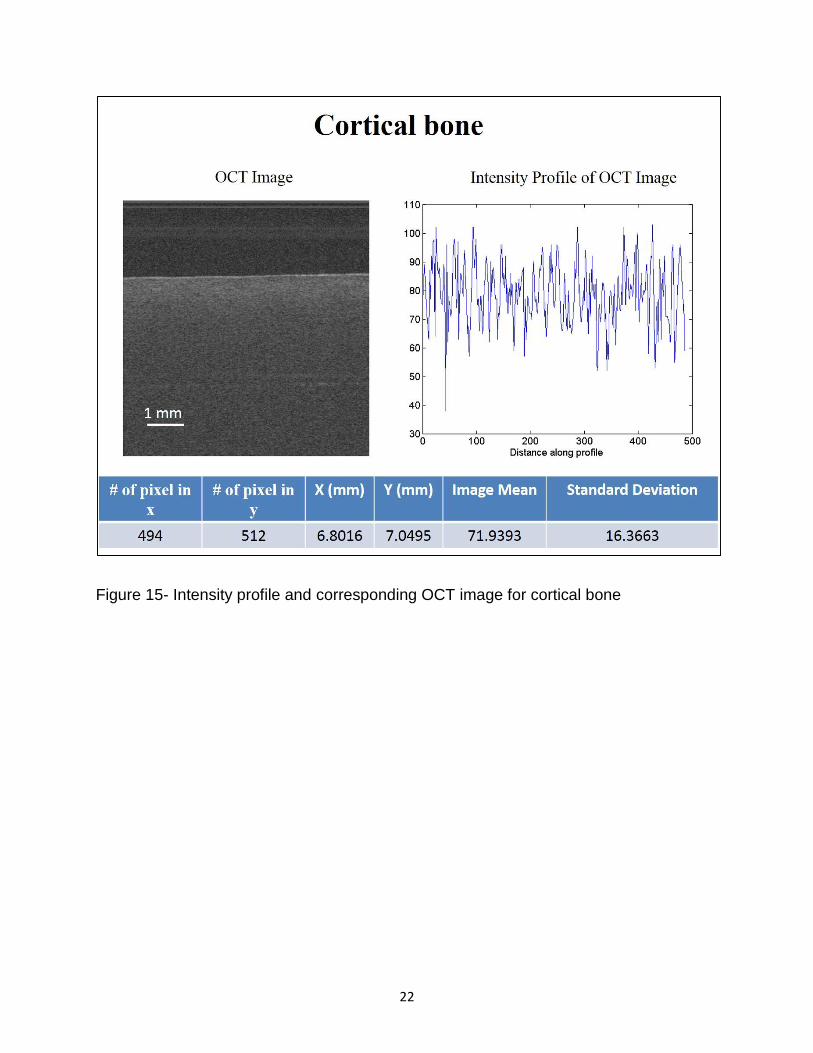
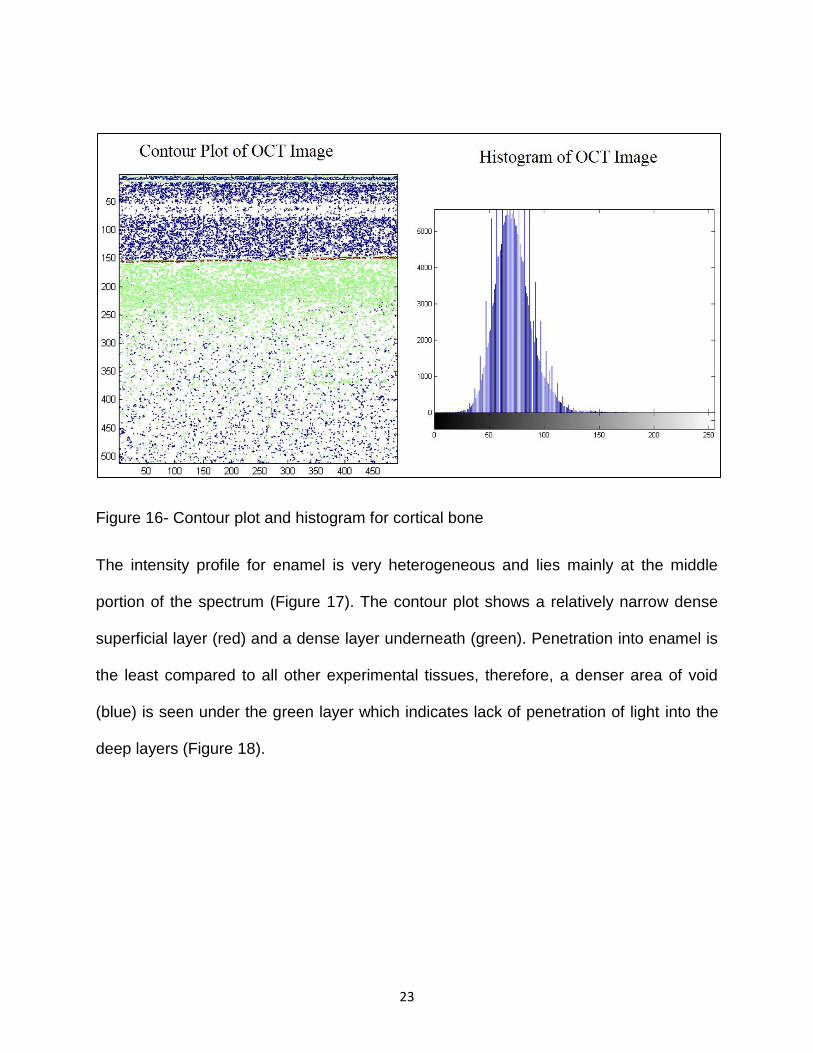
The intensity profile for cortical bone is heterogeneous and dense (Figure 15). The
contour plot shows a thin superficial layer (red) and a relatively homogeneous dense
underlying layer (green) [figure 16]. The histogram of the OCT image is also
homogeneous and dense.
22
Figure 15- Intensity profile and corresponding OCT image for cortical bone
23
Figure 16- Contour plot and histogram for cortical bone
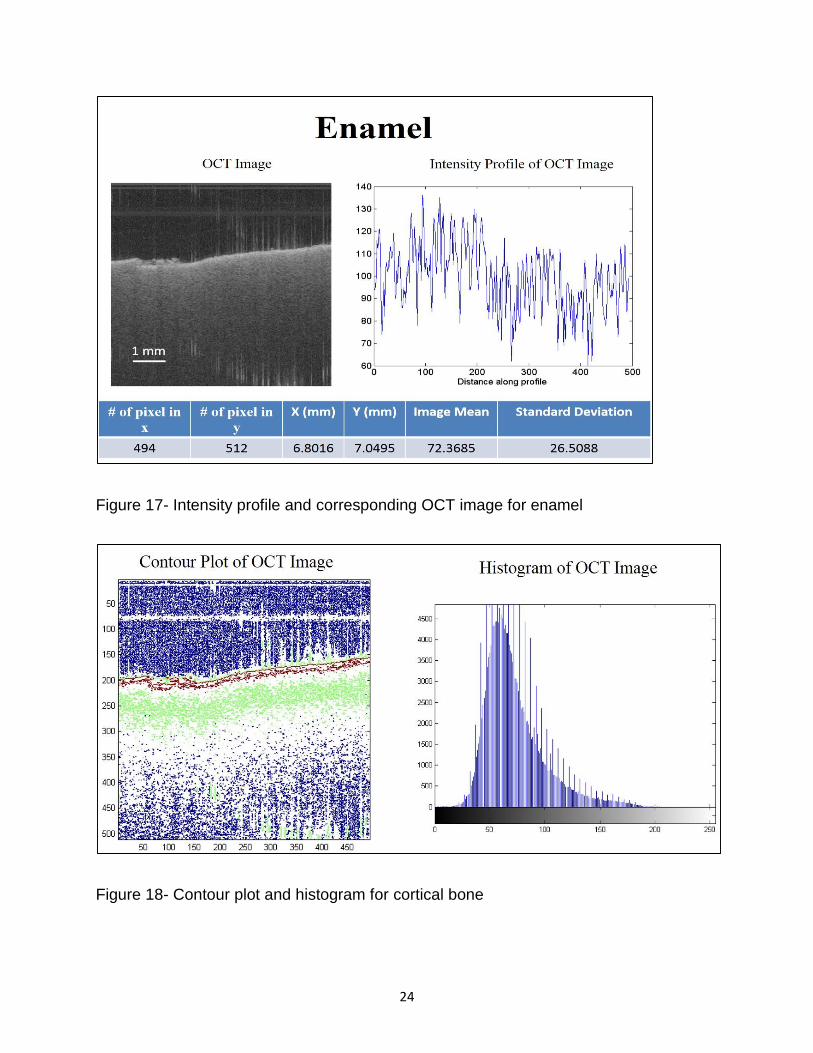
The intensity profile for enamel is very heterogeneous and lies mainly at the middle
portion of the spectrum (Figure 17). The contour plot shows a relatively narrow dense
superficial layer (red) and a dense layer underneath (green). Penetration into enamel is
the least compared to all other experimental tissues, therefore, a denser area of void
(blue) is seen under the green layer which indicates lack of penetration of light into the
deep layers (Figure 18).
24
Figure 17- Intensity profile and corresponding OCT image for enamel
Figure 18- Contour plot and histogram for cortical bone
25
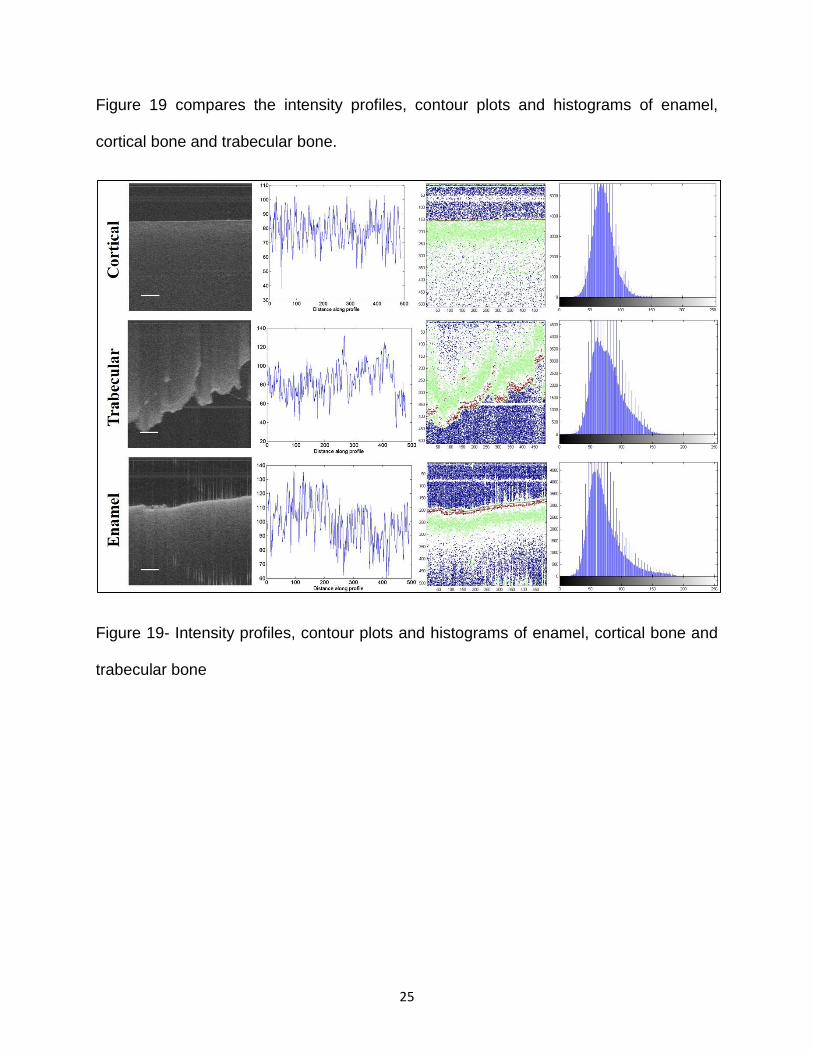
Figure 19 compares the intensity profiles, contour plots and histograms of enamel,
cortical bone and trabecular bone.
Figure 19- Intensity profiles, contour plots and histograms of enamel, cortical bone and
trabecular bone
26
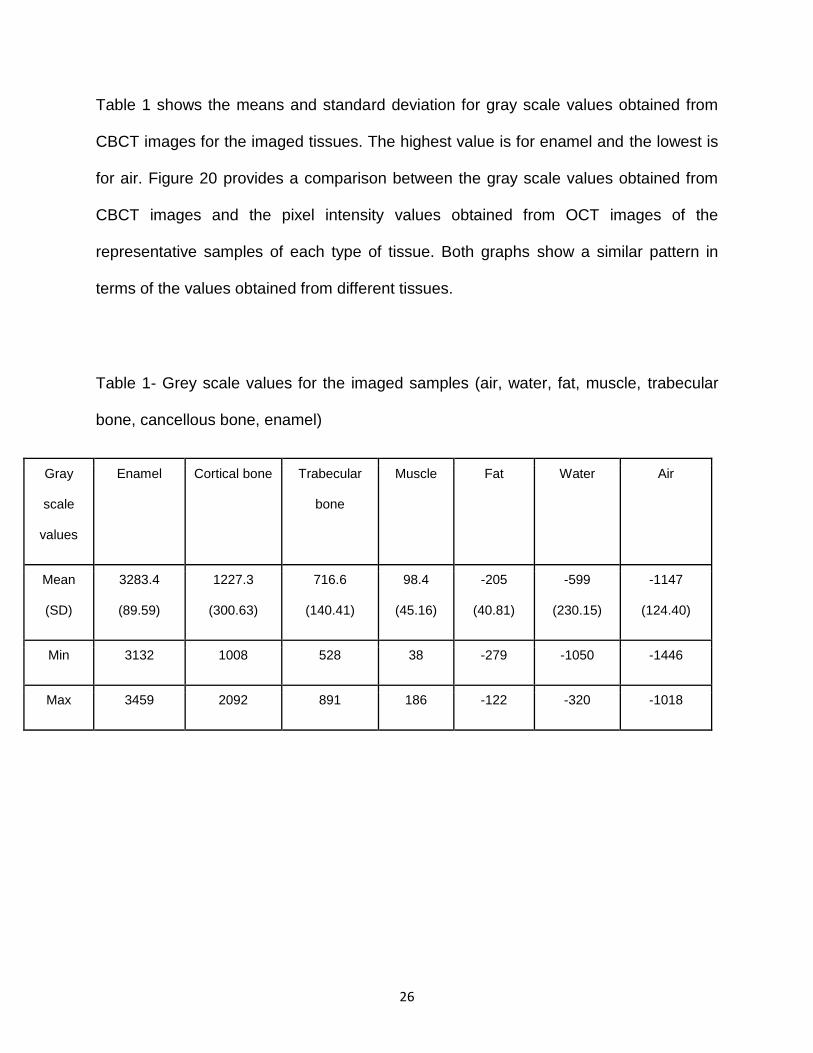
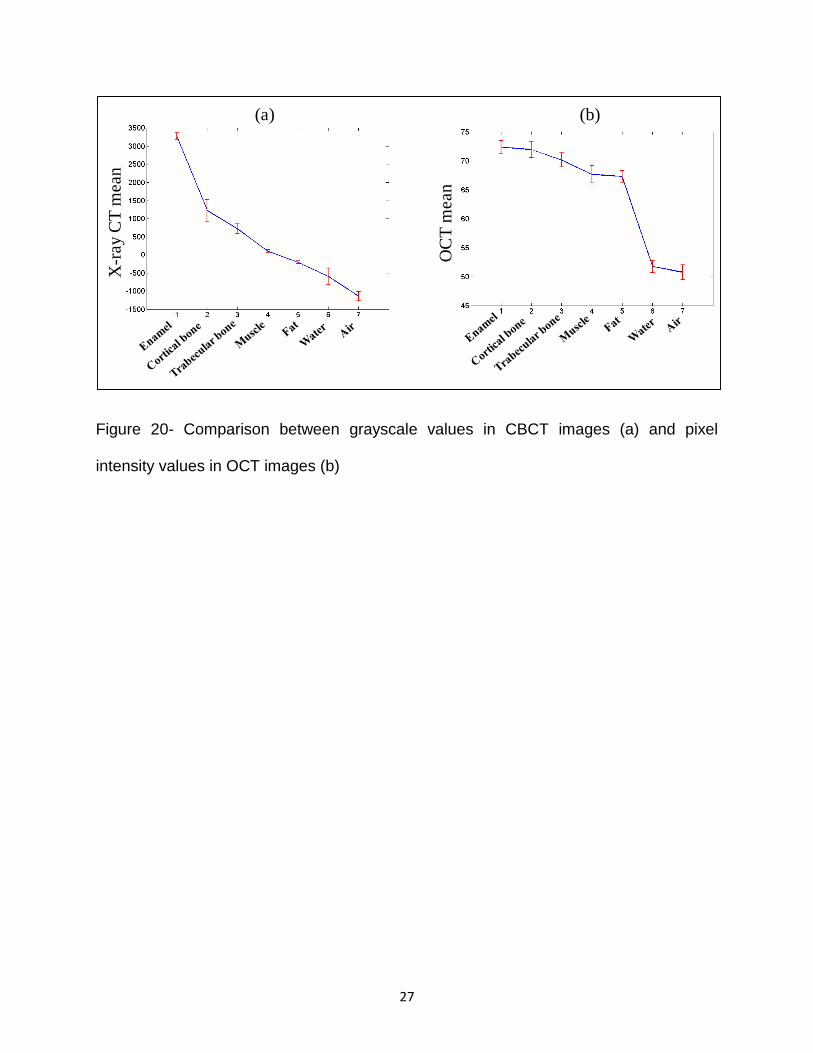
Table 1 shows the means and standard deviation for gray scale values obtained from
CBCT images for the imaged tissues. The highest value is for enamel and the lowest is
for air. Figure 20 provides a comparison between the gray scale values obtained from
CBCT images and the pixel intensity values obtained from OCT images of the
representative samples of each type of tissue. Both graphs show a similar pattern in
terms of the values obtained from different tissues.
Table 1- Grey scale values for the imaged samples (air, water, fat, muscle, trabecular
bone, cancellous bone, enamel)
Gray
scale
values
Enamel Cortical bone Trabecular
bone
Muscle Fat Water Air
Mean
(SD)
3283.4
(89.59)
1227.3
(300.63)
716.6
(140.41)
98.4
(45.16)
-205
(40.81)
-599
(230.15)
-1147
(124.40)
Min 3132 1008 528 38 -279 -1050 -1446
Max 3459 2092 891 186 -122 -320 -1018
27
Figure 20- Comparison between grayscale values in CBCT images (a) and pixel
intensity values in OCT images (b)
OC
T m
ean
X-r
ay C
T m
ean
(a) (b)
28
Discussion
Optical coherence tomography is a non-invasive imaging modality, which uses near-
infrared light to obtain tissue information at subsurface levels. Numerous studies have
reported the application of OCT in various fields of dentistry including caries detection,
periodontal evaluation and detection of soft tissue pathologies including oral
malignancies among other conditions (25, 31, 56, 69, 70).
One of the most valuable pieces of information one can get from an imaging exam is
information regarding the tissue characteristics and contents. This helps the clinician to
better understand the disease process and can potentially eliminate the need for further
invasive diagnostic procedures such as biopsy. Currently, the alternative for biopsy to
understand the contents and characteristics of a lesion based on imaging is measuring
Hounsfield units in CT exams or gray scale values in CBCT exams. In this study we
sought to evaluate the ability of OCT in differentiating between different tissues in
comparison to CBCT.
Our results showed that pixel intensity values obtained from OCT images follow a
similar pattern in comparison with gray scale values obtained from CBCT exams.
Optical coherence tomography works on the basis of light refraction and scattering at
tissue interfaces. Light scattering depends on the refractive indices of each tissue,
which in turn is partly related to the density, and thickness of the tissue (71, 72).
Therefore, based on the fact that tissues have different densities, differences in the
mean pixel intensity values pertaining to different tissues can be explained.
29
Studies have used optical coherence tomography in combination with infra-red
spectroscopy or optical coherence elastography to characterize tissues based on their
chemical, molecular or mechanical properties (73, 74). Gandjbakhche and colleagues
(2003) developed a fluorescence based optical imaging technique in order to detect and
monitor tumor status in breast tissue. Furthermore, they were able to evaluate the
metabolic activity at the tumor site by monitoring changes in the pH and in signals
obtained from different metabolites in the region (9).
In the present study, we developed an algorithm using an imaging analyses program
called MATLAB to determine the mean pixel intensity values and histograms for each
type of tissue. Post image processing, was performed on 2D images directly imported
from the machine. In the signal processing literature, the importance of phase
information, which forms the basis of image production, has been repeatedly reported.
Phase (wave) is the initial angle of a sinusoidal function and phase contrast in optical
imaging refers to changes in the signals while traveling through a medium other than
vacuum. This change is dependent on the properties of the medium (75, 76). There
have been many studies in the literature reporting tissue characterization using phase
information in optical imaging, however, to the best of our knowledge, our study is the
first to have used pixel intensity values obtained from 2D OCT images to determine
changes in tissue densities. Our findings demonstrate that the post-processing
mathematical algorithm we developed based on pixel intensity values for OCT images
was able to show a pattern similar to gray scale values obtained from CBCT scans for
different tissues.
30
The intensity profile is indicative of surface irregularities and the degree of heterogeneity
within the tissue. Air and water had the most homogeneous profiles compared to the
other specimens. This information can be used for the evaluation of early changes at
the surface of the tissue. Contour plots also provide information on the surface
characteristics of the tissue. This is a more visual presentation of changes in the
contour of a tissue and accentuates minor changes occurring as result of a pathological
process. Figure 16 provides a good example of a meaningful comparison between the
contour plots of three different tissues with different densities. The blue area is
indicative of no signal and has a higher concentration in enamel with the highest
density, followed by cortical bone, which is followed by trabecular bone. This confirms
the fact that light penetration is limited in tissues with higher density.
One of the limitations of the present study was the inability to image the same sample
for each type of tissue by the two imaging modalities; however, an attempt was made to
choose representative samples of each tissue type. For example, enamel, cortical and
trabecular bone, water and air were similar in both imaging modalities, however, for
muscle, we imaged a mouse masseteric muscle with OCT and human masseteric
muscle with CBCT, and for fatty tissue, we imaged butter with OCT and gray scale
values for CBCT were calculated in the human buccal fat pad. This inconsistency may
result in obtaining different absolute values for each type of tissue/sample. However, the
mean values fell within a range that was comparable in both imaging systems. For
optimal OCT imaging, the surface of the tissue/specimen should be moderately
hydrated for optimal scattering and refraction of light as it travels through the medium
(68). In the present study, it was difficult to maintain the same level of hydration for all
31
specimens, specifically the hydrophobic tissues such as fatty tissue. However, the
overall pattern was not altered by this inconsistency.
32
Conclusion:
Optical coherence tomography can reliably differentiate between different tissues in
vitro based on the pixel intensity values and renders a pattern that is comparable to
gray scale values obtained from CBCT scans.
Future directions:
1. Evaluate the efficacy of optical coherence tomography in characterizing tissue
properties in a wider range of tissues with more samples of each tissue in in vivo
conditions.
2. Evaluate the efficacy of optical coherence tomography in detecting pathological
changes based on pixel intensity values.
3. Evaluate the efficacy of a combination of optical and ultrasound imaging in
detecting pathological changes with more accuracy and precision.
33
References:
(1) Sansare K, Khanna V, Karjodkar F. Early victims of X-rays: a tribute and current perception. Dentomaxillofacial Radiology 2011 02/01; 2015/04;40(2):123-125.
(2) Pakchoian AJ, Dagdeviren D, Kilham J, Mahdian M, Lurie A, Tadinada A. Oral and Maxillofacial Radiologists: Career Trends and Specialty Board Certification Status. Journal of Dental Education 2015 May 01;79(5):493-498.
(3) Chenevert TL, Skovoroda AR, Emelianov SY. Elasticity reconstructive imaging by means of stimulated echo MRI. Magnetic Resonance in Medicine 1998;39(3):482-490.
(4) Plewes DB, Betty I, Urchuk SN, Soutar I. Visualizing tissue compliance with MR imaging. Journal of Magnetic Resonance Imaging 1995;5(6):733-738.
(5) Kruse SA, Smith JA, Lawrence AJ, Dresner MA, Manduca A, Greenleaf JF, et al. Tissue characterization using magnetic resonance elastography: preliminary results. Phys Med Biol 2000;45(6):1579.
(6) Borkan GA, Hults DE, Gerzof SG, Robbins AH, Silbert CK. Age Changes in Body Composition Revealed by Computed Tomography. Journal of Gerontology 1983 November 01;38(6):673-677.
(7) Crim JR, Seeger LL, Yao L, Chandnani V, Eckardt JJ. Diagnosis of soft-tissue masses with MR imaging: can benign masses be differentiated from malignant ones? Radiology 1992 11/01; 2015/04;185(2):581-586.
(8) Goodpaster BH, Carlson CL, Visser M, Kelley DE, Scherzinger A, Harris TB, et al. Attenuation of skeletal muscle and strength in the elderly: The Health ABC Study. J Appl Physiol 2001 06/01;90(6):2157-2165.
(9) Gandjbakhche AH, Chernomordik V, Hattery D, Hassan M, Gannot I. Tissue Characterization by Quantitative Optical Imaging Methods. Technology in Cancer Research & Treatment 2003 December 01;2(6):537-551.
(10) Lerski RA, Straughan K, Schad LR, Boyce D, Blüml S, Zuna I. VIII. MR image texture analysis—An approach to tissue characterization. Magn Reson Imaging 1993;11(6):873-887.
(11) Liu T, Lizzi FL, Ketterling JA, Silverman RH, Kutcher GJ. Ultrasonic tissue characterization via 2-D spectrum analysis: theory and in vitro measurements. Med Phys 2007 Mar;34(3):1037-1046.
(12) Katsumata A, Hirukawa A, Noujeim M, Okumura S, Naitoh M, Fujishita M, et al. Image artifact in dental cone-beam CT. Oral Surgery, Oral Medicine, Oral Pathology, Oral Radiology, and Endodontology 2006 5;101(5):652-657.
(13) Katsumata A, Hirukawa A, Okumura S, Naitoh M, Fujishita M, Ariji E, et al. Effects of image artifacts on gray-value density in limited-volume cone-beam computerized
34
tomography. Oral Surgery, Oral Medicine, Oral Pathology, Oral Radiology, and Endodontology 2007 12;104(6):829-836.
(14) Norton MR, Gamble C. Bone classification: an objective scale of bone density using the computerized tomography scan. Clin Oral Implants Res 2001;12(1):79-84.
(15) Pauwels R, Jacobs R, Singer SR, Mupparapu M. CBCT-based bone quality assessment: are Hounsfield units applicable? Dentomaxillofacial Radiology 2015 01/01; 2015/04;44(1):20140238.
(16) Pauwels R, Nackaerts O, Bellaiche N, Stamatakis H, Tsiklakis K, Walker A, et al. Variability of dental cone beam CT grey values for density estimations. Br J Radiol 2013 Jan;86(1021):20120135.
(17) Donohue KD, Huang L, Burks T, Forsberg F, Piccoli CW. Tissue classification with generalized spectrum parameters. Ultrasound Med Biol 2001 11;27(11):1505-1514.
(18) Feleppa EJ, Fair WR, Liu T, Kalisz A, Balaji KC, Porter CR, et al. Three-dimensional ultrasound analyses of the prostate. Mol Urol 2000 Fall;4(3):133-9;discussion 141.
(19) Sehgal CM, Greenleaf JF. Scattering of Ultrasound by Tissues. Ultrasonic Imaging 1984 January 01;6(1):60-80.
(20) Zagzebski JA, Lu ZF, Yao LX. Quantitative Ultrasound Imaging: in Vivo Results in Normal Liver. Ultrasonic Imaging 1993 October 01;15(4):335-351.
(21) Ferreira VM, Piechnik SK, Robson MD, Neubauer S, Karamitsos TD. Myocardial tissue characterization by magnetic resonance imaging: novel applications of T1 and T2 mapping. J Thorac Imaging 2014 May;29(3):147-154.
(22) Yesuratnam A, Wiesenfeld D, Tsui A, Iseli TA, Hoorn SV, Ang MT, et al. Preoperative evaluation of oral tongue squamous cell carcinoma with intraoral ultrasound and magnetic resonance imaging-comparison with histopathological tumour thickness and accuracy in guiding patient management. Int J Oral Maxillofac Surg 2014 Jul;43(7):787-794.
(23) Mekle R, Laine AF, Wu EX. Combined MR data acquisition of multicontrast images using variable acquisition parameters and K-space data sharing. Medical Imaging, IEEE Transactions on 2003;22(7):806-823.
(24) Mekle R, Wu EX, Meckel S, Wetzel SG, Scheffler K. Combo acquisitions: Balancing scan time reduction and image quality. Magnetic Resonance in Medicine 2006;55(5):1093-1105.
(25) - Zhu H, - Isikman SO, - Mudanyali O, - Greenbaum A, - Ozcan A. - Optical imaging techniques for point-of-care diagnostics. - Lab Chip (- 1):- 51.
(26) Zhang QQ, Wu XJ, Wang C, Zhu SW, Wang YL, Gao BZ, et al. Scattering coefficients of mice organs categorized pathologically by spectral domain optical coherence tomography. Biomed Res Int 2014;2014:471082.
35
(27) Calantog A, Hallajian L, Nabelsi T, Mansour S, Le A, Epstein J, et al. A prospective study to assess in vivo optical coherence tomography imaging for early detection of chemotherapy-induced oral mucositis. Lasers Surg Med 2013 Jan;45(1):22-27.
(28) Rashidifard C, Vercollone C, Martin S, Liu B, Brezinski ME. The application of optical coherence tomography in musculoskeletal disease. Arthritis 2013;2013:563268.
(29) Beaudette K, Strupler M, Benboujja F, Parent S, Aubin CE, Boudoux C. Optical coherence tomography for the identification of musculoskeletal structures of the spine: a pilot study. Biomed Opt Express 2012 Mar 1;3(3):533-542.
(30) Huang YP, Wang SZ, Saarakkala S, Zheng YP. Quantification of stiffness change in degenerated articular cartilage using optical coherence tomography-based air-jet indentation. Connect Tissue Res 2011 Oct;52(5):433-443.
(31) Fercher AF. Optical coherence tomography – development, principles, applications. Zeitschrift für Medizinische Physik 2010 11;20(4):251-276.
(32) Fujimoto JG, Pitris C, Boppart SA, Brezinski ME. Optical coherence tomography: an emerging technology for biomedical imaging and optical biopsy. Neoplasia 2000 Jan-Apr;2(1-2):9-25.
(33) Scarfe WC, Farman AG, Sukovic P. Clinical applications of cone-beam computed tomography in dental practice. J Can Dent Assoc 2006 Feb;72(1):75-80.
(34) Yadav S, Palo L, Mahdian M, Upadhyay M, Tadinada A. Diagnostic accuracy of 2 cone-beam computed tomography protocols for detecting arthritic changes in temporomandibular joints. American Journal of Orthodontics and Dentofacial Orthopedics 2015/04;147(3):339-344.
(35) Tyndall DA, Price JB, Tetradis S, Ganz SD, Hildebolt C, Scarfe WC. Position statement of the American Academy of Oral and Maxillofacial Radiology on selection criteria for the use of radiology in dental implantology with emphasis on cone beam computed tomography. Oral Surgery, Oral Medicine, Oral Pathology and Oral Radiology 2015/04;113(6):817-826.
(36) Farrell BB, Franco PB, Tucker MR. Virtual Surgical Planning in Orthognathic Surgery. Oral and Maxillofacial Surgery Clinics of North America 2014 11;26(4):459-473.
(37) Longstreth WT, Phillips LE, Drangsholt M, Koepsell TD, Custer BS, Gehrels J, et al. Dental X-rays and the risk of intracranial meningioma. Cancer 2004;100(5):1026-1034.
(38) Baumgartner A, Dichtl S, Hitzenberger C, Sattmann H, Robl B, Moritz A, et al. Polarization-sensitive optical coherence tomography of dental structures. Caries Res 2000;34(1):59—69.
(39) Idiyatullin D, Corum C, Moeller S, Prasad HS, Garwood M, Nixdorf DR. Dental Magnetic Resonance Imaging: Making the Invisible Visible. J Endod 2011 6;37(6):745-752.
36
(40) Baek JH, Na J, Lee BH, Choi E, Son WS. Optical approach to the periodontal ligament under orthodontic tooth movement: A preliminary study with optical coherence tomography. American Journal of Orthodontics and Dentofacial Orthopedics 2009 2;135(2):252-259.
(41) Alsayed EZ, Hariri I, Sadr A, Nakashima S, Bakhsh TA, Shimada Y, et al. Optical coherence tomography for evaluation of enamel and protective coatings. Dent Mater J 2015;34(1):98-107.
(42) Nakajima Y, Shimada Y, Sadr A, Wada I, Miyashin M, Takagi Y, et al. Detection of occlusal caries in primary teeth using swept source optical coherence tomography. J Biomed Opt 2014 Jan;19(1):16020.
(43) Shimada Y, Nakagawa H, Sadr A, Wada I, Nakajima M, Nikaido T, et al. Noninvasive cross-sectional imaging of proximal caries using swept-source optical coherence tomography (SS-OCT) in vivo. J Biophotonics 2014 Jul;7(7):506-513.
(44) Turkistani A, Sadr A, Shimada Y, Nikaido T, Sumi Y, Tagami J. Sealing performance of resin cements before and after thermal cycling: evaluation by optical coherence tomography. Dent Mater 2014 Sep;30(9):993-1004.
(45) Wada I, Shimada Y, Ikeda M, Sadr A, Nakashima S, Tagami J, et al. Clinical assessment of non carious cervical lesion using swept-source optical coherence tomography. J Biophotonics 2014 Dec 11;9999(9999):10.1002/jbio.201400113.
(46) Bista B, Sadr A, Nazari A, Shimada Y, Sumi Y, Tagami J. Nondestructive assessment of current one-step self-etch dental adhesives using optical coherence tomography. J Biomed Opt 2013 Jul;18(7):76020.
(47) Nakagawa H, Sadr A, Shimada Y, Tagami J, Sumi Y. Validation of swept source optical coherence tomography (SS-OCT) for the diagnosis of smooth surface caries in vitro. J Dent 2013 Jan;41(1):80-89.
(48) Nazari A, Sadr A, Saghiri MA, Campillo-Funollet M, Hamba H, Shimada Y, et al. Non-destructive characterization of voids in six flowable composites using swept-source optical coherence tomography. Dent Mater 2013 Mar;29(3):278-286.
(49) Nazari A, Sadr A, Shimada Y, Tagami J, Sumi Y. 3D assessment of void and gap formation in flowable resin composites using optical coherence tomography. J Adhes Dent 2013 Jun;15(3):237-243.
(50) Imai K, Shimada Y, Sadr A, Sumi Y, Tagami J. Noninvasive cross-sectional visualization of enamel cracks by optical coherence tomography in vitro. J Endod 2012 Sep;38(9):1269-1274.
(51) Bakhsh TA, Sadr A, Shimada Y, Tagami J, Sumi Y. Non-invasive quantification of resin-dentin interfacial gaps using optical coherence tomography: validation against confocal microscopy. Dent Mater 2011 Sep;27(9):915-925.
(52) Makishi P, Shimada Y, Sadr A, Tagami J, Sumi Y. Non-destructive 3D imaging of composite restorations using optical coherence tomography: marginal adaptation of self-etch adhesives. J Dent 2011 Apr;39(4):316-325.
37
(53) Shimada Y, Sadr A, Burrow MF, Tagami J, Ozawa N, Sumi Y. Validation of swept-source optical coherence tomography (SS-OCT) for the diagnosis of occlusal caries. J Dent 2010 Aug;38(8):655-665.
(54) Ahn YC, Chung J, Wilder-Smith P, Chen Z. Multimodality approach to optical early detection and mapping of oral neoplasia. J Biomed Opt 2011 Jul;16(7):076007.
(55) DeCoro M, Wilder-Smith P. Potential of optical coherence tomography for early diagnosis of oral malignancies. Expert Rev Anticancer Ther 2010 Mar;10(3):321-329.
(56) Wilder-Smith P, Lee K, Guo S, Zhang J, Osann K, Chen Z, et al. In vivo diagnosis of oral dysplasia and malignancy using optical coherence tomography: preliminary studies in 50 patients. Lasers Surg Med 2009 Jul;41(5):353-357.
(57) Kawakami-Wong H, Gu S, Hammer-Wilson MJ, Epstein JB, Chen Z, Wilder-Smith P. In vivo optical coherence tomography-based scoring of oral mucositis in human subjects: a pilot study. J Biomed Opt 2007 Sep-Oct;12(5):051702.
(58) Wilder-Smith P, Hammer-Wilson MJ, Zhang J, Wang Q, Osann K, Chen Z, et al. In vivo imaging of oral mucositis in an animal model using optical coherence tomography and optical Doppler tomography. Clin Cancer Res 2007 Apr 15;13(8):2449-2454.
(59) Wilder-Smith P, Krasieva T, Jung WG, Zhang J, Chen Z, Osann K, et al. Noninvasive imaging of oral premalignancy and malignancy. J Biomed Opt 2005 Sep-Oct;10(5):051601.
(60) Matheny ES, Hanna NM, Jung WG, Chen Z, Wilder-Smith P, Mina-Araghi R, et al. Optical coherence tomography of malignancy in hamster cheek pouches. J Biomed Opt 2004 Sep-Oct;9(5):978-981.
(61) Braz AKS, Kyotoku BBC, Gomes ASL. In Vitro Tomographic Image of Human Pulp-Dentin Complex: Optical Coherence Tomography and Histology. J Endod 2009 9;35(9):1218-1221.
(62) Thormählen I, Straub J, Grigull U. Refractive Index of Water and Its Dependence on Wavelength, Temperature, and Density. Journal of Physical and Chemical Reference Data 1985;14(4):933-945.
(63) Knu¨ttel A, Bonev S, Knaak W. New method for evaluation of in vivo scattering and refractive index properties obtained with optical coherence tomography. J Biomed Opt 2004;9(2):265-273.
(64) Tearney GJ, Brezinski ME, Bouma BE, Hee MR, Southern JF, Fujimoto JG. Determination of the refractive index of highly scattering human tissue by optical coherence tomography. Opt Lett 1995 Nov;20(21):2258-2260.
(65) RITLAND HN. Relation Between Refractive Index and Density of a Glass at Constant Temperature. J Am Ceram Soc 1955;38(2):86-88.
(66) Wang X, Zhang C, Zhang L, Xue L, Tian J. Simultaneous refractive index and thickness measurements of bio tissue by optical coherence tomography. J Biomed Opt 2002;7(4):628-632.
38
(67) Hariri I, Sadr A, Nakashima S, Shimada Y, Tagami J, Sumi Y. Estimation of the enamel and dentin mineral content from the refractive index. Caries Res 2013;47(1):18-26.
(68) Shimamura Y, Murayama R, Kurokawa H, Miyazaki M, Mihata Y, Kmaguchi S. Influence of tooth-surface hydration conditions on optical coherence-tomography imaging. J Dent 2011 8;39(8):572-577.
(69) Amaechi BT, Higham SM, Podoleanu AG, Rogers JA, Jackson DA. Use of optical coherence tomography for assessment of dental caries: quantitative procedure. J Oral Rehabil 2001;28(12):1092-1093.
(70) Wilder-Smith P, Holtzman J, Epstein J, Le A. Optical diagnostics in the oral cavity: an overview. Oral Dis 2010 Nov;16(8):717-728.
(71) Wang R, Tuchin V. Optical Coherence Tomography: Light Scattering and Imaging Enhancement. In: Tuchin VV, editor. : Springer New York; 2012. p. 665-742.
(72) Kholodnykh AI, Petrova IY, Larin KV, Motamedi M, Esenaliev RO. Precision of measurement of tissue optical properties with optical coherence tomography. Appl Opt 2003 Jun;42(16):3027-3037.
(73) Patil CA, Bosschaart N, Keller MD, Leeuwen TGv, Mahadevan-Jansen A. Combined Raman spectroscopy and optical coherence tomography device for tissue characterization. Opt Lett 2008 May;33(10):1135-1137.
(74) Wang S, Larin KV. Optical coherence elastography for tissue characterization: a review. Journal of Biophotonics 2015;8(4):279-302.
(75) ZERNIKE F. How I discovered phase contrast. Science 1955 Mar 11;121(3141):345-349.
(76) Ni X(, Huo X. Statistical interpretation of the importance of phase information in signal and image reconstruction. Statistics & Probability Letters 2007 2/15;77(4):447-454.