titan company limited presentation... · •this youngest brand of titan company ltd was launched...
TRANSCRIPT
Titan Company Limited
Earnings Presentation – Q2 FY ’20 and H1 FY’20(For quarter and half year, ended 30th September 2019)
05th November, 2019
1
Disclaimer
This document, which has been prepared by Titan Company Limited (the “Company”/”we”/”our”), are solely forinformation purpose and do not constitute any offer, invitation, recommendation, invitation to purchase or subscribefor any of the securities, and shall not form the basis of or be relied on in connection with any contract or bindingcommitment whatsoever.
Certain statements are included in this release which contain words or phrases such as “will,” “aim,” “will likelyresult,” “believe,” “expect,” “will continue,” “anticipate,” “estimate,” “intend,” “plan,” “contemplate,” “seek to,” “future,”“objective,” “goal,” “project,” “should,” “will pursue” and similar expressions or variations of these expressions thatare “forward-looking statements”. Actual results may differ materially from those suggested by the forward-lookingstatements due to certain risks or uncertainties associated with our expectations with respect to, but not limited to,our ability to implement our strategy successfully, the market acceptance of and demand for our products, ourgrowth and expansion, the adequacy of our allowance for credit to franchisees, dealers and distributors,technological changes, volatility in income, cash flow projections and our exposure to market and operational risks.By their nature, certain of the market risk disclosures are only estimates and could be materially different from whatmay actually occur in the future. As a result, actual future gains, losses or impact on net income could materiallydiffer from those that have been estimated.
In addition, other factors that could cause actual results to differ materially from those estimated by the forward-looking statements contained in this document include, but are not limited to: general economic and politicalconditions in India and the other countries which have an impact on our business activities; inflation, unanticipatedturbulence in interest rates, foreign exchange rates, the prices of raw material including gold and diamonds, orother rates or prices; changes in Indian and foreign laws and regulations, including tax and accounting regulations;and changes in competition and the pricing environment in India. The Company may, from time to time makeadditional written and oral forward-looking statements, including statements contained in the Company’s filings withSEBI and the Stock Exchanges and our reports to shareholders. The Company does not undertake to update anyforward-looking statements that may be made from time to time by or on behalf of the Company, to reflect events orcircumstances after the date thereof.
2
3
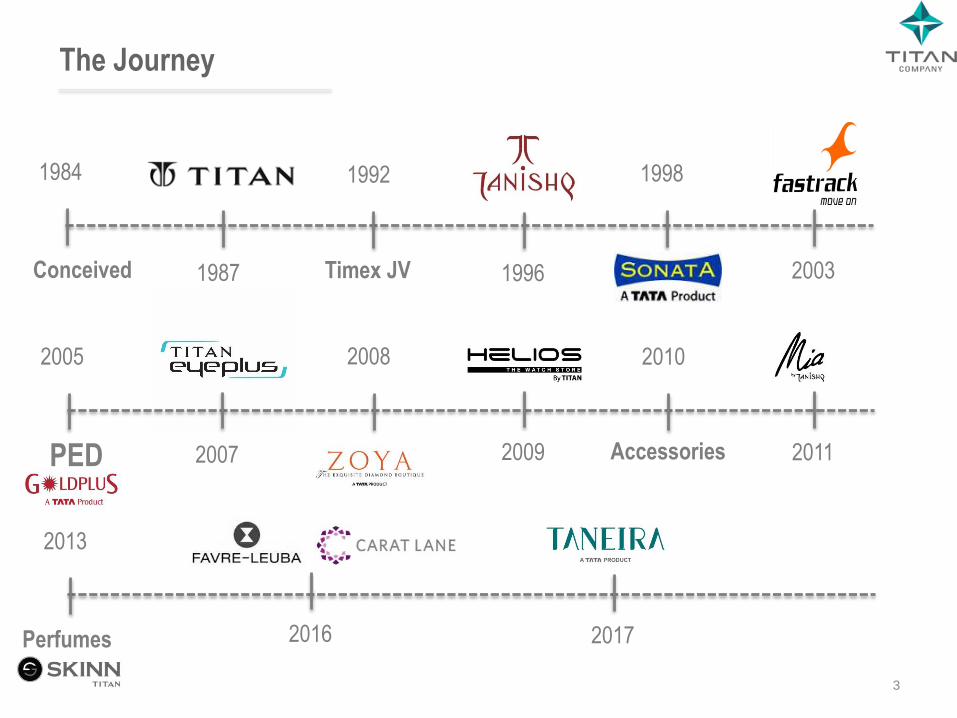
The Journey
1984
Conceived 1987
1992
Timex JV 1996
1998
2003
2005
PED 2007
2008
2009
2010
Accessories
2016
2013
Perfumes
2011
2017
4
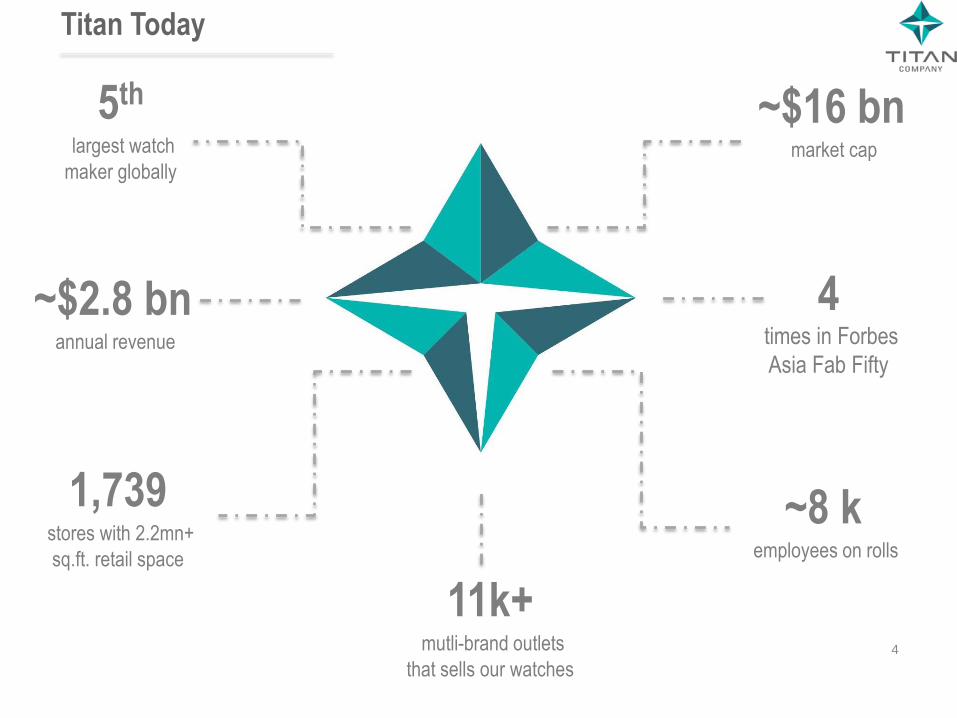
Titan Today
5th
largest watch
maker globally
~$16 bn market cap
~$2.8 bnannual revenue
11k+mutli-brand outlets
that sells our watches
~8 kemployees on rolls
1,739stores with 2.2mn+
sq.ft. retail space
4times in Forbes
Asia Fab Fifty
5
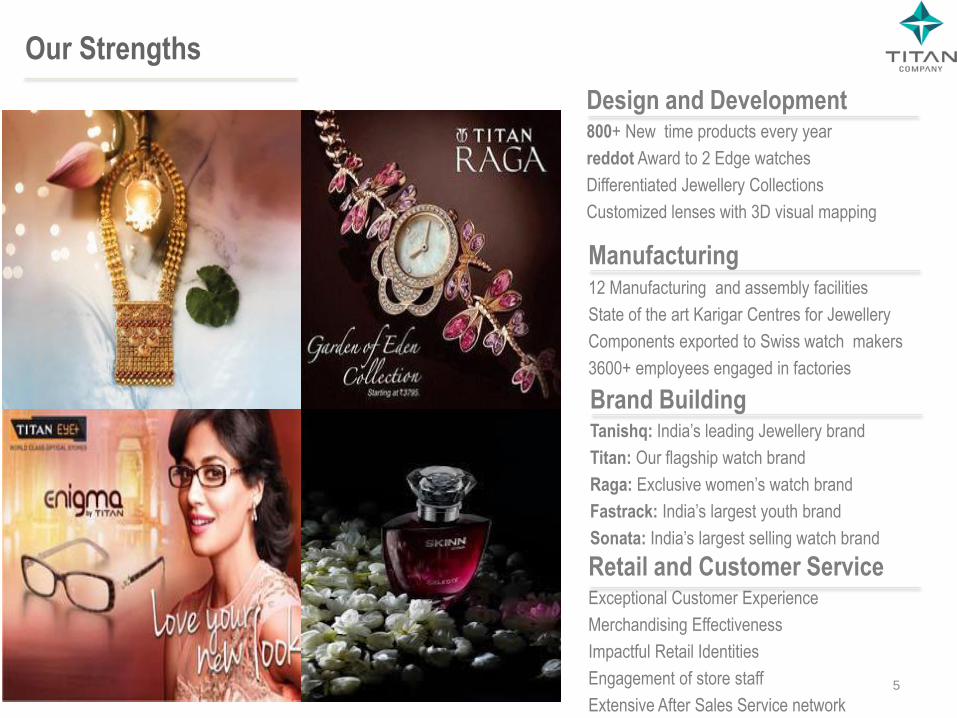
Our Strengths
Design and Development 800+ New time products every year
reddot Award to 2 Edge watches
Differentiated Jewellery Collections
Customized lenses with 3D visual mapping
Retail and Customer ServiceExceptional Customer Experience
Merchandising Effectiveness
Impactful Retail Identities
Engagement of store staff
Extensive After Sales Service network
Manufacturing12 Manufacturing and assembly facilities
State of the art Karigar Centres for Jewellery
Components exported to Swiss watch makers
3600+ employees engaged in factories
Brand BuildingTanishq: India’s leading Jewellery brand
Titan: Our flagship watch brand
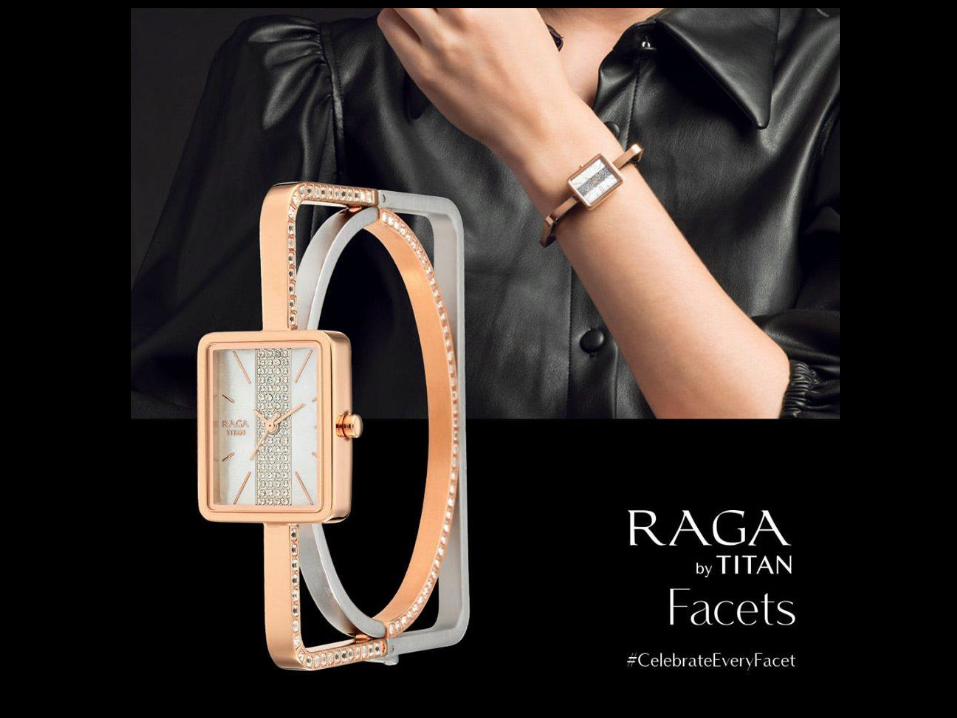
Raga: Exclusive women’s watch brand
Fastrack: India’s largest youth brand
Sonata: India’s largest selling watch brand

Our Brands
Luxury
Premium
Mid Market
Mass Market
6
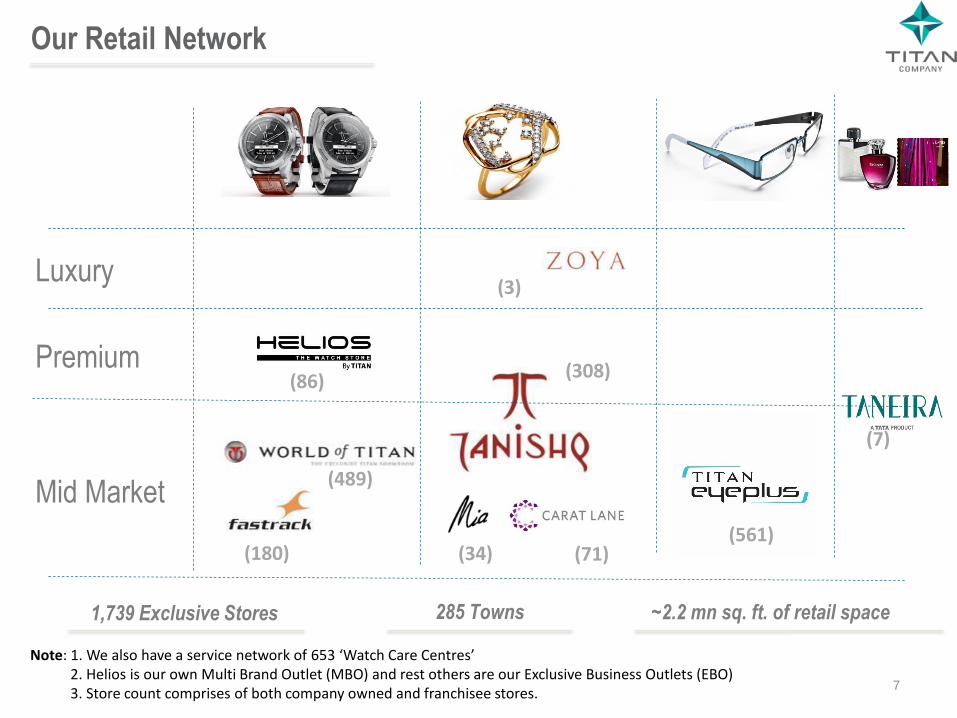
Our Retail Network
Luxury
Premium
Mid Market(489)
(86)
(180)
1,739 Exclusive Stores 285 Towns ~2.2 mn sq. ft. of retail space
Note: 1. We also have a service network of 653 ‘Watch Care Centres’2. Helios is our own Multi Brand Outlet (MBO) and rest others are our Exclusive Business Outlets (EBO)3. Store count comprises of both company owned and franchisee stores.
(3)
(308)
(561)
7
(7)
(34) (71)
8
Jewellery Division
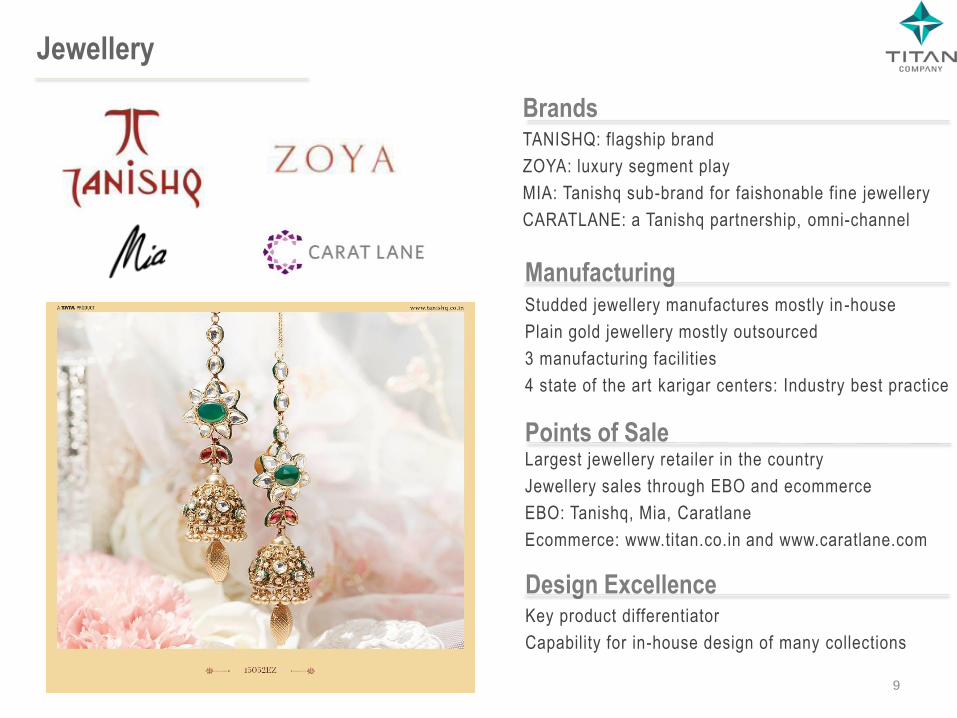
Jewellery
BrandsTANISHQ: flagship brand
ZOYA: luxury segment play
MIA: Tanishq sub-brand for faishonable fine jewellery
CARATLANE: a Tanishq partnership, omni-channel
ManufacturingStudded jewellery manufactures mostly in -house
Plain gold jewellery mostly outsourced
3 manufacturing facilities
4 state of the art karigar centers: Industry best practice
Points of SaleLargest jewellery retailer in the country
Jewellery sales through EBO and ecommerce
EBO: Tanishq, Mia, Caratlane
Ecommerce: www.titan.co.in and www.caratlane.com
Design ExcellenceKey product differentiator
Capability for in-house design of many collections
9

10
Jewellery
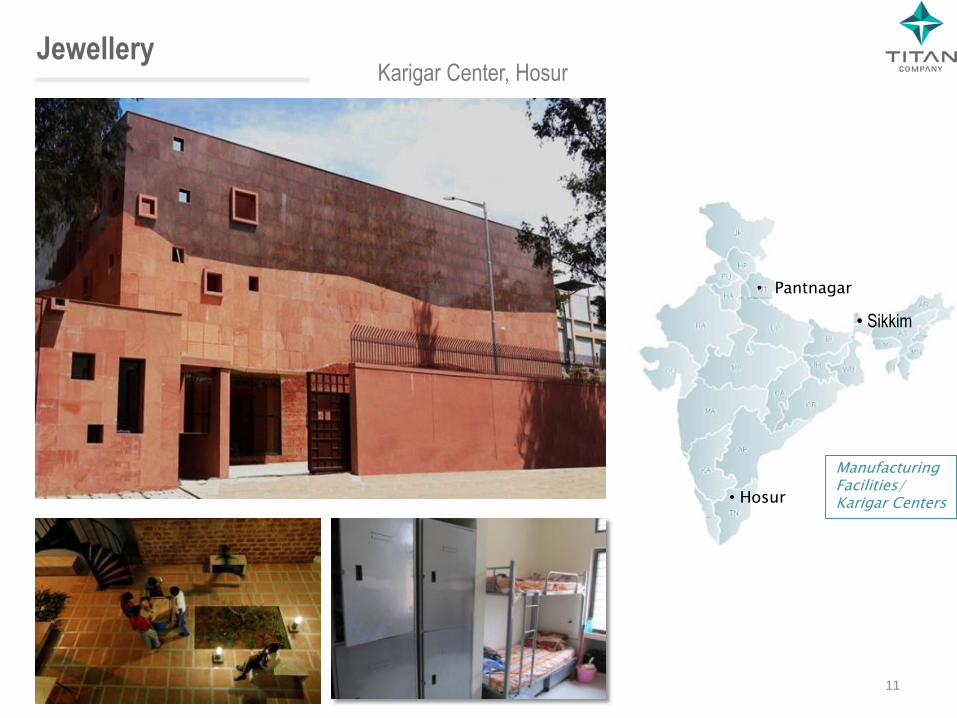
• Hosur
• Pantnagar
Manufacturing Facilities/Karigar Centers
Karigar Center, HosurJewellery
• Sikkim
11
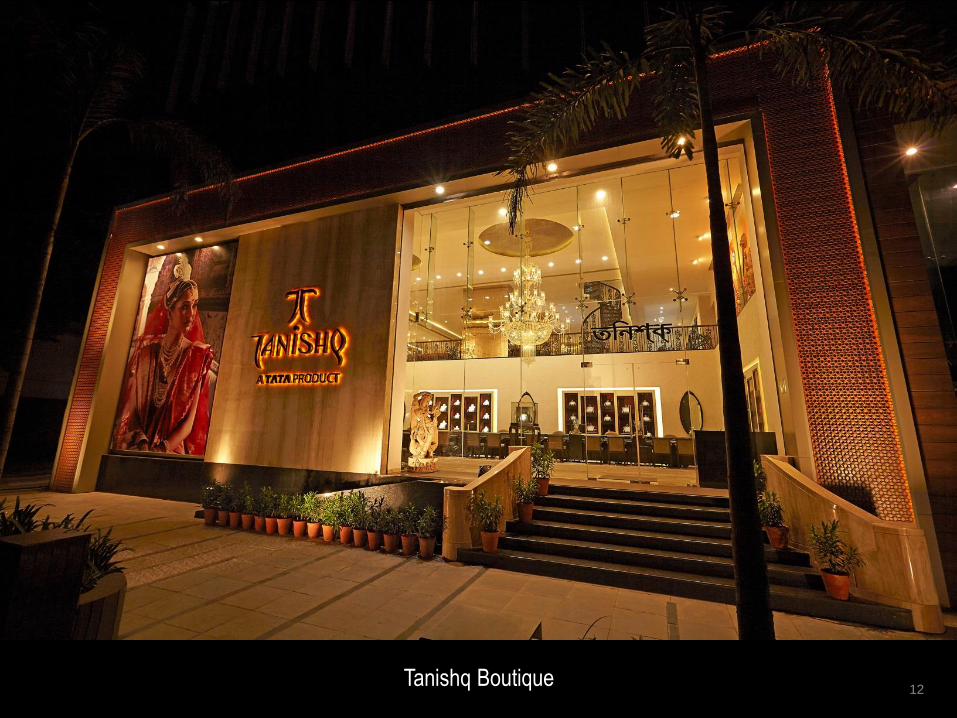
12Tanishq Boutique

13Zoya Boutique
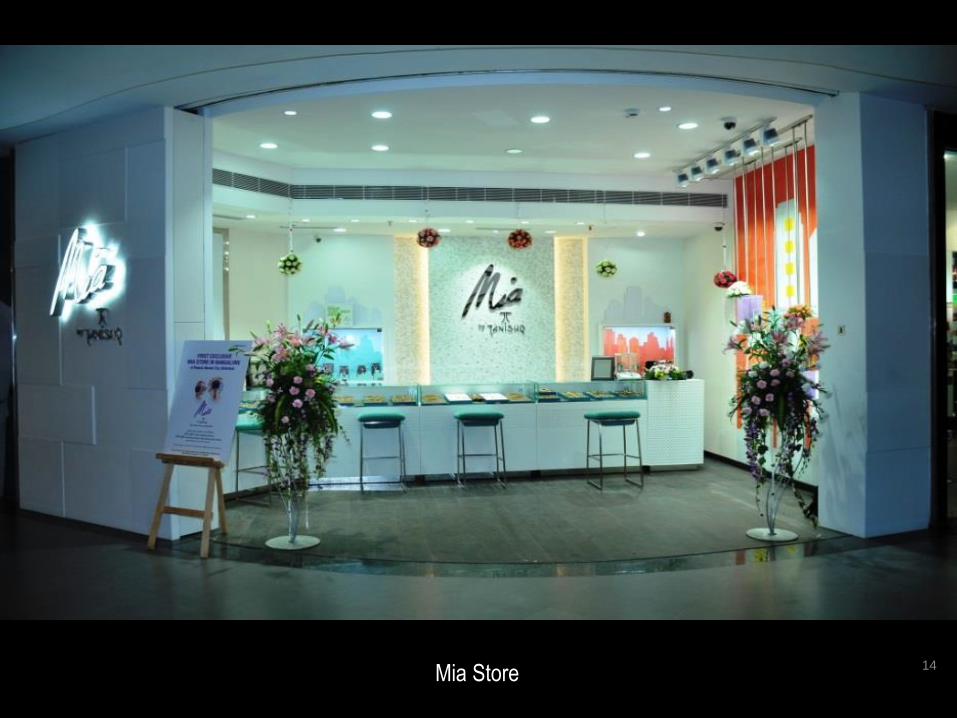
14Mia Store

15CaratLane Store

16

17
18

19
Watches Division

Watches - Overview
Brands6 major in-house brands & 7 licensed brands
Customer ServiceLargest network of exclusive service centers
653 watch care centers in 275 towns
Manufacturing6, state of the art, watch and component
manufacturing/assembly plants
Points of SaleEBO: World of Titan, Fastrack Stores
OWN MBO: Helios
MBO: present across 11k+ dealers/ MBOs
LFS: Large format departmental stores
ECOM: www.titan.co.in , www.fastrack.in,
www.sonatawatches.in, www.helioswatchstore.com
and market places
EXPORTS: 1,800 POS in 31 countries
Sophisticated Design & DevelopmentCore strength: Industrial, Retail and Graphic design
Numerous international award-winning designs
20
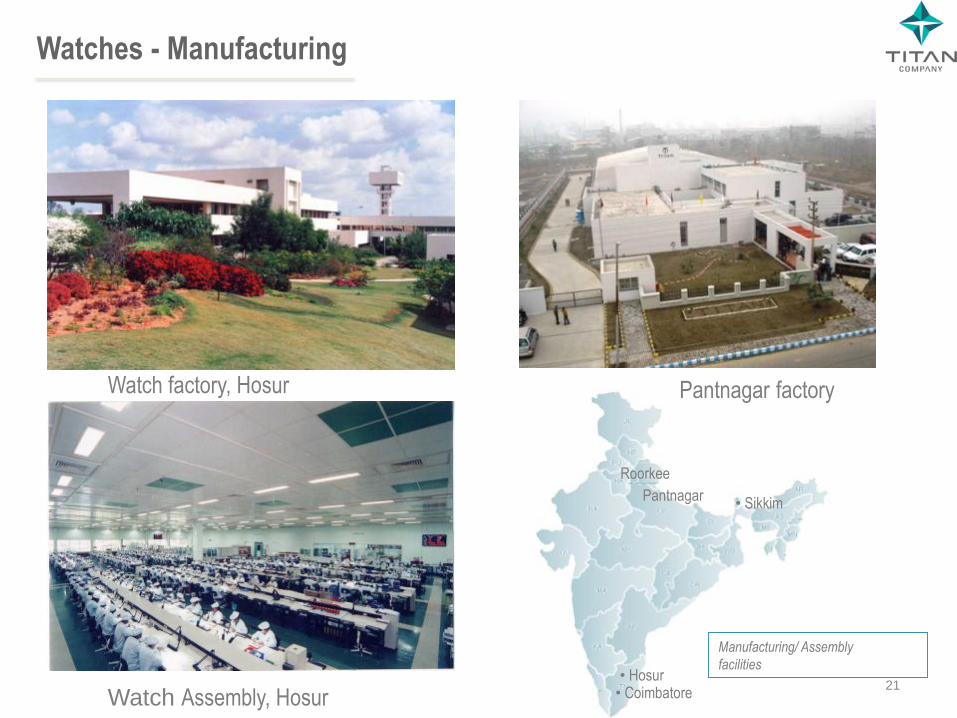
• Hosur
Pantnagar
Roorkee
Manufacturing/ Assembly
facilities
• Coimbatore
Watch factory, Hosur
Watch Assembly, Hosur
Pantnagar factory
Watches - Manufacturing
• Sikkim
21

22‘World of Titan’ Store

23Fastrack Store
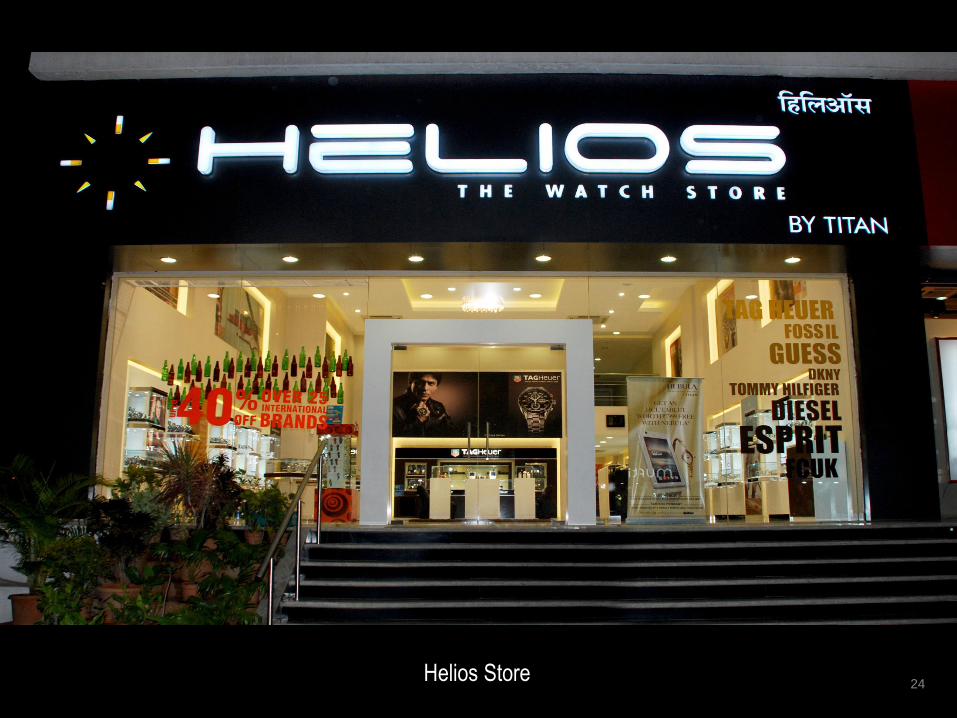
24Helios Store


29
Eyewear Division
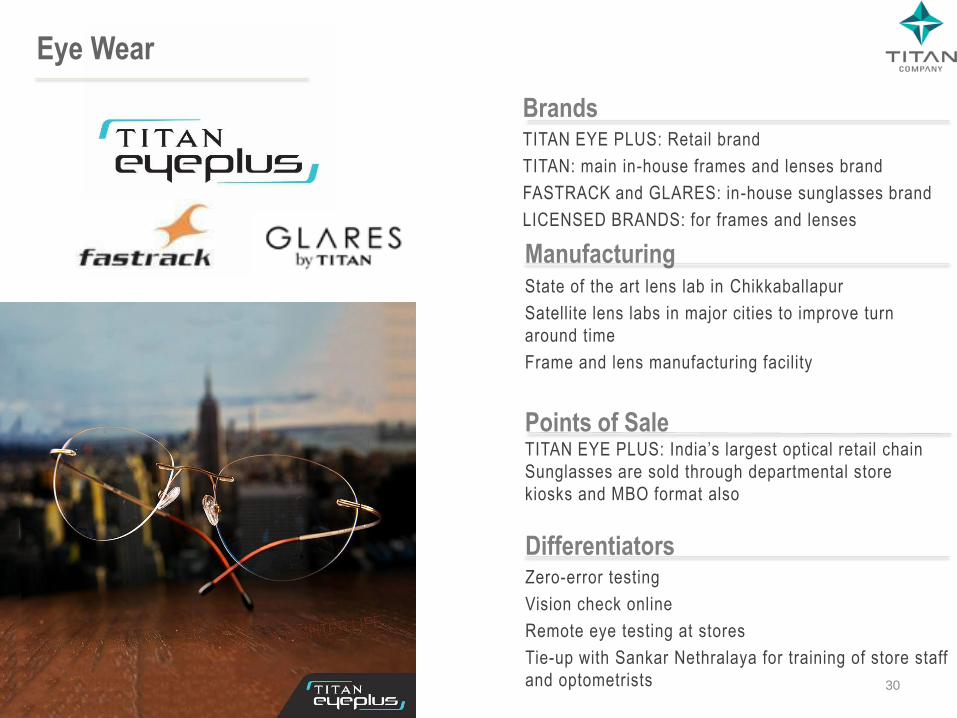
Eye Wear
BrandsTITAN EYE PLUS: Retail brand
TITAN: main in-house frames and lenses brand
FASTRACK and GLARES: in-house sunglasses brand
LICENSED BRANDS: for frames and lenses
ManufacturingState of the art lens lab in Chikkaballapur
Satellite lens labs in major cities to improve turn
around time
Frame and lens manufacturing facility
Points of SaleTITAN EYE PLUS: India’s largest optical retail chain
Sunglasses are sold through departmental store
kiosks and MBO format also
Differentiators Zero-error testing
Vision check online
Remote eye testing at stores
Tie-up with Sankar Nethralaya for training of store staff
and optometrists 30
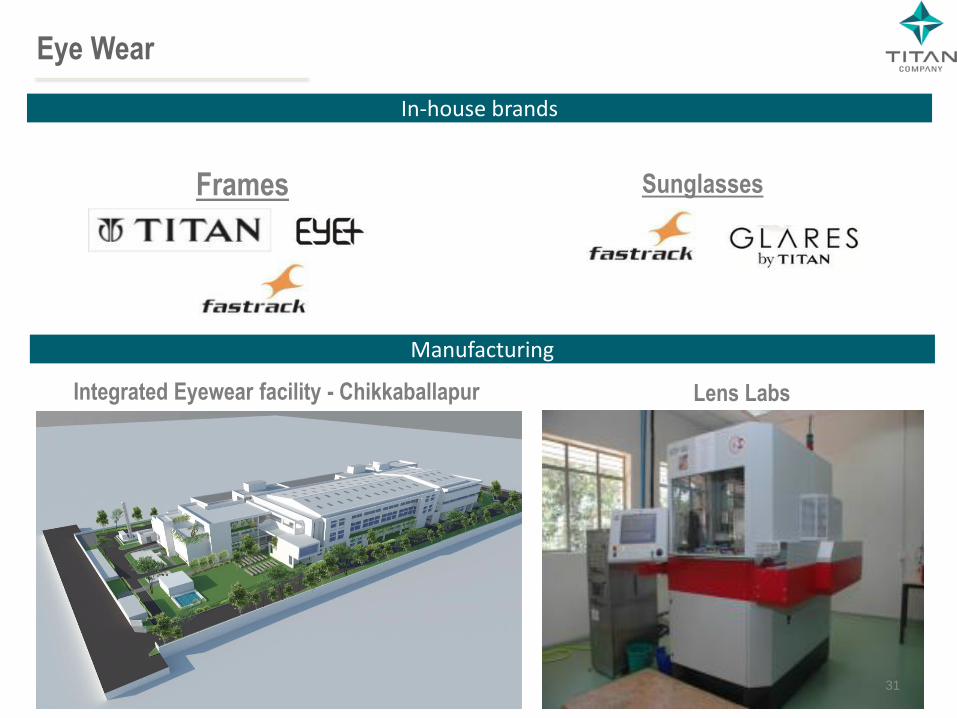
Frames Sunglasses
Lens Labs
Eye Wear
In-house brands
Manufacturing
Integrated Eyewear facility - Chikkaballapur
31
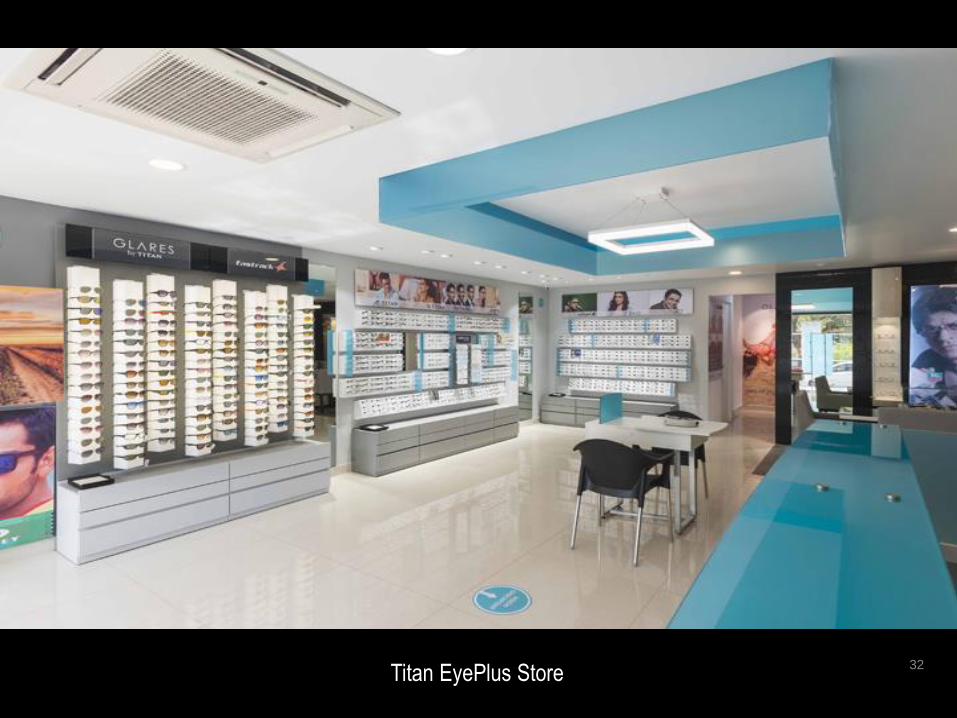
32Titan EyePlus Store

33

34SMART AUDIO SUNGLASS –Exclusively marketed by TITAN

35
Fragrances & Taneira
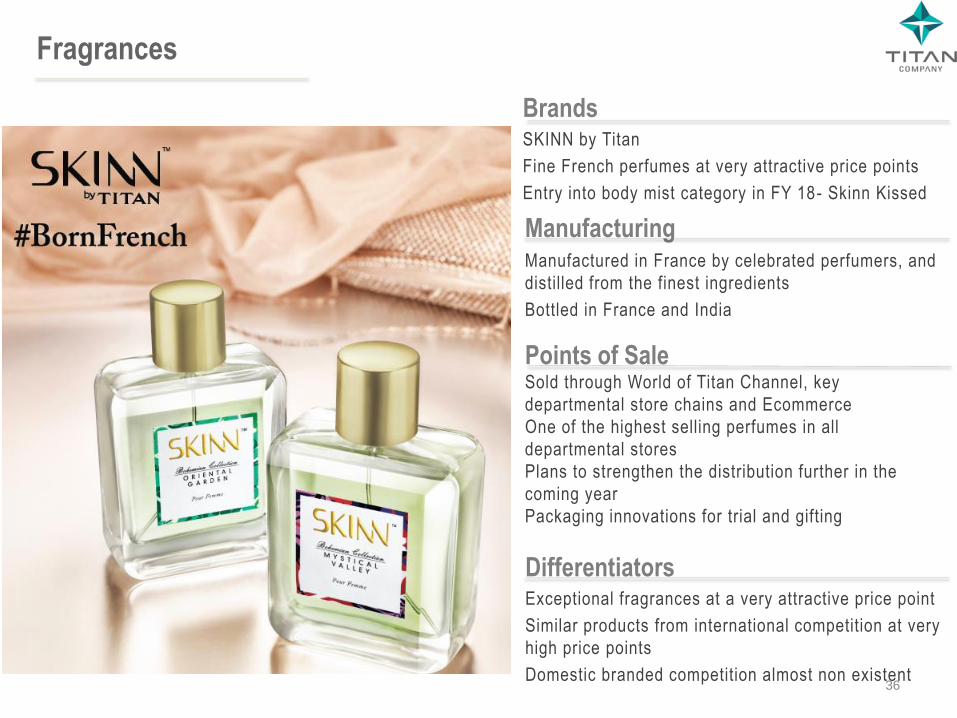
Fragrances
BrandsSKINN by Titan
Fine French perfumes at very attractive price points
Entry into body mist category in FY 18- Skinn Kissed
ManufacturingManufactured in France by celebrated perfumers, and
distilled from the finest ingredients
Bottled in France and India
Points of SaleSold through World of Titan Channel, key
departmental store chains and Ecommerce
One of the highest selling perfumes in all
departmental stores
Plans to strengthen the distribution further in the
coming year
Packaging innovations for trial and gifting
Differentiators Exceptional fragrances at a very attractive price point
Similar products from international competition at very
high price points
Domestic branded competition almost non existent36

37

Taneira
• This youngest brand of Titan Company Ltd was
launched as pilot in Feb 2017 with 2 stores in
Bangalore.
• Anchored in special occasion wear Sarees from
across India.
• Evolved as a natural extension of Titan’s
proposition – self expression and design.
• Large, unorganized, deeply Indian 5,000 year old
category (like Jewellery).
• 7 Stores as of 30th September’19.
38
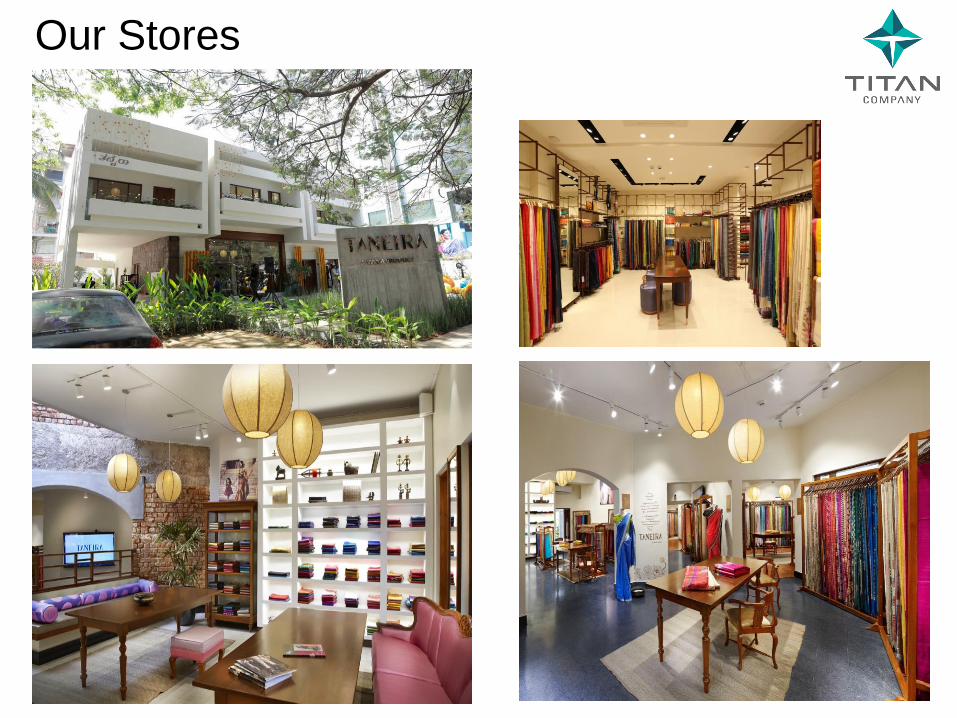
Our Stores
39
40
Q2 Performance
Q2 Performance – Standalone
Company
• Revenue for the company grew by only 0.6% in the quarter impacted substantially by the decline in therevenues of the jewellery division due to the sudden spike in gold prices in June 2019
• Flat top line and higher costs affect PBT growth and margin which, at 9.7%, was lower by 40bps YoY.Employee costs were much higher due to effect of wage settlement and higher provisions for leave payarising out of lower interest rates.
• The Company added 73 stores with a retail space of 103k square feet in YTD’20, on net basis.
• Mr. Bhaskar Bhat retired after serving the company since inception with the 17 years as its ManagingDirector. Mr. C K Venkatraman, who has been in the role of CEO of Jewellery business since 2005,succeeds him from 1st Oct. Mr. Bhaskar Bhat has been re-appointed as a Non-Executive Non-Independent Director on Board effective 1st Oct, 2019.
• The company increased its stake from 69.5% to 72.3%.in CaratLane by purchasing 9,45,000 equityshares from one of the shareholders of CaratLane.
41
Q2 Performance – Standalone
Jewellery
• Jewellery revenue declined by 1.5% in Q2. After a sudden surge in gold prices in mid-June, there was aconsiderable decline in sales in July. Higher level of promotion and schemes, led to strong growth in themonths of August and September.
• Retail growth of 7% in the quarter (based on customer billing) declined to 1.5% for reported revenueslargely due to gold hedge maturing during the quarter. Gold purchased before the price hike were hedgedand therefore even though customers were billed at the daily gold rates which were higher, the companyrecognised revenue on the hedged value of the gold. This alone contributed close to 4.8% of the decline.
• EBIT margin of Q2’20 was at 10.9%, same as in Q2’19.
• Studded ratio was at 38%, higher than the previous year at 35%.
• Tanishq launched Ahalya, a high-value diamond necklaces collection, inspired by the inner fire andradiance of a woman. In early October, ‘Virasat’ collection, inspired by the rich heritage and artistry of theroyal city of Udaipur, was launched in the plain gold category for the Diwali season.
• ‘Mia Classics’, a diamond intensive collection, ‘Smolitaires’ collection with designs of single stone fingerrings, and ‘Sassy Silver’ collection with mother-of-pearl & colour stones were launched during the quarterby Mia brand.
42

Q2 Performance – Standalone
Watches
• The division witnessed moderation in growth due to weak consumer sentiments leading to revenue growth of6.4% for the quarter and 12.9% for first half.
• The trend of Multi brand outlets (MBO) growing at much faster clip compared to exclusive brand outletscontinued. E-commerce sales also witnessed exceptionally strong growth during the quarter.
• EBIT margin was very healthy at 15.8% despite the moderation in growth.
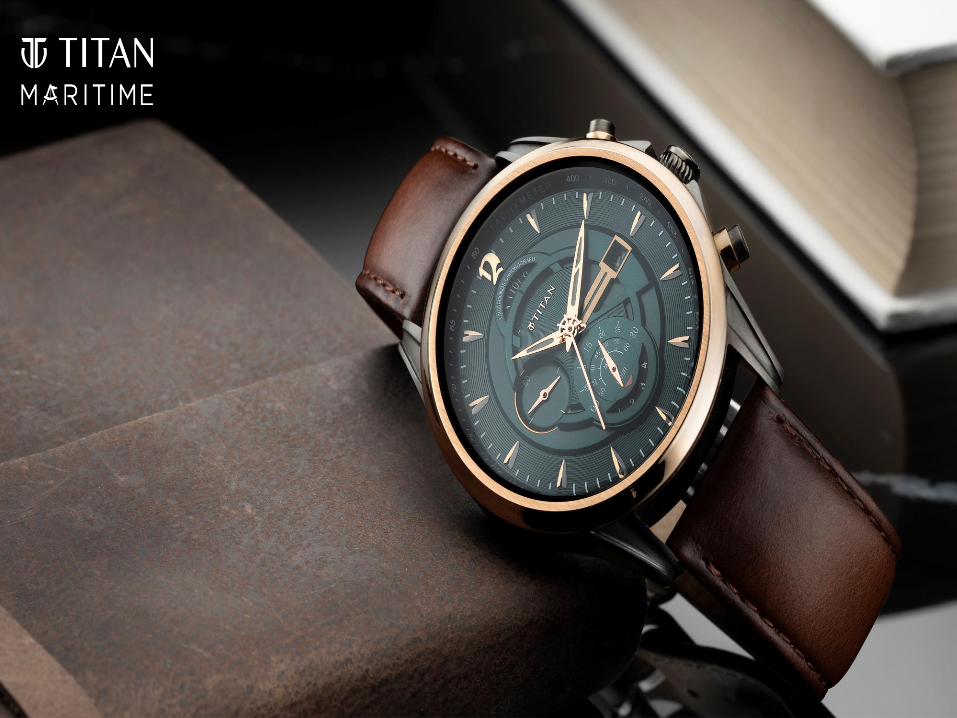
• ‘Titan Maritime’ collection was launched inspired by sea voyages during medieval era, better known as Age ofDiscovery. It is an amalgation of intricate craftsmanship and the best in movement technology.
Eye Wear
• Division had strong revenue growth of 29%. However margins were affected due to adverse mix and higherlevel of customer promotions.
• Ayushmann Khurrana, a popular Bollywood actor, has been roped in as the brand ambassador for the division.
Fragrances & Taneira
• Skinn continues to increase its distribution reach and witnessed good growth during the quarter. The brandopened a large new segment by launching premium deodorants which have been well received in the markets.
• ‘Taneira’ opened its third store in Bengaluru and its first store in Pune, taking the total store count for thebusiness to seven in four metros.
43
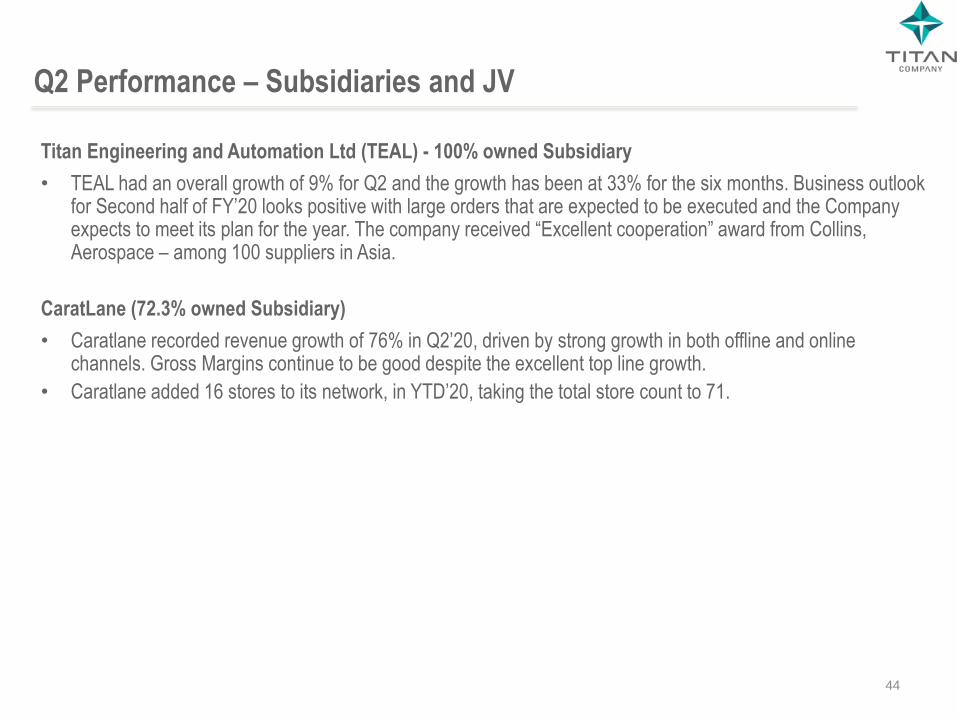
Q2 Performance – Subsidiaries and JV
Titan Engineering and Automation Ltd (TEAL) - 100% owned Subsidiary
• TEAL had an overall growth of 9% for Q2 and the growth has been at 33% for the six months. Business outlook for Second half of FY’20 looks positive with large orders that are expected to be executed and the Company expects to meet its plan for the year. The company received “Excellent cooperation” award from Collins, Aerospace – among 100 suppliers in Asia.
CaratLane (72.3% owned Subsidiary)
• Caratlane recorded revenue growth of 76% in Q2’20, driven by strong growth in both offline and online channels. Gross Margins continue to be good despite the excellent top line growth.
• Caratlane added 16 stores to its network, in YTD’20, taking the total store count to 71.
44
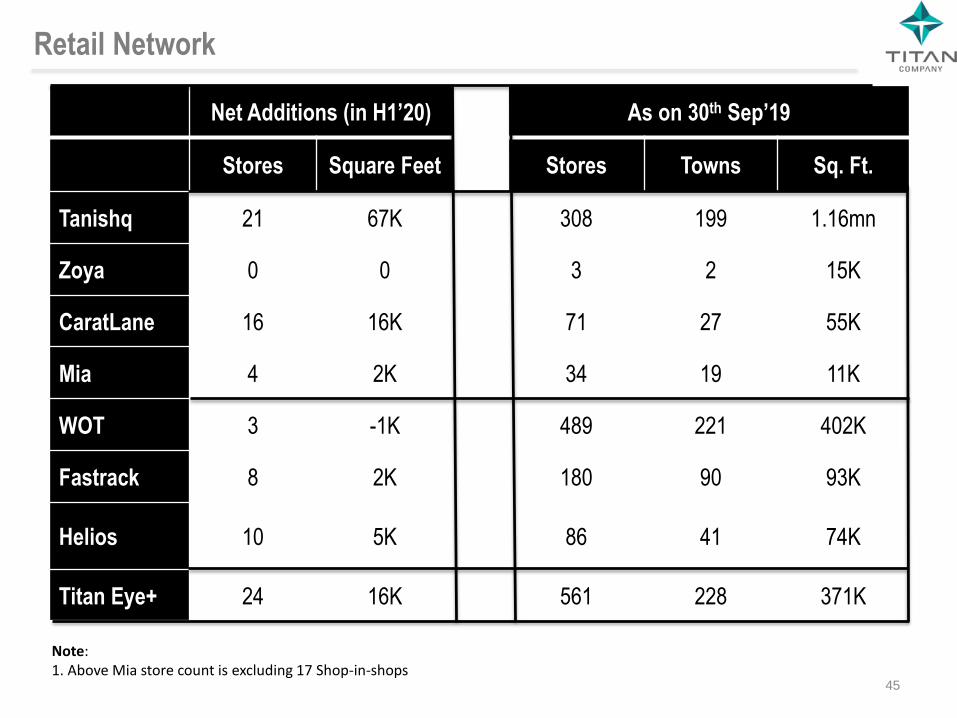
Net Additions (in H1’20) As on 30th Sep’19
Stores Square Feet Stores Towns Sq. Ft.
Tanishq 21 67K 308 199 1.16mn
Zoya 0 0 3 2 15K
CaratLane 16 16K 71 27 55K
Mia 4 2K 34 19 11K
WOT 3 -1K 489 221 402K
Fastrack 8 2K 180 90 93K
Helios 10 5K 86 41 74K
Titan Eye+ 24 16K 561 228 371K
Retail Network
45
Note:1. Above Mia store count is excluding 17 Shop-in-shops
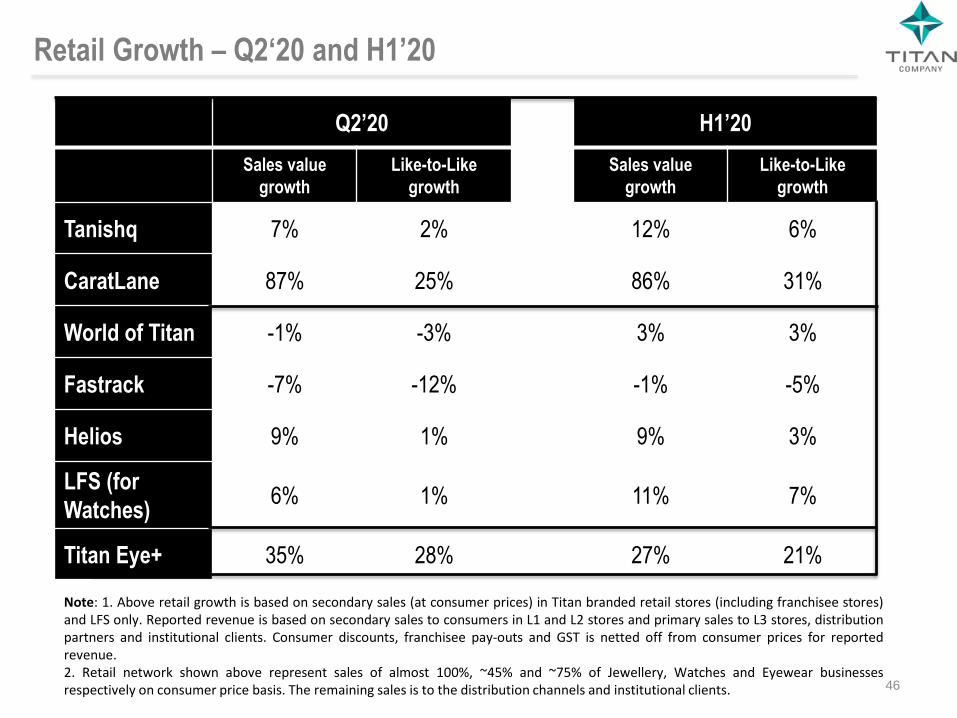
Q2’20 H1’20
Sales value
growth
Like-to-Like
growth
Sales value
growth
Like-to-Like
growth
Tanishq 7% 2% 12% 6%
CaratLane 87% 25% 86% 31%
World of Titan -1% -3% 3% 3%
Fastrack -7% -12% -1% -5%
Helios 9% 1% 9% 3%
LFS (for
Watches)6% 1% 11% 7%
Titan Eye+ 35% 28% 27% 21%
Retail Growth – Q2‘20 and H1’20
Note: 1. Above retail growth is based on secondary sales (at consumer prices) in Titan branded retail stores (including franchisee stores)and LFS only. Reported revenue is based on secondary sales to consumers in L1 and L2 stores and primary sales to L3 stores, distributionpartners and institutional clients. Consumer discounts, franchisee pay-outs and GST is netted off from consumer prices for reportedrevenue.2. Retail network shown above represent sales of almost 100%, ~45% and ~75% of Jewellery, Watches and Eyewear businessesrespectively on consumer price basis. The remaining sales is to the distribution channels and institutional clients. 46

47
Total Income – Q2’20 and H1’20
Note:1. Total Income also includes other income. 2. Others include Accessories, Fragrances and Taneira business 3. Others include TTPL (divested in June’18) and Favre Leuba.
Total Income (1)
(in INR Crores)Q2'19 Q2'20 Growth % H1'19 H1'20 Growth % Mix - H2'20
Jewellery 3,582 3,528 -2% 7,154 7,575 6% 80%
Watches 676 719 6% 1,269 1,433 13% 15%
Eyewear 120 154 29% 252 303 20% 3%
Others / Corporate (2) 56 65 16% 114 150 32% 2%
Standalone 4,434 4,466 1% 8,788 9,461 8% 100%
Caratlane 77 136 76% 161 268 67%
TEAL 96 104 9% 150 199 33%
Others/ Consol. Adj. (3) (11) (13) (16) (27)
Consolidated 4,595 4,693 2% 9,082 9,902 9%

48
EBIT – Q1’20 and H1’20
Note: 1. Others include Accessories, Fragrances and Taneira business 2. Others include TTPL (divested in June’18) and Favre Leuba.3. Provisions for investments in IL&FS group (Q2’19 & H1’19: INR 29 cr.) is part of Corporate expense.
EBIT (in INR Crores) Q2'19 Q2'20 Growth % H1'19 H1'20 Growth %
Jewellery 392 384 -2% 785 826 5%
Watches 122 113 -7% 233 241 3%
Eyewear (1) 2 1 (9)
Others/ Corporate (1) (3) (56) (29) (67) (34)
Standalone 456 470 3% 952 1,023 7%
Caratlane (13) (4) (21) (10)
TEAL 21 16 23 31
Others/ Consol. Adj. (2) (13) (13) (24) (21)
Consolidated 452 469 4% 930 1,023 10%
EBIT Margin Q2'19 Q2'20 H1'19 H1'20Jewellery 10.9% 10.9% 11.0% 10.9%
Watches 18.0% 15.8% 18.4% 16.8%
Eyewear -0.8% 1.3% 0.3% -3.1%
Standalone 10.3% 10.5% 10.8% 10.8%
Consolidated 9.8% 10.0% 10.2% 10.3%
49
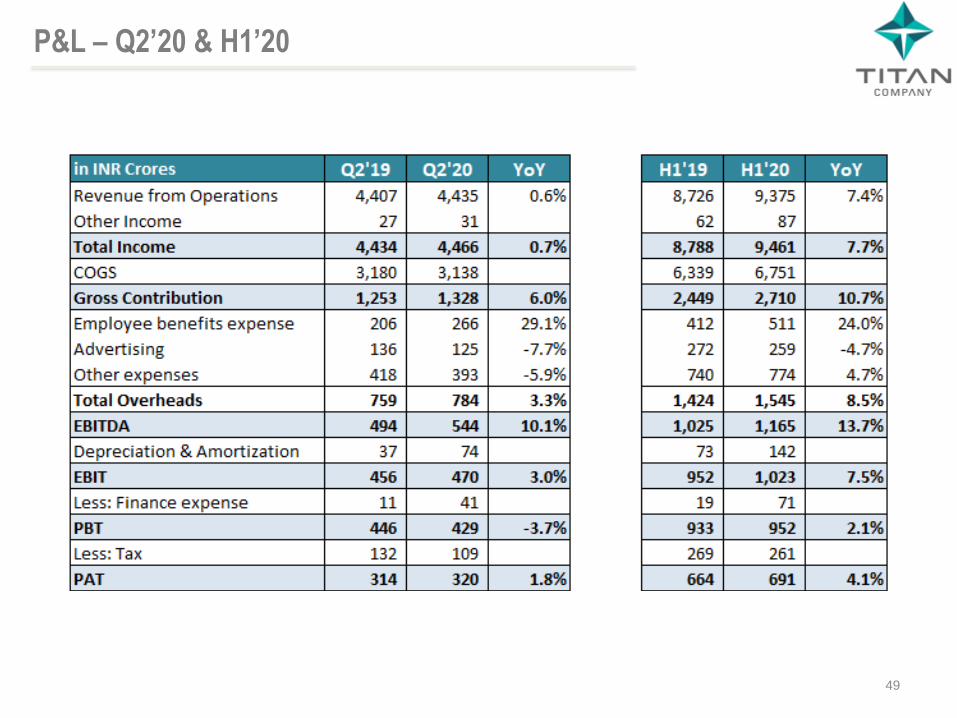
P&L – Q2’20 & H1’20

50
Capital Employed - Standalone
Note: 1. Others include Accessories, Fragrances and Taneira.
in INR Crores
31-Mar-19 30-Sep-19 31-Mar-19 30-Sep-19 31-Mar-19 30-Sep-19
Watches 1,502 2,130 453 794 1,049 1,336
Jewellery 6,742 9,236 4,570 5,541 2,172 3,695
Eyewear 394 490 127 236 267 254
Others 107 190 25 83 81 107
Corporate 2,725 2,058 112 1,227 2,613 830
Total 11,470 14,104 5,288 7,881 6,182 6,222
Segment Assets Segment Liabilities Capital Employed
51
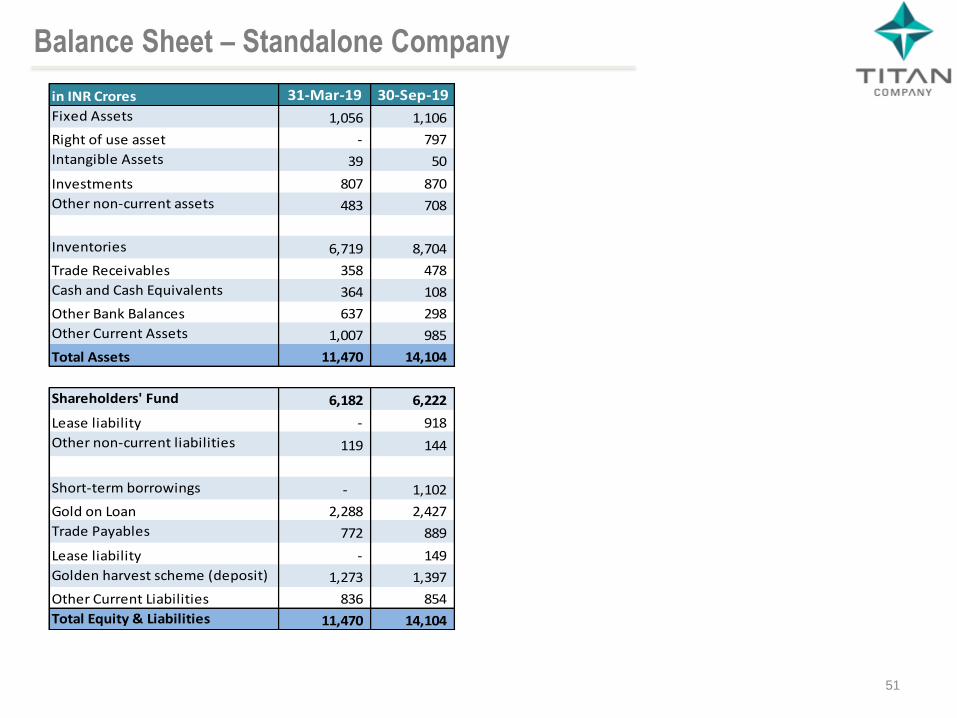
Balance Sheet – Standalone Company
in INR Crores 31-Mar-19 30-Sep-19
Fixed Assets 1,056 1,106
Right of use asset - 797
Intangible Assets 39 50
Investments 807 870
Other non-current assets 483 708
Inventories 6,719 8,704
Trade Receivables 358 478
Cash and Cash Equivalents 364 108
Other Bank Balances 637 298
Other Current Assets 1,007 985
Total Assets 11,470 14,104
Shareholders' Fund 6,182 6,222
Lease liability - 918
Other non-current liabilities 119 144
Short-term borrowings - 1,102
Gold on Loan 2,288 2,427
Trade Payables 772 889
Lease liability - 149
Golden harvest scheme (deposit) 1,273 1,397
Other Current Liabilities 836 854
Total Equity & Liabilities 11,470 14,104
52
Performance Trends
53
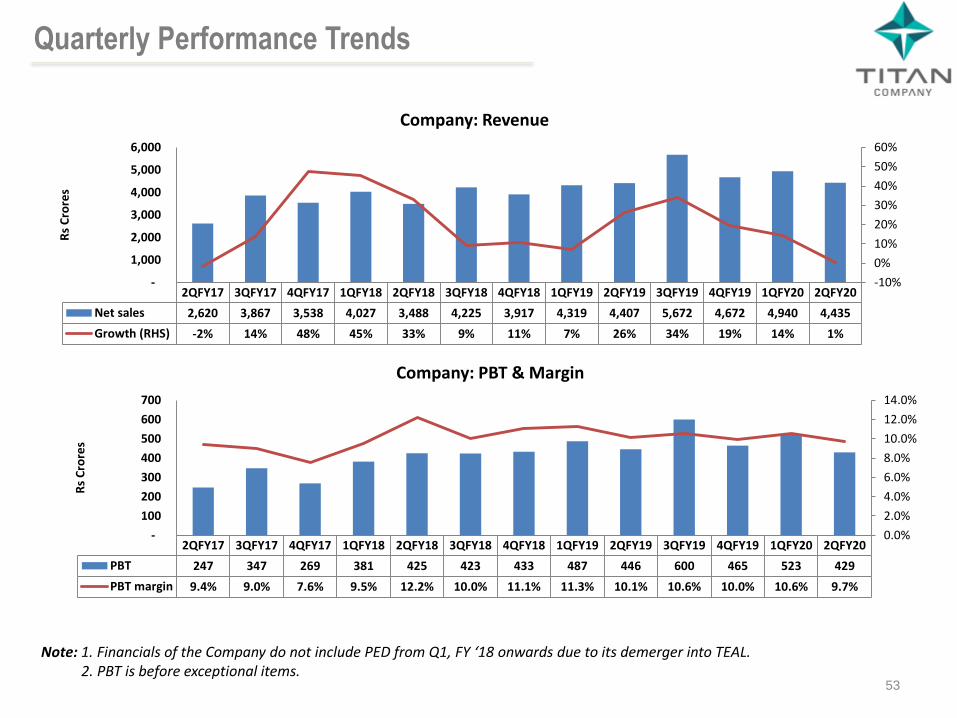
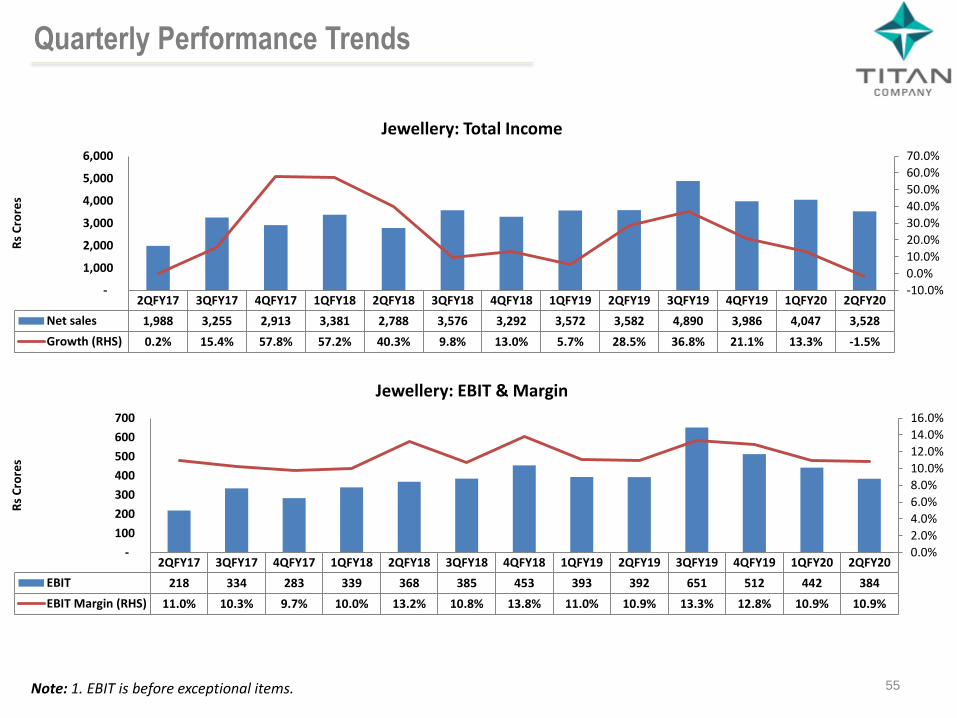
Quarterly Performance Trends
Note: 1. Financials of the Company do not include PED from Q1, FY ‘18 onwards due to its demerger into TEAL.2. PBT is before exceptional items.
2QFY17 3QFY17 4QFY17 1QFY18 2QFY18 3QFY18 4QFY18 1QFY19 2QFY19 3QFY19 4QFY19 1QFY20 2QFY20
Net sales 2,620 3,867 3,538 4,027 3,488 4,225 3,917 4,319 4,407 5,672 4,672 4,940 4,435
Growth (RHS) -2% 14% 48% 45% 33% 9% 11% 7% 26% 34% 19% 14% 1%
-10%
0%
10%
20%
30%
40%
50%
60%
-
1,000
2,000
3,000
4,000
5,000
6,000
Rs
Cro
res
Company: Revenue
2QFY17 3QFY17 4QFY17 1QFY18 2QFY18 3QFY18 4QFY18 1QFY19 2QFY19 3QFY19 4QFY19 1QFY20 2QFY20
PBT 247 347 269 381 425 423 433 487 446 600 465 523 429
PBT margin 9.4% 9.0% 7.6% 9.5% 12.2% 10.0% 11.1% 11.3% 10.1% 10.6% 10.0% 10.6% 9.7%
0.0%
2.0%
4.0%
6.0%
8.0%
10.0%
12.0%
14.0%
-
100
200
300
400
500
600
700
Rs
Cro
res
Company: PBT & Margin
54
Quarterly Performance Trends
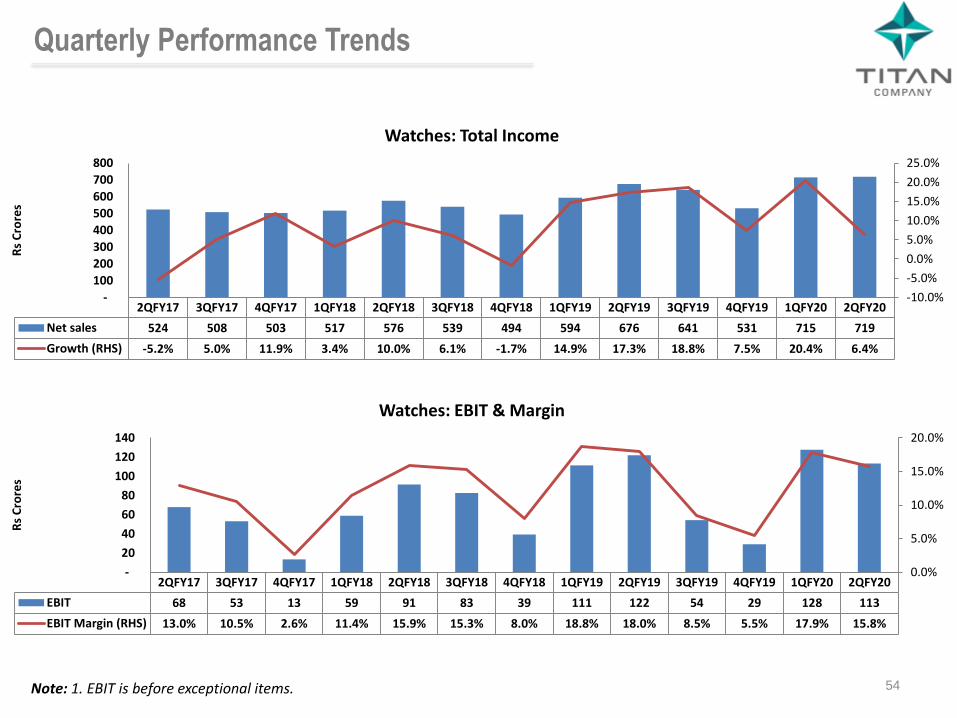
Note: 1. EBIT is before exceptional items.
2QFY17 3QFY17 4QFY17 1QFY18 2QFY18 3QFY18 4QFY18 1QFY19 2QFY19 3QFY19 4QFY19 1QFY20 2QFY20
Net sales 524 508 503 517 576 539 494 594 676 641 531 715 719
Growth (RHS) -5.2% 5.0% 11.9% 3.4% 10.0% 6.1% -1.7% 14.9% 17.3% 18.8% 7.5% 20.4% 6.4%
-10.0%
-5.0%
0.0%
5.0%
10.0%
15.0%
20.0%
25.0%
-
100
200
300
400
500
600
700
800
Rs
Cro
res
Watches: Total Income
2QFY17 3QFY17 4QFY17 1QFY18 2QFY18 3QFY18 4QFY18 1QFY19 2QFY19 3QFY19 4QFY19 1QFY20 2QFY20
EBIT 68 53 13 59 91 83 39 111 122 54 29 128 113
EBIT Margin (RHS) 13.0% 10.5% 2.6% 11.4% 15.9% 15.3% 8.0% 18.8% 18.0% 8.5% 5.5% 17.9% 15.8%
0.0%
5.0%
10.0%
15.0%
20.0%
-
20
40
60
80
100
120
140
Rs
Cro
res
Watches: EBIT & Margin
55
Quarterly Performance Trends
Note: 1. EBIT is before exceptional items.
2QFY17 3QFY17 4QFY17 1QFY18 2QFY18 3QFY18 4QFY18 1QFY19 2QFY19 3QFY19 4QFY19 1QFY20 2QFY20
Net sales 1,988 3,255 2,913 3,381 2,788 3,576 3,292 3,572 3,582 4,890 3,986 4,047 3,528
Growth (RHS) 0.2% 15.4% 57.8% 57.2% 40.3% 9.8% 13.0% 5.7% 28.5% 36.8% 21.1% 13.3% -1.5%
-10.0%
0.0%
10.0%
20.0%
30.0%
40.0%
50.0%
60.0%
70.0%
-
1,000
2,000
3,000
4,000
5,000
6,000
Rs
Cro
res
Jewellery: Total Income
2QFY17 3QFY17 4QFY17 1QFY18 2QFY18 3QFY18 4QFY18 1QFY19 2QFY19 3QFY19 4QFY19 1QFY20 2QFY20
EBIT 218 334 283 339 368 385 453 393 392 651 512 442 384
EBIT Margin (RHS) 11.0% 10.3% 9.7% 10.0% 13.2% 10.8% 13.8% 11.0% 10.9% 13.3% 12.8% 10.9% 10.9%
0.0%
2.0%
4.0%
6.0%
8.0%
10.0%
12.0%
14.0%
16.0%
-
100
200
300
400
500
600
700
Rs
Cro
res
Jewellery: EBIT & Margin

56
Quarterly Performance Trends
2QFY17 3QFY17 4QFY17 1QFY18 2QFY18 3QFY18 4QFY18 1QFY19 2QFY19 3QFY19 4QFY19 1QFY20 2QFY20
Volume Growth -9% 4% 10% 5% 9% 11% -1% 10% 21% 16% 0% 13% -1%
-15%
-10%
-5%
0%
5%
10%
15%
20%
25%
Gro
wth
(%
)
Watches: Volume growth
2QFY17 3QFY17 4QFY17 1QFY18 2QFY18 3QFY18 4QFY18 1QFY19 2QFY19 3QFY19 4QFY19 1QFY20 2QFY20
Gold price (LHS) 2,964 2791 2773 2790 2,777 2,798 2,903 2,968 2,896 3,022 3,102 3,084 3,529
Grammage growth -32% 4% 37% 49% 49% 6% 6% -3% 24% 20% 15% 6% -14%
-40%
-30%
-20%
-10%
0%
10%
20%
30%
40%
50%
60%
-
500
1,000
1,500
2,000
2,500
3,000
3,500
4,000
Gra
mm
age
Gro
wth
(%
)
Jewellery: Gold price (22kt) and Grammage growth

CAGR: 12.5%
CAGR: 14%
CAGR: 6%
Annual Performance Trends - Standalone
57
11,903 11,105
12,999
15,656
19,070
0
5,000
10,000
15,000
20,000
25,000
2014-15 2015-16 2016-17 2017-18 2018-19
(Rs
Cro
res)
Income from operations (net)
1,921 1,974 2,053 2,126
2,441
0
500
1,000
1,500
2,000
2,500
3,000
2014-15 2015-16 2016-17 2017-18 2018-19
(Rs
Cro
res)
Watches: Net Income
9,421 8,723
10,485
13,036
16,030
0
2,000
4,000
6,000
8,000
10,000
12,000
14,000
16,000
18,000
2014-15 2015-16 2016-17 2017-18 2018-19
(Rs
Cro
res)
Jewellery: Net Income
823
698 762
1,163
1,374
0
200
400
600
800
1,000
1,200
1,400
1,600
2014-15 2015-16 2016-17 2017-18 2018-19
(Rs
Cro
res)
PATCAGR: 14%CAGR:
17%
CAGR: 11%
CAGR: 18%
Annual Performance Trends - Standalone
Note: 1. EBIT and PBT is before exceptional items.2. PAT is after exceptional item of INR 70 cr., INR 92 cr and INR 96 cr. for FY’19, FY’18 and FY’17 respectively.
58
1,056 888
1,130
1,662
1,997
0
500
1,000
1,500
2,000
2,500
2014-15 2015-16 2016-17 2017-18 2018-19
(Rs
Cro
res)
PBT
206
171
204
272
316
0
50
100
150
200
250
300
350
2014-15 2015-16 2016-17 2017-18 2018-19
(Rs
Cro
res)
Watches: EBIT
991 800
1,053
1,546
1,948
0
500
1,000
1,500
2,000
2,500
2014-15 2015-16 2016-17 2017-18 2018-19
(Rs
Cro
res)
Jewellery: EBIT
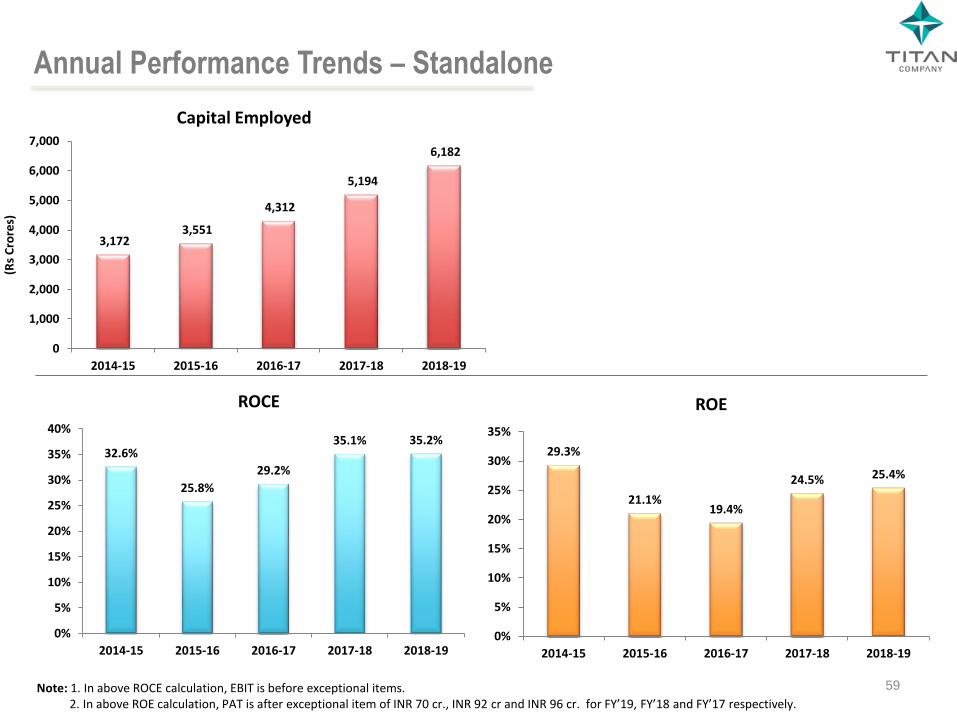
Annual Performance Trends – Standalone
Note: 1. In above ROCE calculation, EBIT is before exceptional items.2. In above ROE calculation, PAT is after exceptional item of INR 70 cr., INR 92 cr and INR 96 cr. for FY’19, FY’18 and FY’17 respectively.
59
29.3%
21.1%19.4%
24.5% 25.4%
0%
5%
10%
15%
20%
25%
30%
35%
2014-15 2015-16 2016-17 2017-18 2018-19
ROE
3,172 3,551
4,312
5,194
6,182
0
1,000
2,000
3,000
4,000
5,000
6,000
7,000
2014-15 2015-16 2016-17 2017-18 2018-19
(Rs
Cro
res)
Capital Employed
32.6%
25.8%
29.2%
35.1% 35.2%
0%
5%
10%
15%
20%
25%
30%
35%
40%
2014-15 2015-16 2016-17 2017-18 2018-19
ROCE
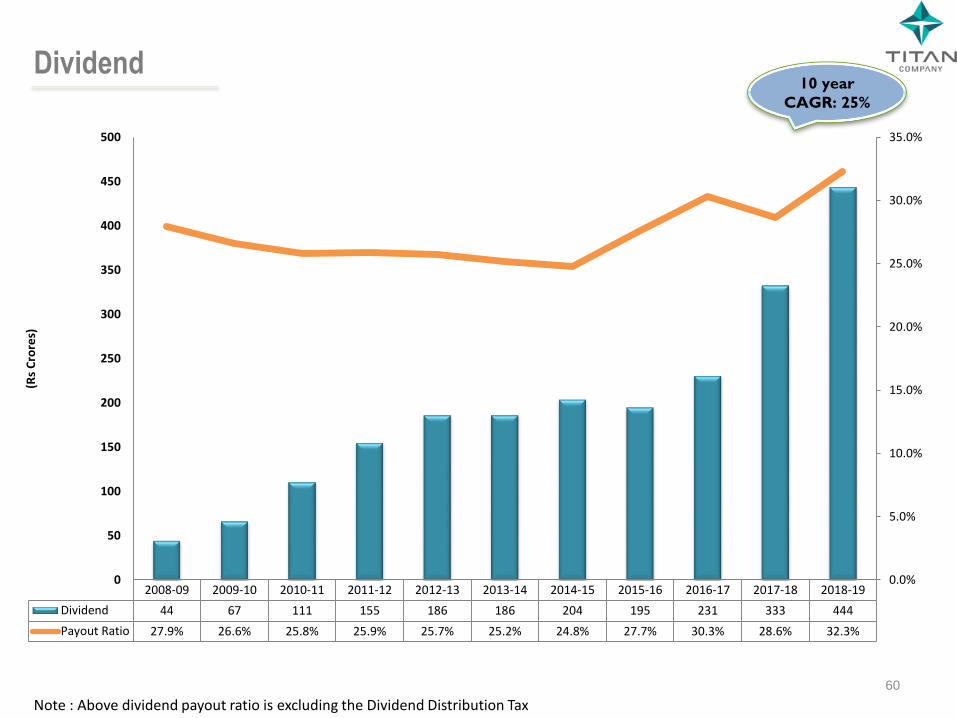
Dividend10 year
CAGR: 25%
60
2008-09 2009-10 2010-11 2011-12 2012-13 2013-14 2014-15 2015-16 2016-17 2017-18 2018-19
Dividend 44 67 111 155 186 186 204 195 231 333 444
Payout Ratio 27.9% 26.6% 25.8% 25.9% 25.7% 25.2% 24.8% 27.7% 30.3% 28.6% 32.3%
0.0%
5.0%
10.0%
15.0%
20.0%
25.0%
30.0%
35.0%
0
50
100
150
200
250
300
350
400
450
500
(Rs
Cro
res)
Note : Above dividend payout ratio is excluding the Dividend Distribution Tax

8,172
16,916 20,295
22,772 23,300
34,801
30,078
41,082
83,656
1,01,372
1,13,020
0
20,000
40,000
60,000
80,000
1,00,000
1,20,000
2009-10 2010-11 2011-12 2012-13 2013-14 2014-15 2015-16 2016-17 2017-18 2018-19 30th Sep2019
(Rs
Cro
res)
10 year
CAGR: 40%
Note: Based on NSE closing prices at the end of the period
Market Capitalisation
Stock Performance Vs Sensex (last 6 months)
Titan Sensex
61
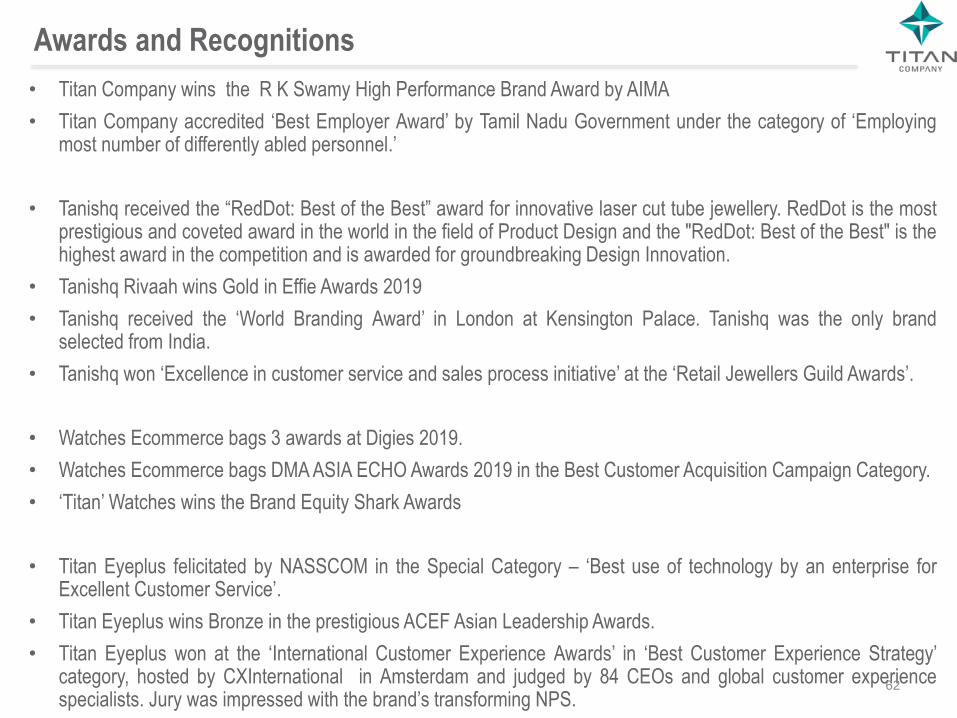
Awards and Recognitions
• Titan Company wins the R K Swamy High Performance Brand Award by AIMA
• Titan Company accredited ‘Best Employer Award’ by Tamil Nadu Government under the category of ‘Employingmost number of differently abled personnel.’
• Tanishq received the “RedDot: Best of the Best” award for innovative laser cut tube jewellery. RedDot is the mostprestigious and coveted award in the world in the field of Product Design and the "RedDot: Best of the Best" is thehighest award in the competition and is awarded for groundbreaking Design Innovation.
• Tanishq Rivaah wins Gold in Effie Awards 2019
• Tanishq received the ‘World Branding Award’ in London at Kensington Palace. Tanishq was the only brandselected from India.
• Tanishq won ‘Excellence in customer service and sales process initiative’ at the ‘Retail Jewellers Guild Awards’.
• Watches Ecommerce bags 3 awards at Digies 2019.
• Watches Ecommerce bags DMA ASIA ECHO Awards 2019 in the Best Customer Acquisition Campaign Category.
• ‘Titan’ Watches wins the Brand Equity Shark Awards
• Titan Eyeplus felicitated by NASSCOM in the Special Category – ‘Best use of technology by an enterprise forExcellent Customer Service’.
• Titan Eyeplus wins Bronze in the prestigious ACEF Asian Leadership Awards.
• Titan Eyeplus won at the ‘International Customer Experience Awards’ in ‘Best Customer Experience Strategy’category, hosted by CXInternational in Amsterdam and judged by 84 CEOs and global customer experiencespecialists. Jury was impressed with the brand’s transforming NPS.
62
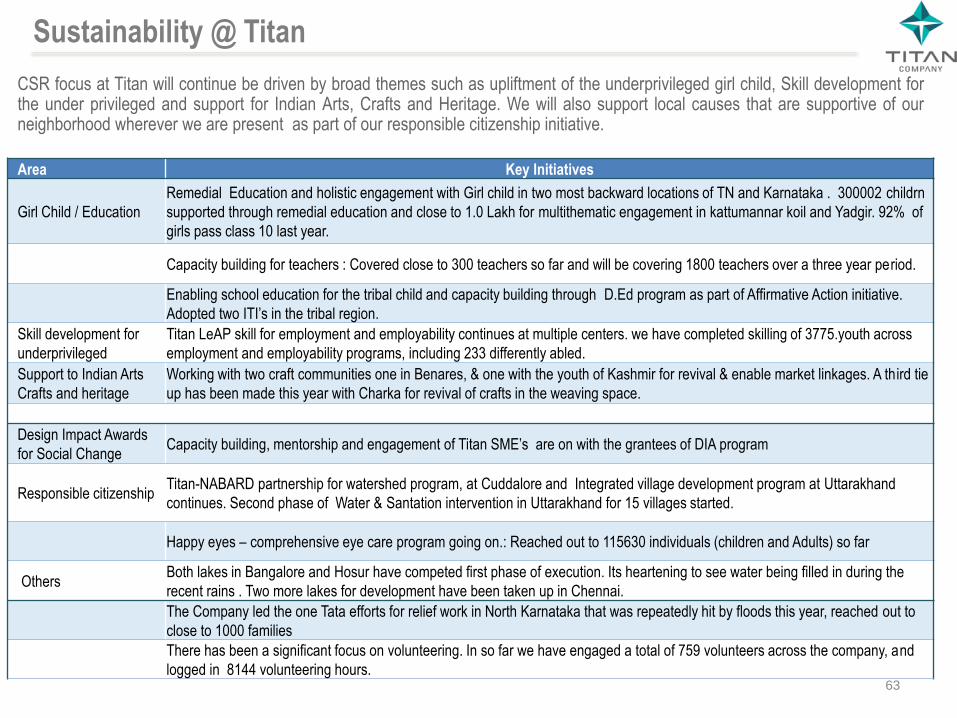
Sustainability @ Titan
CSR focus at Titan will continue be driven by broad themes such as upliftment of the underprivileged girl child, Skill development forthe under privileged and support for Indian Arts, Crafts and Heritage. We will also support local causes that are supportive of ourneighborhood wherever we are present as part of our responsible citizenship initiative.
63
Area Key Initiatives
Girl Child / Education
Remedial Education and holistic engagement with Girl child in two most backward locations of TN and Karnataka . 300002 childrn
supported through remedial education and close to 1.0 Lakh for multithematic engagement in kattumannar koil and Yadgir. 92% of
girls pass class 10 last year.
Capacity building for teachers : Covered close to 300 teachers so far and will be covering 1800 teachers over a three year period.
Enabling school education for the tribal child and capacity building through D.Ed program as part of Affirmative Action initiative.
Adopted two ITI’s in the tribal region.
Skill development for
underprivileged
Titan LeAP skill for employment and employability continues at multiple centers. we have completed skilling of 3775.youth across
employment and employability programs, including 233 differently abled.
Support to Indian Arts
Crafts and heritage
Working with two craft communities one in Benares, & one with the youth of Kashmir for revival & enable market linkages. A third tie
up has been made this year with Charka for revival of crafts in the weaving space.
Design Impact Awards
for Social ChangeCapacity building, mentorship and engagement of Titan SME’s are on with the grantees of DIA program
Responsible citizenshipTitan-NABARD partnership for watershed program, at Cuddalore and Integrated village development program at Uttarakhand
continues. Second phase of Water & Santation intervention in Uttarakhand for 15 villages started.
Happy eyes – comprehensive eye care program going on.: Reached out to 115630 individuals (children and Adults) so far
OthersBoth lakes in Bangalore and Hosur have competed first phase of execution. Its heartening to see water being filled in during the
recent rains . Two more lakes for development have been taken up in Chennai.
The Company led the one Tata efforts for relief work in North Karnataka that was repeatedly hit by floods this year, reached out to
close to 1000 families
There has been a significant focus on volunteering. In so far we have engaged a total of 759 volunteers across the company, and
logged in 8144 volunteering hours.

Thank You